Evaluation of Bioassays and Wastewater Quality ... - Oekotoxzentrum
Evaluation of Bioassays and Wastewater Quality ... - Oekotoxzentrum
Evaluation of Bioassays and Wastewater Quality ... - Oekotoxzentrum

Create successful ePaper yourself
Turn your PDF publications into a flip-book with our unique Google optimized e-Paper software.
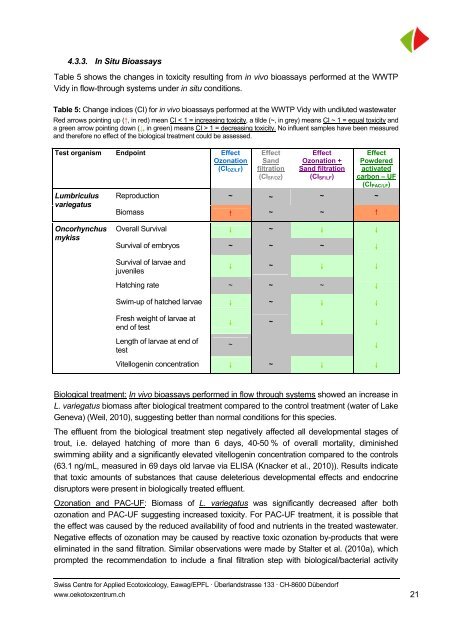
4.3.3. In Situ <strong>Bioassays</strong><br />
Table 5 shows the changes in toxicity resulting from in vivo bioassays performed at the WWTP<br />
Vidy in flow-through systems under in situ conditions.<br />
Table 5: Change indices (CI) for in vivo bioassays performed at the WWTP Vidy with undiluted wastewater<br />
Red arrows pointing up (↑, in red) mean CI < 1 = increasing toxicity, a tilde (~, in grey) means CI ~ 1 = equal toxicity <strong>and</strong><br />
a green arrow pointing down (↓, in green) means CI > 1 = decreasing toxicity. No influent samples have been measured<br />
<strong>and</strong> therefore no effect <strong>of</strong> the biological treatment could be assessed.<br />
Test organism Endpoint Effect<br />
Ozonation<br />
(CIOZ/LF)<br />
Lumbriculus<br />
variegatus<br />
Oncorhynchus<br />
mykiss<br />
Effect<br />
S<strong>and</strong><br />
filtration<br />
(CISF/OZ)<br />
Effect<br />
Ozonation +<br />
S<strong>and</strong> filtration<br />
(CISF/LF)<br />
Swiss Centre for Applied Ecotoxicology, Eawag/EPFL · Überl<strong>and</strong>strasse 133 · CH-8600 Dübendorf<br />
www.oekotoxzentrum.ch<br />
Effect<br />
Powdered<br />
activated<br />
carbon – UF<br />
(CIPAC/LF)<br />
Reproduction ~ ~ ~ ~<br />
Biomass ↑ ~ ~ ↑<br />
Overall Survival ↓ ~ ↓ ↓<br />
Survival <strong>of</strong> embryos ~ ~ ~ ↓<br />
Survival <strong>of</strong> larvae <strong>and</strong><br />
juveniles<br />
↓ ~ ↓ ↓<br />
Hatching rate ~ ~ ~ ↓<br />
Swim-up <strong>of</strong> hatched larvae ↓ ~ ↓ ↓<br />
Fresh weight <strong>of</strong> larvae at<br />
end <strong>of</strong> test<br />
Length <strong>of</strong> larvae at end <strong>of</strong><br />
test<br />
↓ ~ ↓ ↓<br />
~ ↓<br />
Vitellogenin concentration ↓ ~ ↓ ↓<br />
Biological treatment: In vivo bioassays performed in flow through systems showed an increase in<br />
L. variegatus biomass after biological treatment compared to the control treatment (water <strong>of</strong> Lake<br />
Geneva) (Weil, 2010), suggesting better than normal conditions for this species.<br />
The effluent from the biological treatment step negatively affected all developmental stages <strong>of</strong><br />
trout, i.e. delayed hatching <strong>of</strong> more than 6 days, 40-50 % <strong>of</strong> overall mortality, diminished<br />
swimming ability <strong>and</strong> a significantly elevated vitellogenin concentration compared to the controls<br />
(63.1 ng/mL, measured in 69 days old larvae via ELISA (Knacker et al., 2010)). Results indicate<br />
that toxic amounts <strong>of</strong> substances that cause deleterious developmental effects <strong>and</strong> endocrine<br />
disruptors were present in biologically treated effluent.<br />
Ozonation <strong>and</strong> PAC-UF: Biomass <strong>of</strong> L. variegatus was significantly decreased after both<br />
ozonation <strong>and</strong> PAC-UF suggesting increased toxicity. For PAC-UF treatment, it is possible that<br />
the effect was caused by the reduced availability <strong>of</strong> food <strong>and</strong> nutrients in the treated wastewater.<br />
Negative effects <strong>of</strong> ozonation may be caused by reactive toxic ozonation by-products that were<br />
eliminated in the s<strong>and</strong> filtration. Similar observations were made by Stalter et al. (2010a), which<br />
prompted the recommendation to include a final filtration step with biological/bacterial activity<br />
21