

josselin-godoy-ponce-progress-report

You also want an ePaper? Increase the reach of your titles
YUMPU automatically turns print PDFs into web optimized ePapers that Google loves.
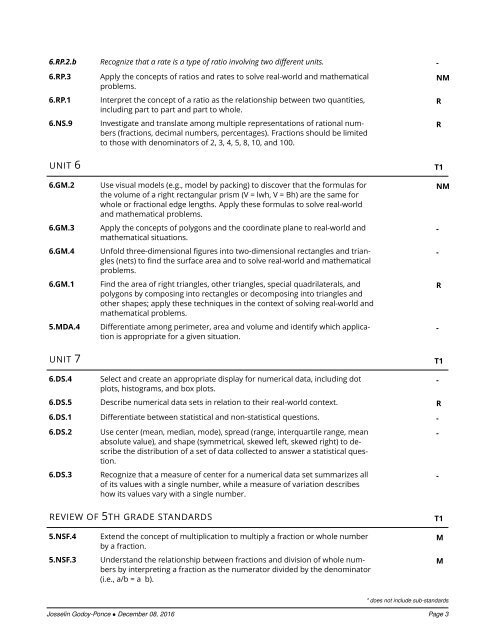
6.RP.2.b Recognize that a rate is a type of ratio involving two different units. -<br />
6.RP.3<br />
6.RP.1<br />
6.NS.9<br />
UNIT 6<br />
6.GM.2<br />
6.GM.3<br />
6.GM.4<br />
6.GM.1<br />
5.MDA.4<br />
UNIT 7<br />
Apply the concepts of ratios and rates to solve real-world and mathematical<br />
problems.<br />
Interpret the concept of a ratio as the relationship between two quantities,<br />
including part to part and part to whole.<br />
Investigate and translate among multiple representations of rational numbers<br />
(fractions, decimal numbers, percentages). Fractions should be limited<br />
to those with denominators of 2, 3, 4, 5, 8, 10, and 100.<br />
Use visual models (e.g., model by packing) to discover that the formulas for<br />
the volume of a right rectangular prism (V = lwh, V = Bh) are the same for<br />
whole or fractional edge lengths. Apply these formulas to solve real-world<br />
and mathematical problems.<br />
Apply the concepts of polygons and the coordinate plane to real-world and<br />
mathematical situations.<br />
Unfold three-dimensional figures into two-dimensional rectangles and triangles<br />
(nets) to find the surface area and to solve real-world and mathematical<br />
problems.<br />
Find the area of right triangles, other triangles, special quadrilaterals, and<br />
polygons by composing into rectangles or decomposing into triangles and<br />
other shapes; apply these techniques in the context of solving real-world and<br />
mathematical problems.<br />
Differentiate among perimeter, area and volume and identify which application<br />
is appropriate for a given situation.<br />
NM<br />
R<br />
R<br />
T1<br />
NM<br />
-<br />
-<br />
R<br />
-<br />
T1<br />
6.DS.4<br />
Select and create an appropriate display for numerical data, including dot<br />
plots, histograms, and box plots.<br />
6.DS.5 Describe numerical data sets in relation to their real-world context. R<br />
6.DS.1 Differentiate between statistical and non-statistical questions. -<br />
-<br />
6.DS.2<br />
6.DS.3<br />
Use center (mean, median, mode), spread (range, interquartile range, mean<br />
absolute value), and shape (symmetrical, skewed left, skewed right) to describe<br />
the distribution of a set of data collected to answer a statistical question.<br />
Recognize that a measure of center for a numerical data set summarizes all<br />
of its values with a single number, while a measure of variation describes<br />
how its values vary with a single number.<br />
-<br />
-<br />
REVIEW OF 5TH GRADE STANDARDS<br />
T1<br />
5.NSF.4<br />
5.NSF.3<br />
Extend the concept of multiplication to multiply a fraction or whole number<br />
by a fraction.<br />
Understand the relationship between fractions and division of whole numbers<br />
by interpreting a fraction as the numerator divided by the denominator<br />
(i.e., a/b = a b).<br />
M<br />
M<br />
* does not include sub-standards<br />
Josselin Godoy-Ponce • December 08, 2016 Page 3