annual report 31 Mar 2007 - SEB Asset Management
annual report 31 Mar 2007 - SEB Asset Management
annual report 31 Mar 2007 - SEB Asset Management

You also want an ePaper? Increase the reach of your titles
YUMPU automatically turns print PDFs into web optimized ePapers that Google loves.
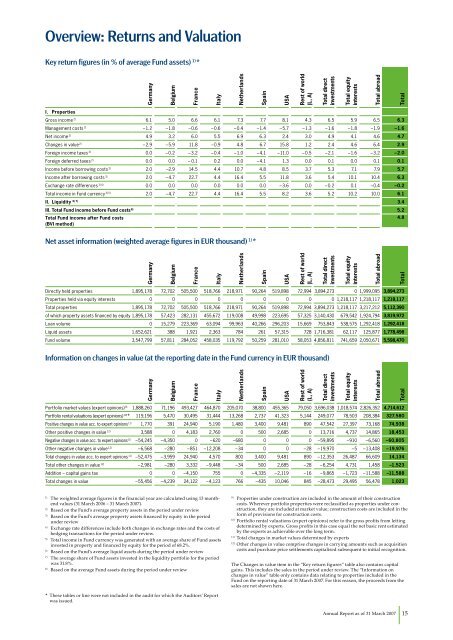
Overview: Returns and Valuation<br />
Key return figures (in % of average Fund assets) 1) *<br />
I. Properties<br />
Germany<br />
Belgium<br />
France<br />
Italy<br />
Gross income 2) 6.1 5.0 6.6 6.1 7.3 7.7 8.1 4.3 6.5 5.9 6.5 6.3<br />
<strong>Management</strong> costs 2) – 1.2 – 1.8 – 0.6 – 0.6 – 0.4 – 1.4 – 5.7 – 1.3 – 1.6 – 1.8 – 1.9 – 1.6<br />
Net income 2) 4.9 3.2 6.0 5.5 6.9 6.3 2.4 3.0 4.9 4.1 4.6 4.7<br />
Changes in value 2) – 2.9 – 5.9 11.8 – 0.9 4.8 6.7 15.8 1.2 2.4 4.6 6.4 2.9<br />
Foreign income taxes 2) 0.0 – 0.2 – 3.2 – 0.4 – 1.0 – 4.1 – 11.0 – 0.5 – 2.1 – 1.6 – 3.2 – 2.0<br />
Foreign deferred taxes 2) 0.0 0.0 – 0.1 0.2 0.0 – 4.1 1.3 0.0 0.1 0.0 0.1 0.1<br />
Income before borrowing costs 2) 2.0 –2.9 14.5 4.4 10.7 4.8 8.5 3.7 5.3 7.1 7.9 5.7<br />
Income after borrowing costs 3) 2.0 – 4.7 22.7 4.4 16.4 5.5 11.8 3.6 5.4 10.1 10.4 6.3<br />
Exchange rate differences 3) 4) 0.0 0.0 0.0 0.0 0.0 0.0 – 3.6 0.0 – 0.2 0.1 – 0.4 – 0.2<br />
Total income in Fund currency 3) 5) 2.0 – 4.7 22.7 4.4 16.4 5.5 8.2 3.6 5.2 10.2 10.0 6.1<br />
II. Liquidity 6) 7) 3.4<br />
III. Total Fund income before Fund costs 8) 5.2<br />
Total Fund income after Fund costs<br />
(BVI method)<br />
Net asset information (weighted average figures in EUR thousand) 1) *<br />
Germany<br />
Belgium<br />
France<br />
Italy<br />
Directly held properties 1,895,178 72,702 505,500 518,766 218,971 90,264 519,898 72,994 3,894,273 0 1,999,095 3,894,273<br />
Properties held via equity interests 0 0 0 0 0 0 0 0 0 1,218,117 1,218,117 1,218,117<br />
Total properties 1,895,178 72,702 505,500 518,766 218,971 90,264 519,898 72,994 3,894,273 1,218,117 3,217,212 5,112,390<br />
of which property assets financed by equity 1,895,178 57,423 282,1<strong>31</strong> 455,672 119,008 49,998 223,695 57,325 3,140,430 679,542 1,924,794 3,819,972<br />
Loan volume 0 15,279 223,369 63,094 99,963 40,266 296,203 15,669 753,843 538,575 1,292,418 1,292,418<br />
Liquid assets 1,652,621 388 1,921 2,363 784 261 57,<strong>31</strong>5 728 1,716,381 62,117 125,877 1,778,498<br />
Fund volume 3,547,799 57,811 284,052 458,035 119,792 50,259 281,010 58,053 4,856,811 741,659 2,050,671 5,598,470<br />
Information on changes in value (at the <strong>report</strong>ing date in the Fund currency in EUR thousand)<br />
Germany<br />
Belgium<br />
France<br />
Italy<br />
Portfolio market values (expert opinions) 9) 1,888,260 71,196 493,427 464,870 205,070 38,800 455,365 79,050 3,696,038 1,018,574 2,826,352 4,714,612<br />
Portfolio rental valuations (expert opinions) 10) * 119,196 5,470 30,495 <strong>31</strong>,444 13,268 2,737 41,323 5,144 249,077 78,503 208,384 327,580<br />
Positive changes in value acc. to expert opinions 11) 1,770 391 24,940 5,190 1,480 3,400 9,481 890 47,542 27,397 73,168 74,938<br />
Other positive changes in value 12) 3,588 0 4,183 2,760 0 500 2,685 0 13,716 4,737 14,865 18,453<br />
Negative changes in value acc. to expert opinions 11) – 54,245 – 4,350 0 – 620 – 680 0 0 0 – 59,895 – 910 – 6,560 – 60,805<br />
Other negative changes in value 12) – 6,568 – 280 – 851 – 12,208 – 34 0 0 – 28 – 19,970 – 5 – 13,408 – 19,976<br />
Total changes in value acc. to expert opinions 11) – 52,475 – 3,959 24,940 4,570 800 3,400 9,481 890 – 12,353 26,487 66,609 14,134<br />
Total other changes in value 12) – 2,981 – 280 3,332 – 9,448 – 34 500 2,685 – 28 – 6,254 4,7<strong>31</strong> 1,458 –1,523<br />
Addition – capital gains tax 0 0 – 4,150 755 0 – 4,335 – 2,119 – 16 – 9,865 – 1,723 – 11,588 –11,588<br />
Total changes in value – 55,456 – 4,239 24,122 – 4,123 766 – 435 10,046 845 – 28,473 29,495 56,478 1,023<br />
1) The weighted average figures in the financial year are calculated using 13 monthend<br />
values (<strong>31</strong> <strong>Mar</strong>ch 2006 – <strong>31</strong> <strong>Mar</strong>ch <strong>2007</strong>).<br />
2) Based on the Fund’s average property assets in the period under review<br />
3) Based on the Fund’s average property assets financed by equity in the period<br />
under review<br />
4) Exchange rate differences include both changes in exchange rates and the costs of<br />
hedging transactions for the period under review.<br />
5) Total income in Fund currency was generated with an average share of Fund assets<br />
invested in property and financed by equity for the period of 68.2%.<br />
6) Based on the Fund’s average liquid assets during the period under review<br />
7) The average share of Fund assets invested in the liquidity portfolio for the period<br />
was <strong>31</strong>.8%.<br />
8) Based on the average Fund assets during the period under review<br />
* These tables or line were not included in the audit for which the uditors’ Report<br />
was issued.<br />
Netherlands<br />
Netherlands<br />
Netherlands<br />
Spain<br />
Spain<br />
Spain<br />
USA<br />
USA<br />
USA<br />
Rest of world<br />
(L, A)<br />
Rest of world<br />
(L, A)<br />
Rest of world<br />
(L, A)<br />
Total direct<br />
investments<br />
Total direct<br />
investments<br />
Total direct<br />
investments<br />
Total equity<br />
interests<br />
Total equity<br />
interests<br />
Total equity<br />
interests<br />
9) Properties under construction are included in the amount of their construction<br />
costs. Wherever portfolio properties were reclassified as properties under construction,<br />
they are included at market value; construction costs are included in the<br />
form of provisions for construction costs.<br />
10) Portfolio rental valuations (expert opinions) refer to the gross profits from letting<br />
determined by experts. Gross profits in this case equal the net basic rent estimated<br />
by the experts as achievable over the long term.<br />
11) Total changes in market values determined by experts<br />
12) Other changes in value comprise changes in carrying amounts such as acquisition<br />
costs and purchase price settlements capitalised subsequent to initial recognition.<br />
The Changes in value item in the “Key return figures” table also contains capital<br />
gains. This includes the sales in the period under review. The “Information on<br />
changes in value” table only contains data relating to properties included in the<br />
Fund on the <strong>report</strong>ing date of <strong>31</strong> <strong>Mar</strong>ch <strong>2007</strong>. For this reason, the proceeds from the<br />
sales are not shown here.<br />
Total abroad<br />
Total abroad<br />
Total abroad<br />
Total<br />
4.8<br />
Total<br />
Total<br />
nnual Report as of <strong>31</strong> <strong>Mar</strong>ch <strong>2007</strong> 15