Liquid Chromatography–Electrospray Ionization Ion Trap Mass ...
Liquid Chromatography–Electrospray Ionization Ion Trap Mass ...
Liquid Chromatography–Electrospray Ionization Ion Trap Mass ...

Create successful ePaper yourself
Turn your PDF publications into a flip-book with our unique Google optimized e-Paper software.
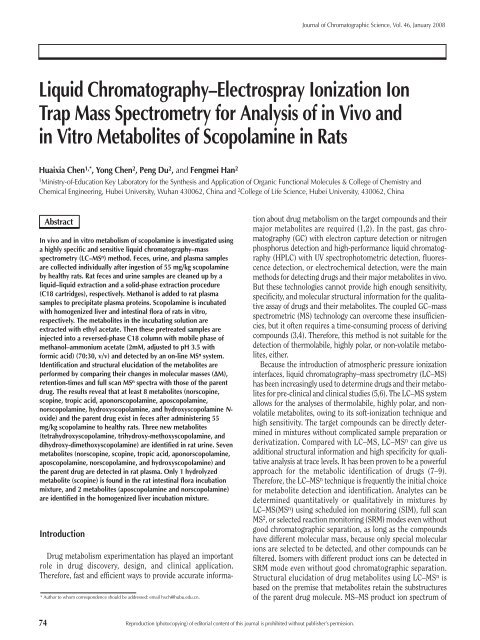
<strong>Liquid</strong> <strong>Chromatography–Electrospray</strong> <strong><strong>Ion</strong>ization</strong> <strong>Ion</strong><br />
<strong>Trap</strong> <strong>Mass</strong> Spectrometry for Analysis of in Vivo and<br />
in Vitro Metabolites of Scopolamine in Rats<br />
Huaixia Chen1,* , Yong Chen2 , Peng Du2 , and Fengmei Han2 1Ministry-of-Education Key Laboratory for the Synthesis and Application of Organic Functional Molecules & College of Chemistry and<br />
Chemical Engineering, Hubei University, Wuhan 430062, China and 2College of Life Science, Hubei University, 430062, China<br />
In vivo and in vitro metabolism of scopolamine is investigated using<br />
a highly specific and sensitive liquid chromatography–mass<br />
spectrometry (LC–MS n ) method. Feces, urine, and plasma samples<br />
are collected individually after ingestion of 55 mg/kg scopolamine<br />
by healthy rats. Rat feces and urine samples are cleaned up by a<br />
liquid–liquid extraction and a solid-phase extraction procedure<br />
(C18 cartridges), respectively. Methanol is added to rat plasma<br />
samples to precipitate plasma proteins. Scopolamine is incubated<br />
with homogenized liver and intestinal flora of rats in vitro,<br />
respectively. The metabolites in the incubating solution are<br />
extracted with ethyl acetate. Then these pretreated samples are<br />
injected into a reversed-phase C18 column with mobile phase of<br />
methanol–ammonium acetate (2mM, adjusted to pH 3.5 with<br />
formic acid) (70:30, v/v) and detected by an on-line MS n system.<br />
Identification and structural elucidation of the metabolites are<br />
performed by comparing their changes in molecular masses (∆M),<br />
retention-times and full scan MS n spectra with those of the parent<br />
drug. The results reveal that at least 8 metabolites (norscopine,<br />
scopine, tropic acid, aponorscopolamine, aposcopolamine,<br />
norscopolamine, hydroxyscopolamine, and hydroxyscopolamine Noxide)<br />
and the parent drug exist in feces after administering 55<br />
mg/kg scopolamine to healthy rats. Three new metabolites<br />
(tetrahydroxyscopolamine, trihydroxy-methoxyscopolamine, and<br />
dihydroxy-dimethoxyscopolamine) are identified in rat urine. Seven<br />
metabolites (norscopine, scopine, tropic acid, aponorscopolamine,<br />
aposcopolamine, norscopolamine, and hydroxyscopolamine) and<br />
the parent drug are detected in rat plasma. Only 1 hydrolyzed<br />
metabolite (scopine) is found in the rat intestinal flora incubation<br />
mixture, and 2 metabolites (aposcopolamine and norscopolamine)<br />
are identified in the homogenized liver incubation mixture.<br />
Introduction<br />
Drug metabolism experimentation has played an important<br />
role in drug discovery, design, and clinical application.<br />
Therefore, fast and efficient ways to provide accurate informa-<br />
74<br />
Abstract<br />
* Author to whom correspondence should be addressed: email hxch@hubu.edu.cn.<br />
tion about drug metabolism on the target compounds and their<br />
major metabolites are required (1,2). In the past, gas chromatography<br />
(GC) with electron capture detection or nitrogen<br />
phosphorus detection and high-performance liquid chromatography<br />
(HPLC) with UV spectrophotometric detection, fluorescence<br />
detection, or electrochemical detection, were the main<br />
methods for detecting drugs and their major metabolites in vivo.<br />
But these technologies cannot provide high enough sensitivity,<br />
specificity, and molecular structural information for the qualitative<br />
assay of drugs and their metabolites. The coupled GC–mass<br />
spectrometric (MS) technology can overcome these insufficiencies,<br />
but it often requires a time-consuming process of deriving<br />
compounds (3,4). Therefore, this method is not suitable for the<br />
detection of thermolabile, highly polar, or non-volatile metabolites,<br />
either.<br />
Because the introduction of atmospheric pressure ionization<br />
interfaces, liquid chromatography–mass spectrometry (LC–MS)<br />
has been increasingly used to determine drugs and their metabolites<br />
for pre-clinical and clinical studies (5,6). The LC–MS system<br />
allows for the analyses of thermolabile, highly polar, and nonvolatile<br />
metabolites, owing to its soft-ionization technique and<br />
high sensitivity. The target compounds can be directly determined<br />
in mixtures without complicated sample preparation or<br />
derivatization. Compared with LC–MS, LC–MS n can give us<br />
additional structural information and high specificity for qualitative<br />
analysis at trace levels. It has been proven to be a powerful<br />
approach for the metabolic identification of drugs (7–9).<br />
Therefore, the LC–MS n technique is frequently the initial choice<br />
for metabolite detection and identification. Analytes can be<br />
determined quantitatively or qualitatively in mixtures by<br />
LC–MS(MS n ) using scheduled ion monitoring (SIM), full scan<br />
MS 2 , or selected reaction monitoring (SRM) modes even without<br />
good chromatographic separation, as long as the compounds<br />
have different molecular mass, because only special molecular<br />
ions are selected to be detected, and other compounds can be<br />
filtered. Isomers with different product ions can be detected in<br />
SRM mode even without good chromatographic separation.<br />
Structural elucidation of drug metabolites using LC–MS n is<br />
based on the premise that metabolites retain the substructures<br />
of the parent drug molecule. MS–MS product ion spectrum of<br />
Reproduction (photocopying) of editorial content of this journal is prohibited without publisher’s permission.<br />
Journal of Chromatographic Science, Vol. 46, January 2008
Journal of Chromatographic Science, Vol. 46, January 2008<br />
each metabolite provides detailed substructural information of<br />
its structure. So, using the product ion spectrum of parent drug<br />
as a substructural template, metabolites presented in crude mixtures<br />
may be rapidly identified and detected based on their<br />
changes in molecular masses (∆M) and spectral patterns of<br />
product ions, even without standards for each metabolite<br />
(10–12).<br />
Scopolamine is a kind of tropane alkaloid separated from<br />
various solanaceous species (13), such as the roots of Chinese<br />
traditional medicine Anisodus tanguticus (Maxim.) Pascher.<br />
Scopolamine has widespread physiological activities such as<br />
spasmolytic, anaesthetic, acesodyne, and ophthalmic effects<br />
(14,15). In recent years, more and more pharmacological<br />
activities of scopolamine have been investigated and widely<br />
noticed. Compared with the comprehensive investigations into<br />
its therapeutic purpose, the study of its metabolism in vivo or in<br />
vitro is limited, although the metabolic study of scopolamine<br />
plays an important role in the development of new drugs and<br />
their clinical applications.<br />
Some analytical assays have been developed for the quantitation<br />
of scopolamine in plants and pharmaceutical samples or in<br />
urine, based on capillary electrophoresis–diode arrayelectrospray–MS<br />
(16) and HPLC (17–19). Also, pharmacokinetic<br />
studies have been performed by GC–MS (20–22) and LC–MS n<br />
(23). However, metabolic studies of scopolamine in vivo have not<br />
been reported except in three papers (24–26). Werner and<br />
Schmidt (24) described the formation of metabolites such as 6hydroxyatropine,<br />
scopine, and scopolamine glucuronide. Wada<br />
and Yamada et al. (25,26) found three major metabolites (phydroxyscopolamine,<br />
m-hydroxyscopolamine, and p-hydroxy-mmethoxyscopolamine)<br />
and the unchanged drug in rat by the<br />
combination of multi-approaches such as thin-layer chromatography,<br />
GC, GC–MS, and nuclear magnetic resonance. Because<br />
scopolamine and its metabolites are highly polar, thermolabile,<br />
and easy to undergo pyrolysis in the injector block of a GC, the<br />
GC or GC–MS method used is not satisfactory in the analysis of<br />
metabolism of scopolamine. In addition, the urine samples were<br />
prepared using 7% HCl at 100°C, which result in many<br />
metabolites decomposing.<br />
We applied the LC–MS n technique to identify the metabolites<br />
of scopolamine in the rat (27). LC–MS n provides molecular mass<br />
and structural information depending upon fragmentation<br />
patterns. It permits direct analysis of intact polar non-volatile<br />
conjugates without derivatization and/or hydrolysis. 18<br />
metabolites were found in rat urine. The major metabolic<br />
pathway of scopolamine in rat was hydrolysis, demethylation,<br />
dehydration, hydroxylation, and sulfate and glucuronide<br />
conjugate.<br />
In order to comprehensively study the metabolism, this work<br />
presents the metabolism of scopolamine in rat feces, urine, and<br />
plasma after administration. The present study also involves the<br />
incubation of scopolamine with intestinal flora and homogenized<br />
liver in order to clarify its in vivo and in vitro metabolic<br />
pathways. Three new metabolites (tetrahydroxyscopolamine,<br />
trihydroxy-methoxyscopolamine, and dihydroxydimethoxyscopolamine)<br />
were found in rat urine after administering<br />
55 mg/kg scopolamine. The parent drug and its<br />
metabolites 7 and 8 (described later) were found in rat feces and<br />
plasma, respectively. Only metabolites 1 and 2 of scopolamine<br />
were identified in rat intestinal flora and homogenized liver<br />
incubation mixtures in vitro, respectively. These metabolites<br />
were detected for the first time in rat feces, plasma, intestinal<br />
flora, and homogenized liver incubation solutions, which will be<br />
useful for future studies involving scopolamine, such as clinical<br />
therapy.<br />
Experimental<br />
Reagents and chemicals<br />
Scopolamine hydrobromide was purchased from Sigma (St.<br />
Louis, MO). Methanol was of HPLC grade (Fisher Chemical Co.,<br />
Inc., Los Angeles CA); water was deionized and double distilled;<br />
all other reagents were of analytical reagent grade.<br />
Apparatus<br />
LC–MS and LC–MS n experiments were performed on an LCQ<br />
Duo quadrupole ion trap MS (ThermoFinnigan Corp, San Jose,<br />
CA) with a TSP4000 HPLC pump and a TSP AS3000<br />
autosampler. The software Xcalibur version 1.2 (Finnigan) was<br />
applied for system operation and data collection. A high-speed<br />
desk centrifuge (TGL-16C, Shanghai Anting Scientific<br />
Instrument Factory, Shanghai, China) was used to centrifuge the<br />
samples. Rat urine samples were extracted on a C18 solid-phase<br />
extraction cartridge (3 mL/200 mg, AccuBond II , Agilent, Palo<br />
Alto, CA). The intestinal incubation experiments were carried<br />
out in anaerobical incubation bags (AnaeroPouch-Anaero<br />
08G05A-23, Mitsubishi Gas Chemical Company, Inc., Tokyo,<br />
Japan) using anaerobical generating bags (Mitsubishi Gas<br />
Chemical Company, Inc.).<br />
Sample preparation<br />
In vivo samples<br />
Five wistar rats (180 ± 5 g, Hubei Research Center of<br />
Laboratory Animals, Hubei China) were housed in metabolic<br />
cages for the collection of feces, urine, and plasma. The rats were<br />
fasted for 24 h but with access to water, and then they were<br />
administered 55 mg/kg oral gavage doses of scopolamine. Feces<br />
and urine were collected individually during the time period<br />
0–24 h. The samples were stored at –20°C until analysis.<br />
Heparinized blood samples of 200 µL were collected at 0.24, 0.75,<br />
2, 9, 18, and 24 h from the ophthalmic veins of the rats by sterile<br />
capillary tube, then shaken and centrifuged at 2000 × g for 10<br />
min. The supernatants were decanted, and immediately frozen at<br />
–20°C until analysis.<br />
The feces samples were homogenized with water. An aliquot of<br />
500 µL feces homogenate was extracted twice with 2 mL of ethyl<br />
acetate after adding 50 µL of 0.001% Na 2CO 3 solution. The<br />
supernatant ethyl acetate layers were decanted and pooled and<br />
evaporated at 37°C under nitrogen. The residue was redissolved<br />
in 500 µL of mobile phase and filtered through 0.45 µm film and<br />
an aliquot of 10 µL was used for LC–MS n analyses.<br />
An aliquot of 1 mL of mixed 0–24 h urine samples was loaded<br />
onto a C18 solid-phase extraction cartridge which was preconditioned<br />
with 2 mL of methanol and 1 mL of water. Then, the SPE<br />
75
cartridge was washed with 2 mL of water, and the analytes were<br />
eluted with 1 mL of methanol. The elution solutions were<br />
filtered through 0.45 µm film and an aliquot of 10 µL was used<br />
for LC–MS n analyses.<br />
An aliquot of 200 µL of the plasma samples was added to 300<br />
µL of methanol to precipitate plasma proteins, and then<br />
centrifuged at 2000 × g for 10 min. The supernatant was filtered<br />
through 0.45 µm film and an aliquot of 10 µL was used for<br />
LC–MS n analyses.<br />
In vitro samples<br />
Preparation of anaerobical cultural solutions (28). Solution<br />
A, 37.5 mL (0.78% K 2HPO 4), solution B, 37.5 mL [0.47%<br />
KH 2PO 4, 1.18% NaCl, 1.2% (NH 4) 2SO 4, 0.12%CaCl 2,<br />
0.25%MgSO 4·H 2O], solution C, 50 mL (8% Na 2CO 3), 0.5 g Lcysteine,<br />
2 mL 25% L-ascorbic acid, 1 g eurythrol, 1 g tryptone,<br />
and 1 g nutrient agar were mixed together and diluted to 1 L with<br />
distilled water. HCl (2M) was used to adjust the mixture solution<br />
to pH 7.5~8.0.<br />
Metabolism in intestinal bacteria<br />
The fresh intestinal contents were obtained from wistar rat<br />
(200 g). Samples were homogenized with a glass rod in anaerobical<br />
cultural solution as the ratio of 0.5 g:1.5 mL immediately.<br />
Then, the homogenates were filtrated using gauze. Scopolamine<br />
was added into an intestinal flora cultural solution in culture<br />
dishes to a final concentration of 50 µg/mL. The culture dishes<br />
were put in anaerobical incubation bags. The anaerobical<br />
generating bags were opened, and put into anaerobical incubation<br />
bags immediately, then sealed. Incubations were carried out<br />
in a shaking water-bath at 37ºC anaerobically. The incubation<br />
was continued for 4 and 24 h, terminated, and extracted (twice)<br />
with ethyl acetate. The organic extracts were combined and<br />
evaporated at 37°C under nitrogen. The residues were<br />
reconstituted in 0.6 mL of mobile phase and centrifuged at<br />
76<br />
Relative abundance (%)<br />
Relative abundance (%)<br />
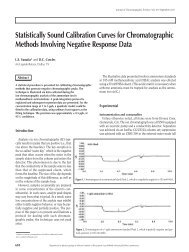
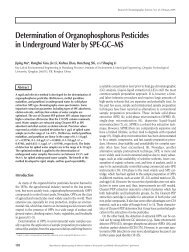
Figure 1. Full scan MS spectrum (A); full scan MS 2 product ions spectrum and<br />
the predominant fragmentation patterns (B); LC–MS 2 chromatogram of scopolamine<br />
(C).<br />
m/z<br />
B C<br />
Relative abundance (%)<br />
m/z Time (min)<br />
A<br />
13000 × g for 10 min. The supernatant (0.5 mL) was used for<br />
LC–MS n analyses.<br />
Preparation and incubation of homogenated liver<br />
Wistar rats (200 g) were fasted for 24 h and killed by<br />
decapitation between 10 a.m. and noon. A weighed amount of<br />
liver was rapidly placed on ice. It was rinsed twice with saline,<br />
immediately minced with scissors, and homogenated in ice-cold<br />
Krebs-Henseleit buffer (pH 7.4) (29) after sterilization to yield<br />
liver homogenate (0.4 g/mL). All the previously mentioned steps<br />
were carried out at 0~4°C. The concentration of P450 was<br />
detected by spectrophotometer (30). Scopolamine was added to<br />
liver homogenate to the concentration of 50 µg/mL. The mixture<br />
was incubated at 37°C with shaking. The incubation time was<br />
varied from 0, 30, 60, 90, 120, to 240 min. The gas phase was<br />
oxygen in all experiments. The incubation was terminated and<br />
extracted (twice) with equal volume of ethyl acetate. The organic<br />
extracts were combined and evaporated at 37°C under a slow<br />
stream of nitrogen. The residues were reconstituted in 0.6 mL of<br />
mobile phase and centrifuged at 13000 × g for 10 min. The<br />
supernatant was used for LC–MS n analyses. The blank<br />
experiment was carried out under the same conditions by<br />
replacing the liver homogenate with Krebs-Henseleit buffer.<br />
HPLC conditions<br />
A reversed-phase column (Zorbax Extend-C18, 3.0 × 100 mm<br />
i.d., 3.5 µm, Agilent) was connected with a guard column (cartridge<br />
2.1 × 12.5 mm, 5 µm, Agilent) filled with the same packing<br />
material to separate scopolamine and its metabolites in rat feces,<br />
urine, and plasma. The temperature of the column was set at<br />
40ºC. The mobile phase consisted of methanol and 2mM<br />
ammonium acetate (adjusted to pH 3.5 with formic acid) (70:30,<br />
v/v). The flow rate was 0.2 mL/min during the whole run.<br />
MS conditions<br />
MS detection was carried out in positive ion mode, and only<br />
the analyses of tropic acid were carried out in negative ion<br />
detection mode. Nitrogen was used as the sheath gas (40 arbitrary<br />
units). The MS analyses were performed under automatic<br />
gain control conditions, using a typical source spray voltage of<br />
4.5 kV, a capillary voltage of 21 V, and a heated capillary temperature<br />
of 175°C. The other parameters, including the voltages of<br />
octapole offset and tube lens offset, were also optimized for maximum<br />
abundance of the ions of interest by the automatic tune<br />
procedure of the instrument. The MS n product ion spectra were<br />
produced by collision induced dissociation of the protonated<br />
molecular ion [M+H] + or the deprotonated molecular ion<br />
[M–H] – of all analytes at their respective HPLC retention times.<br />
Data acquisition was performed in full scan LC–MS and tandem<br />
MS modes.<br />
Results and Discussion<br />
Journal of Chromatographic Science, Vol. 46, January 2008<br />
The in vivo and in vitro metabolism pathway of scopolamine<br />
was investigated. Blank samples and substrate were analyzed for<br />
the identification of the metabolites in biological samples.
Journal of Chromatographic Science, Vol. 46, January 2008<br />
LC–MS and LC–MS n analyses of substrate<br />
Full scan mass spectral analysis of scopolamine showed a<br />
protonated molecular ion of m/z 304 (Figure 1A). The MS–MS<br />
product ion spectrum of the protonated molecular ion (m/z 304)<br />
and its proposed fragmentation pathway are shown in Figure 1B.<br />
Scopolamine was eluted at 2.90 min under the experimental<br />
conditions (Figure 1C). Fragmentation of the protonated<br />
molecular ion of scopolamine in the ion trap led to five main<br />
product ions m/z: 286, 274, 156, 138, and 110. The product ions<br />
at m/z 286 and 274 were formed by the loss of H 2O and HCHO<br />
from the molecular ion at m/z 304, respectively. The most abundant<br />
product ion at m/z 138 was formed by the loss of tropic acid<br />
(C 9H 10O 3, 166 Da). The ion at m/z 156 was produced by the loss<br />
of C 9H 8O 2 (148 Da). The fragment ions at m/z 156, 138, and 110<br />
coexisted in the MS 3 spectra of m/z 286 and 274. It could be concluded<br />
that the ions at m/z 156 and 138 were a pair of characteristic<br />
product ions of scopolamine, and 148 Da and 166 Da were<br />
its characteristic neutral losses. These characteristic product<br />
ions and neutral losses were the sound bases to identify metabolites<br />
of scopolamine.<br />
Relative abundance (%)<br />
Relative abundance (%)<br />
Relative abundance (%)<br />
Relative abundance (%)<br />
m/z<br />
m/z<br />
m/z m/z<br />
Relative abundance (%)<br />
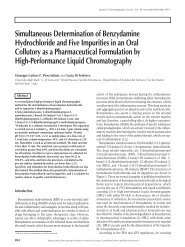
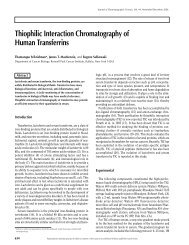
Figure 2. MS–MS product ion spectra of scopolamine and its 8 metabolites in rat feces.<br />
Relative abundance (%)<br />
Relative abundance (%)<br />
Relative abundance (%)<br />
Relative abundance (%)<br />
m/z<br />
m/z<br />
m/z<br />
m/z<br />
In vivo metabolism<br />
Identification of metabolites in rat feces<br />
Based on the method previously described, the parent drug<br />
and eight metabolites were found in rat feces after<br />
administration of scopolamine. Their protonated molecular ions<br />
([M+H] + ) were at m/z 142, 156, 272, 286, 290, 304, 320, and 336,<br />
respectively. The MS–MS spectra of these analytes were<br />
presented in Figure 2. Among them, the retention time (Table I)<br />
and the MS and MS2 spectra of the protonated molecular ion at<br />
m/z 304 (M0, Figure 2F) were the same as those of scopolamine.<br />
Therefore, M0 could be confirmed as the unchanged parent<br />
drug.<br />
The MS2 spectrum of m/z 156 (M2) was the same as the MS3 spectrum of the protonated molecular ion of scopolamine at m/z<br />
304 → 156, and there were the characteristic product ions at m/z<br />
98, 110, 138 in its MS2 spectrum (Figure 2B). So, M2 was<br />
identified as the hydrolysis product of scopolamine, and it was<br />
scopine.<br />
The protonated molecular ion at m/z 142 (M1) and its<br />
daughter ions at m/z 124, 114, 96, 84, and 70 (Figure 2A) were all<br />
14 Da less than m/z 156 (M1) and its daughter<br />
ions at m/z 138, 128, 110, 98, and 84, respectively.<br />
These results indicated that M1 should be the Ndemethyl<br />
product of M2 (norscopine).<br />
The characteristic product ions of m/z 110 and<br />
138 appeared in the MS2 spectrum of the protonated<br />
molecular ion at m/z 286 (M4, Figure 2D),<br />
which was decreased by 18 Da compared to that of<br />
the unchanged scopolamine.The result indicated<br />
that M4 should be the dehydrated metabolite of<br />
scopolamine (aposcopolamine). The m/z 268 ion<br />
may be produced by the loss of H2O from m/z 286<br />
via enolization.<br />
The protonated molecular ion at m/z 272 (M3)<br />
and its daughter ions at m/z 254, 124, and 96<br />
(Figure 2C) were all 14 Da less than m/z 286 and<br />
its daughter ions m/z 268, 138 and 110,<br />
respectively. Therefore, M3 could be identified<br />
as the N-demethyl product of M4 (aponorscopolamine).<br />
The m/z 254 ion may be produced<br />
by the loss of H2O from m/z 272 via enolization.<br />
The fragment ions at m/z 142 and 124 were produced<br />
by losing neutral fragments 148 Da and 166<br />
Da from the parent ion at m/z 290 (M5, Figure<br />
2E), which were the same as the neutral losses of<br />
the parent drug. It was obvious that the m/z 290<br />
ion and its daughter ions at m/z 272, 260, 142,<br />
124, and 96 were all 14 Da less than the molecular<br />
ion of parent drug (m/z 304) and its daughter ions<br />
at m/z 286, 274, 156, 138, and 110. Thus, M5<br />
could be identified as the N-desmethyl product of<br />
scopolamine (norscopolamine).<br />
The protonated molecular ion at m/z 320 (M6)<br />
was increased by 16 Da compared to that of the<br />
unchanged scopolamine. Because of the appearances<br />
of the characteristic fragment ions at m/z<br />
156, 138, and characteristic neutral losses 164 Da<br />
(148+16) (m/z 320 → 156), 182 Da (166+16) (m/z<br />
77
320 → 138) in its MS 2 spectrum (Figure 2G), M6 should be the<br />
hydroxylation product of scopolamine hydroxylated at the tropic<br />
acid part. The m/z 302 ion was produced by the loss of H 2O from<br />
the parent ion at m/z 320. The results indicated that the benzyl<br />
hydrogen still existed in M6. Therefore, M6 was phenolic<br />
metabolites.<br />
The characteristic product ions at m/z 156, 138, and 110<br />
appeared in the MS 2 spectrum of the molecular ion at m/z 336<br />
(M7, Figure 2H) that was increased by 32 Da compared to that of<br />
the parent drug. The appearance of the predominant product ion<br />
78<br />
Relative abundance (%)<br />
Relative abundance (%)<br />
Relative abundance (%)<br />
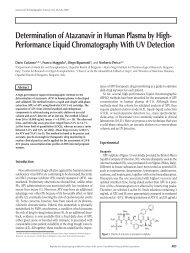
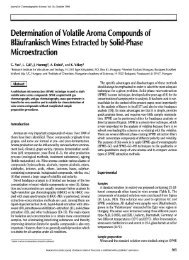
Figure 3. MS–MS product ion spectra of 3 new metabolites in rat urine.<br />
Table I. The Comparative Distribution of Metabolites Identified From<br />
Different Matrices*<br />
Analyte [M+H] + Rt Feces Urine Plasma Intestinal Homogenized<br />
(min) flora liver<br />
M1 142 2.25 + + + – –<br />
M2 156 2.35 + + + + –<br />
M3 272 3.15 + + + – –<br />
M4 286 3.05 + + + – +<br />
M5 290 2.39 + + + – +<br />
M0 304 2.91 + + + + +<br />
M6 320 2.32 + + + – –<br />
M7 336 2.30 + + – – –<br />
M8 165 [M-H] – 2.11 + + + – –<br />
M9 368 2.63 – + – – –<br />
M10 382 2.35 – + – – –<br />
M11 396 2.40 – + – – –<br />
* + indicates “found” and – indicates “not found”.<br />
Journal of Chromatographic Science, Vol. 46, January 2008<br />
at m/z 172 (156+16) in the MS 2 spectrum of the molecular ion at<br />
m/z 336 indicated that the scopine part was oxidized, and the<br />
other oxidation should occur at tropic acid part. Besides, in the<br />
MS 2 spectrum of m/z 336, a pair of product ions at m/z 155 and<br />
154 (more abundant than m/z 155) were produced by the loss of<br />
17 and 18 Da from the ion at m/z 172, respectively. P.H. Cong<br />
(31) theoretically expounded the fragmentation feature of Noxide:<br />
losing 17, 18 Da from the parent molecule and the<br />
fragmentation feature was validated using oxymatrine in our<br />
experiment. Based on these data, M7 was deduced as the N-oxide<br />
of scopolamine. The m/z 318 ion was produced by the loss of H 2O<br />
from its parent ion at m/z 336. The results indicated that the<br />
benzyl hydrogen still existed in M7. So, M7 should be the<br />
hydroxyscopolamine N-oxide.<br />
The m/z 165 ion (M8) appeared in the negative ion full scan<br />
LC–MS spectrum of the urine samples. The appearances of the<br />
product ions at m/z 147 ([M–H–H 2O] – ) and 121 ([M–H–CO 2] – )<br />
indicated that M8 was the hydrolysis product of scopolamine<br />
(tropic acid), which was in accordance with to the result of Wada<br />
et al. (25,26). No sulfate or glucuronide conjugate of M8 was<br />
found in rat feces.<br />
Various solvents were used for the liquid–liquid extraction of<br />
scopolamine and its metabolites in rat feces. The analytical<br />
results were almost the same when ethyl acetate was substituted<br />
by chloroform or carbon dichloride. However, the ethyl acetate<br />
layers were supernatant and easy to decant, so ethyl acetate was<br />
used for the liquid–liquid extraction of scopolamine and its<br />
metabolites in rat feces.<br />
Identification of metabolites in rat urine<br />
We found 18 metabolites (norscopine, scopine, tropic acid,<br />
aponorscopolamine, aposcopolamine, norscopolamine,<br />
hydroxyscopolamine, hydroxyscopolamine N-oxide, p-hydroxym-methoxyscopolamine,<br />
trihydroxyscopolamine, dihydroxymethoxyscopolamine,<br />
hydroxyl-dimethoxyscopolamine,<br />
glucuronide conjugates, and sulfate conjugates of<br />
norscopolamine, hydroxyscopolamine, and the parent drug) in<br />
rat urine after administering scopolamine to<br />
healthy rats. In our study, three new metabolites<br />
were found in rat urine for the first time. Their<br />
MS–MS spectra are presented in Figure 3.<br />
The protonated molecular ion at m/z 368, 382,<br />
and 396 was increased by 64 (16 × 4) Da, 78 (16 ×<br />
3+30) Da, and 92 (6 × 2+30 × 2) Da compared<br />
to that of unchanged scopolamine. The<br />
characteristic fragment ions at m/z 156, 138, and<br />
110 appeared in their MS 2 spectra (Figure 3), and<br />
there were not the m/z 172 (156+16) ion in their<br />
MS 2 spectra. This showed that the tropine<br />
structure was retained in these metabolites. The<br />
appearance of their dehydrated fragment ions<br />
([M+H–H 2O] + ) at 350, 364, and 378 in the MS2<br />
spectra showed that they were phenolic<br />
metabolites. Therefore, the 3 metabolites could<br />
be identified as tetrahydroxyscopolamine,<br />
trihydroxy-methoxyscopolamine, and dihydroxydimethoxyscopolamine.
Journal of Chromatographic Science, Vol. 46, January 2008<br />
Identification of metabolites in rat plasma<br />
According to the previously mentioned method, the parent<br />
drug and its 7 metabolites were identified in rat plasma<br />
after administration of scopolamine. They were norscopine,<br />
scopine, tropic acid, aponorscopolamine, aposcopolamine,<br />
norscopolamine, and hydroxyscopolamine.<br />
The LC–MS 2 analysis of plasma samples showed that the<br />
parent drug and its 7 metabolites existed in plasma between<br />
0.75 and 18 h after administration, and only scopine, aposcopolamine,<br />
norscopolamine, and tropic acid were found in<br />
plasma at 0.24 h.Norscopine, scopine, hydroxyscopolamine and<br />
tropic acid were found in plasma at 25 h.<br />
In vitro metabolism<br />
The substrate was incubated with intestinal fractions and liver<br />
homogenate of rats. Substrate was observed, but only one<br />
metabolite (scopine) was detected in the rat intestinal part.<br />
Another hydrolysis product of scopolamine (tropic acid) was not<br />
found in the incubation. The results showed that the metabolism<br />
of scopolamine was very weak in rat intestinal bacteria. Two<br />
metabolites (aposcopolamine and norscopolamine) were found<br />
in the liver homogenate incubation.<br />
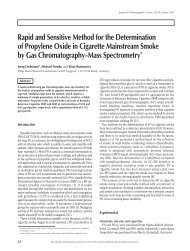
On the basis of this discussion and combining the results with<br />
those we have reported elsewhere (27), the metabolic pathway<br />
proposed for scopolamine in rats is depicted in Figure 4. The<br />
comparative distribution of metabolites identified from different<br />
matrices is shown in Table I.<br />
In this work, the sensitivity of the method was determined<br />
Figure 4. Proposed metabolic pathway of scopolamine in rat (Glu = flucuronic acid).<br />
using scopolamine. The limit of detection (LOD) was approximately<br />
5 ng/mL by LC–MS n . The specificity of the assay was evaluated<br />
by analyzing blank solution and blank feces, urine, and<br />
plasma samples of rats. No impurities or endogenous interferences<br />
were found. Therefore, the proposed method is highly sensitive<br />
and special for the quantitative determination of<br />
scopolamine and its metabolites.<br />
Conclusion<br />
In the present study, in vivo and in vitro metabolism of<br />
scopolamine was studied extensively. Metabolites were resolved,<br />
identified, and characterized using a highly specific and selective<br />
technique of LC–MS n ion trap with electrospray ionization in the<br />
positive ion mode. For the first time, 3 new metabolites were<br />
found in rat urine after ingestion of scopolamine, and 8, 7, 1, and<br />
2 metabolites were identified in rat feces, plasma, intestinal<br />
bacteria, and liver homogenate. Various extraction solvents were<br />
compared for investigation into the metabolism of scopolamine.<br />
Acknowledgments<br />
This work was supported by the Ministry-of-Education Key<br />
Laboratory for the Synthesis and Application of Organic<br />
Functional Molecules Natural Science<br />
Foundation of Hubei University (No.020-044109)<br />
and the Specialist Fund of Hubei University<br />
(020091130-ky2006004). The authors would like<br />
to thank their colleagues for their valuable technical<br />
assistance.<br />
References<br />
1. A.E.F. Nassar. Online hydrogen-deuterium<br />
exchange and a tandem-quadrupole time-of-flight<br />
mass spectrometer coupled with liquid chromatography<br />
for metabolite identification in drug<br />
metabolism. J. Chromatogr. Sci. 41: 398–404<br />
(2003).<br />
2. M. Gabriëls and J. Plaizier-Vercammen.<br />
Development of a reversed-phase thin-layer chromatographic<br />
method for artemisinin and its<br />
derivatives. J. Chromatogr. Sci. 42: 341–47 (2004).<br />
3. A.K. Valaer, T. Huber, S.V. Andurkar, C.R. Clark,<br />
and J. DeRuiter. Development of a gas chromatographic–mass<br />
spectrometric drug screening<br />
method for the N-dealkylated metabolites of fentanyl,<br />
sufentanil, and alfentanil. J. Chromatogr.<br />
Sci. 35: 461–66 (1997).<br />
4. M.H. Spyridaki, E. Lyris, I. Georgoulakis,<br />
D. Kouretas, M. Konstantinidou, and<br />
C.G. Georgakopoulos. Determination of xylazine<br />
and its metabolites by GC–MS in equine urine for<br />
doping analysis. J. Pharm. Biomed. Anal. 35:<br />
107–16 (2004).<br />
79
5. C.T. Whalen, G.D. Hanson, K.J. Putzer, M.D. Mayer, and D.J.<br />
Mulford. Assay of TNP-470 and its two major metabolites in human<br />
plasma by high-performance liquid chromatography–mass spectrometry.<br />
J. Chromatogr. Sci. 40: 214–18 (2002).<br />
6. A.V. Shpak, S.A. Appolonova, and V.A. Semenov. Validation of<br />
liquid chromatography–electrospray ionization ion trap mass spectrometry<br />
method for the determination of mesocarb in human<br />
plasma and urine. J. Chromatogr. Sci. 43: 11–21 (2005)<br />
7. C.B. Fang, X.C. Wan, H.R. Tan, and C.J. Jiang. Identification of<br />
Isoflavonoids in several kudzu samples by high-performance liquid<br />
chromatography coupled with electrospray ionization tandem mass<br />
spectrometry. J. Chromatogr. Sci. 44: 57–63 (2006).<br />
8. C. Siethoff, M. Orth, A. Ortling, E. Brendel, and W. Wagner-<br />
Redeker. Simultaneous determination of capecitabine and its<br />
metabolite 5-fluorouracil by column switching and liquid chromatographic–tandem<br />
mass spectrometry. J. <strong>Mass</strong> Spectrom. 39:<br />
884–89 (2004).<br />
9. Z.W. Cai, T.X. Qian, Ricky N.S. Wong, and Z.H. Jiang. <strong>Liquid</strong> chromatography–electrospray<br />
ionization mass spectrometry for<br />
metabolism and pharmacokinetic. Studies of ginsenoside Rg3.<br />
Anal. Chim. Acta 492: 283–93 (2003).<br />
10. S.A. Appolpnova, A.V. Shpak, and V.A. Semenov. <strong>Liquid</strong> chromatography-electrospray<br />
ionization ion trap mass spectrometry for<br />
analysis of mesocarb and its metabolites in human urine.<br />
J. Chromatogr.B800: 281–89 (2004).<br />
11. E. Molden, G.H. Bøe, H. Christensen, and L.J. Reubsaet. High-performance<br />
liquid chromatography–mass spectrometry analysis of<br />
diltiazem and 11 of its phase I metabolites in human plasma.<br />
J. Pharm. Biomed. Anal. 33: 275–85 (2003).<br />
12. E. Gangl, H. Utkin, N. Gerber, and P. Vouros. Structural elucidation<br />
of metabolites of ritonavir and indinavir by liquid chromatographymass<br />
spectrometry. J. Chromatogr. A 974: 91–101 (2002).<br />
13. M. Lounasmaa and T. Tamminen. In The Alkaloids, Vol. 44. G.A.<br />
Cordell, Ed. Academic Press, New York, 1993.<br />
14. S. Pompeia, J.M. Rusted, and H.V. Curran. Verbal fluency facilitated<br />
by the cholinergic blocker, scopolamine. Hum. Psychopharmacol.<br />
17: 51–59 (2002).<br />
15. L.E. Shutt and J.B. Bowes. Atropine and hyoscine. Anaesthesia 34:<br />
476–90 (1979).<br />
16. L. Mateus, S. Cherkaoul, P. Christen, and J.L. Verthey. Capillary electrophoresis<br />
for the analysis of tropane alkaloids: pharmaceutical<br />
and phytochemical applications. Electrophoresis 20: 3402–09<br />
(1999).<br />
17. H.L. Yi, G.D. Zhang, Y.Y. Tong, K. Sagara, T. Oshima, and<br />
T. Yoshida. Reversed-phase ion-pair high-performance liquid chromatographic<br />
separation and determination of tropane alkaloids in<br />
Chinese solanaceous plants. J. Chromatogr. 481: 428–433 (1989).<br />
18. S. Auriola, A. Nartinsen, K.M. Oksman-Caldentey, and<br />
T. Naaranlahti. Analysis of tropane alkaloids with thermospray<br />
high-performance liquid chromatography-mass spectrometry.<br />
80<br />
Journal of Chromatographic Science, Vol. 46, January 2008<br />
J. Chromatogr. 562: 737–744 (1991).<br />
19. B. Drager. Analysis of tropane and related alkaloids. J. Chromatogr.<br />
A 978: 1–35 (2002).<br />
20. J. Deutsch, T.T. Soncrant, N.H. Greig, and S.I. Rapoport. Electronimpact<br />
ionization detection of scopolamine by gas chromatography–mass<br />
spectrometry in rat plasma and brain. J. Chromatogr.<br />
528: 325–31 (1990).<br />
21. R. Oertel, K. Richter, U. Ebert, and W. Kirch. Determination of<br />
scopolamine in human serum by gas chromatography-ion trap<br />
tandem mass spectrometry. J. Chromatogr. B 682: 259–64(1996).<br />
22. U. Ebert, M. Siepmann, R. Oertel, K.A. Wesnes, and W. Kirch.<br />
Pharmacokinetics and pharmacodynamics of scopolamine after<br />
subcutaneous administration J. Clin. Pharmacol. 38: 720–26<br />
(1998).<br />
23. R. Oertel, K. Richter, U. Ebert, and W. Kirch. Determination of<br />
scopolamine in human serum and microdialysis samples by chromatography-tandem<br />
mass spectrometry. J. Chromatogr. B 750:<br />
121–28 (2001).<br />
24. G. Werner and K.H. Schmidt. Studies on the metabolism of tropane<br />
alkaloids. 8. Chemical analysis of (–)-scopolamine metabolism in<br />
several mammals. Hoppe Seylers Z. Physiol. Chem. 349: 741–52<br />
(1968).<br />
25. S. Wada, T. Yoshimitsu, N. Koga, H. Yamada, K. Oguri and<br />
H. Yoshimura. Metabolism in vivo of the tropane alkaloid,<br />
scopolamine, in several mammalian. Xenobiotica 21: 1289–1300<br />
(1991).<br />
26. H. Yamada, S. Wada, T. Yoshimitsu, T. Shimizudani, M. Yamamoto,<br />
S. Mitsunaga, K. Oguri, N. Koga, and H. Yoshimura. Metabolism of<br />
scopolamine in mammals. Japanese Journal of Forensic Toxicology<br />
10: 96–97 (1992).<br />
27. H.X. Chen, Y. Chen, H. Wang, P. Du, F.M. Han, and H.S. Zhang.<br />
Analysis of scopolamine and its eighteen metabolites in rat urine by<br />
liquid chromatography-tandem mass spectrometry. Talanta 67:<br />
984–91(2005).<br />
28. M. Hattori, Y.Z. Shu, M. Shimizu, T. Hayashi, N. Morita, K. Kobashi,<br />
G.J. Xu, and T. Namba. Metabolism of paeoniflorin and related<br />
compounds by human intestinal bacteria. Chem. Pharm. Bull. 33:<br />
3838–46 (1985).<br />
29. P. Dogterom. Development of a simple incubation system for<br />
metabolism studies with precision-cut liver slices. Drug Metab.<br />
Dispos. 21: 699–704(1993).<br />
30. D. An. Selected Topics on Modern Pharmaceutical Analysis. China<br />
Medical Scientific and Technical Press, Beijing, China, 2001, pp.<br />
624–26.<br />
31. P.Z. Cong. The Application of <strong>Mass</strong> Spectroscopy in Natural<br />
Organic Chemistry. Science Press, Beijing, China, 1997, pp.<br />
406–07.<br />
Manuscript received October 31, 2006;<br />
Revision received March 8, 2007.