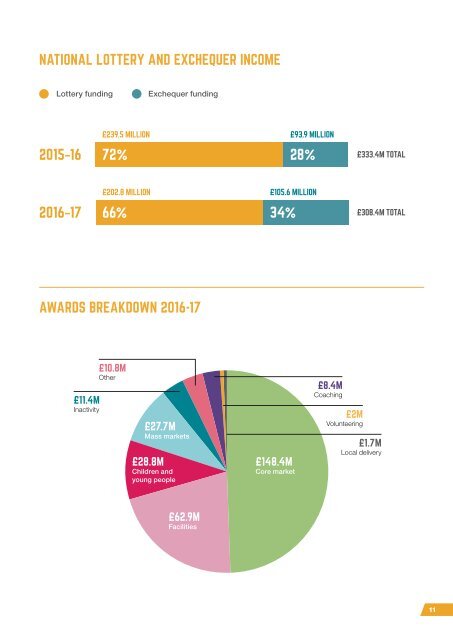
NATIONAL LOTTERY AND EXCHEQUER INCOME Lottery funding Exchequer funding 2015–16 £239.5 MILLION £93.9 MILLION 72% 28% £333.4M TOTAL <strong>2016</strong>–<strong>17</strong> £202.8 MILLION £105.6 MILLION 66% 34% £308.4M TOTAL AWARDS BREAKDOWN <strong>2016</strong>-<strong>17</strong> £11.4M Inactivity £10.8M Other £27.7M Mass markets £28.8M Children <strong>and</strong> young people £148.4M Core market £8.4M Coaching £2M Volunteering £1.7M Local delivery £62.9M Facilities 11
MOVING WITH NEW FOCUS IT’S BEEN A YEAR OF CHANGE FOR SPORT ENGLAND, BUT WE REMAINED FOCUSED ON OUR FUNDAMENTAL PURPOSE: GETTING MORE PEOPLE ACTIVE, INVESTING STRATEGICALLY, AND PROTECTING OUR PLAYING FIELDS Growing participation The number of regularly active people was the main performance indicator of our 2013-<strong>17</strong> strategy. Measured for the final time by the Active People Survey, results published in December <strong>2016</strong> showed that 15.97 million people aged 16 <strong>and</strong> over played <strong>sport</strong> for at least 30 minutes once a week between October 2015 <strong>and</strong> September <strong>2016</strong>. This is 229,400 more than between October 2014 <strong>and</strong> September 2015 – an increase largely driven by the number of women now getting active. This is higher than ever before, suggesting that our behaviour change campaign This Girl Can is having a sustained effect. It’s 1.88 million more people than when London won the right to host the 2012 Olympic <strong>and</strong> Paralympic Games back in 2005. While we welcome these results, we know there is more work to be done to increase overall levels of activity, with some areas of specific concern. The number of disabled people being active remains relatively flat, as it does with young people. Although there is long-term growth amongst those from a black, Asian <strong>and</strong> minority ethnic (BAME) background, results last year saw a slight dip. And the proportion of people from lower socioeconomic groups who play <strong>sport</strong> (26%) remains much lower than those from more affluent groups (39.5%). Our new strategy, with its commitment to tackling inactivity, will help us address this. Its success will be measured by our new participation survey, Active Lives. Like Active People, our Active Lives Survey will measure the number of people aged 16 <strong>and</strong> over who take part in <strong>sport</strong> <strong>and</strong> physical activity by age, location, background <strong>and</strong> type of activity. We’re currently developing an extension to Active Lives that will measure children’s engagement in <strong>sport</strong> <strong>and</strong> physical activity, covering topics like attitudes <strong>and</strong> behaviours towards <strong>sport</strong> <strong>and</strong> physical activity, physical literacy, <strong>and</strong> swimming proficiency. Data collection is planned to start in autumn 20<strong>17</strong>. Its new approach will enable us to measure some of the key performance indicators (KPIs) identified in the Government’s strategy. That includes inactivity, spectating <strong>and</strong> volunteering. ONCE A WEEK SPORT PARTICIPATION (1 X 30), millions 1 x 30 14+ year olds APS10 16,802,900 36.9% 16.76 16.66 16.62 16.72 16.80 Change since APS10Q2 +82,000 -0.1% APS9 +180,300 +0.2% APS7 +46,400 -0.6% 15.19 15.26 15.23 15.11 15.89 15.84 15.71 15.74 15.83 15.97 1 x 30 16+ year olds APS10 15,965,800 36.1% 14.08 Change since APS10Q2 +131,500 +0.0% APS9 +229,400 +0.3% APS1 +1,882,800 +1.5% Oct-06 Oct-08 Oct-09 Oct-10 Oct-11 Oct-12 Oct-13 Oct-14 Oct-15 April-16 Oct-16 APS1 APS2 APS3 APS4 APS5 APS6 APS7 APS8 APS9 APS10Q2 APS10