Creative Data Mining : Documentation of the teaching results from the Spring Semester 2017
Creative Data Mining : Documentation of the teaching results from the Spring Semester 2017
Creative Data Mining : Documentation of the teaching results from the Spring Semester 2017

You also want an ePaper? Increase the reach of your titles
YUMPU automatically turns print PDFs into web optimized ePapers that Google loves.
Besides, ano<strong>the</strong>r hypo<strong>the</strong>sis made in project is that people’s evaluation truly reflects noise level in<br />
decibel.<br />
Approach & Methods<br />
Since dataset is continuous and labeled, regression method is applied in project. Main procedures<br />
carried in project are listed following:<br />
1. Besides, Decided ano<strong>the</strong>r wea<strong>the</strong>r hypo<strong>the</strong>sis to use made noise in in project decibel is level that people’s or in evaluation evaluation level truly in survey reflects questions, noise level i.e. in does<br />
people’s decibel. evaluation on noise level truly corresponds to decibel level<br />
2. Searching potential variables related with security, both <strong>from</strong> visualization <strong>of</strong> data and linear<br />
regression method, i.e. single variable liner regression<br />
Approach & Methods<br />
3. Since Do multivariable dataset is continuous linear regression and labeled, to regression acquire a method simple is linear applied regression in project. model Main to procedures quantify security<br />
level carried in project are listed following:<br />
4. Check 1. Decided if <strong>the</strong> above wea<strong>the</strong>r linear to use model noise can in decibel simplified level or fur<strong>the</strong>r in evaluation to get level <strong>the</strong> most in survey crucial questions, parameters i.e. does<br />
people’s evaluation on noise level truly corresponds to decibel level<br />
2. Searching potential variables related with security, both <strong>from</strong> visualization <strong>of</strong> data and linear<br />
regression method, i.e. single variable liner regression<br />
3. Do multivariable linear regression to acquire a simple linear regression model to quantify<br />
Results & Discussion<br />
security level<br />
4. Check if <strong>the</strong> above linear model can be simplified fur<strong>the</strong>r to get <strong>the</strong> most crucial parameters<br />
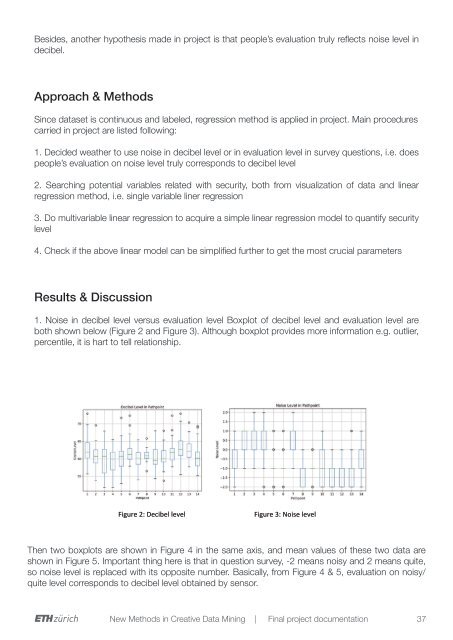
1. Noise in decibel level versus evaluation level Boxplot <strong>of</strong> decibel level and evaluation level are<br />
both shown below (Figure 2 and Figure 3). Although boxplot provides more information e.g. outlier,<br />
percentile, it is hart to tell relationship.<br />
Results & Discussion<br />
1. Noise in decibel level versus evaluation level<br />
Boxplot <strong>of</strong> decibel level and evaluation level are both shown below (Figure 2 and Figure 3).<br />
Although boxplot provides more information e.g. outlier, percentile, it is hart to tell relationship.<br />
Figure 2: Decibel level<br />
Figure 3: Noise level<br />
Then two boxplots are shown in Figure 4 in <strong>the</strong> same axis, and mean values <strong>of</strong> <strong>the</strong>se two data are<br />
shown in Figure 5. Important thing here is that in question survey, -2 means noisy and 2 means<br />
Then two<br />
quite,<br />
boxplots<br />
so noise<br />
are<br />
level<br />
shown<br />
is replaced<br />
in Figure<br />
with<br />
4 in<br />
its<br />
<strong>the</strong><br />
opposite<br />
same<br />
number.<br />
axis, and<br />
Basically,<br />
mean values<br />
<strong>from</strong> Figure<br />
<strong>of</strong> <strong>the</strong>se<br />
4 & 5,<br />
two data are<br />
shown in<br />
evaluation<br />
Figure 5. Important<br />
on noisy/quite<br />
thing<br />
level<br />
here<br />
corresponds<br />
is that in question<br />
to decibel<br />
survey,<br />
level obtained<br />
-2 means<br />
by sensor.<br />
noisy and 2 means quite,<br />
so noise level is replaced with its opposite number. Basically, <strong>from</strong> Figure 4 & 5, evaluation on noisy/<br />
quite level corresponds to decibel level obtained by sensor.<br />
New Methods in <strong>Creative</strong> <strong>Data</strong> <strong>Mining</strong> | Final project documentation<br />
37