Apple Environmental Responsibility Report

You also want an ePaper? Increase the reach of your titles
YUMPU automatically turns print PDFs into web optimized ePapers that Google loves.
8 billion<br />
Since our Clean Water Program began,<br />
we’ve helped our suppliers save more<br />
than 8 billion gallons of water—enough<br />
to provide every person on the planet<br />
with 18 glasses of water.<br />
The vast majority of our product water footprint is found in manufacturing,<br />
so in 2013 we established the supplier Clean Water Program to help our<br />
partners conserve water and prevent water pollution. We put a special<br />
emphasis on working with suppliers with high water usage and in water<br />
scarce regions, as well as makers of components that our life cycle water<br />
assessments have identified as particularly water-intensive. These<br />
life cycle assessments include water that’s consumed in energy production—<br />
such as for oil extraction, distillation, and processing—as well as nonenergy<br />
sources including water consumed during metals processing and<br />
product recycling. Through employee training, baseline assessments,<br />
performance evaluations, and technical support, we helped our suppliers<br />
conserve more than 3 billion gallons of water in 2016 alone, increasing<br />
average water reuse to 36 percent across 86 sites. And since many of our<br />
suppliers also build components for other companies, we’re reducing the<br />
water footprint of non-<strong>Apple</strong> products too.<br />
How we think about water.<br />
The impact of water use varies significantly depending on the watershed<br />
conditions where the water is being used. So we’ve continued to look<br />
at more sophisticated ways to measure and analyze our water use. The<br />
way we manage water is different based on the climate and nature of our<br />
operations across our facilities, whether it’s our data centers, corporate<br />
offices, manufacturing sites, or retail stores. We map our global water<br />
use against scarcity indicators. This analysis helps us prioritize our<br />
conservation efforts across our operations.<br />
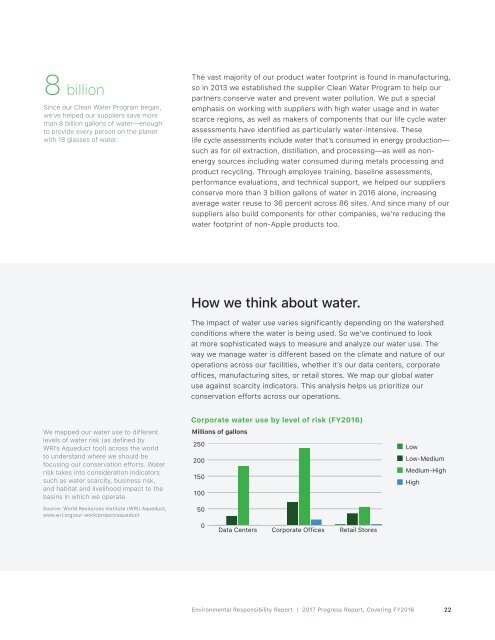
We mapped our water use to different<br />
levels of water risk (as defined by<br />
WRI’s Aqueduct tool) across the world<br />
to understand where we should be<br />
focusing our conservation efforts. Water<br />
risk takes into consideration indicators<br />
such as water scarcity, business risk,<br />
and habitat and livelihood impact to the<br />
basins in which we operate.<br />
Source: World Resources Institute (WRI) Aqueduct,<br />
www.wri.org/our-work/project/aqueduct<br />
Corporate water use by level of risk (FY2016)<br />
Millions of gallons<br />
250<br />
200<br />
150<br />
100<br />
50<br />
Low<br />
Low-Medium<br />
Medium-High<br />
High<br />
0<br />
Data Centers<br />
Corporate Offices<br />
Retail Stores<br />
<strong>Environmental</strong> <strong>Responsibility</strong> <strong>Report</strong> | 2017 Progress <strong>Report</strong>, Covering FY2016<br />
22