- Page 1 and 2:
Oppjl U. S. DEPARTMENT OF COMMERCE
- Page 3 and 4:
CONTENTS 1. AREA AND POPULATION Tab
- Page 5 and 6:
CONTENTS V Table Page 82. Deaths, f
- Page 7 and 8:
CONTENTS VII Table Page 155. Vetera
- Page 9 and 10:
CONTENTS tx Table Page 246. Federal
- Page 11 and 12:
CONTENTS X I Table Page 332. Securi
- Page 13 and 14:
CONTENTS X III Table Page 413. Old-
- Page 15 and 16:
CONTENTS XV Table Pago 498. Steam r
- Page 17 and 18:
CONTENTS X V II 24. IRRIGATION AND
- Page 19 and 20:
CONTENTS X IX Table Page 685. Barle
- Page 21 and 22:
CONTENTS X X I Table p age 793. Coa
- Page 23 and 24:
CONTENTS X X III Table Page 892. Co
- Page 25 and 26:
2 AREA AND POPULATION N o. 3 .— A
- Page 27 and 28:
4 A R E A AN D PO PU L A T IO N N o
- Page 29 and 30:
6 AREA A ND POPULATION N o. 8.-—
- Page 31 and 32:
8 ABBA AND POPULATION No. 11.— P
- Page 33 and 34:
10 AREA AND POPULATION No. 13.— P
- Page 35 and 36:
12 AREA AND POPULATION N o . 1 6 .
- Page 37 and 38:
14 AREA. AND POPULATION N o . 1 7 .
- Page 39 and 40:
1 6 AREA AND POPULATION No. 1 8 .
- Page 41 and 42:
1 8 AREA AND POPULATION No. 1 9 .
- Page 43 and 44:
2 0 AREA AND POPULATION N o. 2 1 .
- Page 45 and 46:
22 AREA AND POPULATION No. 2 4.—
- Page 47 and 48:
24 AEEA AND POPULATION N o . 2 4 .
- Page 49 and 50:
26 A R E A AN D PO PU L A T IO N No
- Page 51 and 52:
28 AREA AND POPULATION N o. 2 5 .
- Page 53 and 54:
30 A R E A A N D P O P U L A T IO N
- Page 55 and 56:
32 AREA AND POPULATION No. 26.-—P
- Page 57 and 58:
34 ABEA AND POPULATION No. 29.—P
- Page 59 and 60:
3 6 AREA AND POPULATION No. 8 1 .
- Page 61 and 62:
38 AREA AND POPULATION N o. 3 2 .
- Page 63 and 64:
40 a r e a a n d p o p u l a t i o
- Page 65 and 66:
42 AREA AND POPULATION N o. 3 5 .
- Page 67 and 68:
44 AREA AND POPULATION N o. 3 6 .
- Page 69 and 70:
46 ABBA AND PO PU L A T IO N N N o.
- Page 71 and 72:
4 8 A R E A AN D PO PU L A T IO N N
- Page 73 and 74:
50 AJREA AND PO PU L A T IO N N o.
- Page 75 and 76:
52 AREA AND POPULATION N o. 4f>.—
- Page 77 and 78:
54 AREA AND POPULATION No. 48.—I
- Page 79 and 80:
5 6 A R E A AN D PO PU L A T IO N N
- Page 81 and 82:
58 AREA AND PO PULA TIO N No 52.—
- Page 83 and 84:
6 0 AREA AND POPULATION No. 53.—
- Page 85 and 86:
62 AREA AND POPULATION No. 55.— G
- Page 87 and 88:
6 4 AREA AND POPULATION No. 55.—
- Page 89 and 90:
66 AREA AND POPULATION No. 55.-—
- Page 91 and 92:
68 AREA AND POPULATION No. 5 5 .—
- Page 93 and 94:
70 AREA AND POPULATION No. 55.— G
- Page 95 and 96:
7 2 AREA AND POPULATION No. 57.—
- Page 97 and 98:
7 4 DEFECTIVES AND DELINQUENTS No.
- Page 99 and 100:
76 DEFECTIVES AND DELINQUENTS N o.
- Page 101 and 102:
7 8 DEFECTIVES AND DELINQUENTS No.
- Page 103 and 104:
8 0 DEFECTIVES AND DELINQUENTS No.
- Page 105 and 106:
82 DEFECTIVES AND DELINQUENTS N o,
- Page 107 and 108:
84: VITAL STATISTICS No. 7 8 .— D
- Page 109:
N o. 8 2 .— D e a t h s , F r o m
- Page 112 and 113:
88 VITAL STATISTICS N o. 8 i . —
- Page 114 and 115:
9 0 VITAL STATISTICS N o . 8 6 .
- Page 116 and 117:
9 2 VITAL STATISTICS N o . 8 8 .—
- Page 118 and 119:
9 4 VITAL STATISTICS N o . 9 0 .
- Page 120 and 121:
9 6 VITAL STATISTICS No, 9 2 .—D
- Page 122 and 123:
9 8 VITAL STATISTICS No. 97.-— M
- Page 124 and 125:
100 IMMIGRATION, EMIGRATION, AND NA
- Page 126 and 127:
5. EDUCATION No. 113.— S c h o o
- Page 128 and 129:
n o EDUCATION No. 115.— T u a c h
- Page 130 and 131:
1 1 2 EDUCATION No. 1 1 7 .— S c
- Page 132 and 133:
1 1 4 EDUCATION N o. 120.— School
- Page 134 and 135:
116 EDUCATION No. 124.— I n s t i
- Page 136 and 137:
118 EDUCATION No. 125.— P r o f e
- Page 138 and 139:
1 2 0 EDUCATION N o . 1 2 7 . — I
- Page 140 and 141:
122 EDUCATION No. 1 2 9 . — R e s
- Page 142 and 143:
124 Ed u c a t i o n No. 181.—V o
- Page 144 and 145:
126 EDUCATION N o. 1 3 8 .— V o c
- Page 146 and 147:
128 EDUCATION No. 135.—V o catio
- Page 148 and 149:
1 3 0 PUBLIC! LANDS No. 138.— P u
- Page 150 and 151:
132 PUBLIC LANDS No. 142.— L a n
- Page 152 and 153:
134 PUBLIC LANDS N o . 1 4 4 .—Re
- Page 154 and 155:
7. CLIMATE No. 148.—C lim atic C
- Page 156 and 157:
1 3 8 CLIMATE N o . 1 4 8 .— C l
- Page 158 and 159:
140 CLIMATE No. 1 4 8 .— Climatic
- Page 160 and 161:
1 4 2 climate N o. 1 4 8 .— Clima
- Page 162 and 163:
144 CLIMATE N o. l - i 8 .— C l i
- Page 164 and 165:
1 4 6 c l im a t e N o. 14:8.— C
- Page 166 and 167:
1 4 8 CLIMATE N o. 1 4 8 .— C l i
- Page 168 and 169:
150 MILITARY AND CIVIL SERVICES, EL
- Page 170 and 171:
1 5 2 MILITARY AND CIVIL SERVICE'S,
- Page 172 and 173:
1 5 4 MILITARY AND CIVIL SERVICES,
- Page 174 and 175:
1 5 6 MILITARY AND CIVIL SERVICES,
- Page 176:
N o , 167.—-E m p lo y e e s i n
- Page 180 and 181:
160 MILITARY AND CIVIL SERVICES, EL
- Page 182 and 183:
1 6 2 MILITARY AND CIVIL SERVICES,
- Page 184 and 185:
1 6 4 MILITARY AND CIVIL SEN VICES,
- Page 186 and 187:
9. NATIONAL GOVERNMENT FINANCES G e
- Page 188 and 189:
168 NATIONAL GOVERNMENT FINANCES No
- Page 190 and 191:
1 7 0 NATIONAL GOVERNMENT FINANCES
- Page 192 and 193:
1 7 2 NATIONAL GOVERNMENT FINANCES
- Page 194 and 195:
174 NATIONAL GOVERNMENT FINANCES No
- Page 196 and 197:
1 7 6 NATIONAL GOVERNMENT FINANCES
- Page 198 and 199:
1 7 8 NATIONAL GOVERNMENT FINANCES
- Page 200 and 201:
1 8 0 NATIONAL GOVERNMENT FINANCES'
- Page 202 and 203:
182 NATIONAL GOVERNMENT FINANCES No
- Page 204 and 205:
1 8 4 NATIONAL GOVERNMENT FINANCES
- Page 206 and 207:
186 UATIOHAL GOVERNMENT FINANCES No
- Page 208 and 209:
18S NATIONAL GOVERNMENT FINANCES No
- Page 210 and 211:
1 9 0 NATIONAL GOVERNMENT FINANCES
- Page 212 and 213:
1 9 2 NATIONAL SOVEENMESra: FINANCE
- Page 214 and 215:
1 9 4 NATIONAL GOVERNMENT FINANCES
- Page 216 and 217:
1 9 6 NATIONAL GOVERNMENT FINANCES
- Page 218 and 219:
1 9 8 NATIONAL GOVERNMENT FINANCES
- Page 220 and 221:
2 0 0 NATIONAL GOVERNMENT FINANCES
- Page 222 and 223:
202 NATIONAL GOVEBNMENT FINANCES No
- Page 224 and 225:
2 0 4 NATIONAL GOVEENM1ENT FINANCES
- Page 226:
N o . 2 0 6 .—E s ta te T ax R et
- Page 229 and 230:
208 NATIONAL GOVERNMENT FINANCES N
- Page 231 and 232:
2 1 0 NATIONAL GOVERNMENT FINANCES
- Page 233 and 234:
2 1 2 NATIONAL GOVERNMENT FINANCES'
- Page 235 and 236:
10. STATE AND LOCAL GOVERNMENT FINA
- Page 237 and 238:
216 STATE AND LOCAL FINANCES AND EM
- Page 239 and 240:
2 1 8 STATE AND LOCAL FINANCES AND
- Page 241 and 242:
2 2 0 STATE AND LOCAL FINANCES AND
- Page 243 and 244:
222 STATE AND LOCAL FINANCES AND EM
- Page 245 and 246:
224 STATE AND LOCAL FINANCES! AND E
- Page 247 and 248:
226 STATE AND LOCAL FINANCES AND EM
- Page 249 and 250:
2 2 8 STATE AND LOCAL FINANCES AND
- Page 251 and 252:
230 STATE AND LOCAL FINANCES AND EM
- Page 253 and 254:
2 3 2 STATE AND LOCAL FINANCES AND
- Page 255 and 256:
i 2 3 4 STATE AND LOCAL FINANCES AN
- Page 258 and 259:
236 STATE AND LOCAL FINANCES AND EM
- Page 260 and 261:
2 3 8 STATES AND iLOOAL FINANCES AN
- Page 262 and 263:
PERIOD 1OR CALENDAR YEAR 3793-3800-
- Page 264 and 265:
2 4 2 BACKING AOT FINANCE No. 24=4
- Page 266 and 267:
2 4 4 BANKING AND FINANCE N o. 2 4
- Page 268 and 269:
i i 246 BANKING AND FINANCE No. 249
- Page 270 and 271:
2 4 8 BANKING AND FINANCE N o , F e
- Page 272 and 273:
2 5 0 BANKING AND FINANCE No. 2 5 6
- Page 274:
1 9 3 9 ( D e c . 3 0 ) . . . . 1 2
- Page 278 and 279:
254 BACKING AND FINANCE No. 2 6 1 .
- Page 280 and 281:
256 BACKING AND' FINANCE N o. 264;.
- Page 282 and 283:
258 BANKING AND FINANCE No. 26A.—
- Page 284 and 285:
2 6 0 BANKING AND PINANQE N o . 2 6
- Page 286 and 287:
262 BANKING AND O TANO B No. 2 6 9
- Page 288 and 289:
2 6 4 BACKING AND FINANCE N o. 2 7
- Page 290 and 291:
266 BANKING AND FINANCE N o . 2 7 5
- Page 292 and 293:
268 BANKING AND FINANCE No. 279.—
- Page 294 and 295:
270 b a n k in g a n d f in a n c e
- Page 296 and 297:
2 7 2 BANKING AND FINANCE No. 286.
- Page 298 and 299:
274 BANKING Altf) FIKANCEl No. 2 8
- Page 300 and 301:
276 BAHIUH-G AND F IN A N C E No. 2
- Page 302 and 303:
278 BANKING AND I-TNANCK No. 295.
- Page 304 and 305:
2 8 0 BANKING AND FINANCE No. 2 9 8
- Page 306 and 307: 2 8 2 BANKING AND FINANCE No. 3 0 2
- Page 308 and 309: 2 8 4 BANKING AND FINANCE N o 3 0 7
- Page 310 and 311: 2 8 6 BANKING ASH STOANGE N o. 3 0
- Page 313 and 314: 2 8 8 BANICING AND FINANCE N o . 3
- Page 315 and 316: 2 9 0 BANKING AND FINANCE N o. 3 1
- Page 317 and 318: 2 9 2 BACKING AND FINANCE No. 314;.
- Page 319 and 320: 2 9 4 BAK ICING AND F IN A N C E N
- Page 321 and 322: 2 9 6 B A N K IN G AND F IN A N C E
- Page 323 and 324: 298 B A N K IN G AND F IN A N C E N
- Page 325 and 326: 3 0 0 BANKING AND FINANCE N o. 3 2
- Page 327 and 328: 3 0 2 BANKING AND FINANCE N o. 3 2
- Page 329 and 330: 3 0 4 BANKING AND FINANCE No, 3 8 1
- Page 331 and 332: 306 BANKING AND DISTANCE No. 3 3 7
- Page 333 and 334: 3 0 8 BANKING AND FINANCE N o , 341
- Page 335 and 336: 3 1 0 BANKING AND FINANCE No. 34,4.
- Page 337 and 338: 3 1 2 BANKING AND FINANCE No. 348.
- Page 339 and 340: 13. INCOME, EXPENDITURES, AND DEBT
- Page 341 and 342: 3 1 6 INCOME, EXPENDITURES, AND DEB
- Page 343: No. 3 5 6 .— C o n s u m e r E x
- Page 346: No. 3 5 8 .—N et Debt in the U n
- Page 350 and 351: 13. PRICES General Note.—T he who
- Page 352 and 353: 3 2 4 prices No. 363.— P r i c e
- Page 354 and 355: 326 p ric e s No, 3 6 5 ,— Prices
- Page 358 and 359: 3 3 0 PBICES N o . 8 6 9 .— C o s
- Page 360 and 361: 332 p e i o e s No. 871.—Prices,
- Page 363: No. 373.— U n i t V a l u e s , A
- Page 367 and 368: 14. WAGES, HOURS OF LABOR, AND EMPL
- Page 369 and 370: 3 3 8 WAGES, HOUKS, AND EMPLOYMENT
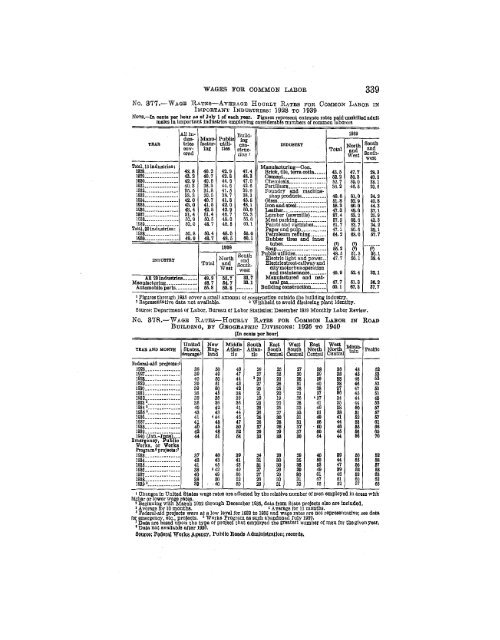
- Page 371 and 372: 3 4 0 .m dE-s, hoiues, a k b e m pl
- Page 373 and 374: 3 4 2 wages, h oGb s, Aim employm e
- Page 375 and 376: 3 4 4 WAGES, HOURS, AND EMPLOYMENT
- Page 377 and 378: 3 4 6 WAGES', HOURS, AND e m plo y
- Page 379 and 380: 3 4 8 W A G ES, HOTJBS, AND E M P L
- Page 381 and 382: 3 5 0 WAGES, HOURS, AND EMPLOYMENT
- Page 383 and 384: 3 5 2 WAGES, HOURS, AND EMPLOYMENT
- Page 385 and 386: 3 5 4 WAGES, HOURS, AND EMPLOYMENT
- Page 388 and 389: 3 5 6 WAGES, HOURS, AHD EMPLOYMENT
- Page 390 and 391: 358 WAGES', HOURS, AND EMPLOYMENT N
- Page 392 and 393: 360 WAGES, HOURS, AND EMPLOYMENT No
- Page 395 and 396: N o. 399. - —P u b lic E m ploym
- Page 397: Idaho................... . Illinois
- Page 400 and 401: P U B L IC E M P L O Y M E N T SERV
- Page 402 and 403: 'OLD-iAGE INSURANCE 367 No. 4 0 1 .
- Page 404 and 405: OLD-AGE INSXTRANOE 369 N o . 4 0 2
- Page 406 and 407:
OLD-AGE INSURANCE 371 N o . 4 0 4 :
- Page 408 and 409:
I'IVKMrLOYMKX-I o o m p m sa t io #
- Page 410 and 411:
UNEM PLOYM ENT COMPENSATION 375 No.
- Page 412 and 413:
PUBLIC ASSISTANCE 377 N o . 4 1 1 .
- Page 415 and 416:
PUBLIC ASSISTANCE 3 7 9 N o. 4=12.
- Page 417 and 418:
PUBLIC ASSISTANCE 381 N o . 4 1 5 .
- Page 419 and 420:
FEDERAL GRANTS TO STATES 383 N o. 4
- Page 421 and 422:
RAILROAD RETIRRMEUT SYSTEM 385 N o
- Page 423 and 424:
RAILROAD RETIREMENT SYSTEM 387 No.
- Page 425 and 426:
16. POSTAL SERVICE [Postal statisti
- Page 427 and 428:
POSTAL SERVICE 391 No. 426.—P o s
- Page 429 and 430:
'POSTAL SERVICE 393 No. 430.— P o
- Page 431 and 432:
TELEPHONE SYSTEMS 395 No. 4 3 2 .
- Page 433 and 434:
TELEPHONE SYSTEMS 3 9 7 N o . T 3 6
- Page 435:
No. T 4 0 - — T e l e g r a p h :
- Page 438 and 439:
ELECTRIC LIGHT AND POWER 401 N o .
- Page 440 and 441:
ELECTRIC L IG H T AND POWER 403 N o
- Page 442 and 443:
e l e c t r ic l ig h t a n d p o w
- Page 444 and 445:
ELECTRIC! L IG H T AND POW ER 407 N
- Page 446 and 447:
ELECTRIC LIGHT AND POWER 4 0 9 No.
- Page 448 and 449:
WATER POWER 4ii N o . 4 5 7 .— W
- Page 450 and 451:
STATE-HIGHWAY MILEAGE 4 1 3 N o. 4
- Page 452 and 453:
STATE-HIGHWAY FUNDS 4 1 6 No. 461.
- Page 454 and 455:
MOTOR-VEHICLE SALES AND REGISTRATIO
- Page 456 and 457:
MOTOR-VEHICLE REGISTRATIONS. 410 N
- Page 458 and 459:
MOTOR-VEHICLE FATALITIES 4 2 1 No.
- Page 460 and 461:
MOTOR-VEHICLE FATALITIES 423 ' No.
- Page 462 and 463:
STEAM RAILWAYS 4 2 5 No. 4=72.— S
- Page 464 and 465:
STEAM r a ilw a y s 427 N o. 4 7 5
- Page 466 and 467:
STEAM RAILWAYS' 429 No. 479.—S t
- Page 468 and 469:
STEAM RAILWAYS 431 No, 482.— S t
- Page 470 and 471:
STEAM RAILWAYS 433 No. 4 8 6 .— S
- Page 472 and 473:
STEAM RAILWAYS 435 No. 4 8 8 .— S
- Page 474 and 475:
STEAM RAILWAYS 4 3 7 N o . 4 9 0 .
- Page 476 and 477:
STEAM RAILWAYS 4 3 9 N o. 4 9 2 .
- Page 478:
,90Ii9S' N o . 4 9 4 .-— S t e a
- Page 482:
Manufactures and miscellaneous, tot
- Page 485 and 486:
STEAM RAILWAYS 445 N o. 4 9 6 .—
- Page 487 and 488:
STEAM RAILWAYS 447 N o. A 9 9 .—
- Page 489 and 490:
ELBOTKIO RAILWAYS' 4 4 9 No. 5 0 3
- Page 491 and 492:
ELECTRIC RAILWAYS' 451 N o . SO B .
- Page 493 and 494:
TROLLEY-BUS LINES' 453 N o. 5 0 9 .
- Page 495 and 496:
MOtEOEiSUS I.TXES 455 N o . 5 1 2 .
- Page 497 and 498:
CIVIL AERONAUTICS 457 No. 5 1 4 .
- Page 499 and 500:
WATER TRAFFIC 4 5 9 N o. 5 1 6 .—
- Page 501 and 502:
IIFTERNAL WAYIEfft WAYS' 4 6 1 No.
- Page 503 and 504:
MERCHANT MARINE 4 6 3 N o . 5 2 2 .
- Page 505 and 506:
m e r c h a n t m a r in e 465 N o.
- Page 507 and 508:
PANAMA. CANAL— DISASTERS TO' VESS
- Page 509 and 510:
WATER-BORNE FOREIGN COMMERCE 469 No
- Page 511 and 512:
WATEB-BORNE FOREIGN COMMERCE 471 N
- Page 513 and 514:
WATER-BORNE FOREIGN COMMERCE 473 N
- Page 515 and 516:
Wa ter-borne EOREION COMMERCE 475 N
- Page 517 and 518:
TONNAGE ENTERED AND CLEARED 477 N o
- Page 519 and 520:
TONNAGE ENTERED' AND CI.EaIIEU 4 7
- Page 521 and 522:
TONNAGE- ENTERED AND .CLEARED 481 N
- Page 523 and 524:
n. FOREIGN COMMERCE OF THE UNITED S
- Page 525 and 526:
INTERNATIONAL TRANSACTIONS 485 N o.
- Page 527 and 528:
FOREIGN COMMERCE 487 No. 5 5 2 .—
- Page 529 and 530:
FOREIGN COMMERCE 4 8 9 No. 5 5 4 .
- Page 531 and 532:
FOREIGN COMMERCE 491 No. 5 5 7 .—
- Page 533 and 534:
FOREIGN COMMERCE 4 9 3 M e r c h a
- Page 535 and 536:
Se l e c t e d C o m m o d it ie s
- Page 537 and 538:
FOREIGN COMMERCE m No. 5 6 1 . —
- Page 539 and 540:
FOREIGN COMMERCE 4 9 9 a n d I m p
- Page 541 and 542:
FOREIGN COMMERCE 501 a n d P ercent
- Page 543 and 544:
FOREIGN COMMERCE 503 No. 5 6 5 .—
- Page 545 and 546:
FOREIGN COMMERCE 5 0 5 I m p o r t
- Page 547 and 548:
FOREIGN COMMERCE 507 N o. 5 6 9 .
- Page 549 and 550:
F O R E IG N C O M M E R C E 509 c
- Page 551 and 552:
FOREIGN COMMERCE 511 M e r c h a n
- Page 553 and 554:
FOREIGN COMMERCE 513 M e r c h a n
- Page 555 and 556:
FOREIGN COMMERCE 515 No. 5 7 2 .—
- Page 557 and 558:
FOREIGN COMMERCE 517 No. 5 7 3 .—
- Page 559 and 560:
FOREIGN COMMERCE 5 1 9 No. 5 7 4 .
- Page 561:
N o . 5 T 5 * — E x p o r t s o p
- Page 565:
Cod, haddock, hake, pollock, cask..
- Page 569:
Leather belting, new_______________
- Page 573:
Cottonseed c a k e ......__________
- Page 577:
Coconut oil, edible__ ..___________
- Page 581:
t>tmx rosin________________________
- Page 585:
Upland (under 1H inches)--— -—
- Page 589:
Printcloth: Bleached........... ...
- Page 593:
267706°— 41- cc a Other fabricat
- Page 597 and 598:
Dresses, skirts, blouses, and other
- Page 599:
No. 575.— E x p o b t s o f U n i
- Page 603:
N o . 5 7 5 .— E x p o r t s o p
- Page 607:
N o . 5 7 5 . — E x p o r t s o f
- Page 611:
N o . 5 7 5 .— E x p o r t s o p
- Page 615:
N o . 5 7 5 .— E x p o r t s o f
- Page 618 and 619:
31, 880 } 2,149 / 753 1,278 2,702 1
- Page 621:
Axes (broad and band)..............
- Page 625:
2G770G CO Pipe fittings and valves_
- Page 629:
F u ses.-............- ............
- Page 633:
Locomotives— _____— ------- do
- Page 637:
Forging machinery and parts_______
- Page 641:
Laundry machinery: Power-driven lau
- Page 645:
Other agricultural machinery, imple
- Page 649:
G r o u p S.—C h e m ic a l s a n
- Page 653:
Pyroxylin scrap and film scrap_____
- Page 657:
90iA9ij Kalsomme or cold-water pain
- Page 661:
Exposed____________________________
- Page 665:
Explosive shells and projectiles___
- Page 669:
N o. 576.— I m p o s t s o f M e
- Page 673:
Caviar and other fish roe__________
- Page 677:
c. Other bovine leather____________
- Page 681:
F, Other ft.-tti-mfl.1a and animal
- Page 685:
Other vegetables, fresh, n. e. s___
- Page 689:
267706 P. Cocoa, coffee, and tea___
- Page 693 and 694:
Chicle, erode_____________ - Balsam
- Page 695:
N o . 5 7 6 . — I m p o r t s o p
- Page 698 and 699:
3,990 26,886 11,132 2,073 2,620 11,
- Page 701:
Tapestries and other Jacquard woven
- Page 705:
M a n u fa c tu r e s of— l i m ,
- Page 709:
Fabrics oyer 30 inches wide— * 3,
- Page 713:
B. Wood semimanufactures—sawmill
- Page 717:
Cigarette paper, cigarette books an
- Page 721:
2 6 7 7 0 6 i£o China and porcelai
- Page 725:
Wire rods----- --------------------
- Page 729:
Unrefined, black, blister and conve
- Page 733:
Vacuum cleaners and parts **----- -
- Page 737 and 738:
Ammonium compounds— Chloride (mur
- Page 739:
No. 576.— I m p o r t s o p M e r
- Page 743:
No. 5 7 6 .—Imports op Merchandis
- Page 747 and 748:
614 FOREIGN COMMERCE No. 577.-—In
- Page 749 and 750:
6 1 6 COMMERCE OF NONOONTIGTJ'OTJS
- Page 751 and 752:
6 1 8 COMMERCE >03? NONCONTIGUOUS T
- Page 753 and 754:
6 2 0 ■COMMERCE OF NONCONTIGUOUS
- Page 755 and 756:
34. IRRIGATION AND DRAINAGE G e n e
- Page 757 and 758:
6 2 4 IRRIGATION AND DRAINAGE N o.
- Page 759 and 760:
6 2 6 IRRIGATION AND DRAINAGE N o .
- Page 761 and 762:
6 2 8 IRRIGATION AND DRAINAGE N o.
- Page 763 and 764:
6 3 0 IRRIGATION AND DRAINAGE N o.
- Page 765 and 766:
35. FARMS—GENERAL STATISTICS [D a
- Page 767 and 768:
636 FARMS— GENERAL STATISTICS No.
- Page 769 and 770:
6 3 8 FARMS— GENERAL STATISTICS'
- Page 771 and 772:
6 4 0 FABMS— GENERAL STATISTICS
- Page 773 and 774:
6 4 2 FARMS'— GENERAL STATISTICS'
- Page 775 and 776:
6 4 4 FARMS— GENERAL STATISTICS'
- Page 777 and 778:
6 4 6 FARMS— GENERAL STATISTICS N
- Page 779 and 780:
6 4 8 FARMS— GENERAL STATISTICS N
- Page 781 and 782:
6 5 0 FARMS— GENERAL STATISTICS'
- Page 783 and 784:
6 5 2 FARMS— GENERAL STATISTICS'
- Page 785 and 786:
6 5 4 FARMS— GENERAL STATISTICS N
- Page 787 and 788:
656 FARMS--- GENERAL STATISTICS' No
- Page 789:
No. 6 2 3 .—P ast-T ime W ork off
- Page 792 and 793:
6 6 0 FARMS— GENERAL STATISTICS N
- Page 794 and 795:
662 FARMS— GENERAL STATISTICS N o
- Page 796 and 797:
6 6 4 FARMS— GENERAL STATISTICS'
- Page 798 and 799:
6 6 6 FARMS— GENERAL STATISTICS N
- Page 800 and 801:
36. FARM PRODUCTION AND RELATED STA
- Page 802 and 803:
6 7 0 FARM PRODUCTION AND RELATED S
- Page 804 and 805:
6 7 2 FARM PRODUCTION AND RELATED S
- Page 806 and 807:
6 7 4 FARM PRODUCTION AND RELATED S
- Page 808 and 809:
27. FARM ANIMALS AND ANIMAL PRODUCT
- Page 810 and 811:
6 7 8 HARM A N IM A LS AND A N IM A
- Page 812 and 813:
6 8 0 FARM ANIMALS AND ANIMAL PRODU
- Page 814 and 815:
6 8 2 BAUM ANIMALS AMD AKTMAL PRODU
- Page 816 and 817:
6 8 4 FARM ANIMALS AND ANIMAL PRODU
- Page 818 and 819:
6 8 6 FARM ANIMALS AND ANIMAL PRODU
- Page 820 and 821:
6 8 8 FA.11M ANIMALS AND ANIMAL PRO
- Page 822 and 823:
690 FARM ANIMALS AND ANIMAL PRODUCT
- Page 824 and 825:
6 9 2 FARM ANIMALS AND ANIMAL PRODU
- Page 826 and 827:
6 9 4 I’ARM ANIMALS AND ANIMAL Lk
- Page 828:
N o. 6 7 5 - — C r o p s — A c
- Page 832 and 833:
6 9 8 FARM CROPS AND FOODSTUFFS' N
- Page 834 and 835:
7 0 0 I’ABM CROPS AND FOODSTUFFS
- Page 836 and 837:
7 0 2 FARM CROPS -AND FOODSTUFFS N
- Page 838 and 839:
7 0 4 FARM CROPS AND FOODSTUFFS No.
- Page 840 and 841:
7 0 6 FARM CROPS AND FOODSTUFFS No.
- Page 842 and 843:
7 0 8 FARM CROPS AND FOODSTUFFS N o
- Page 844 and 845:
710 FARM CRO'PS AND FOODSTUFFS 1 No
- Page 846 and 847:
7 1 2 FAHM CHOPS AND FOODSTUFFS' No
- Page 848 and 849:
7 1 4 farm: chops and foodstuffs No
- Page 850 and 851:
7 1 6 FARM CROPS AND FOODSTUFFS No.
- Page 852 and 853:
7 1 8 farm crops a nd fo o d st u f
- Page 854 and 855:
7 2 0 FARM CROPS AND FOODSTUFFS N o
- Page 856 and 857:
722 FARM CROPS AND FOODSTUFFS No. 6
- Page 858 and 859:
7 2 4 FARM CROPS AMD FOODSTUFFS' N
- Page 860 and 861:
7 2 6 FARM CROPS AND FOODSTUFFS' N
- Page 862 and 863:
7 2 8 FARM CROPS ADD FOODSTUFFS N o
- Page 864:
N o . TO T. C o t t o n s e e d a n
- Page 867 and 868:
7 3 2 l?ARM CROPS AND POODSTUPPS N
- Page 869 and 870:
7 3 4 FARM CROPS AND FOODSTUFFS YEA
- Page 871 and 872:
7 3 6 FARM CROPS AND FOODSTUFFS No.
- Page 873 and 874:
7 3 8 FARM CROPS AND FO O D ST U FF
- Page 875 and 876:
2 9 . F O R E S T S A N D F O R E S
- Page 877 and 878:
7 4 2 FOBEStTS A N D f o r e s t p
- Page 879 and 880:
7 4 4 FORESTS AND FOREST PRODUCTS N
- Page 881 and 882:
7 4 6 FORESTS AND FOREST PRODUCTS'
- Page 883 and 884:
7 4 8 FORESTS AND' FOREST PRODUCTS
- Page 885 and 886:
750 FORESTS AND FOREST PRODUCTS N o
- Page 887 and 888:
7 5 2 FISHERIES! N o, 74:3.— F i
- Page 889 and 890:
7 5 4 FISHERIES No. 746.— F i s h
- Page 891 and 892:
7 5 6 FISHEBIES No. 750.— S a lm
- Page 893 and 894:
758 MINING AND MINERAL DRODUOT& No.
- Page 895 and 896:
7 6 0 MINING AND MINERAL PRODUCTS'
- Page 897 and 898:
7 6 2 MINING AND MINERAL PRODUCTS N
- Page 899:
N o . 7 6 2 .— M in e r a l P r o
- Page 903:
No. 762.—M i n e r a l P r o d u
- Page 907 and 908:
7 6 8 MINING AND MINERAL PRODUCTS N
- Page 909 and 910:
770 M tin n s rG a n d m in e ral p
- Page 911 and 912:
7 7 2 MINING AND MINERAL PROD'UOTS
- Page 913 and 914:
7 7 4 MINING AND MINERAL FRODTPOTS
- Page 915 and 916:
7 7 6 MIKING AND MINEDAX, PRODUCTS'
- Page 917 and 918:
778 MISTING AND MINERAL PRODG'OTS N
- Page 919 and 920:
780 MINING AND MINERAL PRODUCTS No.
- Page 921 and 922:
7 8 2 MINING AND MINERAL PRODUCTS'
- Page 923 and 924:
7 8 4 MINING AND MINERAL PRODUCTS1
- Page 925 and 926:
7 8 6 MINING AND MINEBAL PRODUCTS N
- Page 927 and 928:
7 8 8 MINING AND MINERAL PRODUCTS N
- Page 929 and 930:
7 9 0 MINING AND MINERAL PRODUCTS N
- Page 931 and 932:
7 9 2 MINING AND MINERAL PRODUCTS'
- Page 933 and 934:
7 9 4 MINING AND MINERAL PRODUCTS N
- Page 935 and 936:
796 MINING AND MINERAL PRODUCTS No.
- Page 937 and 938:
7 9 8 MINTING AND MINERAL EROD'UCTS
- Page 939 and 940:
800 MISTING AND MINERAL PRODUCTS' N
- Page 941 and 942:
32. MANUFACTURES [Statistics in thi
- Page 943 and 944:
8 0 4 MANUBA.CTU.EES N o . 829.—I
- Page 945 and 946:
8 0 6 MANTJFACTUiRES N o . 8 3 0 .
- Page 947 and 948:
8 0 8 M A N U m C T U 'R E S N o .
- Page 949 and 950:
8 1 0 MAHTOAOTtJ'RES No, 8 3 0 ,—
- Page 951 and 952:
8 1 2 MANUFACTURES N o . 8 8 0 .
- Page 953 and 954:
8 1 4 m a n u f a c t u r e s N o.
- Page 955 and 956:
8 1 6 MANUFACTURES N o . 8 3 0 .—
- Page 957 and 958:
8 1 8 MANUFACTURES No. 8 3 0 .— M
- Page 959 and 960:
8 2 0 M A N O TIA CTU BES N o . 8 3
- Page 961 and 962:
8 2 2 M A N U FA C T U R E S No. 8
- Page 963 and 964:
8 2 4 MANUFACTURES N o. 8 3 0 .—
- Page 965 and 966:
8 2 6 M A N U FA C T U R E S N o. 8
- Page 967 and 968:
8 2 8 Ma n u fa c t u r e s N o . 8
- Page 969 and 970:
8 3 0 MANUFACTURES No. 830.— M a
- Page 971 and 972:
8 3 2 MAKUMACTtmEs N o . 8 8 0 .—
- Page 973 and 974:
8 3 4 MANTimCTUKES N o. 8 8 0 .—
- Page 975 and 976:
8 3 6 m a n u fa c t u r e s N o .
- Page 977 and 978:
8 3 8 MANUFACTURES N o. 8 3 0 .' M
- Page 979 and 980:
8 4 0 M A ^U FlA .C ’TUEiES N o .
- Page 981 and 982:
8 4 2 M A N U F A C T U R E S No. 8
- Page 983 and 984:
8 4 4 MAsruriiOTtrcEtEs No. 8 3 3 .
- Page 985 and 986:
8 4 6 MANUFACTURES No. 837.— C h
- Page 987 and 988:
8 4 8 MANUFACTURE'S No. 8 8 8 .—
- Page 989 and 990:
8 5 0 MANUFACTURES N o . 8 3 9 .—
- Page 991 and 992:
852 MANUEtAOTURES .' ' ;a* No. 8 4
- Page 993 and 994:
8 5 4 MAmritAOT-U'EBS N o . 8 4 5 .
- Page 995 and 996:
8 5 6 M A IT U 1?1A .C T T J'K E S
- Page 997 and 998:
8 5 8 MANUFIACTU'KGS N o . 8 5 0 .
- Page 999 and 1000:
8 6 0 MANUFACTURES No. 853.— C o
- Page 1001 and 1002:
862 mah-upiagtuie.es No. 8 5 7 .—
- Page 1003 and 1004:
8 6 4 M A N U F A C T U R E S No. 8
- Page 1005 and 1006:
S3. DISTRIBUTION, SERVICES, AND HOT
- Page 1007 and 1008:
868 D IS T R IB U T IO N , S M V IC
- Page 1009 and 1010:
8 7 0 BIBTBIBtmOH) 'SBBYIOBS, AND-
- Page 1011 and 1012:
8 7 2 DISTRIBUTION, SERVICES, AND H
- Page 1013 and 1014:
8 7 4 d i s t r i b u t i o n , s e
- Page 1015 and 1016:
8 7 6 DISTRIBUTION, SERVICES, AND H
- Page 1017 and 1018:
8 7 8 ’ DISTRIBUTION, SERVICES, A
- Page 1019 and 1020:
8 8 0 DISTRIBUTION, SERVICES, AND H
- Page 1021 and 1022:
8 8 2 DISTRIBUTION, SERVICES, AND H
- Page 1023 and 1024:
8 8 4 DISTRIBUTION, SERVICES, AND H
- Page 1025 and 1026:
886 DISTRIBUTION, SE'RYIOES, AND HO
- Page 1027 and 1028:
888 DISTRIBUTION, SERVICES, AND HOT
- Page 1029 and 1030:
890 DISTRIBUTION, SERVICES, AND HOT
- Page 1031 and 1032:
8 9 2 DISTRIBUTION, SERVICES,. AND
- Page 1033 and 1034:
8 9 4 'OONsmucTioN and s o u s in g
- Page 1035 and 1036:
8 9 6 OONST&UCJTION AND HOUSING No.
- Page 1037 and 1038:
8 9 8 CONSTRUCTION AND HOUSING No.
- Page 1039 and 1040:
900 C o n s t r u c t i o n a n d h
- Page 1041 and 1042:
9 0 2 _ CONSTRUCTION AND HOUSING N
- Page 1043 and 1044:
9 0 4 CONSTRUCTION AND' HOUSING N o
- Page 1045 and 1046:
9 0 6 CONSTRUCTION AND HOUSING N o
- Page 1047 and 1048:
9 0 8 CONSTRUCTION AND HOUSING N o.
- Page 1049 and 1050:
35. NATIONAL PARK SYSTEM AND RECREA
- Page 1051 and 1052:
9 1 2 NATIONAL PARK SYSTEM No. 9 0
- Page 1053 and 1054:
9 1 4 NATIONAL PARK SYSTEM N o. 9 0
- Page 1055 and 1056:
9 1 6 NATIONAL PARK SYSTEM N o. 9 0
- Page 1057 and 1058:
36. SUPPLEMENTAL STATISTICS FOR OUT
- Page 1059 and 1060:
920 OUTLYING TERRITORIES AND POSSES
- Page 1061 and 1062:
9 2 2 OUTLYING THRBITOEIES AND POSS
- Page 1063 and 1064:
9 2 4 outlying territo ries and d o
- Page 1065 and 1066:
INDEX Abrasives: Foreign trade.....
- Page 1067 and 1068:
Bakeries: Page Employees.... ......
- Page 1069 and 1070:
Broomcorn: Page Acreage, production
- Page 1071 and 1072:
Page China firing and decorating, s
- Page 1073 and 1074:
Com meal—Continued. Page Received
- Page 1075 and 1076:
Education—Continued. Page Institu
- Page 1077 and 1078:
Federal Farm Mortgage Oorp.—Conti
- Page 1079 and 1080:
Page Preach Indo-China, trade with
- Page 1081 and 1082:
Hawaii: Area and date of accession.
- Page 1083 and 1084:
Pago Jamaica, trade with United Sta
- Page 1085 and 1086:
INDEX 9 4 7 Machinery—Continued.
- Page 1087 and 1088:
Motor vehicles—Continued. Tago !
- Page 1089 and 1090:
Paper and manufactures—Continued.
- Page 1091 and 1092:
Potatoes—Continued. Page Irish—
- Page 1093 and 1094:
Real estate—Continued. Pa8e Taxes
- Page 1095 and 1096:
Page Shellac, import prices........
- Page 1097 and 1098:
Sugar beets—Continued* Farm price
- Page 1099 and 1100:
Page Trust activities of national b
- Page 1101:
Wheat—Continued. Page Prices—Co