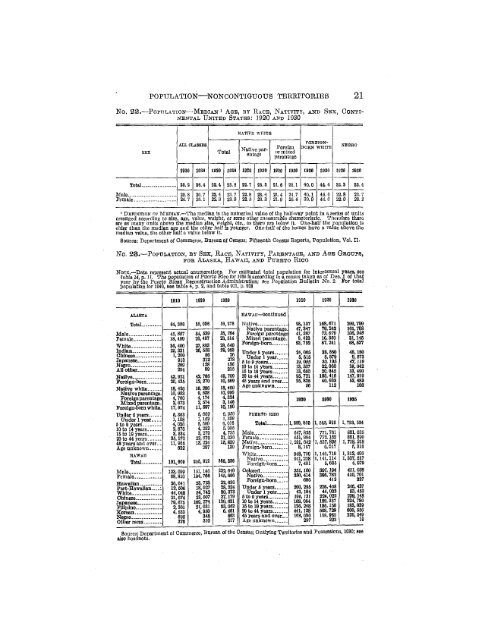
POPULATION— NONCONTIGUOUS TERRITO RIES 21 No, 3 2 .— P opulation— Median 1 Age, by Race, Nativity, and Sex, Continental <strong>United</strong> <strong>States</strong>: 1920 and 1930 N A TIV E W H IT E S E X A LL CLASSES Total Native par* entago Foreign o r mixed parentage P O R E IG N - B O R N WHITE N E G R O 1 020 1030 1 0 2 0 1 030 1 020 1 9 3 0 1920 1030 1 9 2 0 mo m o 1 0 3 0 Total...... ................. 2 6 .2 0 6 . 4 2 2 . 4 2 3 .8 2 2 .7 2 3 . 3 2 1 .6 2 5 .1 4 0 . 0 4 4 . 4 3 2 .3 2 3 . 4 Male. ............................... 2 6 .8 2 0 . 7 2 2 . 4 2 3 .7 2 2 .8 2 3 . 4 2 1 .4 2 4 .7 4 0 . 1 4 4 . 0 2 2 . 8 2 3 . 7 Female.......................— 2 4 . 7 2 6 .1 2 2 . 3 2 3 .9 2 2 .6 2 3 . 3 2 1 .0 2 5 .4 3 9 , 0 4 4 . 0 2 2 . 0 2 8 . 2 ' D e f in it io n ov M n n iA N .—The median is the numerical valuo of the half-way point in a series of units arranged according to size, ago, value, weight, or some other measurable! characteristic. Therefore there are as many units above tile median size, weight, etc., as there aro below it. One-half the population is older than tho median ago and tile other half is younger. One-half of tho homes have a value above the median value, the other half a valuo below it. Source: Department of Commerce, Bureau of Census; Fifteenth Ceusus Reports, Population, Vol. II. No. 3 3 .—P opulation, by Sex, R ace, Nativity, Parentage, and A ge Groups, for Alaska, H awaii, and Puerto Rico N o t e ,—Data represent actual enumerations. For estimated total population for intercensal years, see table 14, p. ll. The population of Puerto Rico for 1935 is according to a census taken as of Deo. 1 of that year by the Puerto Biban Reconstruction Administration; see Population Bulletin No. 2. For total population for <strong>1940</strong>, see table 4, p, 2, and table 911, p. 918 m o 1020 1930 1910 1920 1930 ALASKA Total.......... 64,368 66,036 69,278 Mala....................... 45,857 84,639 35,764 Female....... ........... 18,499 20,497 23,514 W hite..................... 38,400 27,883 28.640 Indian.................... 25,331 26.558 29,983 Chinese.................. 1,209 66 26 Japanese................. 913 312 278 Negro...................... 200 128 136 All other................ 294 99 215 Native.................... 43,921 42,766 48,709 Foreign-born.......... 20,435 12,270 10,569 Native white......... 18,420 16,286 18,460 Native parentage- 10,003 0,538 10,980 Foreign parentage 4.760 4,174 4,324 Mixed parentage- 2,673 2,574 3,148 Foreign-born white- 17,974 11,597 10,180 Under 6 years......... 5,363 6,600 0,356 Under I y e a r.... 1,108 1,152 1,339 5 to 9 years............. 4,020 5. 590 0,078 10 to 14 years.......... 2,870 4,292 5,095 16 to 10 years.......... 3, 634 3, 270 4, /ii5 20 to 44 years......... 36,070 22,676 21,036 46 years and over-. 11,966 13,224 15,839 Ago unknown........ 622 297 139 HAWAII Total.............. 101,.900 266, 912 368,336 Male....................... 123,099 151,140 222,640 Female................... 68,810 104,766 145,696 Hawaiian................ 20,041 23,723 22,636 Part-Hawaiian__ : 12,506 18,027 28,224 W hite....... —.......... 44,048 64,742 80,373 Chinese.................. 21,674 23,607 27,179 Japanese________ 79,676 109,274 139,631 Filipino_________ 2,301 21,031 63,062 Korean................... 4,633 4,960 6,461 Negro..................... 695 348 563 Other races............— 376 310 217 Hawaii—continued Native..................... 98,157 168,671 299,799 Native parentage- 47.347 79,242 161,708 Foreign parentage 42,387 73,079 100,946 Mixod parentago. 0,423 10,350 31,145 Foreign-horn........... 93,752 87,241 68,637 Under 5 years....... 24,065 38,550 48,180 Under 1 year___ 5, 515 8,579 9,573 5 to 9 years......... 19, 055 30,195 47,119 10 to 14 years_____ 13,537 22,060 38,042 15 to 19 years_____ 13,650 20,045 33,490 20 to 44 years__ ... 95,721 103,410 147,919 45 years and over... 25,825 40,933 53,483 Age unknown......... 56 113 103 P U E R T O RICO 1920 1930 1935 Total.......... 1,299, 809 1, 643, 913 1, 723, 534 Male........................ 647,826 771,761 SOI, 035 Female................ 651,984 772,152 861, 899 Native........-........... 1,291,042 1, 537,896 1, 718, 218 Foreign-born.......... 8,167 0,017 6, 310 White...................... 948,709 1,140,719 1, 312, 406 Native................. 941,228 1,141,114 1,307, 617 Foreign-born___ 7,481 5, C05 4,979 351,160 397,194 411,038 Native............... 350,414 396,782 410,701 Foreign-born____ 086 412 337 Under 5 years......... 200,255 226,468 246,437 Under 1 year....... 43,184 44, 033 63,462 6 to 9 years............. 196,131 224,022 239,148 10 to 14 years.......... 168,054 199,337 224,780 15 to 19 years.......... 126,248 186,160 183,039 20 to 44 years.......... 441,128 608,729 600,666 46 years and over.— 168, 090 198, 985 229,546 Age unknown......... 297 222 16 Source: Department of Commerce, Bureau of tho Census; Outlying Territories and Possessions, 1030; see also headnoto.
22 AREA AND POPULATION No. 2 4.— P o p u latio n , by Race, N ativity, and P a re n ta g e , f o r N o te.—The 1930 figures for “ Other races’’ include Mexicans who in 1920 were classified for the most population of the city. The increase from census to census includes that TOTAL POPULATION NATIVE WHITE, NATIVE PARENTAGE CITT 1800 1000 1910 1920 1930 Number 1920 11)30 Percent, 1930 Akron, Ohio..................... 27,601 42,728 69,067 208,435 255,040 125,079 162,699 63.8 Albany, N. Y .................. 94, 923 94,151 100,263 113,344 127,412 56,205 66,566 52.2 Allentown, Pa_........... 25,228 35,416 51,913 73,602 92,563 51,937 64,147 09.3 Altoona, Pa.... ................ 30, 337 38,973 52,127 60,331 82,054 43,390 61,060 75.5 Asheville, N. O,............... 10, 235 14,694 18,702 28,504 50,193 19,984 33,585 66.9 Atlanta, Ga..................... 65,533 89,872 154,839 200,016 270,366 124,948 166,613 61.6 Atlantic City, N. J____ 13,055 27,838 46,150 60,707 66,198 22,087 24,464 37.0 Augusta, Qa..... ........... — Austin, Tex...... ........... — 33,300 30,441 41,040 52,548 60,342 26,883 33,310 55.2 14, 575 22,258 29,800 34,876 63,120 20,905 31,666 59.6 Baltimore, M d.............. 434,439 608,957 558,485 733,820 804,874 378,380 427,372 53.1 Bayonne, N. J-............... 10,033 32,722 55,545 76,754 88,979 14,497 20,085 22.6 Beaumont, Tex............... 3,296 9,427 20,640 40,422 57,732 21,71C 32,900 57.0 Berkeley, Oalif_.............. 5,101 13,214 40,434 56,036 82,109 28,66£ 43,755 53.3 Bethlehem, Pa. a.............. 9, 621 10,758 12,837 60,358 67,892 26,503 29,82C 51.5 Binghamton, N . Y ......... 35,005 39,647 48,443 66,80C 76, 662 40,03C 46,369 60.5 Birmingham, Ala............ 26,178 38,415 132,685 178, S0C 259,678 92,211 141,493 54.5 Boston, Mass.3................. 448,477 660,892 670,685 748,06C 781,188 181,811 200,13C 25.6 Bridgeport, Conn............ 48,800 70,990 102,054 143,555 140,710 36,816 37,587 25.6 Brockton, Mass............ 27,294 40,003 56,878 66,254 63,797 24, 643 24,909 39.0 Buffalo, N. Y.................. 255, 064 352,387 423,716 506,776 573,076 165,135 212,586 37.1 Cambridge, Mass............ 70,028 91,886 104,83S 100,694 113,643 20,045 31,10C 27.4 Camden, N. J ................. 58, 313 75,935 94,538 116.301 118,70C 56,249 52,912 44.6 Canton, Ohio................. 20,189 30,007 50,217 87,001 104,906 63, 783 65,09C 62.0 Cedar Rapids, Iowa........ 18,020 25,656 32,811 45, 560 50,097 20,667 36,025 64.2 Charleston, S. C............. 54,955 55,807 58,832 67,957 62,265 28,262 28,248 45.4 Charleston, W. Va.......... 6,742 11,099 22,996 39,608 60,408 31,044 48,167 70.7 Charlotte, N. C............... 11,657 18,091 34,014 40,338 82,675 30,196 54,819 66.3 Chattanooga, Tenn____ 29,100 30,154 44,604 57,895 119,798 34,911 81,212 07.8 Chester, Pa............. ........ 20,226 33,988 38,537 58,03C 69,104 26, 627 26,866 45.4 Chicago, 111.................. 1, 099,850 1, 008, 575 2, 185,283 2, 701,705 3,376,438 642,871 943,301 27.9 Cicero, 111........................ 10,204 18.31C 14,557 44,995 60,602 6,47C 13,564 20.4 Cincinnati, Ohio............. 296,008 325,902 363,591 401,247 451,160 206,605 264,123 58.5 Cleveland, Ohio.......... 261,353 881,708 560,663 796,841 900,429 212,247 242,832 27.0 Cleveland Heights, Ohio. 2,955 15,236 50,945 9,053 26, 210 51.4 Columbia, S. C............... 15,353 21,108 26,319 37,624 51, 581 21,605 30,417 59.0 Columbus, Ohio_______ 88,160 125,500 181,511 237,031 290,564 159,069 201,778 69.4 Covington, K y............ 37,371 42,938 53,270 57,121 65,252 37,391 49,297 75.5 Dallas, Tex.................. 38,067 42,635 92,104 158,976 200,475 112,509 192,680 73.9 Davenport, Iowa....... .... 26,872 35,254 43,028 56,727 60,751 29,394 36,214 59.6 Dayton, Ohio.................. 61,220 85,333 110,577 152,559 200,982 100,996 142,059 70.7 Dearborn, Mich.............. 844 911 2,470 50,358 (*) 20,351 40.4 Decatur, 111.................. 16,841 20,754 31,14C 43,818 67,510 33,254 45,939 79.9 Denver, Oolo................... 106,713 133, set 213,381 266,491 287,861 144, 678 169,457 58.9 Dos Moines, Iowa........... 60,093 02,13£ 86,368 126,468 142, 559 84,361 100,236 70.3 Detroit, Mich_________ 205,870 285,704 465,766 993,678 1,568, 662 313,997 637,844 34.3 Duluth, Minn............. 33,115 52,969 78,406 98,917 101,463 23,931 30,675 30.2 Durham, N. 0 ................ 5,485 6,670 18,241 21,719 52,037 13,608 32; 382 62.2 East Chicago, Ind........... 1,255 3,411 19,098 35,967 54,784 5,954 11,621 21.0 East Orange, N. J........... 21,506 34,371 50,710 68,020 27,455 ’ 33,647 49.5 East St. Louis, 111......... 15,109 29,655 68,647 60,707 74, 347 38,854 45,826 Cl. 6 Elizabeth, N. i _____ ... 37,764 52,130 73,409 95,783 114,589 25,887 33,606 29.3 El Paso, Tex................. 10,338 15,906 39,279 77,560 102, 421 27,456 32,810 32.0 Erie, Pa.......................... 40,634 52,733 00,625 93,372 115,967 . 41,179 65,286 47.7 Evanston, 111_________ 19,259 24,978 37,234 63,338 16,723 31,987 60.6 Evansville, Ind 50,758 59,007 69,647 86,264 102,249 60,270 80,329 78.6 Fall River, Maas 74,398 104,863 119,295 120,485 115,274 19,168 24,368 21.1 Flint, Mich..................... 9,803 i 3 , io a 38,55C 91,699 166,492 60,186 91,567 68.5 Fort Wayne. Ind........ 35,393 45,115 63,933 86,549 114,946 67,675 86,106 75.0 Fort Worth, Tex........— 23,076 26,688 73,312 106,482 163,447 75,515 126' 116 77.2 Fresno, Calif............... 10,818 12,470 24,892 45,086 52,513 23,793 25,914 40.3 Galveston, Tex............... 29,084 37,789 36,981 44,255 52,938 17,289 22,401 42.3 Gary, Ind....................... 16,802 55,378 100,426 16,519 33,635 33.5 >Includes Indians, Chinese, Japanese, and other nonwhite. (See headnote.) »Bethlehem borough includes West Bethlehem prior to 1920. Consolidated with South Bethlehem borough as Bethlehem city between 1910 and 1920. Combined population 1890, 19,823; 1900,23,999; 1910,
- Page 1 and 2: Oppjl U. S. DEPARTMENT OF COMMERCE
- Page 3 and 4: CONTENTS 1. AREA AND POPULATION Tab
- Page 5 and 6: CONTENTS V Table Page 82. Deaths, f
- Page 7 and 8: CONTENTS VII Table Page 155. Vetera
- Page 9 and 10: CONTENTS tx Table Page 246. Federal
- Page 11 and 12: CONTENTS X I Table Page 332. Securi
- Page 13 and 14: CONTENTS X III Table Page 413. Old-
- Page 15 and 16: CONTENTS XV Table Pago 498. Steam r
- Page 17 and 18: CONTENTS X V II 24. IRRIGATION AND
- Page 19 and 20: CONTENTS X IX Table Page 685. Barle
- Page 21 and 22: CONTENTS X X I Table p age 793. Coa
- Page 23 and 24: CONTENTS X X III Table Page 892. Co
- Page 25 and 26: 2 AREA AND POPULATION N o. 3 .— A
- Page 27 and 28: 4 A R E A AN D PO PU L A T IO N N o
- Page 29 and 30: 6 AREA A ND POPULATION N o. 8.-—
- Page 31 and 32: 8 ABBA AND POPULATION No. 11.— P
- Page 33 and 34: 10 AREA AND POPULATION No. 13.— P
- Page 35 and 36: 12 AREA AND POPULATION N o . 1 6 .
- Page 37 and 38: 14 AREA. AND POPULATION N o . 1 7 .
- Page 39 and 40: 1 6 AREA AND POPULATION No. 1 8 .
- Page 41 and 42: 1 8 AREA AND POPULATION No. 1 9 .
- Page 43: 2 0 AREA AND POPULATION N o. 2 1 .
- Page 47 and 48: 24 AEEA AND POPULATION N o . 2 4 .
- Page 49 and 50: 26 A R E A AN D PO PU L A T IO N No
- Page 51 and 52: 28 AREA AND POPULATION N o. 2 5 .
- Page 53 and 54: 30 A R E A A N D P O P U L A T IO N
- Page 55 and 56: 32 AREA AND POPULATION No. 26.-—P
- Page 57 and 58: 34 ABEA AND POPULATION No. 29.—P
- Page 59 and 60: 3 6 AREA AND POPULATION No. 8 1 .
- Page 61 and 62: 38 AREA AND POPULATION N o. 3 2 .
- Page 63 and 64: 40 a r e a a n d p o p u l a t i o
- Page 65 and 66: 42 AREA AND POPULATION N o. 3 5 .
- Page 67 and 68: 44 AREA AND POPULATION N o. 3 6 .
- Page 69 and 70: 46 ABBA AND PO PU L A T IO N N N o.
- Page 71 and 72: 4 8 A R E A AN D PO PU L A T IO N N
- Page 73 and 74: 50 AJREA AND PO PU L A T IO N N o.
- Page 75 and 76: 52 AREA AND POPULATION N o. 4f>.—
- Page 77 and 78: 54 AREA AND POPULATION No. 48.—I
- Page 79 and 80: 5 6 A R E A AN D PO PU L A T IO N N
- Page 81 and 82: 58 AREA AND PO PULA TIO N No 52.—
- Page 83 and 84: 6 0 AREA AND POPULATION No. 53.—
- Page 85 and 86: 62 AREA AND POPULATION No. 55.— G
- Page 87 and 88: 6 4 AREA AND POPULATION No. 55.—
- Page 89 and 90: 66 AREA AND POPULATION No. 55.-—
- Page 91 and 92: 68 AREA AND POPULATION No. 5 5 .—
- Page 93 and 94: 70 AREA AND POPULATION No. 55.— G
- Page 95 and 96:
7 2 AREA AND POPULATION No. 57.—
- Page 97 and 98:
7 4 DEFECTIVES AND DELINQUENTS No.
- Page 99 and 100:
76 DEFECTIVES AND DELINQUENTS N o.
- Page 101 and 102:
7 8 DEFECTIVES AND DELINQUENTS No.
- Page 103 and 104:
8 0 DEFECTIVES AND DELINQUENTS No.
- Page 105 and 106:
82 DEFECTIVES AND DELINQUENTS N o,
- Page 107 and 108:
84: VITAL STATISTICS No. 7 8 .— D
- Page 109:
N o. 8 2 .— D e a t h s , F r o m
- Page 112 and 113:
88 VITAL STATISTICS N o. 8 i . —
- Page 114 and 115:
9 0 VITAL STATISTICS N o . 8 6 .
- Page 116 and 117:
9 2 VITAL STATISTICS N o . 8 8 .—
- Page 118 and 119:
9 4 VITAL STATISTICS N o . 9 0 .
- Page 120 and 121:
9 6 VITAL STATISTICS No, 9 2 .—D
- Page 122 and 123:
9 8 VITAL STATISTICS No. 97.-— M
- Page 124 and 125:
100 IMMIGRATION, EMIGRATION, AND NA
- Page 126 and 127:
5. EDUCATION No. 113.— S c h o o
- Page 128 and 129:
n o EDUCATION No. 115.— T u a c h
- Page 130 and 131:
1 1 2 EDUCATION No. 1 1 7 .— S c
- Page 132 and 133:
1 1 4 EDUCATION N o. 120.— School
- Page 134 and 135:
116 EDUCATION No. 124.— I n s t i
- Page 136 and 137:
118 EDUCATION No. 125.— P r o f e
- Page 138 and 139:
1 2 0 EDUCATION N o . 1 2 7 . — I
- Page 140 and 141:
122 EDUCATION No. 1 2 9 . — R e s
- Page 142 and 143:
124 Ed u c a t i o n No. 181.—V o
- Page 144 and 145:
126 EDUCATION N o. 1 3 8 .— V o c
- Page 146 and 147:
128 EDUCATION No. 135.—V o catio
- Page 148 and 149:
1 3 0 PUBLIC! LANDS No. 138.— P u
- Page 150 and 151:
132 PUBLIC LANDS No. 142.— L a n
- Page 152 and 153:
134 PUBLIC LANDS N o . 1 4 4 .—Re
- Page 154 and 155:
7. CLIMATE No. 148.—C lim atic C
- Page 156 and 157:
1 3 8 CLIMATE N o . 1 4 8 .— C l
- Page 158 and 159:
140 CLIMATE No. 1 4 8 .— Climatic
- Page 160 and 161:
1 4 2 climate N o. 1 4 8 .— Clima
- Page 162 and 163:
144 CLIMATE N o. l - i 8 .— C l i
- Page 164 and 165:
1 4 6 c l im a t e N o. 14:8.— C
- Page 166 and 167:
1 4 8 CLIMATE N o. 1 4 8 .— C l i
- Page 168 and 169:
150 MILITARY AND CIVIL SERVICES, EL
- Page 170 and 171:
1 5 2 MILITARY AND CIVIL SERVICE'S,
- Page 172 and 173:
1 5 4 MILITARY AND CIVIL SERVICES,
- Page 174 and 175:
1 5 6 MILITARY AND CIVIL SERVICES,
- Page 176:
N o , 167.—-E m p lo y e e s i n
- Page 180 and 181:
160 MILITARY AND CIVIL SERVICES, EL
- Page 182 and 183:
1 6 2 MILITARY AND CIVIL SERVICES,
- Page 184 and 185:
1 6 4 MILITARY AND CIVIL SEN VICES,
- Page 186 and 187:
9. NATIONAL GOVERNMENT FINANCES G e
- Page 188 and 189:
168 NATIONAL GOVERNMENT FINANCES No
- Page 190 and 191:
1 7 0 NATIONAL GOVERNMENT FINANCES
- Page 192 and 193:
1 7 2 NATIONAL GOVERNMENT FINANCES
- Page 194 and 195:
174 NATIONAL GOVERNMENT FINANCES No
- Page 196 and 197:
1 7 6 NATIONAL GOVERNMENT FINANCES
- Page 198 and 199:
1 7 8 NATIONAL GOVERNMENT FINANCES
- Page 200 and 201:
1 8 0 NATIONAL GOVERNMENT FINANCES'
- Page 202 and 203:
182 NATIONAL GOVERNMENT FINANCES No
- Page 204 and 205:
1 8 4 NATIONAL GOVERNMENT FINANCES
- Page 206 and 207:
186 UATIOHAL GOVERNMENT FINANCES No
- Page 208 and 209:
18S NATIONAL GOVERNMENT FINANCES No
- Page 210 and 211:
1 9 0 NATIONAL GOVERNMENT FINANCES
- Page 212 and 213:
1 9 2 NATIONAL SOVEENMESra: FINANCE
- Page 214 and 215:
1 9 4 NATIONAL GOVERNMENT FINANCES
- Page 216 and 217:
1 9 6 NATIONAL GOVERNMENT FINANCES
- Page 218 and 219:
1 9 8 NATIONAL GOVERNMENT FINANCES
- Page 220 and 221:
2 0 0 NATIONAL GOVERNMENT FINANCES
- Page 222 and 223:
202 NATIONAL GOVEBNMENT FINANCES No
- Page 224 and 225:
2 0 4 NATIONAL GOVEENM1ENT FINANCES
- Page 226:
N o . 2 0 6 .—E s ta te T ax R et
- Page 229 and 230:
208 NATIONAL GOVERNMENT FINANCES N
- Page 231 and 232:
2 1 0 NATIONAL GOVERNMENT FINANCES
- Page 233 and 234:
2 1 2 NATIONAL GOVERNMENT FINANCES'
- Page 235 and 236:
10. STATE AND LOCAL GOVERNMENT FINA
- Page 237 and 238:
216 STATE AND LOCAL FINANCES AND EM
- Page 239 and 240:
2 1 8 STATE AND LOCAL FINANCES AND
- Page 241 and 242:
2 2 0 STATE AND LOCAL FINANCES AND
- Page 243 and 244:
222 STATE AND LOCAL FINANCES AND EM
- Page 245 and 246:
224 STATE AND LOCAL FINANCES! AND E
- Page 247 and 248:
226 STATE AND LOCAL FINANCES AND EM
- Page 249 and 250:
2 2 8 STATE AND LOCAL FINANCES AND
- Page 251 and 252:
230 STATE AND LOCAL FINANCES AND EM
- Page 253 and 254:
2 3 2 STATE AND LOCAL FINANCES AND
- Page 255 and 256:
i 2 3 4 STATE AND LOCAL FINANCES AN
- Page 258 and 259:
236 STATE AND LOCAL FINANCES AND EM
- Page 260 and 261:
2 3 8 STATES AND iLOOAL FINANCES AN
- Page 262 and 263:
PERIOD 1OR CALENDAR YEAR 3793-3800-
- Page 264 and 265:
2 4 2 BACKING AOT FINANCE No. 24=4
- Page 266 and 267:
2 4 4 BANKING AND FINANCE N o. 2 4
- Page 268 and 269:
i i 246 BANKING AND FINANCE No. 249
- Page 270 and 271:
2 4 8 BANKING AND FINANCE N o , F e
- Page 272 and 273:
2 5 0 BANKING AND FINANCE No. 2 5 6
- Page 274:
1 9 3 9 ( D e c . 3 0 ) . . . . 1 2
- Page 278 and 279:
254 BACKING AND FINANCE No. 2 6 1 .
- Page 280 and 281:
256 BACKING AND' FINANCE N o. 264;.
- Page 282 and 283:
258 BANKING AND FINANCE No. 26A.—
- Page 284 and 285:
2 6 0 BANKING AND PINANQE N o . 2 6
- Page 286 and 287:
262 BANKING AND O TANO B No. 2 6 9
- Page 288 and 289:
2 6 4 BACKING AND FINANCE N o. 2 7
- Page 290 and 291:
266 BANKING AND FINANCE N o . 2 7 5
- Page 292 and 293:
268 BANKING AND FINANCE No. 279.—
- Page 294 and 295:
270 b a n k in g a n d f in a n c e
- Page 296 and 297:
2 7 2 BANKING AND FINANCE No. 286.
- Page 298 and 299:
274 BANKING Altf) FIKANCEl No. 2 8
- Page 300 and 301:
276 BAHIUH-G AND F IN A N C E No. 2
- Page 302 and 303:
278 BANKING AND I-TNANCK No. 295.
- Page 304 and 305:
2 8 0 BANKING AND FINANCE No. 2 9 8
- Page 306 and 307:
2 8 2 BANKING AND FINANCE No. 3 0 2
- Page 308 and 309:
2 8 4 BANKING AND FINANCE N o 3 0 7
- Page 310 and 311:
2 8 6 BANKING ASH STOANGE N o. 3 0
- Page 313 and 314:
2 8 8 BANICING AND FINANCE N o . 3
- Page 315 and 316:
2 9 0 BANKING AND FINANCE N o. 3 1
- Page 317 and 318:
2 9 2 BACKING AND FINANCE No. 314;.
- Page 319 and 320:
2 9 4 BAK ICING AND F IN A N C E N
- Page 321 and 322:
2 9 6 B A N K IN G AND F IN A N C E
- Page 323 and 324:
298 B A N K IN G AND F IN A N C E N
- Page 325 and 326:
3 0 0 BANKING AND FINANCE N o. 3 2
- Page 327 and 328:
3 0 2 BANKING AND FINANCE N o. 3 2
- Page 329 and 330:
3 0 4 BANKING AND FINANCE No, 3 8 1
- Page 331 and 332:
306 BANKING AND DISTANCE No. 3 3 7
- Page 333 and 334:
3 0 8 BANKING AND FINANCE N o , 341
- Page 335 and 336:
3 1 0 BANKING AND FINANCE No. 34,4.
- Page 337 and 338:
3 1 2 BANKING AND FINANCE No. 348.
- Page 339 and 340:
13. INCOME, EXPENDITURES, AND DEBT
- Page 341 and 342:
3 1 6 INCOME, EXPENDITURES, AND DEB
- Page 343:
No. 3 5 6 .— C o n s u m e r E x
- Page 346:
No. 3 5 8 .—N et Debt in the U n
- Page 350 and 351:
13. PRICES General Note.—T he who
- Page 352 and 353:
3 2 4 prices No. 363.— P r i c e
- Page 354 and 355:
326 p ric e s No, 3 6 5 ,— Prices
- Page 356 and 357:
328 p r i c e s N o . 3 6 6 . — P
- Page 358 and 359:
3 3 0 PBICES N o . 8 6 9 .— C o s
- Page 360 and 361:
332 p e i o e s No. 871.—Prices,
- Page 363:
No. 373.— U n i t V a l u e s , A
- Page 367 and 368:
14. WAGES, HOURS OF LABOR, AND EMPL
- Page 369 and 370:
3 3 8 WAGES, HOUKS, AND EMPLOYMENT
- Page 371 and 372:
3 4 0 .m dE-s, hoiues, a k b e m pl
- Page 373 and 374:
3 4 2 wages, h oGb s, Aim employm e
- Page 375 and 376:
3 4 4 WAGES, HOURS, AND EMPLOYMENT
- Page 377 and 378:
3 4 6 WAGES', HOURS, AND e m plo y
- Page 379 and 380:
3 4 8 W A G ES, HOTJBS, AND E M P L
- Page 381 and 382:
3 5 0 WAGES, HOURS, AND EMPLOYMENT
- Page 383 and 384:
3 5 2 WAGES, HOURS, AND EMPLOYMENT
- Page 385 and 386:
3 5 4 WAGES, HOURS, AND EMPLOYMENT
- Page 388 and 389:
3 5 6 WAGES, HOURS, AHD EMPLOYMENT
- Page 390 and 391:
358 WAGES', HOURS, AND EMPLOYMENT N
- Page 392 and 393:
360 WAGES, HOURS, AND EMPLOYMENT No
- Page 395 and 396:
N o. 399. - —P u b lic E m ploym
- Page 397:
Idaho................... . Illinois
- Page 400 and 401:
P U B L IC E M P L O Y M E N T SERV
- Page 402 and 403:
'OLD-iAGE INSURANCE 367 No. 4 0 1 .
- Page 404 and 405:
OLD-AGE INSXTRANOE 369 N o . 4 0 2
- Page 406 and 407:
OLD-AGE INSURANCE 371 N o . 4 0 4 :
- Page 408 and 409:
I'IVKMrLOYMKX-I o o m p m sa t io #
- Page 410 and 411:
UNEM PLOYM ENT COMPENSATION 375 No.
- Page 412 and 413:
PUBLIC ASSISTANCE 377 N o . 4 1 1 .
- Page 415 and 416:
PUBLIC ASSISTANCE 3 7 9 N o. 4=12.
- Page 417 and 418:
PUBLIC ASSISTANCE 381 N o . 4 1 5 .
- Page 419 and 420:
FEDERAL GRANTS TO STATES 383 N o. 4
- Page 421 and 422:
RAILROAD RETIRRMEUT SYSTEM 385 N o
- Page 423 and 424:
RAILROAD RETIREMENT SYSTEM 387 No.
- Page 425 and 426:
16. POSTAL SERVICE [Postal statisti
- Page 427 and 428:
POSTAL SERVICE 391 No. 426.—P o s
- Page 429 and 430:
'POSTAL SERVICE 393 No. 430.— P o
- Page 431 and 432:
TELEPHONE SYSTEMS 395 No. 4 3 2 .
- Page 433 and 434:
TELEPHONE SYSTEMS 3 9 7 N o . T 3 6
- Page 435:
No. T 4 0 - — T e l e g r a p h :
- Page 438 and 439:
ELECTRIC LIGHT AND POWER 401 N o .
- Page 440 and 441:
ELECTRIC L IG H T AND POWER 403 N o
- Page 442 and 443:
e l e c t r ic l ig h t a n d p o w
- Page 444 and 445:
ELECTRIC! L IG H T AND POW ER 407 N
- Page 446 and 447:
ELECTRIC LIGHT AND POWER 4 0 9 No.
- Page 448 and 449:
WATER POWER 4ii N o . 4 5 7 .— W
- Page 450 and 451:
STATE-HIGHWAY MILEAGE 4 1 3 N o. 4
- Page 452 and 453:
STATE-HIGHWAY FUNDS 4 1 6 No. 461.
- Page 454 and 455:
MOTOR-VEHICLE SALES AND REGISTRATIO
- Page 456 and 457:
MOTOR-VEHICLE REGISTRATIONS. 410 N
- Page 458 and 459:
MOTOR-VEHICLE FATALITIES 4 2 1 No.
- Page 460 and 461:
MOTOR-VEHICLE FATALITIES 423 ' No.
- Page 462 and 463:
STEAM RAILWAYS 4 2 5 No. 4=72.— S
- Page 464 and 465:
STEAM r a ilw a y s 427 N o. 4 7 5
- Page 466 and 467:
STEAM RAILWAYS' 429 No. 479.—S t
- Page 468 and 469:
STEAM RAILWAYS 431 No, 482.— S t
- Page 470 and 471:
STEAM RAILWAYS 433 No. 4 8 6 .— S
- Page 472 and 473:
STEAM RAILWAYS 435 No. 4 8 8 .— S
- Page 474 and 475:
STEAM RAILWAYS 4 3 7 N o . 4 9 0 .
- Page 476 and 477:
STEAM RAILWAYS 4 3 9 N o. 4 9 2 .
- Page 478:
,90Ii9S' N o . 4 9 4 .-— S t e a
- Page 482:
Manufactures and miscellaneous, tot
- Page 485 and 486:
STEAM RAILWAYS 445 N o. 4 9 6 .—
- Page 487 and 488:
STEAM RAILWAYS 447 N o. A 9 9 .—
- Page 489 and 490:
ELBOTKIO RAILWAYS' 4 4 9 No. 5 0 3
- Page 491 and 492:
ELECTRIC RAILWAYS' 451 N o . SO B .
- Page 493 and 494:
TROLLEY-BUS LINES' 453 N o. 5 0 9 .
- Page 495 and 496:
MOtEOEiSUS I.TXES 455 N o . 5 1 2 .
- Page 497 and 498:
CIVIL AERONAUTICS 457 No. 5 1 4 .
- Page 499 and 500:
WATER TRAFFIC 4 5 9 N o. 5 1 6 .—
- Page 501 and 502:
IIFTERNAL WAYIEfft WAYS' 4 6 1 No.
- Page 503 and 504:
MERCHANT MARINE 4 6 3 N o . 5 2 2 .
- Page 505 and 506:
m e r c h a n t m a r in e 465 N o.
- Page 507 and 508:
PANAMA. CANAL— DISASTERS TO' VESS
- Page 509 and 510:
WATER-BORNE FOREIGN COMMERCE 469 No
- Page 511 and 512:
WATEB-BORNE FOREIGN COMMERCE 471 N
- Page 513 and 514:
WATER-BORNE FOREIGN COMMERCE 473 N
- Page 515 and 516:
Wa ter-borne EOREION COMMERCE 475 N
- Page 517 and 518:
TONNAGE ENTERED AND CLEARED 477 N o
- Page 519 and 520:
TONNAGE ENTERED' AND CI.EaIIEU 4 7
- Page 521 and 522:
TONNAGE- ENTERED AND .CLEARED 481 N
- Page 523 and 524:
n. FOREIGN COMMERCE OF THE UNITED S
- Page 525 and 526:
INTERNATIONAL TRANSACTIONS 485 N o.
- Page 527 and 528:
FOREIGN COMMERCE 487 No. 5 5 2 .—
- Page 529 and 530:
FOREIGN COMMERCE 4 8 9 No. 5 5 4 .
- Page 531 and 532:
FOREIGN COMMERCE 491 No. 5 5 7 .—
- Page 533 and 534:
FOREIGN COMMERCE 4 9 3 M e r c h a
- Page 535 and 536:
Se l e c t e d C o m m o d it ie s
- Page 537 and 538:
FOREIGN COMMERCE m No. 5 6 1 . —
- Page 539 and 540:
FOREIGN COMMERCE 4 9 9 a n d I m p
- Page 541 and 542:
FOREIGN COMMERCE 501 a n d P ercent
- Page 543 and 544:
FOREIGN COMMERCE 503 No. 5 6 5 .—
- Page 545 and 546:
FOREIGN COMMERCE 5 0 5 I m p o r t
- Page 547 and 548:
FOREIGN COMMERCE 507 N o. 5 6 9 .
- Page 549 and 550:
F O R E IG N C O M M E R C E 509 c
- Page 551 and 552:
FOREIGN COMMERCE 511 M e r c h a n
- Page 553 and 554:
FOREIGN COMMERCE 513 M e r c h a n
- Page 555 and 556:
FOREIGN COMMERCE 515 No. 5 7 2 .—
- Page 557 and 558:
FOREIGN COMMERCE 517 No. 5 7 3 .—
- Page 559 and 560:
FOREIGN COMMERCE 5 1 9 No. 5 7 4 .
- Page 561:
N o . 5 T 5 * — E x p o r t s o p
- Page 565:
Cod, haddock, hake, pollock, cask..
- Page 569:
Leather belting, new_______________
- Page 573:
Cottonseed c a k e ......__________
- Page 577:
Coconut oil, edible__ ..___________
- Page 581:
t>tmx rosin________________________
- Page 585:
Upland (under 1H inches)--— -—
- Page 589:
Printcloth: Bleached........... ...
- Page 593:
267706°— 41- cc a Other fabricat
- Page 597 and 598:
Dresses, skirts, blouses, and other
- Page 599:
No. 575.— E x p o b t s o f U n i
- Page 603:
N o . 5 7 5 .— E x p o r t s o p
- Page 607:
N o . 5 7 5 . — E x p o r t s o f
- Page 611:
N o . 5 7 5 .— E x p o r t s o p
- Page 615:
N o . 5 7 5 .— E x p o r t s o f
- Page 618 and 619:
31, 880 } 2,149 / 753 1,278 2,702 1
- Page 621:
Axes (broad and band)..............
- Page 625:
2G770G CO Pipe fittings and valves_
- Page 629:
F u ses.-............- ............
- Page 633:
Locomotives— _____— ------- do
- Page 637:
Forging machinery and parts_______
- Page 641:
Laundry machinery: Power-driven lau
- Page 645:
Other agricultural machinery, imple
- Page 649:
G r o u p S.—C h e m ic a l s a n
- Page 653:
Pyroxylin scrap and film scrap_____
- Page 657:
90iA9ij Kalsomme or cold-water pain
- Page 661:
Exposed____________________________
- Page 665:
Explosive shells and projectiles___
- Page 669:
N o. 576.— I m p o s t s o f M e
- Page 673:
Caviar and other fish roe__________
- Page 677:
c. Other bovine leather____________
- Page 681:
F, Other ft.-tti-mfl.1a and animal
- Page 685:
Other vegetables, fresh, n. e. s___
- Page 689:
267706 P. Cocoa, coffee, and tea___
- Page 693 and 694:
Chicle, erode_____________ - Balsam
- Page 695:
N o . 5 7 6 . — I m p o r t s o p
- Page 698 and 699:
3,990 26,886 11,132 2,073 2,620 11,
- Page 701:
Tapestries and other Jacquard woven
- Page 705:
M a n u fa c tu r e s of— l i m ,
- Page 709:
Fabrics oyer 30 inches wide— * 3,
- Page 713:
B. Wood semimanufactures—sawmill
- Page 717:
Cigarette paper, cigarette books an
- Page 721:
2 6 7 7 0 6 i£o China and porcelai
- Page 725:
Wire rods----- --------------------
- Page 729:
Unrefined, black, blister and conve
- Page 733:
Vacuum cleaners and parts **----- -
- Page 737 and 738:
Ammonium compounds— Chloride (mur
- Page 739:
No. 576.— I m p o r t s o p M e r
- Page 743:
No. 5 7 6 .—Imports op Merchandis
- Page 747 and 748:
614 FOREIGN COMMERCE No. 577.-—In
- Page 749 and 750:
6 1 6 COMMERCE OF NONOONTIGTJ'OTJS
- Page 751 and 752:
6 1 8 COMMERCE >03? NONCONTIGUOUS T
- Page 753 and 754:
6 2 0 ■COMMERCE OF NONCONTIGUOUS
- Page 755 and 756:
34. IRRIGATION AND DRAINAGE G e n e
- Page 757 and 758:
6 2 4 IRRIGATION AND DRAINAGE N o.
- Page 759 and 760:
6 2 6 IRRIGATION AND DRAINAGE N o .
- Page 761 and 762:
6 2 8 IRRIGATION AND DRAINAGE N o.
- Page 763 and 764:
6 3 0 IRRIGATION AND DRAINAGE N o.
- Page 765 and 766:
35. FARMS—GENERAL STATISTICS [D a
- Page 767 and 768:
636 FARMS— GENERAL STATISTICS No.
- Page 769 and 770:
6 3 8 FARMS— GENERAL STATISTICS'
- Page 771 and 772:
6 4 0 FABMS— GENERAL STATISTICS
- Page 773 and 774:
6 4 2 FARMS'— GENERAL STATISTICS'
- Page 775 and 776:
6 4 4 FARMS— GENERAL STATISTICS'
- Page 777 and 778:
6 4 6 FARMS— GENERAL STATISTICS N
- Page 779 and 780:
6 4 8 FARMS— GENERAL STATISTICS N
- Page 781 and 782:
6 5 0 FARMS— GENERAL STATISTICS'
- Page 783 and 784:
6 5 2 FARMS— GENERAL STATISTICS'
- Page 785 and 786:
6 5 4 FARMS— GENERAL STATISTICS N
- Page 787 and 788:
656 FARMS--- GENERAL STATISTICS' No
- Page 789:
No. 6 2 3 .—P ast-T ime W ork off
- Page 792 and 793:
6 6 0 FARMS— GENERAL STATISTICS N
- Page 794 and 795:
662 FARMS— GENERAL STATISTICS N o
- Page 796 and 797:
6 6 4 FARMS— GENERAL STATISTICS'
- Page 798 and 799:
6 6 6 FARMS— GENERAL STATISTICS N
- Page 800 and 801:
36. FARM PRODUCTION AND RELATED STA
- Page 802 and 803:
6 7 0 FARM PRODUCTION AND RELATED S
- Page 804 and 805:
6 7 2 FARM PRODUCTION AND RELATED S
- Page 806 and 807:
6 7 4 FARM PRODUCTION AND RELATED S
- Page 808 and 809:
27. FARM ANIMALS AND ANIMAL PRODUCT
- Page 810 and 811:
6 7 8 HARM A N IM A LS AND A N IM A
- Page 812 and 813:
6 8 0 FARM ANIMALS AND ANIMAL PRODU
- Page 814 and 815:
6 8 2 BAUM ANIMALS AMD AKTMAL PRODU
- Page 816 and 817:
6 8 4 FARM ANIMALS AND ANIMAL PRODU
- Page 818 and 819:
6 8 6 FARM ANIMALS AND ANIMAL PRODU
- Page 820 and 821:
6 8 8 FA.11M ANIMALS AND ANIMAL PRO
- Page 822 and 823:
690 FARM ANIMALS AND ANIMAL PRODUCT
- Page 824 and 825:
6 9 2 FARM ANIMALS AND ANIMAL PRODU
- Page 826 and 827:
6 9 4 I’ARM ANIMALS AND ANIMAL Lk
- Page 828:
N o. 6 7 5 - — C r o p s — A c
- Page 832 and 833:
6 9 8 FARM CROPS AND FOODSTUFFS' N
- Page 834 and 835:
7 0 0 I’ABM CROPS AND FOODSTUFFS
- Page 836 and 837:
7 0 2 FARM CROPS -AND FOODSTUFFS N
- Page 838 and 839:
7 0 4 FARM CROPS AND FOODSTUFFS No.
- Page 840 and 841:
7 0 6 FARM CROPS AND FOODSTUFFS No.
- Page 842 and 843:
7 0 8 FARM CROPS AND FOODSTUFFS N o
- Page 844 and 845:
710 FARM CRO'PS AND FOODSTUFFS 1 No
- Page 846 and 847:
7 1 2 FAHM CHOPS AND FOODSTUFFS' No
- Page 848 and 849:
7 1 4 farm: chops and foodstuffs No
- Page 850 and 851:
7 1 6 FARM CROPS AND FOODSTUFFS No.
- Page 852 and 853:
7 1 8 farm crops a nd fo o d st u f
- Page 854 and 855:
7 2 0 FARM CROPS AND FOODSTUFFS N o
- Page 856 and 857:
722 FARM CROPS AND FOODSTUFFS No. 6
- Page 858 and 859:
7 2 4 FARM CROPS AMD FOODSTUFFS' N
- Page 860 and 861:
7 2 6 FARM CROPS AND FOODSTUFFS' N
- Page 862 and 863:
7 2 8 FARM CROPS ADD FOODSTUFFS N o
- Page 864:
N o . TO T. C o t t o n s e e d a n
- Page 867 and 868:
7 3 2 l?ARM CROPS AND POODSTUPPS N
- Page 869 and 870:
7 3 4 FARM CROPS AND FOODSTUFFS YEA
- Page 871 and 872:
7 3 6 FARM CROPS AND FOODSTUFFS No.
- Page 873 and 874:
7 3 8 FARM CROPS AND FO O D ST U FF
- Page 875 and 876:
2 9 . F O R E S T S A N D F O R E S
- Page 877 and 878:
7 4 2 FOBEStTS A N D f o r e s t p
- Page 879 and 880:
7 4 4 FORESTS AND FOREST PRODUCTS N
- Page 881 and 882:
7 4 6 FORESTS AND FOREST PRODUCTS'
- Page 883 and 884:
7 4 8 FORESTS AND' FOREST PRODUCTS
- Page 885 and 886:
750 FORESTS AND FOREST PRODUCTS N o
- Page 887 and 888:
7 5 2 FISHERIES! N o, 74:3.— F i
- Page 889 and 890:
7 5 4 FISHERIES No. 746.— F i s h
- Page 891 and 892:
7 5 6 FISHEBIES No. 750.— S a lm
- Page 893 and 894:
758 MINING AND MINERAL DRODUOT& No.
- Page 895 and 896:
7 6 0 MINING AND MINERAL PRODUCTS'
- Page 897 and 898:
7 6 2 MINING AND MINERAL PRODUCTS N
- Page 899:
N o . 7 6 2 .— M in e r a l P r o
- Page 903:
No. 762.—M i n e r a l P r o d u
- Page 907 and 908:
7 6 8 MINING AND MINERAL PRODUCTS N
- Page 909 and 910:
770 M tin n s rG a n d m in e ral p
- Page 911 and 912:
7 7 2 MINING AND MINERAL PROD'UOTS
- Page 913 and 914:
7 7 4 MINING AND MINERAL FRODTPOTS
- Page 915 and 916:
7 7 6 MIKING AND MINEDAX, PRODUCTS'
- Page 917 and 918:
778 MISTING AND MINERAL PRODG'OTS N
- Page 919 and 920:
780 MINING AND MINERAL PRODUCTS No.
- Page 921 and 922:
7 8 2 MINING AND MINERAL PRODUCTS'
- Page 923 and 924:
7 8 4 MINING AND MINERAL PRODUCTS1
- Page 925 and 926:
7 8 6 MINING AND MINEBAL PRODUCTS N
- Page 927 and 928:
7 8 8 MINING AND MINERAL PRODUCTS N
- Page 929 and 930:
7 9 0 MINING AND MINERAL PRODUCTS N
- Page 931 and 932:
7 9 2 MINING AND MINERAL PRODUCTS'
- Page 933 and 934:
7 9 4 MINING AND MINERAL PRODUCTS N
- Page 935 and 936:
796 MINING AND MINERAL PRODUCTS No.
- Page 937 and 938:
7 9 8 MINTING AND MINERAL EROD'UCTS
- Page 939 and 940:
800 MISTING AND MINERAL PRODUCTS' N
- Page 941 and 942:
32. MANUFACTURES [Statistics in thi
- Page 943 and 944:
8 0 4 MANUBA.CTU.EES N o . 829.—I
- Page 945 and 946:
8 0 6 MANTJFACTUiRES N o . 8 3 0 .
- Page 947 and 948:
8 0 8 M A N U m C T U 'R E S N o .
- Page 949 and 950:
8 1 0 MAHTOAOTtJ'RES No, 8 3 0 ,—
- Page 951 and 952:
8 1 2 MANUFACTURES N o . 8 8 0 .
- Page 953 and 954:
8 1 4 m a n u f a c t u r e s N o.
- Page 955 and 956:
8 1 6 MANUFACTURES N o . 8 3 0 .—
- Page 957 and 958:
8 1 8 MANUFACTURES No. 8 3 0 .— M
- Page 959 and 960:
8 2 0 M A N O TIA CTU BES N o . 8 3
- Page 961 and 962:
8 2 2 M A N U FA C T U R E S No. 8
- Page 963 and 964:
8 2 4 MANUFACTURES N o. 8 3 0 .—
- Page 965 and 966:
8 2 6 M A N U FA C T U R E S N o. 8
- Page 967 and 968:
8 2 8 Ma n u fa c t u r e s N o . 8
- Page 969 and 970:
8 3 0 MANUFACTURES No. 830.— M a
- Page 971 and 972:
8 3 2 MAKUMACTtmEs N o . 8 8 0 .—
- Page 973 and 974:
8 3 4 MANTimCTUKES N o. 8 8 0 .—
- Page 975 and 976:
8 3 6 m a n u fa c t u r e s N o .
- Page 977 and 978:
8 3 8 MANUFACTURES N o. 8 3 0 .' M
- Page 979 and 980:
8 4 0 M A ^U FlA .C ’TUEiES N o .
- Page 981 and 982:
8 4 2 M A N U F A C T U R E S No. 8
- Page 983 and 984:
8 4 4 MAsruriiOTtrcEtEs No. 8 3 3 .
- Page 985 and 986:
8 4 6 MANUFACTURES No. 837.— C h
- Page 987 and 988:
8 4 8 MANUFACTURE'S No. 8 8 8 .—
- Page 989 and 990:
8 5 0 MANUFACTURES N o . 8 3 9 .—
- Page 991 and 992:
852 MANUEtAOTURES .' ' ;a* No. 8 4
- Page 993 and 994:
8 5 4 MAmritAOT-U'EBS N o . 8 4 5 .
- Page 995 and 996:
8 5 6 M A IT U 1?1A .C T T J'K E S
- Page 997 and 998:
8 5 8 MANUFIACTU'KGS N o . 8 5 0 .
- Page 999 and 1000:
8 6 0 MANUFACTURES No. 853.— C o
- Page 1001 and 1002:
862 mah-upiagtuie.es No. 8 5 7 .—
- Page 1003 and 1004:
8 6 4 M A N U F A C T U R E S No. 8
- Page 1005 and 1006:
S3. DISTRIBUTION, SERVICES, AND HOT
- Page 1007 and 1008:
868 D IS T R IB U T IO N , S M V IC
- Page 1009 and 1010:
8 7 0 BIBTBIBtmOH) 'SBBYIOBS, AND-
- Page 1011 and 1012:
8 7 2 DISTRIBUTION, SERVICES, AND H
- Page 1013 and 1014:
8 7 4 d i s t r i b u t i o n , s e
- Page 1015 and 1016:
8 7 6 DISTRIBUTION, SERVICES, AND H
- Page 1017 and 1018:
8 7 8 ’ DISTRIBUTION, SERVICES, A
- Page 1019 and 1020:
8 8 0 DISTRIBUTION, SERVICES, AND H
- Page 1021 and 1022:
8 8 2 DISTRIBUTION, SERVICES, AND H
- Page 1023 and 1024:
8 8 4 DISTRIBUTION, SERVICES, AND H
- Page 1025 and 1026:
886 DISTRIBUTION, SE'RYIOES, AND HO
- Page 1027 and 1028:
888 DISTRIBUTION, SERVICES, AND HOT
- Page 1029 and 1030:
890 DISTRIBUTION, SERVICES, AND HOT
- Page 1031 and 1032:
8 9 2 DISTRIBUTION, SERVICES,. AND
- Page 1033 and 1034:
8 9 4 'OONsmucTioN and s o u s in g
- Page 1035 and 1036:
8 9 6 OONST&UCJTION AND HOUSING No.
- Page 1037 and 1038:
8 9 8 CONSTRUCTION AND HOUSING No.
- Page 1039 and 1040:
900 C o n s t r u c t i o n a n d h
- Page 1041 and 1042:
9 0 2 _ CONSTRUCTION AND HOUSING N
- Page 1043 and 1044:
9 0 4 CONSTRUCTION AND' HOUSING N o
- Page 1045 and 1046:
9 0 6 CONSTRUCTION AND HOUSING N o
- Page 1047 and 1048:
9 0 8 CONSTRUCTION AND HOUSING N o.
- Page 1049 and 1050:
35. NATIONAL PARK SYSTEM AND RECREA
- Page 1051 and 1052:
9 1 2 NATIONAL PARK SYSTEM No. 9 0
- Page 1053 and 1054:
9 1 4 NATIONAL PARK SYSTEM N o. 9 0
- Page 1055 and 1056:
9 1 6 NATIONAL PARK SYSTEM N o. 9 0
- Page 1057 and 1058:
36. SUPPLEMENTAL STATISTICS FOR OUT
- Page 1059 and 1060:
920 OUTLYING TERRITORIES AND POSSES
- Page 1061 and 1062:
9 2 2 OUTLYING THRBITOEIES AND POSS
- Page 1063 and 1064:
9 2 4 outlying territo ries and d o
- Page 1065 and 1066:
INDEX Abrasives: Foreign trade.....
- Page 1067 and 1068:
Bakeries: Page Employees.... ......
- Page 1069 and 1070:
Broomcorn: Page Acreage, production
- Page 1071 and 1072:
Page China firing and decorating, s
- Page 1073 and 1074:
Com meal—Continued. Page Received
- Page 1075 and 1076:
Education—Continued. Page Institu
- Page 1077 and 1078:
Federal Farm Mortgage Oorp.—Conti
- Page 1079 and 1080:
Page Preach Indo-China, trade with
- Page 1081 and 1082:
Hawaii: Area and date of accession.
- Page 1083 and 1084:
Pago Jamaica, trade with United Sta
- Page 1085 and 1086:
INDEX 9 4 7 Machinery—Continued.
- Page 1087 and 1088:
Motor vehicles—Continued. Tago !
- Page 1089 and 1090:
Paper and manufactures—Continued.
- Page 1091 and 1092:
Potatoes—Continued. Page Irish—
- Page 1093 and 1094:
Real estate—Continued. Pa8e Taxes
- Page 1095 and 1096:
Page Shellac, import prices........
- Page 1097 and 1098:
Sugar beets—Continued* Farm price
- Page 1099 and 1100:
Page Trust activities of national b
- Page 1101:
Wheat—Continued. Page Prices—Co