basic_engineering_mathematics0
You also want an ePaper? Increase the reach of your titles
YUMPU automatically turns print PDFs into web optimized ePapers that Google loves.
234 Basic Engineering Mathematics<br />
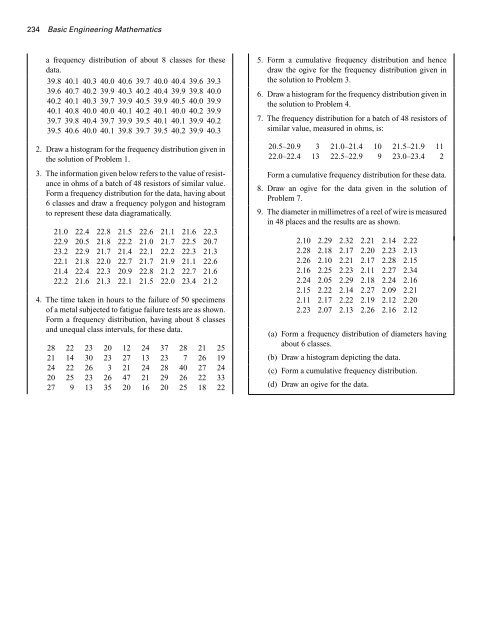
a frequency distribution of about 8 classes for these<br />
data.<br />
39.8 40.1 40.3 40.0 40.6 39.7 40.0 40.4 39.6 39.3<br />
39.6 40.7 40.2 39.9 40.3 40.2 40.4 39.9 39.8 40.0<br />
40.2 40.1 40.3 39.7 39.9 40.5 39.9 40.5 40.0 39.9<br />
40.1 40.8 40.0 40.0 40.1 40.2 40.1 40.0 40.2 39.9<br />
39.7 39.8 40.4 39.7 39.9 39.5 40.1 40.1 39.9 40.2<br />
39.5 40.6 40.0 40.1 39.8 39.7 39.5 40.2 39.9 40.3<br />
2. Draw a histogram for the frequency distribution given in<br />
the solution of Problem 1.<br />
3. The information given below refers to the value of resistance<br />
in ohms of a batch of 48 resistors of similar value.<br />
Form a frequency distribution for the data, having about<br />
6 classes and draw a frequency polygon and histogram<br />
to represent these data diagramatically.<br />
21.0 22.4 22.8 21.5 22.6 21.1 21.6 22.3<br />
22.9 20.5 21.8 22.2 21.0 21.7 22.5 20.7<br />
23.2 22.9 21.7 21.4 22.1 22.2 22.3 21.3<br />
22.1 21.8 22.0 22.7 21.7 21.9 21.1 22.6<br />
21.4 22.4 22.3 20.9 22.8 21.2 22.7 21.6<br />
22.2 21.6 21.3 22.1 21.5 22.0 23.4 21.2<br />
4. The time taken in hours to the failure of 50 specimens<br />
of a metal subjected to fatigue failure tests are as shown.<br />
Form a frequency distribution, having about 8 classes<br />
and unequal class intervals, for these data.<br />
28 22 23 20 12 24 37 28 21 25<br />
21 14 30 23 27 13 23 7 26 19<br />
24 22 26 3 21 24 28 40 27 24<br />
20 25 23 26 47 21 29 26 22 33<br />
27 9 13 35 20 16 20 25 18 22<br />
5. Form a cumulative frequency distribution and hence<br />
draw the ogive for the frequency distribution given in<br />
the solution to Problem 3.<br />
6. Draw a histogram for the frequency distribution given in<br />
the solution to Problem 4.<br />
7. The frequency distribution for a batch of 48 resistors of<br />
similar value, measured in ohms, is:<br />
20.5–20.9 3 21.0–21.4 10 21.5–21.9 11<br />
22.0–22.4 13 22.5–22.9 9 23.0–23.4 2<br />
Form a cumulative frequency distribution for these data.<br />
8. Draw an ogive for the data given in the solution of<br />
Problem 7.<br />
9. The diameter in millimetres of a reel of wire is measured<br />
in 48 places and the results are as shown.<br />
2.10 2.29 2.32 2.21 2.14 2.22<br />
2.28 2.18 2.17 2.20 2.23 2.13<br />
2.26 2.10 2.21 2.17 2.28 2.15<br />
2.16 2.25 2.23 2.11 2.27 2.34<br />
2.24 2.05 2.29 2.18 2.24 2.16<br />
2.15 2.22 2.14 2.27 2.09 2.21<br />
2.11 2.17 2.22 2.19 2.12 2.20<br />
2.23 2.07 2.13 2.26 2.16 2.12<br />
(a) Form a frequency distribution of diameters having<br />
about 6 classes.<br />
(b) Draw a histogram depicting the data.<br />
(c) Form a cumulative frequency distribution.<br />
(d) Draw an ogive for the data.


![[Lonely Planet] Sri Lanka](https://img.yumpu.com/59845622/1/169x260/lonely-planet-sri-lanka.jpg?quality=85)

