

BBInsurance-2017-Annual-Report

You also want an ePaper? Increase the reach of your titles
YUMPU automatically turns print PDFs into web optimized ePapers that Google loves.
Management’s Discussion and Analysis<br />
of Financial Condition and Results of Operations<br />
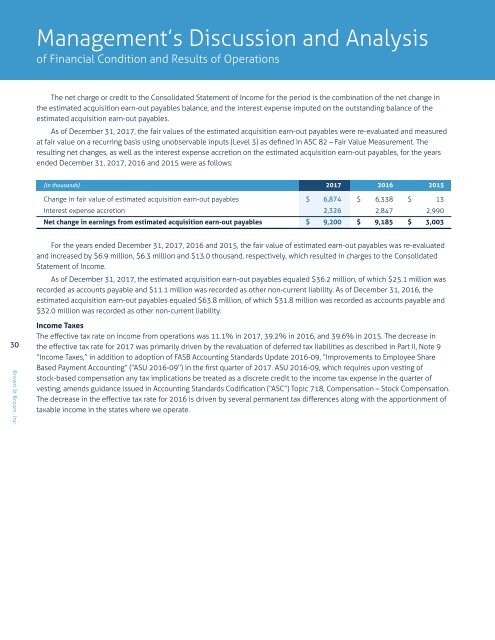
The net charge or credit to the Consolidated Statement of Income for the period is the combination of the net change in<br />
the estimated acquisition earn-out payables balance, and the interest expense imputed on the outstanding balance of the<br />
estimated acquisition earn-out payables.<br />
As of December 31, <strong>2017</strong>, the fair values of the estimated acquisition earn-out payables were re-evaluated and measured<br />
at fair value on a recurring basis using unobservable inputs (Level 3) as defined in ASC 82 – Fair Value Measurement. The<br />
resulting net changes, as well as the interest expense accretion on the estimated acquisition earn-out payables, for the years<br />
ended December 31, <strong>2017</strong>, 2016 and 2015 were as follows:<br />
(in thousands) <strong>2017</strong> 2016 2015<br />
Change in fair value of estimated acquisition earn-out payables $ 6,874 $ 6,338 $ 13<br />
Interest expense accretion 2,326 2,847 2,990<br />
Net change in earnings from estimated acquisition earn-out payables $ 9,200 $ 9,185 $ 3,003<br />
For the years ended December 31, <strong>2017</strong>, 2016 and 2015, the fair value of estimated earn-out payables was re-evaluated<br />
and increased by $6.9 million, $6.3 million and $13.0 thousand, respectively, which resulted in charges to the Consolidated<br />
Statement of Income.<br />
As of December 31, <strong>2017</strong>, the estimated acquisition earn-out payables equaled $36.2 million, of which $25.1 million was<br />
recorded as accounts payable and $11.1 million was recorded as other non-current liability. As of December 31, 2016, the<br />
estimated acquisition earn-out payables equaled $63.8 million, of which $31.8 million was recorded as accounts payable and<br />
$32.0 million was recorded as other non-current liability.<br />
30<br />
Brown & Brown, Inc.<br />
Income Taxes<br />
The effective tax rate on income from operations was 11.1% in <strong>2017</strong>, 39.2% in 2016, and 39.6% in 2015. The decrease in<br />
the effective tax rate for <strong>2017</strong> was primarily driven by the revaluation of deferred tax liabilities as described in Part II, Note 9<br />
“Income Taxes,” in addition to adoption of FASB Accounting Standards Update 2016-09, “Improvements to Employee Share<br />
Based Payment Accounting” (“ASU 2016-09”) in the first quarter of <strong>2017</strong>. ASU 2016-09, which requires upon vesting of<br />
stock-based compensation any tax implications be treated as a discrete credit to the income tax expense in the quarter of<br />
vesting, amends guidance issued in Accounting Standards Codification (“ASC”) Topic 718, Compensation – Stock Compensation.<br />
The decrease in the effective tax rate for 2016 is driven by several permanent tax differences along with the apportionment of<br />
taxable income in the states where we operate.