Tourism Tattler Issue 1 of 2018
The first issue of TourismTattler’s quarterly magazine features the Magic of Kenya, the Secret Season of South Africa’s Whale Coast, the rehabilitation of Pendjari National Park in Benin, and a whole lot more about travel and business tourism in Africa.
The first issue of TourismTattler’s quarterly magazine features the Magic of Kenya, the Secret Season of South Africa’s Whale Coast, the rehabilitation of Pendjari National Park in Benin, and a whole lot more about travel and business tourism in Africa.

You also want an ePaper? Increase the reach of your titles
YUMPU automatically turns print PDFs into web optimized ePapers that Google loves.
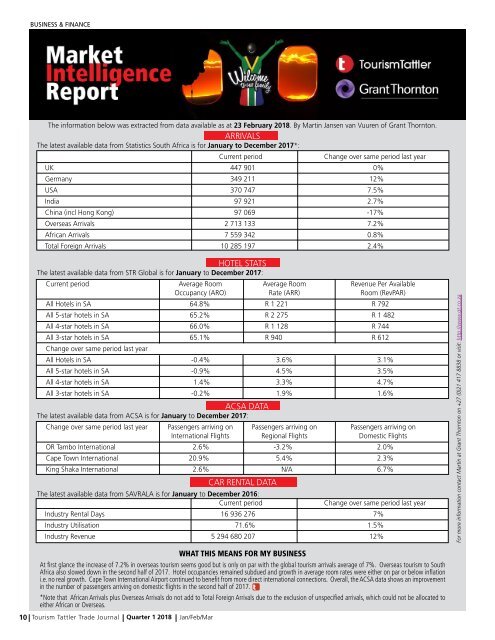
BUSINESS & FINANCE<br />
The information below was extracted from data available as at 23 February <strong>2018</strong>. By Martin Jansen van Vuuren <strong>of</strong> Grant Thornton.<br />
ARRIVALS<br />
The latest available data from Statistics South Africa is for January to December 2017*:<br />
Current period<br />
Change over same period last year<br />
UK 447 901 0%<br />
Germany 349 211 12%<br />
USA 370 747 7.5%<br />
India 97 921 2.7%<br />
China (incl Hong Kong) 97 069 -17%<br />
Overseas Arrivals 2 713 133 7.2%<br />
African Arrivals 7 559 342 0.8%<br />
Total Foreign Arrivals 10 285 197 2.4%<br />
HOTEL STATS<br />
The latest available data from STR Global is for January to December 2017:<br />
Current period Average Room Average Room Revenue Per Available<br />
Occupancy (ARO) Rate (ARR) Room (RevPAR)<br />
All Hotels in SA 64.8% R 1 221 R 792<br />
All 5-star hotels in SA 65.2% R 2 275 R 1 482<br />
All 4-star hotels in SA 66.0% R 1 128 R 744<br />
All 3-star hotels in SA 65.1% R 940 R 612<br />
Change over same period last year<br />
All Hotels in SA -0.4% 3.6% 3.1%<br />
All 5-star hotels in SA -0.9% 4.5% 3.5%<br />
All 4-star hotels in SA 1.4% 3.3% 4.7%<br />
All 3-star hotels in SA -0.2% 1.9% 1.6%<br />
ACSA DATA<br />
The latest available data from ACSA is for January to December 2017:<br />
Change over same period last year Passengers arriving on Passengers arriving on Passengers arriving on<br />
International Flights Regional Flights Domestic Flights<br />
OR Tambo International 2.6% -3.2% 2.0%<br />
Cape Town International 20.9% 5.4% 2.3%<br />
King Shaka International 2.6% N/A 6.7%<br />
CAR RENTAL DATA<br />
The latest available data from SAVRALA is for January to December 2016:<br />
Current period<br />
Change over same period last year<br />
Industry Rental Days 16 936 276 7%<br />
Industry Utilisation 71.6% 1.5%<br />
Industry Revenue 5 294 680 207 12%<br />
For more information contact Martin at Grant Thornton on +27 (0)21 417 8838 or visit: http://www.gt.co.za<br />
10 <strong>Tourism</strong> <strong>Tattler</strong> Trade Journal Quarter 1 <strong>2018</strong> Jan/Feb/Mar<br />
WHAT THIS MEANS FOR MY BUSINESS<br />
At first glance the increase <strong>of</strong> 7.2% in overseas tourism seems good but is only on par with the global tourism arrivals average <strong>of</strong> 7%. Overseas tourism to South<br />
Africa also slowed down in the second half <strong>of</strong> 2017. Hotel occupancies remained subdued and growth in average room rates were either on par or below inflation<br />
i.e. no real growth. Cape Town International Airport continued to benefit from more direct international connections. Overall, the ACSA data shows an improvement<br />
in the number <strong>of</strong> passengers arriving on domestic flights in the second half <strong>of</strong> 2017.<br />
*Note that African Arrivals plus Overseas Arrivals do not add to Total Foreign Arrivals due to the exclusion <strong>of</strong> unspecified arrivals, which could not be allocated to<br />
either African or Overseas.