

2017 York County Hispanic and Latinx Community Assessment - Hess Print Proof

You also want an ePaper? Increase the reach of your titles
YUMPU automatically turns print PDFs into web optimized ePapers that Google loves.
Findings<br />
instances, staff members may play an active role in presenting misinformation about eligibility in an<br />
effort to deter undocumented immigrants. This climate of fear <strong>and</strong> mistrust often discourages individuals<br />
from seeking services for themselves or for their children xiii .<br />
However, this mistrust <strong>and</strong> unequal treatment is not relegated to the undocumented community.<br />
Unconscious bias may lead to an individual making assumptions about a <strong>Hispanic</strong> or <strong>Latinx</strong> resident, <strong>and</strong><br />
therefore execute a discriminatory action or behavior. Due to the social <strong>and</strong> political climate, as well as<br />
the outward appearance or primary language of <strong>Hispanic</strong> <strong>and</strong> <strong>Latinx</strong> residents, some community members<br />
in need of human or social services may not seek those services out of fear of deportation, discrimination,<br />
or harassment.<br />
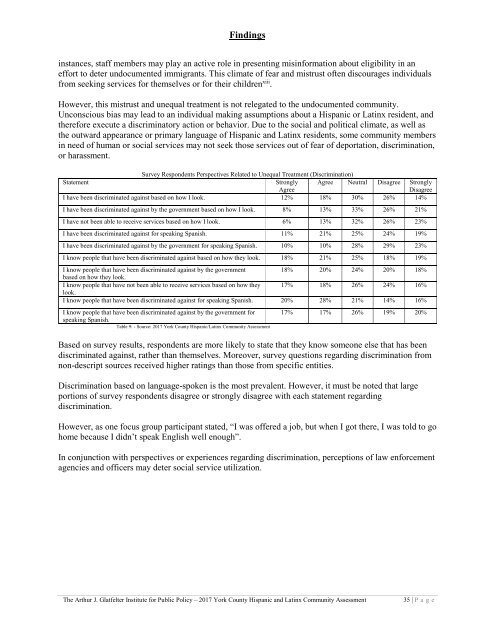
Survey Respondents Perspectives Related to Unequal Treatment (Discrimination)<br />
Statement<br />
Strongly<br />
Agree<br />
Agree Neutral Disagree Strongly<br />
Disagree<br />
I have been discriminated against based on how I look. 12% 18% 30% 26% 14%<br />
I have been discriminated against by the government based on how I look. 8% 13% 33% 26% 21%<br />
I have not been able to receive services based on how I look. 6% 13% 32% 26% 23%<br />
I have been discriminated against for speaking Spanish. 11% 21% 25% 24% 19%<br />
I have been discriminated against by the government for speaking Spanish. 10% 10% 28% 29% 23%<br />
I know people that have been discriminated against based on how they look. 18% 21% 25% 18% 19%<br />
I know people that have been discriminated against by the government<br />
18% 20% 24% 20% 18%<br />
based on how they look.<br />
I know people that have not been able to receive services based on how they 17% 18% 26% 24% 16%<br />
look.<br />
I know people that have been discriminated against for speaking Spanish. 20% 28% 21% 14% 16%<br />
I know people that have been discriminated against by the government for<br />
speaking Spanish.<br />
Table 9: - Source: <strong>2017</strong> <strong>York</strong> <strong>County</strong> <strong>Hispanic</strong>/<strong>Latinx</strong> <strong>Community</strong> <strong>Assessment</strong><br />
17% 17% 26% 19% 20%<br />
Based on survey results, respondents are more likely to state that they know someone else that has been<br />
discriminated against, rather than themselves. Moreover, survey questions regarding discrimination from<br />
non-descript sources received higher ratings than those from specific entities.<br />
Discrimination based on language-spoken is the most prevalent. However, it must be noted that large<br />
portions of survey respondents disagree or strongly disagree with each statement regarding<br />
discrimination.<br />
However, as one focus group participant stated, “I was offered a job, but when I got there, I was told to go<br />
home because I didn’t speak English well enough”.<br />
In conjunction with perspectives or experiences regarding discrimination, perceptions of law enforcement<br />
agencies <strong>and</strong> officers may deter social service utilization.<br />
The Arthur J. Glatfelter Institute for Public Policy – <strong>2017</strong> <strong>York</strong> <strong>County</strong> <strong>Hispanic</strong> <strong>and</strong> <strong>Latinx</strong> <strong>Community</strong> <strong>Assessment</strong><br />
35 | P age