Introduction - Ministério do Meio Ambiente
Introduction - Ministério do Meio Ambiente
Introduction - Ministério do Meio Ambiente

Create successful ePaper yourself
Turn your PDF publications into a flip-book with our unique Google optimized e-Paper software.
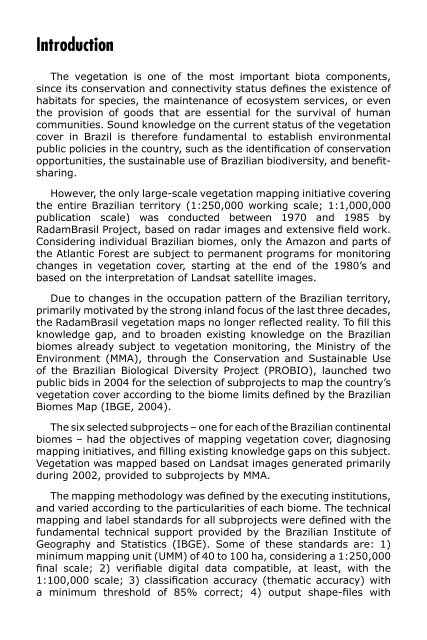
<strong>Introduction</strong><br />
The vegetation is one of the most important biota components,<br />
since its conservation and connectivity status defines the existence of<br />
habitats for species, the maintenance of ecosystem services, or even<br />
the provision of goods that are essential for the survival of human<br />
communities. Sound knowledge on the current status of the vegetation<br />
cover in Brazil is therefore fundamental to establish environmental<br />
public policies in the country, such as the identification of conservation<br />
opportunities, the sustainable use of Brazilian biodiversity, and benefitsharing.<br />
However, the only large-scale vegetation mapping initiative covering<br />
the entire Brazilian territory (1:250,000 working scale; 1:1,000,000<br />
publication scale) was conducted between 1970 and 1985 by<br />
RadamBrasil Project, based on radar images and extensive field work.<br />
Considering individual Brazilian biomes, only the Amazon and parts of<br />
the Atlantic Forest are subject to permanent programs for monitoring<br />
changes in vegetation cover, starting at the end of the 1980’s and<br />
based on the interpretation of Landsat satellite images.<br />
Due to changes in the occupation pattern of the Brazilian territory,<br />
primarily motivated by the strong inland focus of the last three decades,<br />
the RadamBrasil vegetation maps no longer reflected reality. To fill this<br />
knowledge gap, and to broaden existing knowledge on the Brazilian<br />
biomes already subject to vegetation monitoring, the Ministry of the<br />
Environment (MMA), through the Conservation and Sustainable Use<br />
of the Brazilian Biological Diversity Project (PROBIO), launched two<br />
public bids in 2004 for the selection of subprojects to map the country’s<br />
vegetation cover according to the biome limits defined by the Brazilian<br />
Biomes Map (IBGE, 2004).<br />
The six selected subprojects – one for each of the Brazilian continental<br />
biomes – had the objectives of mapping vegetation cover, diagnosing<br />
mapping initiatives, and filling existing knowledge gaps on this subject.<br />
Vegetation was mapped based on Landsat images generated primarily<br />
during 2002, provided to subprojects by MMA.<br />
The mapping metho<strong>do</strong>logy was defined by the executing institutions,<br />
and varied according to the particularities of each biome. The technical<br />
mapping and label standards for all subprojects were defined with the<br />
fundamental technical support provided by the Brazilian Institute of<br />
Geography and Statistics (IBGE). Some of these standards are: 1)<br />
minimum mapping unit (UMM) of 40 to 100 ha, considering a 1:250,000<br />
final scale; 2) verifiable digital data compatible, at least, with the<br />
1:100,000 scale; 3) classification accuracy (thematic accuracy) with<br />
a minimum threshold of 85% correct; 4) output shape-files with
topologic consistency (no overlapping polygons, no space between<br />
polygons, no zero-area polygons, no loops in arches, no polygon without<br />
classification, etc.); 5) classification of vegetation types according to<br />
the IBGE technical manual on vegetation.<br />
It is important to note that, according to MMA determination, areas<br />
with pre<strong>do</strong>minant native vegetation, even if presenting a certain<br />
degree of human use, were accounted for and mapped as a native<br />
vegetation type. On the other hand, areas converted to planted<br />
pastures, agricultural crops, forest plantation, mining activities, urban<br />
occupation, and other similar uses in which the native vegetation<br />
is no longer <strong>do</strong>minant, were accounted for and classified as human<br />
use areas. Another important basic criterion defined by MMA is that<br />
secondary vegetation in advanced development stage was accounted<br />
for and mapped as native vegetation.<br />
The following outputs were produced by the mapping subprojects:<br />
• Final Maps with the cutout of IBGE 1:250,000 charts of the<br />
Brazilian territory. Format: paper (A0 size); electronic (SHP and PDF<br />
files).<br />
• Database with thematic bases in shape-files corresponding to<br />
the IBGE/DSG charts at the 1:250,000 scale. Format: electronic (SHP<br />
file).<br />
• Image charts of the chosen biome with the cutout of IBGE<br />
1:250,000 charts. Format: electronic (GEOTIFF and PDF files).<br />
• Summary map. Format: paper (A0 size); electronic (SHP file).<br />
• Technical Report, according to specific standard.<br />
The Ministry of the Environment has the pleasure of making available<br />
to the interested public the results of the subprojects on the vegetation<br />
mapping of the Brazilian biomes. These results may be consulted and<br />
<strong>do</strong>wnloaded through the Brazilian Biodiversity Portal – PortalBio/MMA,<br />
at the following address: www.mma.gov.br/portalbio.
Amazon Biome<br />
Executing institution: Spatial Sciences,<br />
Applications and Technology Foundation –<br />
FUNCATE.<br />
The Amazon is the largest Brazilian biome,<br />
encompassing an area of 4,196,943 km 2 in Brazil<br />
(IBGE, 2004). This inventory of the native vegetation<br />
types and human occupation of the biome was<br />
conducted through the interpretation of 198 Landsat<br />
images (58% from 2002) in a geo-referenced database, using Spring<br />
software. An image interpretation key was developed, where land<br />
use and vegetation types were associated to the images’ photointerpretation<br />
characteristics. Additionally, a videography was made in<br />
2005, obtaining thousands of lateral images and photographs. These<br />
latter were incorporated to the database and used to resolve difficulties<br />
in image interpretation.<br />
The following final outputs were generated: 1) printed and electronic<br />
index map, which includes the major existing mapping efforts for the<br />
biome; 2) consolidated database containing the obtained thematic and<br />
cartographic data; 3) 261 image charts at 1:250,000 cutout and one<br />
image chart of the final mosaic at the 1:5,000,000 scale (Figure 1),<br />
all in electronic format; 4) 261 vegetation charts at the 1:250,000<br />
scale, and one chart of the final vegetation mosaic (Figure 2) at the<br />
1:5,000,000 scale, all in printed and electronic format; 5) final report.<br />
Precision of this mapping effort was calculated by comparing it to the<br />
mapping conducted by the Amazon Vigilance System (SIVAM – Brazil),<br />
obtaining a precision index of 92.65%.<br />
The pre<strong>do</strong>minant vegetation in the Amazon is the Broadleaf Evergreen<br />
Forest, which occupies 41.67% of the biome. Approximately 12.47%<br />
of the Brazilian Amazon were altered by human activities, of which<br />
2.97% are currently recovering (secondary vegetation) and 9.50% are<br />
under agricultural or livestock activities. All land cover classes obtained<br />
under this study were grouped in the following categories: Native<br />
Forest Vegetation; Native Non-Forest Vegetation (Pioneer Formations,<br />
Ecological Refuges, Bush and Grass-Woody Campinaranas, Park and<br />
Grass-Woody Savanna, Steppe Park Savanna, and Steppe Grass-<br />
Woody Savanna), Human Use Areas, Secondary Vegetation, and Water<br />
(Table 1).
Figure 1. One of the 261 vegetation charts at the 1:250,000 scale generated<br />
for the Amazon biome.
Results were also presented by political-administrative units of the<br />
Amazonian States. The percentage of remaining unaltered forests in<br />
each Brazilian Amazonian State varies widely, from 23.82% in Maranhão<br />
State to 92.84% in Amazonas State.<br />
Table 1. Characterization of the Amazon biome by Grouped<br />
Phyto-ecological Region.<br />
Grouped Phyto-ecological Region Area (km 2 ) %<br />
Native Forest Vegetation 3,416,391.23 80.76<br />
Native Non-Forest Vegetation 178,821.18 4.23<br />
Human Use Areas 401,855.83 9.50<br />
Secondary Vegetation 125,635.01 2.97<br />
Water 107,787.52 2.55<br />
Total 4,230,490.77 100.00<br />
Figure 2: (A) Image mosaic of the Brazilian Amazon. (B) Final mosaic<br />
generated by the Brazilian Amazon vegetation mapping effort.<br />
Results obtained by this mapping effort are compatible to those<br />
published by the National Spatial Research Institute (INPE) as part<br />
of the Amazon Deforestation Estimate Project (PRODES), which<br />
inventoried the deforested areas of broadleaf evergreen forest in the<br />
Brazilian Legal Amazon in 2002.<br />
Small differences between the results of both efforts are related<br />
to metho<strong>do</strong>logical differences. For example, PRODES has the Legal<br />
Amazon 1 as reference area, an area approximately 825,000 km 2 larger<br />
than the Amazon biome. In addition, PRODES aimed at mapping human<br />
use over forested phyto-physiognomies, while the present effort had<br />
the objective of mapping human use and vegetation cover regardless<br />
of phyto-physiognomy, thus also mapping human use present in nonforest<br />
phyto-physiognomies. Another important difference is the fact<br />
that PRODES <strong>do</strong>es not include mapping of secondary vegetation, which<br />
was included in the present effort.<br />
1 The Legal Amazon is an administrative area comprised by the following Brazilian States: Acre,<br />
Amapá, Amazonas, Pará, Rondônia, Roraima, and parts of Mato Grosso, Tocantins and Maranhão.
Pantanal Biome<br />
Executing institutions: Embrapa Agricultural and<br />
Livestock Informatics, Embrapa Beef Livestock,<br />
National Spatial Research Institute – INPE, and<br />
Pantanal Environment Institute – IMAP/SEMA -<br />
MS.<br />
Within Brazil, the Pantanal covers an estimated<br />
area of 150,355 km 2 (IBGE, 2004). A total of 16<br />
Landsat images, all generated in 2002, were used to map the biome’s<br />
vegetation. The preparation of the vegetation cover charts at a<br />
1:250,000 scale followed these metho<strong>do</strong>logical procedures: gathering<br />
of existing materials; data systematization; field work; inclusion of<br />
the maps in the geo-referenced database; and preparation of the final<br />
report. SPRING software was used to structure the geo-referenced<br />
database. Field work included eight field trips, most of which counted<br />
with a field team comprised of three botanists and two geo-technology<br />
experts. The classification and characterization of mapped phytophysiognomies<br />
were developed based on floristic, structural, and<br />
environmental composition data obtained during field work. Field work<br />
was thus fundamental to verify questionable information on the limits<br />
of vegetation classes in draft maps, allowing the necessary adjustments<br />
and corrections for consolidating the map on current vegetation cover.<br />
The following final outputs were generated: 1) printed and electronic<br />
index map at the 1:1,000,000 scale, containing the previous mapping<br />
efforts for the Pantanal biome; 2) ArcMAP database; 3) 20 image<br />
charts at the 1:250,000 cutout and one image chart of the final mosaic<br />
at the 1:1,000,000 scale (Figure 3); 4) 20 vegetation charts at the<br />
1:250,000 scale, all in printed and electronic format; 5) final report.<br />
Data obtained by this sub-project indicate that the Pantanal biome<br />
is still mostly conserved (based on 2002 data), with 86.77% of native<br />
vegetation cover, against 11.54% of human use areas (Table 2).<br />
The forest phyto-physiognomies (Seasonal Semideciduous Forest and<br />
Seasonal Deciduous Forest) represent 5.07% of the biome area, while<br />
non-forest phyto-physiognomies (Savanna [Cerra<strong>do</strong>], Steppe Savanna<br />
[Chaco], Pioneer Formations, and Ecological Transition Areas or
Vegetation Contact Areas [Ecotones and Enclaves]) represent 81.70%<br />
of the Pantanal area. The Savanna (Cerra<strong>do</strong>) is pre<strong>do</strong>minant in 52.60%<br />
of the biome, followed by Ecological Transition Areas, which occur in<br />
17.60% of the area. Concerning human use areas, it was observed<br />
that agriculture is not a significant activity in the biome (0.26%),<br />
being replaced by extensive cattle ranching on planted pastures, which<br />
represent 10.92% of the biome area and occupy 94.68% of the human<br />
use area.<br />
Table 2. Characterization of the Pantanal biome by Grouped<br />
Phyto-ecological Region.<br />
Grouped Phyto-ecological Region Area (km 2 ) %<br />
Native Forest Vegetation 7,662.00 5.07<br />
Native Non-Forest Vegetation 123,527.00 81.70<br />
Human Use Areas 17,439.90 11.54<br />
Water 2,557.30 1.69<br />
Total 151,186.20 100.00<br />
Some differences observed between this mapping effort and the<br />
one conducted under the Conservation Plan of the Upper Paraguai<br />
River Watershed – PCBAP (Pott et al., 1997) should be noted. Some<br />
areas mapped by PCBAP as<br />
belonging to the Cerra<strong>do</strong><br />
Phyto-ecological Region were<br />
mapped here as Chaco in the<br />
Nabileque sub-region; areas<br />
mapped as Chaco (Td) by<br />
PCBAP were mapped here as<br />
ecotones between Deciduous<br />
Forest and Chaco in the<br />
Porto Murtinho sub-region;<br />
in constantly flooded areas,<br />
Pioneer Vegetation areas<br />
were mapped here where<br />
PCBAP mapped Grasslands<br />
and Woody Cerra<strong>do</strong>; and, due<br />
to flooding, pioneer species<br />
penetrated other phytoecological<br />
regions, mapped<br />
in this effort as ecotones.<br />
This mapping refinement was<br />
possible because the present<br />
project obtained a larger<br />
amount of field data.<br />
Figure 3. Image chart of the final mosaic<br />
of the Pantanal biome in 2002.
Cerra<strong>do</strong> Biome<br />
Executing institutions: Embrapa Cerra<strong>do</strong>s,<br />
Federal University of Uberlândia - UFU, Federal<br />
University of Goiás – UFG, and Research and<br />
Agribusiness Support Foundation – FAGRO.<br />
The Cerra<strong>do</strong> is the second largest biome in Brazil,<br />
covering an area estimated as 2,036,448 km 2 within the<br />
national territory (IBGE, 2004). A total of 114 Landsat<br />
images were analyzed, all from 2002, and most of which were obtained<br />
in the months of August, September and October, corresponding to<br />
the dry season. Due to cloud cover problems, analysis of 33% of the<br />
images required the combination of two images of the same area,<br />
obtained in different months. SPRING software was used to process<br />
image segmentation, and the segments were converted to shape-files.<br />
Each segment was visually associated to a land cover class on the<br />
computer screen, by overlapping the image cutout with the vectorial<br />
segmentation map, using a mapping scale of approximately 1:50,000.<br />
Polygons smaller than 40 ha were combined to the largest adjacent<br />
class.<br />
To minimize eventual mapping errors, images taken at multiple times<br />
by the Terra/MODIS sensor, as well as contour lines of the biome, and<br />
field work, were also applied in the analyses. Field verifications of the<br />
southern portion of the biome were conducted in two field expeditions<br />
with average duration of seven days each. Six shorter expeditions (1<br />
to 3 days) were conducted in the northern portion of the biome, to the<br />
agricultural regions of Barreiras (Bahia State), PAD (Federal District),<br />
and to the region surrounding the Chapada <strong>do</strong>s Veadeiros National Park<br />
(Cavalcante, Goiás State), where native vegetation is pre<strong>do</strong>minant.<br />
Cultivated pastures were segregated from native pastures through<br />
visual analysis of images, where cultivated pastures present a more<br />
regular geometric pattern than native ones, and through municipal<br />
data obtained by the IBGE Agricultural and Ranching Census. Despite<br />
being seven years old, the Agricultural and Ranching Census is the only<br />
official set of data discriminating cultivated from native pastures at a<br />
scale compatible with the effort of mapping the Cerra<strong>do</strong>.<br />
The following final outputs were generated: 1) printed and<br />
electronic index map of the major existing mapping efforts for the<br />
biome; 2) consolidated database containing the obtained thematic and<br />
cartographic data; 3) 172 image charts at the 1:250,000 cutout and<br />
one image chart of the final mosaic at the 1:5,000,000 scale, all in<br />
electronic format; 4) 172 vegetation charts at the 1:250,000 scale,<br />
and one chart of the final vegetation mosaic at the 1:5,000,000 scale,<br />
all in printed and electronic format; 5) final report.
Results obtained by this sub-project indicate that the Cerra<strong>do</strong> area<br />
covered by the various phyto-physiognomies of native vegetation<br />
represents 60.42% of the biome in Brazil (Figure 4), according to 2002<br />
data. The pre<strong>do</strong>minant Phyto-ecological Region is the Woody Savanna,<br />
corresponding to 20.42% of the Cerra<strong>do</strong>, followed by Park Savanna,<br />
which covers 15.81% of the biome. The area covered by the various<br />
forest phyto-physiognomies encompasses 36.73% of the biome, while<br />
the non-forest area covers 23.68% of the biome. The remaining area<br />
(38.98%) corresponds to human use areas, where cultivated pasture<br />
is the pre<strong>do</strong>minant category (26.45% of the biome), and to water<br />
(0.60%) (Table 3).<br />
Table 3. Characterization of the Cerra<strong>do</strong> biome by Grouped<br />
Phyto-ecological Region.<br />
Grouped Phyto-ecological Region Area (km 2 ) %<br />
Native Forest Vegetation 751,943.49 36.73<br />
Native Non-Forest Vegetation 484,827.26 23.68<br />
Human Use Areas 797,991.72 38.98<br />
Water 12,383.88 0.60<br />
Total 2,047,146.35 100.00<br />
Results from this mapping exercise showed a larger percentage of<br />
Cerra<strong>do</strong> native vegetation cover than previous studies. This difference<br />
is primarily explained by the inclusion, in this mapping effort, of<br />
approximately 28 million hectares of native pastures in the native<br />
vegetation category. If this area was accounted as human use area,<br />
as in previous studies, the<br />
percentage of area covered<br />
with native vegetation<br />
obtained in this effort would<br />
be reduced to 46.74%.<br />
This difference can also be<br />
explained by differences<br />
in spatial resolution of the<br />
satellites generating the used<br />
data. The study conducted by<br />
Conservation International<br />
(Macha<strong>do</strong> et al., 2004), for<br />
instance, was based on the<br />
analysis of satellite images<br />
with a spatial resolution of 1<br />
km, much coarser than the<br />
30-meter resolution of the<br />
Landsat satellite images used<br />
in this mapping effort.<br />
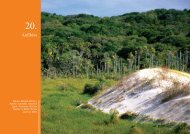
Figure 4. Spatial distribution of areas<br />
occupied by native vegetation (green),<br />
human use areas (pink), and water (blue) in<br />
the Cerra<strong>do</strong> biome.
Caatinga Biome<br />
Executing institutions State University of<br />
Feira de Santana - UEFS, Plantas <strong>do</strong> Nordeste<br />
Association – APNE, Embrapa Soils, Embrapa<br />
Semi-arid, Federal University of Ceará - UFC,<br />
Federal University of Rio Grande <strong>do</strong> Norte - UFRN,<br />
Rural Federal University of Pernambuco - UFRPE,<br />
Federal University of Paraíba - UFPB, Bahia<br />
Environmental Resources Center – CRA, and<br />
Bahia State Secretariat of Environment and Water<br />
Resources - SEMARH.<br />
The Caatinga is the only Brazilian biome entirely within the national<br />
territory, covering an area of 844,453 km 2 (IBGE, 2004). A total of<br />
54 Landsat images (all generated in 2002) were processed to map<br />
the biome’s vegetation. The following activities were executed: 1)<br />
Inventory of the mapping initiatives for the biome; 2) Electronic<br />
processing of satellite images; 3) Validation of interpretation and<br />
classifications; 4) Data integration; 5) Vectorization and editing of<br />
the final cartographic products. The maps result from computerassisted<br />
image classification and geo-processing of electronic land<br />
models produced by NASA. Preliminary results were validated by field<br />
teams composed by experts on flora, phyto-physiognomy, and phytosociology<br />
characterization, who inspected areas selected by probability<br />
criteria to provide a representativeness level compatible with the<br />
mapping scale. The following final outputs were generated: 1) printed<br />
and electronic index map of the major existing mapping efforts for the<br />
biome; 2) consolidated database containing the obtained thematic and<br />
cartographic data; 3) 48 image charts at the 1:250,000 cutout and<br />
one image chart of the final mosaic at the 1:5,000,000 scale, all in<br />
electronic format; 4) 48 vegetation charts at the 1:250,000 scale, and<br />
one chart of the final vegetation mosaic at the 1:5,000,000 scale, all<br />
in printed and electronic format; 5) final report.
Results obtained by this mapping effort indicate that the Caatinga<br />
presents an area of 518,635 km 2 covered with native vegetation,<br />
which corresponds to 62.69% of the mapped biome (Figure 5).<br />
This estimate includes the following phyto-physiognomies: Caatinga<br />
(Steppe Savanna according to the a<strong>do</strong>pted classification, 35.90%),<br />
enclaves of Cerra<strong>do</strong> and Atlantic Forest phyto-physiognomies possible<br />
to map (8.43%), as well as ecological transition areas (ecotones and<br />
enclaves not possible to map, 18%). These calculations considered all<br />
well-preserved areas larger than 40 ha and those with signs of human<br />
activity, but which present, according to the project team’s evaluation,<br />
significant chances of regenerating or possibility of co-existence with<br />
low-impact interventions.<br />
Table 4. Characterization of the Caatinga Biome by Grouped<br />
Phyto-ecological Region.<br />
Grouped Phyto-ecological Region Area (km 2 ) %<br />
Native Forest Vegetation 201,428.00 24.39<br />
Native Non-Forest Vegetation 316,889.00 38.38<br />
Human Use Areas 299,616.00 36.28<br />
Water 7,817.00 0.95<br />
Total 825,750.00 100.00<br />
In 1990, UNDP/FAO/IBAMA quantified native vegetation in four<br />
States as 41.5%, compared<br />
to approximately 65% in 1984<br />
(RadamBrasil data). RadamBrasil<br />
was concluded in 1985, but the<br />
project’s data were collected<br />
throughout two decades. Therefore,<br />
this number reflects changes over a<br />
longer period, instead of a sudden<br />
reduction of the vegetation cover.<br />
The trend obtained with these<br />
estimates indicates a rate of 500,000<br />
ha per year for loss of vegetation<br />
cover in the biome. Compared to<br />
trends found in previous mapping<br />
efforts, which indicate an estimated<br />
projected vegetation cover of 30%<br />
to 34%, the present results were<br />
considered compatible, suggesting a<br />
small decrease in the deforestation<br />
rate for the biome. However,<br />
these numbers may also represent Figure 5. Vegetation cover map of<br />
metho<strong>do</strong>logical differences in the the Caatinga biome.<br />
quantification of native vegetation<br />
cover.
Atlantic Forest Biome<br />
Executing institutions: Geosciences Institute<br />
of the Federal University of Rio de Janeiro – UFRJ,<br />
Geography Department of the Fluminense Federal<br />
University – UFF, and Socio-environmental Studies<br />
Institute of the South of Bahia – IESB.<br />
The Atlantic Forest covers an area of 1,110,182<br />
km 2 in Brazil (IBGE, 2004). A total of 96 images were<br />
processed to map its vegetation cover, 72% of which were generated<br />
between 2001 and 2003. Despite this flexible image generation period,<br />
it was impossible to obtain a complete biome cover free of cloud<br />
influence, especially for the northeastern region. The team chose to<br />
use 90 Landsat images and, for mapping the northeastern region, one<br />
SPOT 4 (2004) and 5 CCD/CBERS (2005) additional images were used,<br />
all with a 20 m spatial resolution. Field work involved 7 to 8-day ground<br />
expeditions with teams of 3 to 4 people, dividing the biome in 12 areas.<br />
Travel routes were selected to cover the broadest geomorphological<br />
diversity and to approach the main differentiated spectral response<br />
standards. Sampling followed a stratified ran<strong>do</strong>m approach, with<br />
an average collection of 1,000 points per area. Analyzed images<br />
were segmented with eCognition software. Supervised classification<br />
preferably used fuzzy modeling with the assistance of target spectral<br />
behavior analysis (defined by training areas obtained in the field)<br />
to group similar objects. The electronic classification was submitted<br />
to a visual editing process (based on field data, secondary data and<br />
image interpretation), followed by manipulation with spatial analysis<br />
integration function. The following final outputs were generated: 1)<br />
printed and electronic index map of the major existing mapping efforts<br />
for the biome; 2) consolidated database containing the obtained<br />
thematic and cartographic data; 3) 86 image charts at the 1:250,000<br />
cutout and one image chart of the final mosaic at the 1:5,000,000<br />
scale, all in electronic format; 4) 86 vegetation charts at the 1:250,000<br />
scale, and one chart of the final vegetation mosaic at the 1:5,000,000<br />
scale, all in printed and electronic format; 5) final report. Observation<br />
points obtained during field work and not consulted for the classification<br />
process were used to validate the final product. Considering the entire<br />
biome, the mapping effort obtained a precision index of 86.39%.<br />
The total area covered by native vegetation in the biome was<br />
calculated as 26.97%, of which 21.80% are composed by distinct forest<br />
physiognomies (Table 5, Figure 6). The Broadleaf Evergreen Forests<br />
(9.10%) are the main forest component of the biome, followed by<br />
Seasonal Semideciduous Forests (5.18%). The worst scenario belongs
to the Open Broadleaf Forests (with palm trees), which are almost<br />
extinct today (0.25% of the biome). Among the enclaves, the Grass-<br />
Woody Steppes (Pampas) are the most representative physiognomy in<br />
the biome (2.69% of the biome).<br />
Table 5. Characterization of the Atlantic Forest biome by<br />
Grouped Phyto-ecological Region.<br />
Grouped Phyto-ecological Region Area (km 2 ) %<br />
Native Forest Vegetation 230,900.49 21.80<br />
Native Non-Forest Vegetation 40,689.04 3.84<br />
Pioneer Formations 14,051.26 1.33<br />
Human Use Areas 751,372.78 70.95<br />
Water 15,364.13 1.45<br />
Unclassified 6,650.15 0.63<br />
Total 1,059,027.85 100.00<br />
Results found by this mapping effort differ from the numbers<br />
presented in the Atlas of the Atlantic Forest Remnants (Fundação SOS<br />
Mata Atlântica, 2002), being significantly greater. However, comparisons<br />
between these two studies should be regarded with caution, considering<br />
that: 1) there are differences concerning the biome limits a<strong>do</strong>pted by<br />
each study (Brazilian Biomes Map – IBGE, 2004, versus limits of the<br />
Atlantic Forest <strong>do</strong>main defined in the IBGE Vegetation Map, 1993); 2)<br />
mapping scales are different (medium detail: 1:250,000 and macro<br />
detail: 1:50,000), being therefore necessary to verify if data sources<br />
used (image resolution) comply with the final analysis scale; 3) the<br />
present study includes non-forest phyto-physiognomies and all types of<br />
pioneer formations (including alluvial communities and sandy strips);<br />
4) Dense, Open, and Mixed<br />
Broadleaf Forest, and Seasonal<br />
Deciduous and Semideciduous<br />
Forest were included among<br />
forest formations. Also<br />
differently from the Atlas,<br />
the Woody Savannas, Woody<br />
Steppe Savannas, and all<br />
Areas of Ecological Transition<br />
were considered as forests;<br />
5) totals obtained include<br />
secondary vegetation in<br />
advanced development stage,<br />
as established by MMA.<br />
Figure 6. Vegetation cover map of the Atlantic Forest biome (Southeast<br />
Region).
Pampas Biome<br />
Executing institutions: Federal University<br />
of Rio Grande <strong>do</strong> Sul – UFRGS, Support<br />
Foundation of the Federal University of Rio<br />
Grande <strong>do</strong> Sul – FAURGS, Embrapa Temperate<br />
Climate, and Embrapa Livestock South.<br />
The Pampas biome comprises the grasslands of<br />
Missions and of the southern portion of Rio Grande <strong>do</strong><br />
Sul State, covering an approximate area of 176,496 km 2 ( I B G E ,<br />
2004). For mapping the Pampas vegetation 22 Landsat images were<br />
used, all generated in 2002. A mosaic was formed with the images<br />
to produce a single file for the entire biome. For interpretation, this<br />
mosaic was divided into 23 image charts based on systematic mapping<br />
at the 1:250,000 scale. For each map win<strong>do</strong>w, two false-color images<br />
were generated, using bands 3, 4 and 5. Soil cover classes were<br />
obtained through visual on-screen interpretation, with the assistance<br />
of CartaLinx software. Areas covered with Pampas original vegetation<br />
were identified on the colored composites enlarged on-screen to the<br />
1:50,000 scale. Each classification was verified on the ground by eight<br />
field expeditions with an average duration of four days, covering the<br />
various physiognomies of the Pampas. Image interpretation sought<br />
to identify categories indicating a forest or grassland physiognomic<br />
<strong>do</strong>main, or indicating the degree of human pressure on the specific<br />
vegetation formation. Both the grassland and forest formations<br />
present some degree of alteration in comparison to their original<br />
characteristics. Alteration degree was used as a criterion to decide if a<br />
given vegetation cover should be classified as native vegetation.<br />
The following final outputs were generated: 1) printed and electronic<br />
index map, which includes the major existing mapping efforts for the<br />
biome; 2) consolidated database containing the obtained thematic and<br />
cartographic data; 3) 23 image charts at the 1:250,000 cutout and<br />
one image chart of the final mosaic, all in electronic format; 4) 23<br />
vegetation charts at the 1:250,000 scale, and one chart of the final<br />
vegetation mosaic (Figure 7), all in printed and electronic format; 5)<br />
final report.
This mapping of the Pampas biome vegetation cover identified three<br />
types of vegetation formation: Grasslands, Forests and Transition Areas.<br />
A total of 41.32% of the Pampas biome present native vegetation cover,<br />
while 48.70% are modified by human use (Table 6).<br />
Table 6. Characterization of the Pampas Biome by Grouped<br />
Phyto-ecological Region.<br />
Grouped Phyto-ecological Region Area (km 2 ) %<br />
Native Forest Vegetation 9,591.05 5.38<br />
Native Grassland Vegetation 41,054.61 23.03<br />
Native Vegetation - Transition 23,004.08 12.91<br />
Human Use Areas 86,788.70 48.70<br />
Water 17,804.57 9.98<br />
Total 178,243.01 100.00<br />
Figure 7. Final mosaic of the<br />
Pampas biome vegetation mapping.<br />
References<br />
Fundação SOS Mata Atlântica & Instituto<br />
Nacional de Pesquisas Espaciais –<br />
INPE. 2002. Atlas <strong>do</strong>s Remanescentes<br />
Florestais da Mata Atlântica: perío<strong>do</strong><br />
1995-2000. Relatório Final.<br />
IBGE. 2004. Mapa de Biomas <strong>do</strong> Brasil,<br />
primeira aproximação. Rio de Janeiro:<br />
IBGE. Acessível em www.ibge.gov.br.<br />
Macha<strong>do</strong>, R. B., M. B. Ramos Neto, P. G. P.<br />
Pereira, E. F. Caldas, D. A. Gonçalves,<br />
N. S. Santos, K. Tabor, & M. Steininger.<br />
2004. Estimativas de perda da área <strong>do</strong><br />
Cerra<strong>do</strong> brasileiro. Brasília: Conservação<br />
Internacional. 23p. Acessível em<br />
www.conservation.org.br/arquivos/<br />
RelatDesmatamCerra<strong>do</strong>.pdf.<br />
Pott, A., J. S. V. Silva, M. M. Ab<strong>do</strong>n, V. J.<br />
Pott, L. M. Rodrigues, S. M. Salis & G.<br />
G. Hatschbach. 1997. Vegetação. In:<br />
PLANO DE CONSERVAÇÃO DA BACIA<br />
DO ALTO PARAGUAI – PCBAP/Projeto<br />
Pantanal. <strong>Ministério</strong> <strong>do</strong> <strong>Meio</strong> <strong>Ambiente</strong>,<br />
<strong>do</strong>s Recursos Hídricos e da Amazônia<br />
Legal - Subcomponente Pantanal.<br />
Diagnóstico <strong>do</strong>s meios físico e biótico.<br />
Brasília: MMA/SEMAM/PNMA. 194p