18:33 - ISS
18:33 - ISS
18:33 - ISS

Create successful ePaper yourself
Turn your PDF publications into a flip-book with our unique Google optimized e-Paper software.
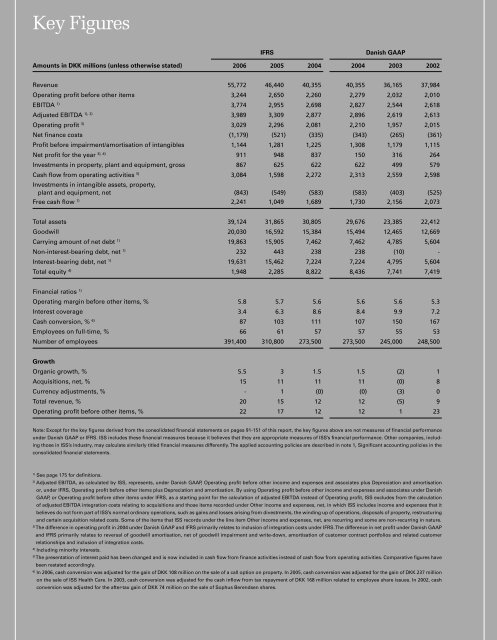
Key Figures<br />
IFRS Danish GAAP<br />
Amounts in DKK millions (unless otherwise stated) 2006 2005 2004 2004 2003 2002<br />
Revenue 55,772 46,440 40,355 40,355 36,165 37,984<br />
Operating profit before other items 3,244 2,650 2,260 2,279 2,032 2,010<br />
EBITDA 1) 3,774 2,955 2,698 2,827 2,544 2,6<strong>18</strong><br />
Adjusted EBITDA 1), 2) 3,989 3,309 2,877 2,896 2,619 2,613<br />
Operating profit 3) 3,029 2,296 2,081 2,210 1,957 2,015<br />
Net finance costs (1,179) (521) (<strong>33</strong>5) (343) (265) (361)<br />
Profit before impairment/amortisation of intangibles 1,144 1,281 1,225 1,308 1,179 1,115<br />
Net profit for the year 3), 4) 911 948 837 150 316 264<br />
Investments in property, plant and equipment, gross 867 625 622 622 499 579<br />
Cash flow from operating activities 5) Investments in intangible assets, property,<br />
3,084 1,598 2,272 2,313 2,559 2,598<br />
plant and equipment, net (843) (549) (583) (583) (403) (525)<br />
Free cash flow 1) 2,241 1,049 1,689 1,730 2,156 2,073<br />
Total assets 39,124 31,865 30,805 29,676 23,385 22,412<br />
Goodwill 20,030 16,592 15,384 15,494 12,465 12,669<br />
Carrying amount of net debt 1) 19,863 15,905 7,462 7,462 4,785 5,604<br />
Non-interest-bearing debt, net 1) 232 443 238 238 (10) -<br />
Interest-bearing debt, net 1) 19,631 15,462 7,224 7,224 4,795 5,604<br />
Total equity 4) 1,948 2,285 8,822 8,436 7,741 7,419<br />
Financial ratios 1)<br />
Operating margin before other items, % 5.8 5.7 5.6 5.6 5.6 5.3<br />
Interest coverage 3.4 6.3 8.6 8.4 9.9 7.2<br />
Cash conversion, % 6) 87 103 111 107 150 167<br />
Employees on full-time, % 66 61 57 57 55 53<br />
Number of employees 391,400 310,800 273,500 273,500 245,000 248,500<br />
Growth<br />
Organic growth, % 5.5 3 1.5 1.5 (2) 1<br />
Acquisitions, net, % 15 11 11 11 (0) 8<br />
Currency adjustments, % - 1 (0) (0) (3) 0<br />
Total revenue, % 20 15 12 12 (5) 9<br />
Operating profit before other items, % 22 17 12 12 1 23<br />
Note: Except for the key figures derived from the consolidated financial statements on pages 91-151 of this report, the key figures above are not measures of financial performance<br />
under Danish GAAP or IFRS. <strong>ISS</strong> includes these financial measures because it believes that they are appropriate measures of <strong>ISS</strong>’s financial performance. Other companies, including<br />
those in <strong>ISS</strong>’s industry, may calculate similarly titled financial measures differently. The applied accounting policies are described in note 1, Significant accounting policies in the<br />
consolidated financial statements.<br />
1) See page 175 for definitions.<br />
2) Adjusted EBITDA, as calculated by <strong>ISS</strong>, represents, under Danish GAAP, Operating profit before other income and expenses and associates plus Depreciation and amortisation<br />
or, under IFRS, Operating profit before other items plus Depreciation and amortisation. By using Operating profit before other income and expenses and associates under Danish<br />
GAAP, or Operating profit before other items under IFRS, as a starting point for the calculation of adjusted EBITDA instead of Operating profit, <strong>ISS</strong> excludes from the calculation<br />
of adjusted EBITDA integration costs relating to acquisitions and those items recorded under Other income and expenses, net, in which <strong>ISS</strong> includes income and expenses that it<br />
believes do not form part of <strong>ISS</strong>’s normal ordinary operations, such as gains and losses arising from divestments, the winding up of operations, disposals of property, restructuring<br />
and certain acquisition related costs. Some of the items that <strong>ISS</strong> records under the line item Other income and expenses, net, are recurring and some are non-recurring in nature.<br />
3) The difference in operating profit in 2004 under Danish GAAP and IFRS primarily relates to inclusion of integration costs under IFRS. The difference in net profit under Danish GAAP<br />
and IFRS primarily relates to reversal of goodwill amortisation, net of goodwill impairment and write-down, amortisation of customer contract portfolios and related customer<br />
relationships and inclusion of integration costs.<br />
4) Including minority interests.<br />
5) The presentation of interest paid has been changed and is now included in cash flow from finance activities instead of cash flow from operating activities. Comparative figures have<br />
been restated accordingly.<br />
6) In 2006, cash conversion was adjusted for the gain of DKK 108 million on the sale of a call option on property. In 2005, cash conversion was adjusted for the gain of DKK 237 million<br />
on the sale of <strong>ISS</strong> Health Care. In 2003, cash conversion was adjusted for the cash inflow from tax repayment of DKK 168 million related to employee share issues. In 2002, cash<br />
conversion was adjusted for the after-tax gain of DKK 74 million on the sale of Sophus Berendsen shares.