

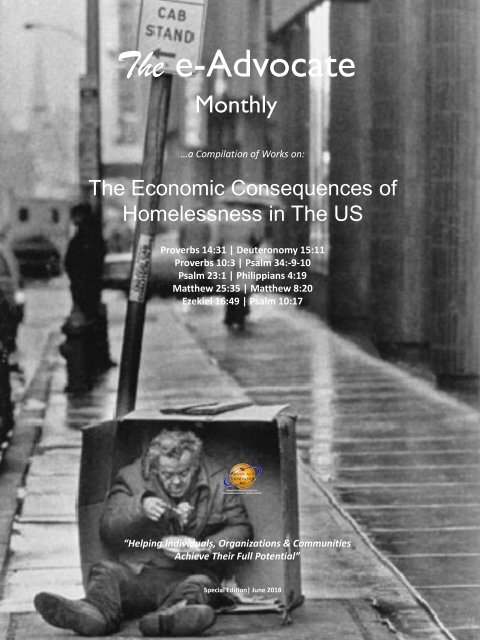
The Economic Consequences of Homelessness in The US
The Economic Consequences of Homelessness in The US
The Economic Consequences of Homelessness in The US

You also want an ePaper? Increase the reach of your titles
YUMPU automatically turns print PDFs into web optimized ePapers that Google loves.
<strong>The</strong> e-Advocate<br />
Monthly<br />
…a Compilation <strong>of</strong> Works on:<br />
<strong>The</strong> <strong>Economic</strong> <strong>Consequences</strong> <strong>of</strong><br />
<strong>Homelessness</strong> <strong>in</strong> <strong>The</strong> <strong>US</strong><br />
Proverbs 14:31 | Deuteronomy 15:11<br />
Proverbs 10:3 | Psalm 34:-9-10<br />
Psalm 23:1 | Philippians 4:19<br />
Matthew 25:35 | Matthew 8:20<br />
Ezekiel 16:49 | Psalm 10:17<br />
“Help<strong>in</strong>g Individuals, Organizations & Communities<br />
Achieve <strong>The</strong>ir Full Potential”<br />
Special Edition| June 2018
Turn<strong>in</strong>g the Improbable<br />
Into the Exceptional!<br />
Page 2 <strong>of</strong> 289
<strong>The</strong> Social Cost <strong>of</strong> <strong>Homelessness</strong><br />
Average Daily Number <strong>of</strong> Homeless <strong>in</strong> the <strong>US</strong> 553,742 1<br />
Average M<strong>in</strong>imum Cost per Person $30,000 2<br />
M<strong>in</strong>imum Social Cost to <strong>US</strong> taxpayers $16,612,260,000 3<br />
($332M per state)<br />
Federal Government Support for <strong>Homelessness</strong> $5,822,000,000 2<br />
($116M per state)<br />
Discrepancy $10,790,260,000<br />
($216M per state short)<br />
Solutions<br />
1. <strong>The</strong> A/F Inner-Cities Strategic Revitalization Initiative (M. Merrill)<br />
2. <strong>The</strong> A/F Strategic Hous<strong>in</strong>g Revitalization Initiative (A. Carbone)<br />
3. <strong>The</strong> A/F Balanced Home Mortgage Initiative (L. Folks)<br />
4. <strong>The</strong> A/F Jobs Tra<strong>in</strong><strong>in</strong>g Educational Redevelopment <strong>Economic</strong> Emancipation Initiative (R. Green)<br />
Note:<br />
In Silicon Valley, CA, the top 5% <strong>of</strong> the Homeless population accounts for 47% <strong>of</strong> all public costs.<br />
1<br />
U.S. Dept. <strong>of</strong> Hous<strong>in</strong>g and Urban Development<br />
2<br />
U.S. Interagency Council on <strong>Homelessness</strong><br />
3<br />
<strong>The</strong> stated costs only reflect traditional solutions, such as Emergency Shelters, Transitional Hous<strong>in</strong>g Support, and<br />
Permanent Supportive Hous<strong>in</strong>g. Costs not factored-<strong>in</strong> to these equations <strong>in</strong>clude, but are by no means limited to,<br />
the follow<strong>in</strong>g: F<strong>in</strong>ancial, Health Care, Environmental, Crim<strong>in</strong>al Justice, and Social.<br />
Page 3 <strong>of</strong> 289
Page 4 <strong>of</strong> 289
<strong>The</strong> Advocacy Foundation, Inc.<br />
Help<strong>in</strong>g Individuals, Organizations & Communities<br />
Achieve <strong>The</strong>ir Full Potential<br />
S<strong>in</strong>ce its found<strong>in</strong>g <strong>in</strong> 2003, <strong>The</strong> Advocacy Foundation has become recognized as an effective<br />
provider <strong>of</strong> support to those who receive our services, hav<strong>in</strong>g real impact with<strong>in</strong> the communities<br />
we serve. We are currently engaged <strong>in</strong> community and faith-based collaborative <strong>in</strong>itiatives,<br />
hav<strong>in</strong>g the overall objective <strong>of</strong> eradicat<strong>in</strong>g all forms <strong>of</strong> youth violence and correct<strong>in</strong>g <strong>in</strong>justices<br />
everywhere. In carry<strong>in</strong>g-out these <strong>in</strong>itiatives, we have adopted the evidence-based strategic<br />
framework developed and implemented by the Office <strong>of</strong> Juvenile Justice & Del<strong>in</strong>quency<br />
Prevention (OJJDP).<br />
<strong>The</strong> stated objectives are:<br />
1. Community Mobilization;<br />
2. Social Intervention;<br />
3. Provision <strong>of</strong> Opportunities;<br />
4. Organizational Change and Development;<br />
5. Suppression [<strong>of</strong> illegal activities].<br />
Moreover, it is our most fundamental belief that <strong>in</strong> order to be effective, prevention and<br />
<strong>in</strong>tervention strategies must be Community Specific, Culturally Relevant, Evidence-Based, and<br />
Collaborative. <strong>The</strong> Violence Prevention and Intervention programm<strong>in</strong>g we employ <strong>in</strong><br />
implement<strong>in</strong>g this community-enhanc<strong>in</strong>g framework <strong>in</strong>clude the programs further described<br />
throughout our publications, programs and special projects both domestically and<br />
<strong>in</strong>ternationally.<br />
www.<strong>The</strong>Advocacy.Foundation<br />
ISBN: ......... ../2017<br />
......... Pr<strong>in</strong>ted <strong>in</strong> the <strong>US</strong>A<br />
Advocacy Foundation Publishers<br />
Philadlephia, PA<br />
(878) 222-0450 | Voice | Data | SMS<br />
Page 5 <strong>of</strong> 289
Page 6 <strong>of</strong> 289
Dedication<br />
______<br />
Every publication <strong>in</strong> our many series’ is dedicated to everyone, absolutely everyone, who by<br />
virtue <strong>of</strong> their call<strong>in</strong>g and by Div<strong>in</strong>e <strong>in</strong>spiration, direction and guidance, is on the battlefield dayafter-day<br />
striv<strong>in</strong>g to follow God’s will and purpose for their lives. And this is with particular aff<strong>in</strong>ity<br />
for those Spiritual warriors who are be<strong>in</strong>g transformed <strong>in</strong>to excellence through daily academic,<br />
pr<strong>of</strong>essional, familial, and other challenges.<br />
We pray that you will bear <strong>in</strong> m<strong>in</strong>d:<br />
Matthew 19:26 (NIV)<br />
Jesus looked at them and said, "With man this is impossible,<br />
but with God all th<strong>in</strong>gs are possible." (Emphasis added)<br />
To all <strong>of</strong> us who daily look past our circumstances, and naysayers, to what the Lord says we will<br />
accomplish:<br />
Bless<strong>in</strong>gs!!<br />
- <strong>The</strong> Advocacy Foundation, Inc.<br />
Page 7 <strong>of</strong> 289
Page 8 <strong>of</strong> 289
<strong>The</strong> Transformative Justice Project<br />
Eradicat<strong>in</strong>g Juvenile Del<strong>in</strong>quency Requires a Multi-Discipl<strong>in</strong>ary Approach<br />
<strong>The</strong> way we accomplish all this is a follows:<br />
<strong>The</strong> Juvenile Justice system is <strong>in</strong>credibly overloaded, and<br />
Solutions-Based programs are woefully underfunded. Our<br />
precious children, therefore, particularly young people <strong>of</strong><br />
color, <strong>of</strong>ten get the “swift” version <strong>of</strong> justice whenever they<br />
come <strong>in</strong>to contact with the law.<br />
Decisions to build prison facilities are <strong>of</strong>ten based on<br />
elementary school test results, and our country <strong>in</strong>carcerates<br />
more <strong>of</strong> its young than any other nation on earth. So we at<br />
<strong>The</strong> Foundation labor to pull our young people out <strong>of</strong> the<br />
“school to prison” pipel<strong>in</strong>e, and we then coord<strong>in</strong>ate the efforts<br />
<strong>of</strong> the legal, psychological, governmental and educational<br />
pr<strong>of</strong>essionals needed to br<strong>in</strong>g an end to del<strong>in</strong>quency.<br />
We also educate families, police, local bus<strong>in</strong>esses, elected<br />
<strong>of</strong>ficials, clergy, and schools and other stakeholders about<br />
transform<strong>in</strong>g whole communities, and we labor to change<br />
their th<strong>in</strong>k<strong>in</strong>g about the causes <strong>of</strong> del<strong>in</strong>quency with the goal<br />
<strong>of</strong> help<strong>in</strong>g them embrace the idea <strong>of</strong> restoration for the young<br />
people <strong>in</strong> our care who demonstrate repentance for their<br />
mistakes.<br />
1. We vigorously advocate for charges reductions, wherever possible, <strong>in</strong> the adjudicatory (court)<br />
process, with the ultimate goal <strong>of</strong> expungement or pardon, <strong>in</strong> order to maximize the chances for<br />
our clients to graduate high school and progress <strong>in</strong>to college, military service or the workforce<br />
without the stigma <strong>of</strong> a crim<strong>in</strong>al record;<br />
2. We then enroll each young person <strong>in</strong>to an Evidence-Based, Data-Driven Restorative Justice<br />
program designed to facilitate their rehabilitation and subsequent re<strong>in</strong>tegration back <strong>in</strong>to the<br />
community;<br />
3. While those projects are operat<strong>in</strong>g, we conduct a wide variety <strong>of</strong> ComeUnity-ReEng<strong>in</strong>eer<strong>in</strong>g<br />
sem<strong>in</strong>ars and workshops on topics rang<strong>in</strong>g from Juvenile Justice to Parental Rights, to Domestic<br />
issues to Police friendly contacts, to CBO and FBO accountability and compliance;<br />
4. Throughout the process, we encourage and ma<strong>in</strong>ta<strong>in</strong> frequent personal contact between all<br />
parties;<br />
5 Throughout the process we conduct a cont<strong>in</strong>uum <strong>of</strong> events and fundraisers designed to facilitate<br />
collaboration among pr<strong>of</strong>essionals and community stakeholders; and f<strong>in</strong>ally<br />
Page 9 <strong>of</strong> 289
6. 4 We dissem<strong>in</strong>ate Quarterly publications, like our e-Advocate series Newsletter and our e-Advocate<br />
Quarterly electronic Magaz<strong>in</strong>e to all regular donors <strong>in</strong> order to facilitate a lifelong learn<strong>in</strong>g process<br />
on the ever-evolv<strong>in</strong>g developments <strong>in</strong> the Justice system.<br />
And <strong>in</strong> addition to the help we provide for our young clients and their families, we also facilitate<br />
Community Engagement through the Restorative Justice process, thereby balanc<strong>in</strong>g the <strong>in</strong>teresrs<br />
<strong>of</strong> local bus<strong>in</strong>esses, schools, clergy, elected <strong>of</strong>ficials, police, and all <strong>in</strong>terested stakeholders. Through<br />
these efforts, relationships are rebuilt & strengthened, local bus<strong>in</strong>esses and communities are enhanced &<br />
protected from victimization, young careers are developed, and our precious young people are kept out<br />
<strong>of</strong> the prison pipel<strong>in</strong>e.<br />
This is a massive undertak<strong>in</strong>g, and we need all the help and f<strong>in</strong>ancial support you can give! We plan to<br />
help 75 young persons per quarter-year (aggregat<strong>in</strong>g to a total <strong>of</strong> 250 per year) <strong>in</strong> each jurisdiction we<br />
serve) at an average cost <strong>of</strong> under $2,500 per client, per year.*<br />
Thank you <strong>in</strong> advance for your support!<br />
* FYI:<br />
1. <strong>The</strong> national average cost to taxpayers for m<strong>in</strong>imum-security youth <strong>in</strong>carceration, is around<br />
$43,000.00 per child, per year.<br />
2. <strong>The</strong> average annual cost to taxpayers for maximun-security youth <strong>in</strong>carceration is well over<br />
$148,000.00 per child, per year.<br />
- (<strong>US</strong> News and World Report, December 9, 2014);<br />
3. In every jurisdiction <strong>in</strong> the nation, the Plea Barga<strong>in</strong> rate is above 99%.<br />
<strong>The</strong> Judicial system engages <strong>in</strong> a tri-partite balanc<strong>in</strong>g task <strong>in</strong> every s<strong>in</strong>gle one <strong>of</strong> these matters, seek<strong>in</strong>g<br />
to balance Rehabilitative Justice with Community Protection and Judicial Economy, and, although<br />
the practitioners work very hard to achieve positive outcomes, the scales are nowhere near balanced<br />
where people <strong>of</strong> color are <strong>in</strong>volved.<br />
We must reverse this trend, which is right now work<strong>in</strong>g very much aga<strong>in</strong>st the best <strong>in</strong>terests <strong>of</strong> our young.<br />
Our young people do not belong beh<strong>in</strong>d bars.<br />
- Jack Johnson<br />
4<br />
In addition to support<strong>in</strong>g our world-class programm<strong>in</strong>g and support services, all regular donors receive our Quarterly e-Newsletter<br />
(<strong>The</strong> e-Advocate), as well as <strong>The</strong> e-Advocate Quarterly Magaz<strong>in</strong>e.<br />
Page 10 <strong>of</strong> 289
<strong>The</strong> Advocacy Foundation, Inc.<br />
Help<strong>in</strong>g Individuals, Organizations & Communities<br />
Achieve <strong>The</strong>ir Full Potential<br />
…a collection <strong>of</strong> works on<br />
<strong>The</strong> <strong>Economic</strong> <strong>Consequences</strong> <strong>of</strong><br />
<strong>Homelessness</strong> <strong>in</strong> <strong>The</strong> <strong>US</strong><br />
“Turn<strong>in</strong>g the Improbable Into the Exceptional”<br />
Atlanta<br />
Philadelphia<br />
______<br />
John C Johnson III<br />
Founder & CEO<br />
Rev. Mark L. Merrill<br />
Executive Director, Northeast<br />
(878) 222-0450<br />
Voice | Data | SMS<br />
www.<strong>The</strong>Advocacy.Foundation<br />
Page 11 <strong>of</strong> 289
Page 12 <strong>of</strong> 289
Biblical Authority<br />
______<br />
Proverbs 14:31 “Whoever oppresses a poor man <strong>in</strong>sults his Maker, but he who is<br />
generous to the needy honors him.”<br />
Deuteronomy 15:11 “For there will never cease to be poor <strong>in</strong> the land. <strong>The</strong>refore I<br />
command you, ‘You shall open wide your hand to your brother, to the needy and to the<br />
poor, <strong>in</strong> your land.’”<br />
Proverbs 10:3 “<strong>The</strong> LORD does not let the righteous go hungry, but he thwarts the<br />
crav<strong>in</strong>g <strong>of</strong> the wicked.”<br />
Psalm 34:-9-10 “Oh, fear the LORD, you his sa<strong>in</strong>ts, for those who fear him have no<br />
lack! <strong>The</strong> young lions suffer want and hunger; but those who seek the LORD lack no<br />
good th<strong>in</strong>g.”<br />
Psalm 23:1 “A Psalm <strong>of</strong> David. <strong>The</strong> LORD is my shepherd; I shall not want.”<br />
Philippians 4:19 “And my God will supply every need <strong>of</strong> yours accord<strong>in</strong>g to his riches <strong>in</strong><br />
glory <strong>in</strong> Christ Jesus.”<br />
Matthew 25:35 “For I was hungry and you gave me food, I was thirsty and you gave me<br />
dr<strong>in</strong>k, I was a stranger and you welcomed me.”<br />
Matthew 8:20 “And Jesus said to him, “Foxes have holes, and birds <strong>of</strong> the air have<br />
nests, but the Son <strong>of</strong> Man has nowhere to lay his head.”<br />
Ezekiel 16:49 “Behold, this was the guilt <strong>of</strong> your sister Sodom: she and her daughters<br />
had pride, excess <strong>of</strong> food, and prosperous ease, but did not aid the poor and needy.”<br />
Psalm 10:17 “O LORD, you hear the desire <strong>of</strong> the afflicted; you will strengthen their<br />
heart; you will <strong>in</strong>cl<strong>in</strong>e your ear.”<br />
Page 13 <strong>of</strong> 289
Page 14 <strong>of</strong> 289
Table <strong>of</strong> Contents<br />
…a compilation <strong>of</strong> works on<br />
<strong>The</strong> <strong>Economic</strong> <strong>Consequences</strong><br />
<strong>of</strong> <strong>Homelessness</strong> <strong>in</strong> <strong>The</strong> <strong>US</strong><br />
Biblical Authority<br />
I. Introduction: Facts About <strong>Homelessness</strong>……………………….. 17<br />
II. Unemployment…………………………………………………….. 29<br />
III. <strong>The</strong> Work<strong>in</strong>g Poor…………………………………………………. 49<br />
IV. Mental Health……………………………………………………… 79<br />
V. Affordable Hous<strong>in</strong>g……………………………………………….. 89<br />
VI. Public Assistance…………….………………………………….. 117<br />
VII. Homeless Shelters………………………………...................... 131<br />
VIII. <strong>The</strong> Crim<strong>in</strong>alization <strong>of</strong> <strong>Homelessness</strong>………………………… 157<br />
IX. Traditional Solutions…………………………………………….. 175<br />
X. <strong>The</strong> Advocacy Foundation Balanced<br />
Home Mortgage Initiative………………………………. 189<br />
XI. References……………………………………………………..... 255<br />
Attachments<br />
A. Homeless Assessment Report to Congress<br />
B. End<strong>in</strong>g Chronic <strong>Homelessness</strong><br />
C. State & Local Level Recommendations<br />
Copyright © 2018 <strong>The</strong> Advocacy Foundation, Inc. All Rights Reserved.<br />
Page 15 <strong>of</strong> 289
Page 16 <strong>of</strong> 289
I. Introduction<br />
10 Facts About <strong>Homelessness</strong><br />
10/13/2014 | Updated Dec 06, 2017<br />
By Bill Quigley<br />
Renee Delisle was one <strong>of</strong> over 3,500 homeless people <strong>in</strong> Santa Cruz when she found<br />
out she was pregnant. <strong>The</strong> Santa Cruz Sent<strong>in</strong>el reported she was turned away from a<br />
shelter because they did not have space for her. While other homeless people slept <strong>in</strong><br />
cars or under culverts, Renee ended up liv<strong>in</strong>g <strong>in</strong> an abandoned elevator shaft until her<br />
water broke.<br />
Jerome Murdough, 56, a homeless former Mar<strong>in</strong>e, was arrested for trespass <strong>in</strong> New<br />
York because he was found sleep<strong>in</strong>g <strong>in</strong> a public hous<strong>in</strong>g stairwell on a cold night. <strong>The</strong><br />
New York Times reported that one week later, Jerome died <strong>of</strong> hyperthermia <strong>in</strong> a jail cell<br />
heated to over 100 degrees.<br />
Paula Corb and her two daughters lost their home and have lived <strong>in</strong> their m<strong>in</strong>ivan for<br />
four years. <strong>The</strong>y did laundry <strong>in</strong> a church annex, went to the bathroom at gas stations,<br />
and did their studies under street lamps, accord<strong>in</strong>g to America Tonight.<br />
________<br />
Fact 1: Over half a million people are homeless. On any given night, there are over<br />
600,000 homeless people <strong>in</strong> the U.S., accord<strong>in</strong>g to the <strong>US</strong> Department <strong>of</strong> Hous<strong>in</strong>g and<br />
Urban Development (HUD). Most people are spend<strong>in</strong>g the night either <strong>in</strong> homeless<br />
Page 17 <strong>of</strong> 289
shelters or <strong>in</strong> some sort <strong>of</strong> short-term transitional hous<strong>in</strong>g. Slightly more than a third are<br />
liv<strong>in</strong>g <strong>in</strong> cars or under bridges or are <strong>in</strong> some other way liv<strong>in</strong>g unsheltered.<br />
Fact 2: One quarter <strong>of</strong> homeless people are children. HUD reports that on any given<br />
night, over 138,000 <strong>of</strong> the homeless <strong>in</strong> the U.S. are children under the age <strong>of</strong> 18.<br />
Thousands <strong>of</strong> these homeless children are unaccompanied, accord<strong>in</strong>g to HUD. Another<br />
federal program, No Child Left Beh<strong>in</strong>d, def<strong>in</strong>es “homeless children” more broadly and<br />
<strong>in</strong>cludes not just those liv<strong>in</strong>g <strong>in</strong> shelters or transitional hous<strong>in</strong>g but those who are<br />
shar<strong>in</strong>g the hous<strong>in</strong>g <strong>of</strong> other persons due to economic hardship; liv<strong>in</strong>g <strong>in</strong> cars, parks,<br />
bus or tra<strong>in</strong> stations; or await<strong>in</strong>g foster-care placement. Under this def<strong>in</strong>ition, the<br />
National Center for Homeless Education reported <strong>in</strong> September 2014 that local school<br />
districts reported there are over 1 million homeless children <strong>in</strong> public schools.<br />
Fact 3: Tens <strong>of</strong> thousands <strong>of</strong> veterans are homeless. Over 57,000 veterans are<br />
homeless each night, accord<strong>in</strong>g to HUD. Sixty percent <strong>of</strong> them are <strong>in</strong> shelters, the rest<br />
unsheltered. Nearly 5,000 are female.<br />
Fact 4: Domestic violence is a lead<strong>in</strong>g cause <strong>of</strong> homelessness among<br />
women.Accord<strong>in</strong>g to the National Law Center on <strong>Homelessness</strong> and Poverty (NLCHP),<br />
more than 90 percent <strong>of</strong> homeless women are victims <strong>of</strong> severe physical or sexual<br />
abuse, and escap<strong>in</strong>g that abuse is a lead<strong>in</strong>g cause <strong>of</strong> their homelessness.<br />
Fact 5: Many people are homeless because they cannot afford rent. <strong>The</strong> lack <strong>of</strong><br />
affordable hous<strong>in</strong>g is a primary cause <strong>of</strong> homelessness, accord<strong>in</strong>g to the NLCHP. HUD<br />
has seen its budget slashed by over 50 percent <strong>in</strong> recent decades, result<strong>in</strong>g <strong>in</strong> the loss<br />
<strong>of</strong> 10,000 units <strong>of</strong> subsidized low-<strong>in</strong>come hous<strong>in</strong>g each and every year.<br />
Fact 6: <strong>The</strong>re are fewer places for poor people to rent than before. Accord<strong>in</strong>g to the<br />
NLCHP, one eighth <strong>of</strong> the nation’s supply <strong>of</strong> low-<strong>in</strong>come hous<strong>in</strong>g has been permanently<br />
lost s<strong>in</strong>ce 2001. <strong>The</strong> U.S. needs at least 7 million more affordable apartments for low<strong>in</strong>come<br />
families, and as a result, millions <strong>of</strong> families spend more than half <strong>of</strong> their<br />
monthly <strong>in</strong>come on rent.<br />
Fact 7: In the last few years millions have lost their homes. Over 5 million<br />
homes have been foreclosed on s<strong>in</strong>ce 2008; that’s one out <strong>of</strong> every 10 homes with a<br />
mortgage. This has caused even more people to search for affordable rental property.<br />
Fact 8: <strong>The</strong> government does not help as much as you th<strong>in</strong>k. <strong>The</strong>re is enough<br />
public rental assistance to help about one out <strong>of</strong> every four extremely low-<strong>in</strong>come<br />
households. Those who do not receive help are on multi-year wait<strong>in</strong>g lists. For example,<br />
Charlotte just opened up their applications for public hous<strong>in</strong>g assistance for the first time<br />
<strong>in</strong> 14 years, and over 10,000 people applied.<br />
Fact 9: One <strong>in</strong> five homeless people suffers from untreated severe mental illness.<br />
While about 6 percent <strong>of</strong> the general population suffers from severe mental illness, 20 to<br />
25 percent <strong>of</strong> the homeless suffer from severe mental illness, accord<strong>in</strong>g to government<br />
Page 18 <strong>of</strong> 289
studies. Half <strong>of</strong> this population self-medicate and are at further risk for addiction and<br />
poor physical health. A University <strong>of</strong> Pennsylvania study track<strong>in</strong>g nearly 5,000 homeless<br />
people for two years discovered that <strong>in</strong>vest<strong>in</strong>g <strong>in</strong> comprehensive health support and<br />
treatment <strong>of</strong> physical and mental illnesses is less costly than <strong>in</strong>carceration, shelter and<br />
hospital services for the untreated homeless.<br />
Fact 10: Cities are <strong>in</strong>creas<strong>in</strong>gly mak<strong>in</strong>g homelessness a crime. A 2014 survey <strong>of</strong><br />
187 cities by the NLCHP found that 24 percent <strong>of</strong> cities make it a city-wide crime to beg<br />
<strong>in</strong> public, 33 percent make it illegal to stand around or loiter anyplace <strong>in</strong> the city, 18<br />
percent make it a crime to sleep anywhere <strong>in</strong> public, 43 percent make it illegal to sleep<br />
<strong>in</strong> your car, and 53 percent make it illegal to sit or lie down <strong>in</strong> particular public places.<br />
And the number <strong>of</strong> cities crim<strong>in</strong>aliz<strong>in</strong>g homelessness is steadily <strong>in</strong>creas<strong>in</strong>g.<br />
________<br />
Facts on <strong>Homelessness</strong><br />
Scope <strong>of</strong> <strong>Homelessness</strong> <strong>in</strong> the United States<br />
On a s<strong>in</strong>gle night <strong>in</strong> January 2017, there were 553,742 people experienc<strong>in</strong>g<br />
homelessness <strong>in</strong> the United States; 65% were sheltered <strong>in</strong>dividuals and 35% were<br />
unsheltered <strong>in</strong>dividuals.<br />
20% <strong>of</strong> those experienc<strong>in</strong>g<br />
homelessness (114,829<br />
<strong>in</strong>dividuals) were children under the<br />
age <strong>of</strong> 18.<br />
10% (53,438 <strong>in</strong>dividuals) were<br />
between the ages <strong>of</strong> 18 and 24.<br />
<br />
Of the 168,257 youth (people under<br />
24), 40,799 were unaccompanied.<br />
12% (4,800) <strong>of</strong> unaccompanied<br />
youth were m<strong>in</strong>ors under the age <strong>of</strong><br />
18.<br />
“Unaccompanied youth were<br />
more likely to be unsheltered<br />
(55%) than both all people<br />
experienc<strong>in</strong>g homelessness (35%) and all people experienc<strong>in</strong>g<br />
homelessness as <strong>in</strong>dividuals (48%).”<br />
<br />
70% (385,475) were 25 years old or older.<br />
Page 19 <strong>of</strong> 289
Two thirds <strong>of</strong> those experienc<strong>in</strong>g homelessness were <strong>in</strong>dividuals, while one third<br />
identified as a member <strong>of</strong> a family experienc<strong>in</strong>g homelessness.<br />
24% <strong>of</strong> <strong>in</strong>dividuals (86,962) and 5% <strong>of</strong> people <strong>in</strong> families (8,457) met the<br />
def<strong>in</strong>ition <strong>of</strong> chronically homeless.*<br />
Chronic homelessness among <strong>in</strong>dividuals <strong>in</strong>creased by 12% from 2016<br />
but has decl<strong>in</strong>ed overall by 27% (32,851) s<strong>in</strong>ce 2007.<br />
<br />
Nearly one quarter <strong>of</strong> <strong>in</strong>dividuals experienc<strong>in</strong>g homelessness had chronic<br />
patterns <strong>of</strong> homelessness (86,962).<br />
70% <strong>of</strong> chronically homeless <strong>in</strong>dividuals were unsheltered, while only 48%<br />
<strong>of</strong> all <strong>in</strong>dividuals experienc<strong>in</strong>g homelessness were unsheltered.<br />
<br />
California accounted for more than half <strong>of</strong> the nation’s unsheltered<br />
chronically homeless <strong>in</strong>dividuals (53%).<br />
<br />
40,056 veterans were experienc<strong>in</strong>g homelessness <strong>in</strong> the <strong>US</strong> (9% <strong>of</strong> all homeless<br />
adults), <strong>of</strong> which less than 10% were women.<br />
S<strong>in</strong>ce 2009, the number <strong>of</strong> homeless veterans has decreased by 45%<br />
(33,311).<br />
<br />
<br />
<strong>Homelessness</strong> nationally <strong>in</strong>creased by 0.7% between 2016 and 2017, accounted<br />
for by a 9% <strong>in</strong>crease <strong>in</strong> unsheltered homeless <strong>in</strong>dividuals and a 3% decrease <strong>in</strong><br />
sheltered homeless <strong>in</strong>dividuals. S<strong>in</strong>ce 2007, homelessness has decl<strong>in</strong>ed overall<br />
by 14%.<br />
* Chronically homeless <strong>in</strong>dividuals are <strong>in</strong>dividuals with disabilities who have either been<br />
cont<strong>in</strong>uously homeless for one year or more or who have experienced at least four<br />
episodes <strong>of</strong> homelessness <strong>in</strong> the past three years where the comb<strong>in</strong>ed length <strong>of</strong> time<br />
homeless <strong>in</strong> those occasions is at least 12 months.<br />
Scope <strong>of</strong> <strong>Homelessness</strong> <strong>in</strong> Philadelphia<br />
Each year, Philadelphia homeless outreach organizations engaged over 6,000<br />
<strong>in</strong>dividuals liv<strong>in</strong>g on the street, <strong>in</strong> cars, abandoned build<strong>in</strong>gs, tra<strong>in</strong>/bus stations,<br />
and other places not meant for human habitation.<br />
<br />
Approximately 15,000 people (<strong>in</strong>clud<strong>in</strong>g families) access shelter <strong>in</strong> Philadelphia<br />
each year. In addition, numerous <strong>in</strong>dividuals are turned away from shelter due to<br />
capacity.<br />
2015<br />
UNSHELTERED<br />
TOTAL*<br />
2015 CENTER<br />
CITY COUNT<br />
ONLY<br />
2016<br />
UNSHELTERED<br />
TOTAL*<br />
2016 CENTER<br />
CITY COUNT<br />
ONLY<br />
2017<br />
UNSHELTERED<br />
TOTAL<br />
January 510 241 525 225 799<br />
Page 20 <strong>of</strong> 289
May 620 417 712 348 903<br />
August 951 509 930 439 997<br />
November 757 445 779 458 955<br />
*Start<strong>in</strong>g <strong>in</strong> 2014, unsheltered counts <strong>in</strong>clude <strong>in</strong>creased coverage <strong>of</strong> the Kens<strong>in</strong>gton area<br />
and other communities that were not previously <strong>in</strong>cluded, caus<strong>in</strong>g street count numbers<br />
to <strong>in</strong>crease.<br />
Causes <strong>of</strong> <strong>Homelessness</strong> <strong>in</strong> Philadelphia<br />
<strong>The</strong> causes <strong>of</strong> homelessness are diverse and related to many systemic and <strong>in</strong>stitutional<br />
structures with<strong>in</strong> our country. We recognize that there are many causes <strong>of</strong><br />
homelessness and many are <strong>in</strong>terwoven. Unfortunately, there is not always good data<br />
to demonstrate the impact <strong>of</strong> these forces.<br />
For our purposes, we have chosen to highlight only a few causes <strong>of</strong> homelessness <strong>in</strong><br />
Philadelphia with support<strong>in</strong>g data<br />
1. Poverty from a lack <strong>of</strong> jobs at competitive liv<strong>in</strong>g wages.<br />
<br />
Philadelphia has a 26% poverty rate, one <strong>of</strong> the highest <strong>in</strong> the nation. Of that<br />
26%, nearly half (12.2%) are liv<strong>in</strong>g <strong>in</strong> deep poverty, with <strong>in</strong>comes below 50% <strong>of</strong><br />
the federal poverty limit.<br />
2. Disparity between hous<strong>in</strong>g costs and m<strong>in</strong>imum wage, public supports, or<br />
earned benefits.<br />
<br />
<br />
In Philadelphia, a person would have to work 106 hours per week at the<br />
m<strong>in</strong>imum hourly wage <strong>of</strong> $7.25 to afford even a modest one-bedroom apartment.<br />
Pennsylvania’s Supplemental Security Income payment is only $750 per month,<br />
while the average fair market rent for a one-bedroom apartment is $1,003 per<br />
month -- nearly double the amount <strong>of</strong> the SSI payment.<br />
Page 21 <strong>of</strong> 289
3. Lack <strong>of</strong> affordable hous<strong>in</strong>g and <strong>in</strong>adequate hous<strong>in</strong>g assistance.<br />
<br />
<br />
<br />
Over half (56%) <strong>of</strong> Philadelphians pay more than 30% <strong>of</strong> their <strong>in</strong>come on rent,<br />
which is a reflection <strong>of</strong> low <strong>in</strong>comes and unavailable hous<strong>in</strong>g, rather than simply<br />
high rent costs.<br />
<strong>The</strong>re are only 41 affordable hous<strong>in</strong>g units for every 100 extremely low <strong>in</strong>come<br />
households (those mak<strong>in</strong>g $23,850 or less per year). This means 60% <strong>of</strong><br />
extremely low <strong>in</strong>come households must ma<strong>in</strong>ta<strong>in</strong> hous<strong>in</strong>g above their means, a<br />
recipe for f<strong>in</strong>ancial <strong>in</strong>stability.<br />
Roughly 154,000 Philadelphians – more than one <strong>in</strong> four – live under 30% <strong>of</strong> the<br />
Area Median Income (AMI) <strong>of</strong> $38,253.<br />
4. Lack <strong>of</strong> affordable health care.<br />
<br />
<br />
<br />
In Philadelphia, 10% <strong>of</strong> residents are without health <strong>in</strong>surance.<br />
Of the 67 counties <strong>in</strong> Pennsylvania, Philadelphia County once aga<strong>in</strong> ranked 67th<br />
(worst) for health outcomes and 67th (worst) for health factors <strong>in</strong>clud<strong>in</strong>g health<br />
behaviors, cl<strong>in</strong>ical care, social and economic factors, and physical environment.<br />
More than 10% <strong>of</strong> people who seek substance abuse or mental health treatment<br />
<strong>in</strong> our public health system are homeless.<br />
5. Inadequate support for mental health and substance use challenges.<br />
<br />
<br />
In January 2016, one <strong>in</strong> five people experienc<strong>in</strong>g homelessness had a serious<br />
mental illness, and a similar percentage had a chronic substance use disorder.<br />
Research from the Collaborative Initiative to Help End Chronic <strong>Homelessness</strong><br />
(CICH), a jo<strong>in</strong>t effort <strong>of</strong> HUD and Veterans Affairs, found that at program entry,<br />
72% <strong>of</strong> participants had a substance use disorder and 76% had a mental illness.<br />
6. Racial <strong>in</strong>equality.<br />
<br />
<br />
Accord<strong>in</strong>g to the <strong>US</strong> Department <strong>of</strong> Hous<strong>in</strong>g and Urban Development (HUD) and<br />
the National Alliance to End <strong>Homelessness</strong>, a disproportionate number <strong>of</strong><br />
m<strong>in</strong>orities experience homelessness compared to their white counterparts.<br />
M<strong>in</strong>orities are about 1.5 times – and Black Americans 3 times – more likely to be<br />
homeless than White Americans.<br />
<strong>The</strong> rate <strong>of</strong> unsheltered homelessness among Lat<strong>in</strong>x/Hispanic <strong>in</strong>dividuals<br />
<strong>in</strong>creased by 35% <strong>in</strong> 2017, compared to a 6% <strong>in</strong>crease among the non-<br />
Lat<strong>in</strong>x/Hispanic community.<br />
Page 22 <strong>of</strong> 289
7. National opioid crisis.<br />
<br />
<br />
<br />
<br />
Follow<strong>in</strong>g national trends due to the opioid epidemic, Philadelphia experienced a<br />
drastic (78%) <strong>in</strong>crease <strong>in</strong> un<strong>in</strong>tentional drug overdose deaths. Individuals<br />
experienc<strong>in</strong>g homelessness are at an <strong>in</strong>creased risk for substance use disorders<br />
and drug overdose, a risk amplified <strong>in</strong> Philadelphia given the low cost and high<br />
potency <strong>of</strong> hero<strong>in</strong> sold on our streets.<br />
In Philadelphia, the number <strong>of</strong> deaths related to un<strong>in</strong>tentional drug overdose is<br />
2.5 times greater than the number <strong>of</strong> homicides.<br />
Accord<strong>in</strong>g to the City-sponsored Homeless Death Review Team, 87% <strong>of</strong><br />
homeless decedents from 2011-2015 had a known history <strong>of</strong> substance use or<br />
abuse. For 51% <strong>of</strong> the decedents <strong>in</strong> the same time frame, drug or alcohol<br />
<strong>in</strong>toxication was a primary or contribut<strong>in</strong>g cause <strong>of</strong> death and 50% <strong>of</strong> the<br />
decedents were known to use opioids.<br />
<strong>The</strong> rate <strong>of</strong> deaths due to un<strong>in</strong>tentional drug overdose among homeless persons<br />
doubled between 2011 and<br />
2015.<br />
8. Domestic Violence<br />
On an average night, 250<br />
<strong>in</strong>dividuals who are<br />
homeless <strong>in</strong> Philadelphia<br />
self-report as victims <strong>of</strong><br />
domestic violence.<br />
<br />
In FY15, the Philadelphia<br />
Domestic Violence Hotl<strong>in</strong>e<br />
received 14,661 calls for<br />
assistance with domestic<br />
violence issues.<br />
Solutions to <strong>Homelessness</strong><br />
At Project HOME, we believe <strong>in</strong> a<br />
holistic approach to end<strong>in</strong>g and<br />
prevent<strong>in</strong>g homelessness and<br />
poverty, <strong>in</strong>clud<strong>in</strong>g:<br />
1. Permanent Supportive Hous<strong>in</strong>g (PSH)<br />
<br />
Permanent supportive hous<strong>in</strong>g has been shown by multiple national studies to be<br />
a cost-effective solution to end<strong>in</strong>g homelessness. Sav<strong>in</strong>g Lives, Sav<strong>in</strong>g Money,<br />
Page 23 <strong>of</strong> 289
a study conducted by Project HOME <strong>in</strong> 2010, concluded that PSH saves $7,700<br />
per person per year (over the cost <strong>of</strong> serv<strong>in</strong>g an unsheltered person).<br />
<br />
Affordable hous<strong>in</strong>g is a critical component <strong>of</strong> address<strong>in</strong>g homelessness, but is<br />
<strong>in</strong>sufficient on its own. Integrat<strong>in</strong>g hous<strong>in</strong>g with case management allows<br />
residents to receive services <strong>in</strong> a timely and convenient manner. Studies have<br />
found that <strong>in</strong>dividuals and families receiv<strong>in</strong>g case management are more likely to<br />
have ma<strong>in</strong>ta<strong>in</strong>ed stable hous<strong>in</strong>g a year later.<br />
Investments <strong>in</strong> PSH have decreased chronic homelessness by 27% s<strong>in</strong>ce 2007.<br />
Project HOME <strong>of</strong>fers a range <strong>of</strong> subsidized hous<strong>in</strong>g for <strong>in</strong>dividuals and families<br />
who have experienced homelessness, <strong>in</strong>clud<strong>in</strong>g 802 units <strong>of</strong> affordable<br />
supportive hous<strong>in</strong>g, with 72 units <strong>in</strong> predevelopment and 170 units <strong>in</strong> the<br />
pipel<strong>in</strong>e.<br />
2. Opportunities for employment, <strong>in</strong>creased <strong>in</strong>come, and education.<br />
<br />
<br />
Break<strong>in</strong>g the cycle <strong>of</strong> homelessness and poverty requires not only hous<strong>in</strong>g, but<br />
susta<strong>in</strong>able, competitive employment at liv<strong>in</strong>g wages.<br />
Connection to ma<strong>in</strong>stream benefit and entitlement <strong>in</strong>come through Benephilly,<br />
Homeless Advocacy Project, and other resources is a key component <strong>of</strong><br />
prevent<strong>in</strong>g and end<strong>in</strong>g homelessness.<br />
Project HOME’s Adult Learn<strong>in</strong>g and Workforce Development Programs provide<br />
computer classes, career tra<strong>in</strong><strong>in</strong>g, job read<strong>in</strong>ess workshops, life skills<br />
workshops, GED classes, adult basic literacy classes, and access to other<br />
resources to help local residents improve their lives, ga<strong>in</strong> employment and<br />
pursue higher education.<br />
3. Affordable and accessible healthcare<br />
<br />
<br />
Health and homelessness are <strong>in</strong>extricably l<strong>in</strong>ked. Accord<strong>in</strong>g to the National<br />
Alliance to end <strong>Homelessness</strong>, an acute physical or behavioral health crisis or<br />
any long-term disabl<strong>in</strong>g condition may lead to homelessness. <strong>Homelessness</strong> also<br />
exacerbates chronic medical conditions.<br />
Often, physical healthcare or dental care can be gateways for people to accept<br />
behavioral health services, and holistic healthcare services which address the<br />
whole person are the most successful.<br />
Through Project HOME Healthcare Services, we <strong>of</strong>fer <strong>in</strong>tegrated physical and<br />
behavioral healthcare and recovery services and wellness programs for people<br />
who are currently experienc<strong>in</strong>g homelessness or those who are formerly<br />
homeless, as well as for people liv<strong>in</strong>g <strong>in</strong> the North Philadelphia community.<br />
Page 24 <strong>of</strong> 289
4. A coord<strong>in</strong>ated approach to crisis response<br />
<br />
<br />
<strong>Homelessness</strong> prevention programs can help ensure that no one ends up <strong>in</strong><br />
shelters or on the streets. This <strong>in</strong>cludes re<strong>in</strong>vest<strong>in</strong>g <strong>in</strong> economically vulnerable<br />
neighborhoods, improv<strong>in</strong>g the school system, mak<strong>in</strong>g sure people have access<br />
to health care, and provid<strong>in</strong>g jobs at a liv<strong>in</strong>g wage, as well as shelter diversion<br />
programs.<br />
A coord<strong>in</strong>ated entry system allows <strong>in</strong>dividuals to receive hous<strong>in</strong>g and services<br />
more quickly, and allows organizations to pool data <strong>in</strong> order to more accurately<br />
understand our population’s needs. Project HOME is transition<strong>in</strong>g to a Central<br />
Intake model <strong>in</strong> 2018, <strong>in</strong> tandem with the City <strong>of</strong> Philadelphia’s new Coord<strong>in</strong>ated<br />
Entry system. <strong>The</strong>se structures will allow Project HOME to place vulnerable<br />
<strong>in</strong>dividuals <strong>in</strong> appropriate hous<strong>in</strong>g a more efficient and timely manner.<br />
Project HOME works with Philadelphia’s Office <strong>of</strong> Homeless Services and<br />
Department <strong>of</strong> Behavioral Health and Intellectual disAbilities as a part <strong>of</strong> the local<br />
Cont<strong>in</strong>uum <strong>of</strong> Care - a network <strong>of</strong> government agencies, provider organizations,<br />
local stakeholders, and <strong>in</strong>dividuals currently or formerly experienc<strong>in</strong>g<br />
homelessness – to implement a strategic, city-wide response to homelessness.<br />
Current number <strong>of</strong> beds available to homeless people <strong>in</strong> Philadelphia, accord<strong>in</strong>g<br />
to the 2017 Hous<strong>in</strong>g Inventory<br />
Emergency: 3,652<br />
Transitional: 1,587<br />
Page 25 <strong>of</strong> 289
Safe Haven: 85<br />
Permanent: 6,179<br />
TOTAL: 11,503<br />
Notes<br />
It is difficult to calculate the exact number <strong>of</strong> people liv<strong>in</strong>g on the street, because many live <strong>in</strong><br />
hidden park areas, vehicles, or abandoned houses, and because numbers fluctuate based on<br />
weather.<br />
Estimated from 2016 Hous<strong>in</strong>g Inventory Chart (roughly 3,800 year-round/non-seasonal beds)<br />
times average 4 turnovers per year. City-funded shelter received approximately 10,000<br />
unduplicated <strong>in</strong>dividuals <strong>in</strong> 2015 <strong>in</strong> 2,700 beds, per James Moore.<br />
________<br />
25 Hard To Swallow Facts About <strong>Homelessness</strong><br />
Posted by Sameen, Updated on March 2, 2016<br />
<strong>Homelessness</strong> is one <strong>of</strong> those sad th<strong>in</strong>gs that every culture has had to deal with to<br />
some extent s<strong>in</strong>ce the beg<strong>in</strong>n<strong>in</strong>g <strong>of</strong> civilization. However, different cultures have<br />
addressed the issue <strong>in</strong> different ways. For example, under more socialistic<br />
governmental systems, homeless people are typically handled by the government. This<br />
<strong>in</strong>volves provid<strong>in</strong>g shelter, food, and cloth<strong>in</strong>g. Under more capitalist systems, they are<br />
typically handled by <strong>in</strong>dividuals and organizations. While neither one <strong>of</strong> these systems is<br />
better or worse, there is no system that has managed to fully get to the roots <strong>of</strong> the<br />
problem. This is just one <strong>of</strong> many sad facts about homelessness.<br />
Oftentimes homelessness starts with mental issues, post traumatic stress disorder, drug<br />
use, and disability. One possible reaction is to assume the Darw<strong>in</strong>ist position. This<br />
would say that those who cannot provide for themselves will either go hungry or not<br />
have a place to live. While most people don’t outright adhere to this position, it is <strong>of</strong>ten<br />
the underly<strong>in</strong>g assumption that many <strong>of</strong> us have, especially when we simplify the<br />
position <strong>in</strong>to lazy people and non-lazy people. Another possible position is to assume<br />
the altruist position. This would say that we should do everyth<strong>in</strong>g we can to help those<br />
who have little. It too, <strong>of</strong>ten over simplifies the problem. Not all homeless people are the<br />
same and many require different types <strong>of</strong> assistance. <strong>The</strong>se are 25 hard to swallow<br />
facts about homelessness.<br />
25 California accounts for 20% <strong>of</strong> the homeless population <strong>in</strong> the United States<br />
24 California, New York, Florida, Texas, and Massachusetts account for half <strong>of</strong> the<br />
homeless population <strong>in</strong> the <strong>US</strong><br />
23 1 out <strong>of</strong> every 50 American children will be homeless at some po<strong>in</strong>t <strong>in</strong> their lives<br />
Page 26 <strong>of</strong> 289
22 <strong>The</strong> 3 most commonly cited causes <strong>of</strong> homelessness are poverty, lack <strong>of</strong> affordable<br />
hous<strong>in</strong>g, and unemployment<br />
21 In any given year about 1 out <strong>of</strong> every 200 American adults will be homeless<br />
20 A grow<strong>in</strong>g number <strong>of</strong> anti-homelessness laws around the country has caused the<br />
United States to receive criticism from the United Nations Human Rights Committee<br />
19 At least 30 cities have crim<strong>in</strong>alized giv<strong>in</strong>g food to the homeless<br />
18 In some areas, like Hawaii, <strong>of</strong>ficials have attempted to solve homelessness by<br />
provid<strong>in</strong>g one way plane tickets elsewhere<br />
17 A study at Pr<strong>in</strong>ceton found that our bra<strong>in</strong>s tend to process images <strong>of</strong> homeless<br />
people more like they process objects than actual human be<strong>in</strong>gs<br />
16 <strong>The</strong>re is actually an entire generation <strong>of</strong> homeless Japanese youths who live and<br />
sleep <strong>in</strong> <strong>in</strong>ternet cafes<br />
15 A 59 year old homeless man <strong>in</strong> North Carol<strong>in</strong>a held up a bank for $1 <strong>in</strong> order to be<br />
sent to jail and receive healthcare<br />
14 Fatherless homes produce 70% <strong>of</strong> high school dropouts, 85% <strong>of</strong> kids <strong>in</strong> detention<br />
facilities, and 90% <strong>of</strong> homeless children<br />
13 Nearly one quarter <strong>of</strong> homeless people <strong>in</strong> the United States are veterans<br />
12 Nearly half <strong>of</strong> those veterans have a diagnosable mental illness<br />
11 <strong>The</strong>re has been a National Hobo Convention <strong>in</strong> Britt, Iowa every year for the past<br />
century. <strong>The</strong>y even crown a K<strong>in</strong>g and Queen.<br />
10 <strong>The</strong> country <strong>of</strong> Albania built hundreds <strong>of</strong> thousands <strong>of</strong> bunkers under communism.<br />
Today some <strong>of</strong> them are used to house homeless people<br />
9 Nearly 1/3 <strong>of</strong> homeless people <strong>in</strong> the United States are younger than 24<br />
8 About half <strong>of</strong> the youth on the street report that their parents knew they were leav<strong>in</strong>g<br />
but didn't care<br />
7 Sylvester Stallone was homeless and even sold his dog for $50. Not long after,<br />
however, he sold the script for Rocky and bought back his dog for $3,000<br />
6 Nearly 20% <strong>of</strong> youths will run away at least once<br />
5 HIV rates are up to 9 times higher among the homeless than <strong>in</strong> comparative samples<br />
<strong>of</strong> the population<br />
Page 27 <strong>of</strong> 289
4 While veterans, people with disabilities, and s<strong>in</strong>gle parent families have always been<br />
at risk <strong>of</strong> homelessness, these days more <strong>of</strong> the work<strong>in</strong>g class is at risk <strong>of</strong><br />
homelessness than ever before<br />
3 In some regions like Central Texas, the fastest grow<strong>in</strong>g population <strong>of</strong> homeless<br />
people is women and children<br />
2 In 2012 a homeless woman <strong>in</strong> Canada returned a purse she found that conta<strong>in</strong>ed<br />
$10,400<br />
1 <strong>The</strong>re are 5 times more vacant houses <strong>in</strong> the United States than the number <strong>of</strong><br />
homeless people<br />
Page 28 <strong>of</strong> 289
II. Unemployment<br />
Employment and <strong>Homelessness</strong><br />
Published by the National Coalition for the Homeless, July 2009<br />
This fact sheet exam<strong>in</strong>es the relationship between work and homelessness, <strong>in</strong>clud<strong>in</strong>g<br />
the contribution <strong>of</strong> unemployment, underemployment, and low wages to homelessness.<br />
It also assesses the employment barriers faced by homeless people, and strategies for<br />
overcom<strong>in</strong>g those barriers. A list <strong>of</strong> resources for further study is also provided.<br />
IMPACT OF UNEMPLOYMENT AND LOW WAGES ON HOMELESSNESS<br />
In recent years, media reports <strong>of</strong> a grow<strong>in</strong>g economy and low unemployment mask a<br />
number <strong>of</strong> important reasons why homelessness persists, and, <strong>in</strong> some areas <strong>of</strong> the<br />
country, is worsen<strong>in</strong>g. <strong>The</strong>se <strong>in</strong>clude stagnant or fall<strong>in</strong>g <strong>in</strong>comes, and less secure jobs<br />
that <strong>of</strong>fer fewer benefits.<br />
Now, as the United States experiences the worst f<strong>in</strong>ancial crisis s<strong>in</strong>ce the Great<br />
Depression, the homeless population has <strong>in</strong>creased significantly. <strong>The</strong> worsen<strong>in</strong>g<br />
Page 29 <strong>of</strong> 289
economy and ris<strong>in</strong>g unemployment numbers emphasize a number <strong>of</strong> reasons why<br />
homelessness cont<strong>in</strong>ues to exist and grow <strong>in</strong> exponential numbers <strong>in</strong> the United States.<br />
Wages and Income<br />
While past years have seen growth <strong>in</strong> real wages at all levels, wage growth has<br />
collapsed over the past six months. Nom<strong>in</strong>al hourly wages <strong>of</strong> production workers grew<br />
at only one-sixth the rate from December 2007. Also workers also face a cut <strong>in</strong> hours<br />
and nom<strong>in</strong>al weekly earn<strong>in</strong>gs have decl<strong>in</strong>ed. As the recent growth <strong>in</strong> wages has<br />
decl<strong>in</strong>ed, it illustrates that the recession affects everyone <strong>in</strong>clud<strong>in</strong>g those able to keep<br />
their jobs while add<strong>in</strong>g pressure to the consumption growth which experts estimate will<br />
further delay economic recovery (<strong>Economic</strong> Policy Institute, 2009).<br />
Low-wage workers have been particularly hard hit by wage trends. More than four<br />
decades ago <strong>in</strong> 1967, a year-round worker earn<strong>in</strong>g the m<strong>in</strong>imum wage was paid enough<br />
to raise a family <strong>of</strong> three above the poverty l<strong>in</strong>e (Solar, 1995). From 1981-1990,<br />
however, the m<strong>in</strong>imum wage was frozen at $3.35 an hour, while the cost <strong>of</strong> liv<strong>in</strong>g<br />
<strong>in</strong>creased 48% over the same period. Congress raised the m<strong>in</strong>imum wage to $5.15 per<br />
hour <strong>in</strong> 1996, and it has not been raised until 2007. In 2007, President Bush signed <strong>in</strong>to<br />
law a plan that would <strong>in</strong>crease the m<strong>in</strong>imum wage to $7.25 an hour, over two years.<br />
This <strong>in</strong>crease has not kept up with the ground lost to <strong>in</strong>flation <strong>in</strong> the last 20 years; thus,<br />
the real value <strong>of</strong> the m<strong>in</strong>imum wage today is 26% less than <strong>in</strong> 1979 (<strong>The</strong> <strong>Economic</strong><br />
Policy Institute, 2005), worth only $4.42 <strong>in</strong> real dollars (AFL-CIO, 2005). In today’s<br />
current market, a full-time m<strong>in</strong>imum wage worker work<strong>in</strong>g 40 hours a week and 52<br />
weeks per year would earn $13,624. This puts him nearly 25% below the $18,310 (<strong>US</strong><br />
Department <strong>of</strong> Health and Human Services, 2009) poverty level for a family <strong>of</strong> three.<br />
This worker falls below the poverty l<strong>in</strong>e even after factor<strong>in</strong>g <strong>in</strong> the earned <strong>in</strong>come tax<br />
credit, which was created to br<strong>in</strong>g low-wage workers up to the poverty l<strong>in</strong>e (<strong>The</strong><br />
<strong>Economic</strong> Policy Institute, 2007). <strong>The</strong> <strong>Economic</strong> Policy Institute estimates that by 2009,<br />
the m<strong>in</strong>imum wage <strong>in</strong>crease will raise full-time m<strong>in</strong>imum wage workers above the<br />
poverty l<strong>in</strong>e for a family <strong>of</strong> two for the first time <strong>in</strong> more than ten years (<strong>The</strong> <strong>Economic</strong><br />
Policy Institute, 2007). Even after the next wage <strong>in</strong>crease to $7.25, a family <strong>of</strong> three will<br />
rema<strong>in</strong> about $3,000 below the poverty l<strong>in</strong>e, and a family <strong>of</strong> four will be more than<br />
$6,000 below it [U.S. Health and Human Services]. Contrary to popular belief, the<br />
majority <strong>of</strong> m<strong>in</strong>imum-wage workers are not teenagers: approximately 79% <strong>of</strong> m<strong>in</strong>imum<br />
age workers are 20 or older (<strong>The</strong> <strong>Economic</strong> Policy Institute, 2008).<br />
In addition to the erosion <strong>in</strong> the value <strong>of</strong> the m<strong>in</strong>imum wage, there are other factors that<br />
contribute to the decl<strong>in</strong>e <strong>in</strong> wage decl<strong>in</strong>e. As more countries compete aga<strong>in</strong>st each<br />
other, the result may be add<strong>in</strong>g a downward pressure on wages. Also, the weaken<strong>in</strong>g <strong>in</strong><br />
union power and labor policies may have some affect on the wage decl<strong>in</strong>e (International<br />
Labor Organization, 2008).<br />
Decl<strong>in</strong><strong>in</strong>g wages, <strong>in</strong> turn, have put hous<strong>in</strong>g out <strong>of</strong> reach for many workers: a household<br />
would need more than one full time m<strong>in</strong>imum wage worker to afford a two-bedroom<br />
rental apartment at fair market rent (National Low Income Hous<strong>in</strong>g Coalition, 2009). In<br />
Page 30 <strong>of</strong> 289
fact, <strong>in</strong> the median state a m<strong>in</strong>imum-wage worker would have to work 87 hours each<br />
week to afford a two-bedroom apartment at 30% <strong>of</strong> his or her <strong>in</strong>come, which is the<br />
federal def<strong>in</strong>ition <strong>of</strong> affordable hous<strong>in</strong>g. In addition, 40% <strong>of</strong> households with "worst case<br />
hous<strong>in</strong>g needs" -- households pay<strong>in</strong>g over half their <strong>in</strong>comes for rent, liv<strong>in</strong>g <strong>in</strong> severely<br />
substandard hous<strong>in</strong>g, or both -- have at least one work<strong>in</strong>g person. <strong>The</strong> most recent<br />
HUD report (2005) shows that there were nearly six million households with “worst-case<br />
hous<strong>in</strong>g needs” <strong>in</strong> America.<br />
<strong>The</strong> connection between impoverished workers and homelessness can be seen <strong>in</strong><br />
homeless shelters, many <strong>of</strong> which house significant numbers <strong>of</strong> full-time wage earners.<br />
A survey <strong>of</strong> 23 U.S. cities found that eleven <strong>of</strong> the cities reported an <strong>in</strong>crease <strong>in</strong> the<br />
number <strong>of</strong> employed homeless people, one city reported a decrease and seven other<br />
cities reported no change from the previous year (U.S. Conference <strong>of</strong> Mayors, 2008).<br />
In today’s economy, one <strong>of</strong> the hardest burdens for workers is the cont<strong>in</strong>ued dramatic<br />
decl<strong>in</strong>e <strong>in</strong> wage growth. For the first year <strong>of</strong> the recession, wage growth rema<strong>in</strong>ed<br />
relatively strong; nom<strong>in</strong>al (non-<strong>in</strong>flation adjusted) hourly wages for<br />
production/nonsupervisory workers (who comprise over 80% <strong>of</strong> payroll employment)<br />
grew 3.9% from December 2007 to December 2008. S<strong>in</strong>ce that time, however, wage<br />
growth has slowed abruptly; <strong>in</strong> May 2009, wages grew at a 1.3% annualized rate, onethird<br />
the earlier pace (<strong>Economic</strong> Policy Institute, 2009). If this percentage cont<strong>in</strong>ues to<br />
drop, it will become harder for a blue-collar worker to support his or her family.<br />
Page 31 <strong>of</strong> 289
Additionally, ris<strong>in</strong>g costs <strong>of</strong> gasol<strong>in</strong>e and food are tak<strong>in</strong>g large portions <strong>of</strong> these workers’<br />
pay checks (<strong>Economic</strong> Policy Institute, 2008).<br />
Job Security and Underemployment<br />
Not only have wages stagnated or decl<strong>in</strong>ed over the last two decades, but also job<br />
stability and job security have deteriorated. One measure <strong>of</strong> job stability, <strong>in</strong>voluntary job<br />
loss, has <strong>in</strong>creased <strong>in</strong> recent years. <strong>The</strong> economy has lost nearly six million jobs s<strong>in</strong>ce<br />
the recession began <strong>in</strong> December 2007. Household Survey reports that the<br />
unemployment rate <strong>in</strong>creased from 8.9% to 9.5% <strong>in</strong> June 2009, which accord<strong>in</strong>g to the<br />
Bureau <strong>of</strong> Labor Statistics added over three-quarters <strong>of</strong> a million workers to the<br />
unemployed list (<strong>Economic</strong> Policy Institute, 2009). Additionally, people are fall<strong>in</strong>g victims<br />
to long term unemployment at greater rates. <strong>The</strong> number <strong>of</strong> people out <strong>of</strong> work for 27<br />
weeks or more is approximately 4.4 million (3 <strong>in</strong> 10 unemployed workers). <strong>The</strong><br />
workforce dropped from 155.1 million <strong>in</strong> May to 154.9 million <strong>in</strong> June (U.S. News &<br />
World Report).<br />
Displaced workers face difficulty f<strong>in</strong>d<strong>in</strong>g new employment; when they do f<strong>in</strong>d work, their<br />
new jobs pay, on average, about 13% less than the jobs they lost. And more than onefourth<br />
<strong>of</strong> those who had health <strong>in</strong>surance on their old jobs don't have it at their new ones<br />
(Mishel, Bernste<strong>in</strong>, and Schmitt, 1999). Additionally, reports <strong>in</strong>dicate that from 2001-<br />
2003, about 30% <strong>of</strong> people who had <strong>in</strong>voluntarily lost jobs were not employed when<br />
they were surveyed aga<strong>in</strong> (Farber, 2005). As pr<strong>of</strong>essional and managerial jobs have<br />
become <strong>in</strong>creas<strong>in</strong>gly vulnerable to downsiz<strong>in</strong>g, higher socioeconomic groups are<br />
experienc<strong>in</strong>g <strong>in</strong>creased job <strong>in</strong>stability, and the risk <strong>of</strong> job loss is becom<strong>in</strong>g more equally<br />
distributed by socioeconomic status (Farber 2005).<br />
Another trend impact<strong>in</strong>g job security is non-standard work... In 1997, almost 30% <strong>of</strong><br />
workers were employed <strong>in</strong> non-standard work arrangements (i.e. <strong>in</strong>dependent<br />
contract<strong>in</strong>g, work<strong>in</strong>g for a temporary help agency, day labor, or regular part-time<br />
employment) (Mishel, Bernste<strong>in</strong>, and Schmitt, 1999). Temporary employment has<br />
<strong>in</strong>creased by 11% s<strong>in</strong>ce 1972 (Kalleberg, Resk<strong>in</strong>, & Hudson, 2000). <strong>The</strong>se nonstandard<br />
work arrangements typically <strong>of</strong>fer lower wages, fewer benefits, and less job<br />
security. Even temporary jobs are be<strong>in</strong>g affected by the worsen<strong>in</strong>g economy, with<br />
monthly losses that averaged 73,000 dur<strong>in</strong>g the previous six months (Bureau <strong>of</strong> Labor<br />
Statistics, 2009).<br />
A useful measure <strong>of</strong> the decl<strong>in</strong>e <strong>in</strong> job security is underemployment. Unlike the<br />
unemployment rate, measures <strong>of</strong> underemployment reflect not only <strong>in</strong>dividuals who are<br />
unemployed, but also <strong>in</strong>voluntary part-timers and those who want to work but have been<br />
discouraged by their lack <strong>of</strong> success. As <strong>of</strong> March 2009, the underemployment rate is<br />
15.8%, substantially higher than the 9.4% unemployment rate which translates <strong>in</strong>to 24.4<br />
million people who are underemployed or one out <strong>of</strong> every six American workers is<br />
either unemployed or underemployed. (<strong>Economic</strong> Policy Institute, 2009). <strong>The</strong> number <strong>of</strong><br />
<strong>in</strong>voluntarily part-time workers has nearly doubled s<strong>in</strong>ce the start <strong>of</strong> the recession, from<br />
4.6 million to 9.0 million. One reason for the higher level <strong>of</strong> underemployment is the<br />
Page 32 <strong>of</strong> 289
<strong>in</strong>creas<strong>in</strong>g number <strong>of</strong> <strong>in</strong>voluntary part-time workers -- workers who want to work full time<br />
but have only been able to obta<strong>in</strong> part time work.<br />
Thus, for many Americans, work provides no escape from poverty. <strong>The</strong> benefits <strong>of</strong><br />
economic growth have not been equally distributed; <strong>in</strong>stead, they have been<br />
concentrated at the top <strong>of</strong> <strong>in</strong>come and wealth distributions. A ris<strong>in</strong>g tide does not lift all<br />
boats, and <strong>in</strong> the United States today, many boats are struggl<strong>in</strong>g to stay afloat.<br />
BARRIERS TO EMPLOYMENT FACED BY HOMELESS PEOPLE<br />
As bad as it is for the 44% <strong>of</strong> homeless people who have jobs and can't escape<br />
homelessness, climb<strong>in</strong>g out <strong>of</strong> homelessness is virtually impossible for those without a<br />
job. For those with limited skills or experience, opportunities for jobs that pay a liv<strong>in</strong>g<br />
wage are very limited. Additionally, many members <strong>of</strong> the homeless population have to<br />
combat barriers such as limited transportation and reduced access to educational and<br />
tra<strong>in</strong><strong>in</strong>g programs (Long, Rio, & Rosen, 2007). In such a competitive environment, the<br />
difficulties <strong>of</strong> job seek<strong>in</strong>g as a homeless person can be almost <strong>in</strong>surmountable barriers<br />
to employment.<br />
Mental or physical illnesses also play vital roles <strong>in</strong> the employment participation <strong>of</strong><br />
homeless <strong>in</strong>dividuals or those at risk for becom<strong>in</strong>g homeless. Research statistics<br />
illustrate that a disability, mental or physical, can result <strong>in</strong> difficulty acquir<strong>in</strong>g work. In<br />
Page 33 <strong>of</strong> 289
addition to mental illness and substance abuse, <strong>in</strong>carceration also serves as a barrier<br />
for employment. Incarceration can decrease the types <strong>of</strong> employment available to an<br />
<strong>in</strong>dividual after release from jail or prison. Along with the previously mentioned barriers,<br />
the lack <strong>of</strong> access to technology serves as a handicap for the homeless search<strong>in</strong>g for<br />
work. In this job market, some knowledge <strong>of</strong> computers and technology is essential for<br />
every field. Although there are computers available through public access, some<br />
homeless <strong>in</strong>dividuals lack computer knowledge and fear failure.<br />
Much has been learned from programs designed to help homeless people obta<strong>in</strong> and<br />
ma<strong>in</strong>ta<strong>in</strong> employment <strong>in</strong> recent years. Studies <strong>in</strong>dicate that ma<strong>in</strong>stream programs,<br />
where the homeless are a m<strong>in</strong>ority population, may meet some <strong>of</strong> the basic needs <strong>of</strong><br />
some homeless <strong>in</strong>dividuals but struggle to encourage employment by these <strong>in</strong>dividuals<br />
and provide <strong>in</strong>come and support. This shortcom<strong>in</strong>g also highlights that other groups <strong>of</strong><br />
the homeless receive little <strong>in</strong>come or employment support, i.e. s<strong>in</strong>gle adults. Programs<br />
directly targeted to homeless populations such as the programs funded by the U.S.<br />
Department <strong>of</strong> Hous<strong>in</strong>g and Urban Development, <strong>The</strong> Department <strong>of</strong> Health and Human<br />
Services (Transitional Liv<strong>in</strong>g Program for homeless youth), or <strong>The</strong> Department <strong>of</strong> Labor<br />
which funds Homeless Veterans’ Re<strong>in</strong>tegration Program (focus<strong>in</strong>g on employment) are<br />
from descriptive accounts fairly more successful <strong>in</strong> the homeless population than<br />
ma<strong>in</strong>stream <strong>in</strong>itiatives. In addition to these programs, ma<strong>in</strong>stream federal employment<br />
programs and demonstrations have particular local grantees that target homeless<br />
people.<br />
Because <strong>of</strong> past legislation, a variety <strong>of</strong> government funded programs exist to assist the<br />
homeless. Studies show that programs designed to assist the homeless should be<br />
implemented to cover a variety <strong>of</strong> concerns. An evaluation <strong>of</strong> the Job Tra<strong>in</strong><strong>in</strong>g for the<br />
Homeless Demonstration Program (JTHDP), authorized by the Stewart B. McK<strong>in</strong>ney<br />
Act <strong>in</strong> 1988, found that successful employment programs provide access to a wide<br />
variety <strong>of</strong> services <strong>in</strong>clud<strong>in</strong>g hous<strong>in</strong>g to help the homeless overcome employment<br />
barriers. In addition, the evaluation concluded that <strong>in</strong> order for employment programs to<br />
be most successful, they must directly target the homeless or those at risk <strong>of</strong> becom<strong>in</strong>g<br />
homeless.<br />
In 2003, <strong>in</strong> support <strong>of</strong> the goal <strong>of</strong> end<strong>in</strong>g chronic homelessness, and build<strong>in</strong>g upon<br />
previous efforts <strong>of</strong> the 1988 – 1995 Job Tra<strong>in</strong><strong>in</strong>g for the Homeless Demonstration<br />
Program, the U.S. Department <strong>of</strong> Labor (DOL) and U.S. Department <strong>of</strong> Hous<strong>in</strong>g and<br />
Urban Development, partnered together to launch the End<strong>in</strong>g Chronic <strong>Homelessness</strong><br />
through Employment and Hous<strong>in</strong>g (ECHEH) <strong>in</strong>itiative. <strong>The</strong> <strong>in</strong>itiative was funded by three<br />
branches with<strong>in</strong> DOL - the Office <strong>of</strong> Disability Employment Policy (ODEP), the<br />
Employment and Tra<strong>in</strong><strong>in</strong>g Adm<strong>in</strong>istration (ETA), and the Veterans Employment and<br />
Tra<strong>in</strong><strong>in</strong>g Service (VETS) - and by HUD’s Office <strong>of</strong> Special Populations. In this five year<br />
<strong>in</strong>itiative, DOL and HUD awarded a comb<strong>in</strong>ed total <strong>of</strong> $23,615,367 to five local<br />
workforce <strong>in</strong>vestment boards and their respective hous<strong>in</strong>g partners. A major goal <strong>of</strong> this<br />
<strong>in</strong>itiative was to develop susta<strong>in</strong>able and effective direct service partnerships between<br />
hous<strong>in</strong>g providers, homeless assistance agencies, and the ma<strong>in</strong>stream workforce<br />
system.<br />
Page 34 <strong>of</strong> 289
POLICY ISSUES<br />
Although fund<strong>in</strong>g for the JTHDP program was term<strong>in</strong>ated <strong>in</strong> FY1995, Congress<br />
mandated that the U.S. Department <strong>of</strong> Labor use the expertise ga<strong>in</strong>ed from the JTHDP<br />
program to enhance the capacity <strong>of</strong> national employment programs such as the Job<br />
Tra<strong>in</strong><strong>in</strong>g Partnership Act (JTPA) to serve homeless <strong>in</strong>dividuals (Foscar<strong>in</strong>as, 1996). In<br />
1998, the Work Investment Act (WIA) passed and required governments to establish<br />
employment and tra<strong>in</strong><strong>in</strong>g systems and adequately disperse <strong>in</strong>formation with<strong>in</strong> their<br />
community. Congress appropriated $5.37 billion for WIA to be implemented by 2000<br />
(CRS Report for Congress).<br />
Accord<strong>in</strong>g to the Center for Law and Social Policy, under the American Recovery and<br />
Re<strong>in</strong>vestment<br />
Act, the WIA<br />
should be able<br />
to implement<br />
work-force<br />
education and<br />
tra<strong>in</strong><strong>in</strong>g<br />
strategies that<br />
can assist lowskilled<br />
adults<br />
and youth ga<strong>in</strong><br />
access to jobs<br />
critical to local<br />
economies. In<br />
addition, the<br />
Economy<br />
Recovery Act<br />
gives State and<br />
Local Workforce<br />
Investment<br />
Boards (WIBs)<br />
an opportunity<br />
to implement<br />
new <strong>in</strong>novations<br />
such as align<strong>in</strong>g federal and state workforce education and tra<strong>in</strong><strong>in</strong>g programs. Under<br />
ARRA, state and local areas can <strong>in</strong>volve employers, unions and other job creation<br />
efforts to create skilled workers for these jobs and susta<strong>in</strong>able careers as the economic<br />
recovery cont<strong>in</strong>ues (Center for Law and Social Policy).<br />
While employment and tra<strong>in</strong><strong>in</strong>g programs geared to homeless people have proven to be<br />
effective <strong>in</strong> help<strong>in</strong>g homeless persons obta<strong>in</strong> work, successful completion <strong>of</strong> an<br />
employment program by a homeless person does not necessarily end his or her<br />
homelessness. He or she still needs a decent job and a place to live. <strong>The</strong>refore,<br />
transitional hous<strong>in</strong>g programs such as Sound Families <strong>in</strong> Seattle have become very<br />
Page 35 <strong>of</strong> 289
eneficial. By giv<strong>in</strong>g these families a place to live, they appear to be better able to f<strong>in</strong>d<br />
hous<strong>in</strong>g. In this program, employment upon entry <strong>in</strong>to the transitional hous<strong>in</strong>g was 27%;<br />
when these people exited their employment rate was 50% (Long, Rio, & Rosen, 2007).<br />
Also the U.S. Interagency Council on <strong>Homelessness</strong> was created to organize the<br />
federal response to homelessness to reduce and ultimately end homelessness <strong>in</strong><br />
America. <strong>The</strong> council focuses on federal <strong>in</strong>vestments and ensur<strong>in</strong>g that allocations are<br />
be<strong>in</strong>g dispersed to programs via public or private sectors target<strong>in</strong>g the homeless<br />
population.<br />
End<strong>in</strong>g homelessness will require clos<strong>in</strong>g the gap between <strong>in</strong>comes and hous<strong>in</strong>g costs.<br />
In such an equation, jobs that pay a liv<strong>in</strong>g wage are critical. Government, labor, and the<br />
private sector must work <strong>in</strong> concert to ensure that all Americans who can work have an<br />
opportunity to obta<strong>in</strong> a job, which pays a liv<strong>in</strong>g wage, and the necessary supports, such<br />
as child care and transportation, to keep it.<br />
________<br />
Footnotes<br />
1. FMRs are the monthly amounts "needed to rent privately owned, decent, safe, and<br />
sanitary rental hous<strong>in</strong>g <strong>of</strong> a modest (nonluxury) nature with suitable amenities." Federal<br />
Register. HUD determ<strong>in</strong>es FMRs for localities <strong>in</strong> all 50 states.<br />
2. <strong>The</strong> poverty l<strong>in</strong>e for a family <strong>of</strong> three is $12,750; for a family <strong>of</strong> four, the poverty l<strong>in</strong>e is<br />
$16,813. See http://www.census.gov/hhes/ww w/poverty.html for details.<br />
________<br />
Homeless Youth Unemployment Is N<strong>in</strong>e Times<br />
<strong>The</strong> National Average<br />
One <strong>in</strong> three people experienc<strong>in</strong>g homelessness is under 25.<br />
05/04/2017 12:43 PM AEST<br />
A landmark study has found homeless youth experience unemployment at more than<br />
n<strong>in</strong>e times the national average, further fuell<strong>in</strong>g calls for the federal government to<br />
outl<strong>in</strong>e a plan to address the tens <strong>of</strong> thousands <strong>of</strong> young people who f<strong>in</strong>d themselves<br />
homeless each year.<br />
Wednesday is Youth <strong>Homelessness</strong> Matters Day, a national day to highlight the impact<br />
homelessness has on young people and its knock-on effects to broader society.<br />
<strong>Homelessness</strong> is not just people forced to 'sleep rough' on streets or <strong>in</strong> parks, its<br />
broader def<strong>in</strong>ition encompass<strong>in</strong>g people who don't have a safe, stable place to live;<br />
couch-surf<strong>in</strong>g, stay<strong>in</strong>g with friends, liv<strong>in</strong>g temporarily <strong>in</strong> caravan parks or motels, or<br />
stay<strong>in</strong>g <strong>in</strong> refuges or shelters is also deemed 'homelessness'.<br />
Page 36 <strong>of</strong> 289
Youth <strong>Homelessness</strong> Matters Day is be<strong>in</strong>g celebrated nationwide, and <strong>in</strong> Sydney, the<br />
NSW peak body for youth homelessness Yfoundations launched its education and<br />
employment report 'Skills to Pay the Bills'.<br />
Survey<strong>in</strong>g 700 young people statewide, the report found unemployment among young<br />
people experienc<strong>in</strong>g homelessness was 55 percent, more than n<strong>in</strong>e times the current<br />
national unemployment rate <strong>of</strong> 5.9 percent and four times the current youth<br />
unemployment rate <strong>of</strong> 13 percent. Young people experienc<strong>in</strong>g homelessness also have<br />
far lower high school completion rates than statewide averages.<br />
Michelle Parker, the act<strong>in</strong>g CEO <strong>of</strong> Yfoundation, said up to 60,000 young people<br />
experienced homelessness <strong>in</strong> NSW last year. Statistics around youth homelessness are<br />
difficult to p<strong>in</strong> down, due to the 'hidden homelessness' <strong>of</strong> young people who are couchsurf<strong>in</strong>g<br />
or stay<strong>in</strong>g with friends, or who do not consider themselves to be homeless and<br />
therefore do not seek out services. However, statistics cited by various homelessness<br />
experts <strong>in</strong>clude:<br />
One <strong>in</strong> three people experienc<strong>in</strong>g homelessness is under the age <strong>of</strong> 25;<br />
One <strong>in</strong> eight people experienc<strong>in</strong>g homelessness is under the age <strong>of</strong> 10;<br />
39,000 school-age children needed homelessness help last year;<br />
Page 37 <strong>of</strong> 289
One <strong>in</strong> two adults receiv<strong>in</strong>g homelessness help first became homeless before<br />
age 18;<br />
"Today is about us gett<strong>in</strong>g together nationally and say<strong>in</strong>g what's happen<strong>in</strong>g at the<br />
moment is not OK," Parker told an event <strong>in</strong> Sydney. She said nearly 14,000 young<br />
people accessed homelessness services <strong>in</strong> 2015-16, but that the true problem is<br />
estimated to be more than four times higher.<br />
"It's really quite ridiculous <strong>in</strong> Sydney. Thats a lot <strong>of</strong> people... [but] we th<strong>in</strong>k it might be<br />
about a quarter, that puts the numbers around 60,000 a year."<br />
<strong>The</strong> problem is also large <strong>in</strong> Victoria. <strong>The</strong> Council to Homeless People said Australian<br />
Institute <strong>of</strong> Health and Welfare data found 38,400 people under the age <strong>of</strong> 25 accessed<br />
Victorian homelessness services <strong>in</strong> 2015-16. That's nearly 40 percent <strong>of</strong> all<br />
homelessness clients <strong>in</strong> the state. CHP's CEO Jenny Smith, too, said that number was<br />
likely vastly lower than reality.<br />
"Young people's homelessness is too <strong>of</strong>ten hidden, because many young people are<br />
experienc<strong>in</strong>g '<strong>in</strong>visible homelessness' <strong>in</strong> the form <strong>of</strong> couch-surf<strong>in</strong>g or overcrowd<strong>in</strong>g,"<br />
Smith said.<br />
Both Smith and Parker called on the federal government to <strong>in</strong>troduce a targeted plan to<br />
reduce youth homelessness. Other organizations "A perfect storm <strong>of</strong> <strong>in</strong>creas<strong>in</strong>g report<strong>in</strong>g <strong>of</strong><br />
family violence, decreas<strong>in</strong>g hous<strong>in</strong>g affordability for families with kids, a pitifully low Youth<br />
Allowance and ris<strong>in</strong>g youth unemployment is contribut<strong>in</strong>g to the crisis levels <strong>of</strong> homelessness<br />
we're see<strong>in</strong>g amongst our youth," Smith said.<br />
"In the absence <strong>of</strong> a national plan, we won't have any action. We're fortunate to have<br />
the <strong>in</strong>terest <strong>of</strong> the treasurer on hous<strong>in</strong>g affordability, but we're concerned he's focus<strong>in</strong>g<br />
on repurpos<strong>in</strong>g some <strong>of</strong> the exist<strong>in</strong>g fund<strong>in</strong>g and not actually talk<strong>in</strong>g about additional<br />
resources <strong>in</strong>to address<strong>in</strong>g the issue. You need a plan, a strategy, and resources to start<br />
tackl<strong>in</strong>g it. We don't have any <strong>of</strong> those th<strong>in</strong>gs."<br />
Parker agreed.<br />
"<strong>The</strong> last few years have been quite disappo<strong>in</strong>t<strong>in</strong>g on a national level around what we've<br />
got for young people," she said <strong>in</strong> Sydney.<br />
"<strong>The</strong>re's not only no plan for action on homelessness, there's no plan for young people<br />
<strong>in</strong> Australia and that's a massive problem."<br />
<strong>in</strong>clud<strong>in</strong>g Anglicare have also jo<strong>in</strong>ed the call.<br />
________<br />
Page 38 <strong>of</strong> 289
Amid Boom<strong>in</strong>g Economy, <strong>Homelessness</strong> Soars<br />
On <strong>US</strong> West Coast<br />
By Gillian Flaccus and Ge<strong>of</strong>f Mulvihill<br />
Nov. 09, 2017<br />
SEATTLE (AP) — In a park <strong>in</strong> the middle <strong>of</strong> a leafy, bohemian neighborhood where<br />
homes list for close to $1 million, a tractor’s massive claw scooped up the refuse <strong>of</strong> the<br />
homeless - mattresses, tents, wooden frames, a wicker chair, an outdoor propane<br />
heater. Workers <strong>in</strong> masks and steel-shanked boots plucked used needles and mounds<br />
<strong>of</strong> waste from the underbrush.<br />
Just a day before, this corner <strong>of</strong> Ravenna Park was an illegal home for the down and<br />
out, one <strong>of</strong> 400 such encampments that have popped up <strong>in</strong> Seattle’s parks, under<br />
bridges, on freeway medians and along busy sidewalks. Now, as police and social<br />
workers approached, some <strong>of</strong> the dispossessed scurried away, vanish<strong>in</strong>g <strong>in</strong>to a<br />
metropolis that is struggl<strong>in</strong>g to cope with an enormous wave <strong>of</strong> homelessness.<br />
That struggle is not Seattle’s alone. A homeless crisis <strong>of</strong> unprecedented proportions is<br />
rock<strong>in</strong>g the West Coast, and its victims are be<strong>in</strong>g left beh<strong>in</strong>d by the very th<strong>in</strong>gs that<br />
mark the region’s success: soar<strong>in</strong>g hous<strong>in</strong>g costs, rock-bottom vacancy rates and a<br />
Page 39 <strong>of</strong> 289
oar<strong>in</strong>g economy that waits for no one. All along the coast, elected <strong>of</strong>ficials are<br />
scrambl<strong>in</strong>g for solutions.<br />
“I’ve got economically zero unemployment <strong>in</strong> my city, and I’ve got thousands <strong>of</strong><br />
homeless people that actually are work<strong>in</strong>g and just can’t afford hous<strong>in</strong>g,” said Seattle<br />
City Councilman Mike O’Brien. “<strong>The</strong>re’s nowhere for these folks to move to. Every time<br />
we open up a new place, it fills up.”<br />
<strong>The</strong> ris<strong>in</strong>g numbers <strong>of</strong> homeless people have pushed abject poverty <strong>in</strong>to the open like<br />
never before and have overwhelmed cities and nonpr<strong>of</strong>its. <strong>The</strong> surge <strong>in</strong> people liv<strong>in</strong>g on<br />
the streets has put public health at risk, led several cities to declare states <strong>of</strong> emergency<br />
and forced cities and counties to spend millions - <strong>in</strong> some cases billions - <strong>in</strong> a search for<br />
solutions.<br />
San Diego now scrubs its sidewalks with bleach to counter a deadly hepatitis A<br />
outbreak that has spread to other cities and forced California to declare a state <strong>of</strong><br />
emergency last month. In Anaheim, home to Disneyland, 400 people sleep along a bike<br />
path <strong>in</strong> the shadow <strong>of</strong> Angel Stadium. Organizers <strong>in</strong> Portland lit <strong>in</strong>cense at a recent<br />
outdoor food festival to cover up the stench <strong>of</strong> ur<strong>in</strong>e <strong>in</strong> a park<strong>in</strong>g lot where vendors set<br />
up shop.<br />
<strong>Homelessness</strong> is not new on the West Coast. But <strong>in</strong>terviews with local <strong>of</strong>ficials and<br />
those who serve the homeless <strong>in</strong> California, Oregon and Wash<strong>in</strong>gton - coupled with an<br />
Associated Press review <strong>of</strong> prelim<strong>in</strong>ary homeless data - confirm it’s gett<strong>in</strong>g worse.<br />
People who were once able to get by, even if they suffered a setback, are now pushed<br />
to the streets because hous<strong>in</strong>g has become so expensive.<br />
All it takes is a prolonged illness, a lost job, a broken limb, a family crisis. What was<br />
once a blip <strong>in</strong> fortunes now seems a life sentence.<br />
“Most homeless people I know aren’t homeless because they’re addicts,” said Tammy<br />
Stephen, 54, who lives at a homeless encampment <strong>in</strong> Seattle. “Most people are<br />
homeless because they can’t afford a place to live.”<br />
Among the AP’s f<strong>in</strong>d<strong>in</strong>gs:<br />
— Official counts taken earlier this year <strong>in</strong> California, Oregon and Wash<strong>in</strong>gton<br />
show 168,000 homeless people <strong>in</strong> the three states, accord<strong>in</strong>g to an AP tally <strong>of</strong><br />
every jurisdiction <strong>in</strong> those states that reports homeless numbers to the U.S.<br />
Department <strong>of</strong> Hous<strong>in</strong>g and Urban Development. That is 19,000 more than were<br />
counted two years ago, although the numbers may not be directly comparable<br />
because <strong>of</strong> factors rang<strong>in</strong>g from the weather to new count<strong>in</strong>g methods.<br />
— Dur<strong>in</strong>g the same period, the number <strong>of</strong> unsheltered people <strong>in</strong> the three states<br />
- def<strong>in</strong>ed as someone sleep<strong>in</strong>g outside, <strong>in</strong> a bus or tra<strong>in</strong> station, abandoned<br />
build<strong>in</strong>g or vehicle - has climbed 18 percent to 105,000.<br />
Page 40 <strong>of</strong> 289
— Ris<strong>in</strong>g rents are the ma<strong>in</strong> culprit. <strong>The</strong> median one-bedroom apartment <strong>in</strong> the<br />
San Francisco Bay Area is significantly more expensive than it is <strong>in</strong> the New York<br />
City metro area, and apartments <strong>in</strong> San Francisco are listed at a higher price<br />
than those <strong>in</strong> Manhattan.<br />
— S<strong>in</strong>ce 2015, at least 10 cities or municipal regions <strong>in</strong> California, Oregon and<br />
Wash<strong>in</strong>gton - and Honolulu, as well - have declared states <strong>of</strong> emergency due to<br />
the rise <strong>of</strong> homelessness, a designation usually reserved for natural disasters.<br />
“What do we want as a city to look like? That’s what the citizens here need to decide,”<br />
said Gordon Walker, head <strong>of</strong> the regional task force for the homeless <strong>in</strong> San Diego,<br />
where the unsheltered homeless population has spiked by 18 percent <strong>in</strong> the past year.<br />
“What are we go<strong>in</strong>g to allow? Are we will<strong>in</strong>g to have people die on the streets?”<br />
With alarm<strong>in</strong>g frequency, the West Coast’s newly homeless are people who were able<br />
to survive on the marg<strong>in</strong>s - until those marg<strong>in</strong>s moved.<br />
For years, Stanley Timm<strong>in</strong>gs, 62, and his 61-year-old girlfriend, L<strong>in</strong>da Catl<strong>in</strong>, were able<br />
to rent a room <strong>in</strong> a friend’s house on their comb<strong>in</strong>ed disability payments.<br />
Last spr<strong>in</strong>g, that friend died <strong>of</strong> colon cancer and the couple was thrust on Seattle’s<br />
streets.<br />
Timm<strong>in</strong>gs used their last sav<strong>in</strong>gs to buy a used RV for $300 and spent another $300 to<br />
register it. <strong>The</strong>y bought a car from a junk yard for $275.<br />
Page 41 <strong>of</strong> 289
Now, the couple parks the RV near a small regional airport and uses the car to get<br />
around.<br />
<strong>The</strong>y have no runn<strong>in</strong>g water and no propane for the cook stove. <strong>The</strong>y go to the<br />
bathroom <strong>in</strong> a bucket and dump it beh<strong>in</strong>d a nearby bus<strong>in</strong>ess. <strong>The</strong>y shower and do<br />
laundry at a nonpr<strong>of</strong>it and buy water at a grocery depot. After four months, the stench <strong>of</strong><br />
human waste <strong>in</strong>side the RV is overwhelm<strong>in</strong>g. Every <strong>in</strong>ch <strong>of</strong> space is crammed with their<br />
belong<strong>in</strong>gs: jugs <strong>of</strong> laundry detergent, stacks <strong>of</strong> clothes, pots and pans, and tattered<br />
paperback novels. <strong>The</strong>y are exhausted, scared and defeated, with no solution <strong>in</strong> sight.<br />
“Between the two <strong>of</strong> us a month, we get $1,440 <strong>in</strong> disability. We can’t f<strong>in</strong>d a place for<br />
that,” he said. “Our <strong>in</strong>come is (about) $17,000 ... a year. That puts us way out <strong>of</strong> the<br />
ballpark, not even close. It might have been enough but anymore, no. It’s not.”<br />
A new study funded by the real estate <strong>in</strong>formation firm Zillow and conducted by the<br />
University <strong>of</strong> Wash<strong>in</strong>gton found a strong l<strong>in</strong>k between ris<strong>in</strong>g hous<strong>in</strong>g prices and ris<strong>in</strong>g<br />
homelessness numbers. A 5 percent rent <strong>in</strong>crease <strong>in</strong> Los Angeles, for example, would<br />
mean about 2,000 more homeless people there, the authors said.<br />
Nationally, homelessness has been trend<strong>in</strong>g down, partly because governments and<br />
nonpr<strong>of</strong>it groups have gotten better at mov<strong>in</strong>g people <strong>in</strong>to hous<strong>in</strong>g. That’s true <strong>in</strong> many<br />
West Coast cities, too, but the flow the other direction is even faster. And on the West<br />
Coast, shelter systems are smaller.<br />
“If you have a disability <strong>in</strong>come, you make about $9,000 a year and rent<strong>in</strong>g a studio <strong>in</strong><br />
Seattle is about $1,800 a month and so that’s twice your <strong>in</strong>come,” said Margaret K<strong>in</strong>g,<br />
director <strong>of</strong> hous<strong>in</strong>g programs for DESC, a nonpr<strong>of</strong>it that works with Seattle’s homeless.<br />
“So everybody who was just hang<strong>in</strong>g on because they had cheap rent, they’re los<strong>in</strong>g<br />
that ... and they w<strong>in</strong>d up outside. It’s just exploded.”<br />
Nowhere is that more evident than California’s Silicon Valley, where high salaries and a<br />
tight hous<strong>in</strong>g market have pushed rent out <strong>of</strong> reach for thousands. In ever-shift<strong>in</strong>g<br />
communities <strong>of</strong> the homeless, RVs and cars cluster by the dozens <strong>in</strong> the city where<br />
Google built its global headquarters and just blocks from Stanford University.<br />
Ellen Tara James-Penney, a lecturer at San Jose State University, has been sleep<strong>in</strong>g<br />
out <strong>of</strong> a car for about a decade, ever s<strong>in</strong>ce she lost her hous<strong>in</strong>g while an undergraduate<br />
at the school where she now teaches four English courses, a job that pays $28,000 a<br />
year. Home is an old Volvo.<br />
“I’ve basically been homeless s<strong>in</strong>ce 2007, and I’m really tired,” she said. “Really tired.”<br />
She actually got her start <strong>in</strong> the high tech <strong>in</strong>dustry, before be<strong>in</strong>g laid <strong>of</strong>f dur<strong>in</strong>g the tech<br />
meltdown <strong>of</strong> the early 2000s. Like many who couldn’t f<strong>in</strong>d work, she went to college,<br />
accumulat<strong>in</strong>g tens <strong>of</strong> thousands <strong>of</strong> dollars <strong>in</strong> student debt along the way.<br />
Page 42 <strong>of</strong> 289
Now 54, she grades papers and prepares lesson plans <strong>in</strong> her car. Among her few<br />
belong<strong>in</strong>gs is a pair <strong>of</strong> her grandmother’s fancy stiletto pumps, a rem<strong>in</strong>der to herself that<br />
“it’s not go<strong>in</strong>g to be like this forever.”<br />
Increased hous<strong>in</strong>g costs aren’t just sweep<strong>in</strong>g up low-<strong>in</strong>come workers: <strong>The</strong> numbers <strong>of</strong><br />
homeless youth also is ris<strong>in</strong>g.<br />
A recent count <strong>in</strong> Los Angeles, for example, found that those ages 18 to 24 were the<br />
fastest-grow<strong>in</strong>g homeless group by age, up 64 percent, followed by those under 18. Los<br />
Angeles and other cities have made a concerted effort to improve their tallies <strong>of</strong><br />
homeless youth, which likely accounts for some <strong>of</strong> the <strong>in</strong>crease.<br />
One <strong>of</strong> the reasons is the comb<strong>in</strong>ed cost <strong>of</strong> hous<strong>in</strong>g and tuition, said Will Lehman, policy<br />
supervisor at Los Angeles Homeless Services Authority. A recent study by the<br />
University <strong>of</strong> Wiscons<strong>in</strong> found that one <strong>in</strong> five Los Angeles Community College District<br />
students is homeless, he said.<br />
“<strong>The</strong>y can pay for books, for classes but just can’t afford an apartment. <strong>The</strong>y’re<br />
choos<strong>in</strong>g to prioritize go<strong>in</strong>g to school,” Lehman said. “<strong>The</strong>y don’t choose their situation.”<br />
___<br />
Michael Madigan opened a new w<strong>in</strong>e bar <strong>in</strong> Portland a few years ago overlook<strong>in</strong>g a<br />
ribbon <strong>of</strong> parks not far from the city’s trendy Pearl District.<br />
Bus<strong>in</strong>ess was good until, almost overnight, dozens <strong>of</strong> homeless people showed up on<br />
the sidewalk. A large encampment on the other side <strong>of</strong> the city had been shut down,<br />
and its residents moved to the park at his doorstep.<br />
“We literally turned the corner one day ... and there were 48 tents set up on this one<br />
block that hadn’t been there the day before,” he said.<br />
Page 43 <strong>of</strong> 289
Madigan’s bus<strong>in</strong>ess dropped 50 percent <strong>in</strong> four months and he closed his bar. <strong>The</strong>re<br />
are fewer homeless people there now, but the campers have moved to a bike path that<br />
w<strong>in</strong>ds through residential neighborhoods <strong>in</strong> east Portland, prompt<strong>in</strong>g hundreds <strong>of</strong><br />
compla<strong>in</strong>ts about trash, noise, drug use and illegal camp<strong>in</strong>g.<br />
Rachel Sterry, a naturopathic doctor, lives near that path and sometimes doesn’t feel<br />
safe when she’s commut<strong>in</strong>g by bike with her 1-year-old son. Dogs have rolled <strong>in</strong> human<br />
feces <strong>in</strong> a local park; recent improvements she’s made to her small home are<br />
overshadowed by the l<strong>in</strong>e <strong>of</strong> tents and tarps a few dozen yards from her front door, she<br />
said.<br />
“I have to stop and get <strong>of</strong>f my bike to ask people to move their card game or their<br />
lounge chairs or their trash out <strong>of</strong> the way when I’m just try<strong>in</strong>g to get from po<strong>in</strong>t A to<br />
po<strong>in</strong>t B,” she said. “If I were to scream or get hurt, nobody would know.”<br />
For Seattle resident Elisabeth James, the reality check came when a homeless man<br />
forced his way <strong>in</strong>to a glass-enclosed ATM lobby with her after she swiped her card to<br />
open the door for after-hours access. After a few nerve-wrack<strong>in</strong>g m<strong>in</strong>utes, the man left<br />
the lobby but stayed outside, bang<strong>in</strong>g on the glass. Police were too busy to respond so<br />
James called her husband, who scared the man away and walked her home. <strong>The</strong> man,<br />
she believes, just wanted to get out <strong>of</strong> the ra<strong>in</strong>.<br />
A neighborhood pocket park has become a flashpo<strong>in</strong>t, too: When James took her 2-<br />
year-old grandchild there, she saw people <strong>in</strong>ject<strong>in</strong>g hero<strong>in</strong>.<br />
“I’m not a NIMBY person, but I just th<strong>in</strong>k that we can do so much more,” said James,<br />
who founded an activist group called Speak Out Seattle last year. “I wanted to do<br />
someth<strong>in</strong>g that was effective, that brought frustrated people together to f<strong>in</strong>d solutions.<br />
We’re spend<strong>in</strong>g a lot <strong>of</strong> money to house people and we’re gett<strong>in</strong>g a bigger problem.”<br />
<strong>The</strong> crisis is not limited to large metropolises. In Oregon City, a suburban, work<strong>in</strong>g-class<br />
town <strong>of</strong> 36,000 people, the police department this summer added a full-time position for<br />
a homeless outreach <strong>of</strong>ficer after roughly half the calls concerned trash, trespass<strong>in</strong>g,<br />
human waste and illegal encampments.<br />
<strong>The</strong> city has no overnight shelters and never had a significant homeless population until<br />
about three years ago.<br />
On a recent fall day, <strong>of</strong>ficer Mike Day tromped <strong>in</strong>to a greenbelt across from a strip mall<br />
to check on a man he recently connected with a counselor, calmed an <strong>in</strong>toxicated man<br />
and arranged emergency care for a man who was suicidal.<br />
“How many social workers have you met that go <strong>in</strong>to the woods to follow up with the<br />
homeless population and to help with mental health? This is a bit <strong>of</strong> a hybrid position,<br />
certa<strong>in</strong>ly, and maybe it’s not exactly the role <strong>of</strong> a police <strong>of</strong>ficer - but it’s a creative<br />
approach to f<strong>in</strong>d a solution to the problem,” he said.<br />
Page 44 <strong>of</strong> 289
<strong>The</strong> question was, “What can we do differently? Because right now, it’s not work<strong>in</strong>g.”<br />
All along the West Coast, local governments are scrambl<strong>in</strong>g to answer that question -<br />
and taxpayers are foot<strong>in</strong>g the bill.<br />
Voters have approved more than $8 billion <strong>in</strong> spend<strong>in</strong>g s<strong>in</strong>ce 2015 on affordable<br />
hous<strong>in</strong>g and other anti-homelessness programs, mostly as tax <strong>in</strong>creases. Los Angeles<br />
voters, for example, approved $1.2 billion to build 10,000 units <strong>of</strong> affordable hous<strong>in</strong>g<br />
over a decade to address a balloon<strong>in</strong>g homeless population that’s reached 34,000<br />
people with<strong>in</strong> city limits.<br />
Seattle spent $61 million on homeless-related issues last year, and a recent budget<br />
proposal would <strong>in</strong>crease that to $63 million. Four years ago, the city spent $39 million<br />
on homelessness. Sacramento has set a goal <strong>of</strong> mov<strong>in</strong>g 2,000 people <strong>of</strong>f the streets <strong>in</strong><br />
the next three years and may place a hous<strong>in</strong>g bond before voters <strong>in</strong> 2018.<br />
Appeals for money have angered residents who see tent encampments grow<strong>in</strong>g <strong>in</strong> their<br />
cities despite more spend<strong>in</strong>g.<br />
“Those are like whack-a-mole because they just sprout up and then they disappear and<br />
then they sprout up somewhere else,” said Gretchen Taylor, who helped found the<br />
Neighborhood Safety Alliance <strong>of</strong> Seattle <strong>in</strong> 2016.<br />
Page 45 <strong>of</strong> 289
Seattle is <strong>in</strong>itiat<strong>in</strong>g competitive bidd<strong>in</strong>g among nonpr<strong>of</strong>it organizations for city dollars<br />
go<strong>in</strong>g toward homelessness programs. It’s also pour<strong>in</strong>g money <strong>in</strong>to “rapid rehous<strong>in</strong>g,” a<br />
strategy that houses people quickly and then provides rental assistance for up to 18<br />
months.<br />
Like San Francisco, Seattle has started open<strong>in</strong>g 24-hour, “low-barrier” shelters that <strong>of</strong>fer<br />
beds even if people are abus<strong>in</strong>g drugs, have a pet or want to sleep together as a<br />
couple. But the city’s first 24-hour shelter has only 75 beds, and turnover is extremely<br />
low.<br />
A team <strong>of</strong> specially tra<strong>in</strong>ed police <strong>of</strong>ficers and social workers has also been visit<strong>in</strong>g<br />
homeless camps to try to place people <strong>in</strong> shelter. After repeated visits - and with 72<br />
hours <strong>of</strong> notice - the city cleans out the camps and hauls away abandoned belong<strong>in</strong>gs.<br />
<strong>The</strong>se efforts are start<strong>in</strong>g to yield results, although the overall number <strong>of</strong> homeless<br />
people cont<strong>in</strong>ues to swell.<br />
Nearly 740 families moved <strong>in</strong>to some type <strong>of</strong> shelter between October 2016 and August<br />
2017, and 39 percent <strong>of</strong> the people contacted by the new police teams w<strong>in</strong>d up<br />
sheltered, accord<strong>in</strong>g a recent city homeless report. That’s an improvement from a 5<br />
percent shelter rate 18 months ago, said Sgt. Eric Zerr, who leads that effort.<br />
But the approach has its detractors. <strong>The</strong> American Civil Liberties Union filed a lawsuit<br />
alleg<strong>in</strong>g the sweeps violate the constitutional protections aga<strong>in</strong>st unreasonable search<br />
and seizure. And a debate is rag<strong>in</strong>g about whether the sweeps are necessary “tough<br />
love” or a cruel policy that crim<strong>in</strong>alizes poverty <strong>in</strong> a city with a reputation for liberalism.<br />
“When a city can’t <strong>of</strong>fer hous<strong>in</strong>g, they should not be able to sweep that spot unless it’s<br />
pos<strong>in</strong>g some sort <strong>of</strong> significant health and safety issue,” said Sara Rank<strong>in</strong>, a pr<strong>of</strong>essor<br />
with the Homeless Rights Advocacy Project at the Seattle University School <strong>of</strong> Law.<br />
“If someone doesn’t have a place to go, you can’t just cont<strong>in</strong>ue to chase them from<br />
place to place.”<br />
Above all, the West Coast lacks long-term, low-<strong>in</strong>come hous<strong>in</strong>g for people like Ashley<br />
Dibble and her 3-year-old daughter.<br />
Dibble, 29, says she has been homeless <strong>of</strong>f and on for about a year, after her exboyfriend<br />
squandered money on his car and didn’t pay the rent for three months.<br />
Evicted, Dibble says she lived <strong>in</strong> the back <strong>of</strong> a mov<strong>in</strong>g truck and with several different<br />
friends around Seattle before w<strong>in</strong>d<strong>in</strong>g up on the streets. She sent her toddler to live with<br />
the girl’s paternal grandparents <strong>in</strong> Florida.<br />
She and her new boyfriend were sleep<strong>in</strong>g under tarps near Safeco Field, home <strong>of</strong> the<br />
Seattle Mar<strong>in</strong>ers, when an outreach team referred them to a new shelter. Now, Dibble<br />
talks to her daughter daily by phone and is try<strong>in</strong>g to f<strong>in</strong>d a way back <strong>in</strong>to hous<strong>in</strong>g so she<br />
can br<strong>in</strong>g her home.<br />
Page 46 <strong>of</strong> 289
With an eviction on her record and little <strong>in</strong>come, no one will rent to her.<br />
“I’ve had so many doors slammed <strong>in</strong> my face, it’s ridiculous,” Dibble said, wip<strong>in</strong>g away<br />
tears.<br />
Seattle’s DESC operates 1,200 so-called “permanent supportive hous<strong>in</strong>g units” -<br />
hous<strong>in</strong>g for the mentally ill or severely addicted who can’t stay housed without constant<br />
help from case managers, counselors and rehabilitation programs. <strong>The</strong> nonpr<strong>of</strong>it<br />
completes a new build<strong>in</strong>g every 18 months and they immediately fill; at any given time,<br />
there are only about eight to 10 units free <strong>in</strong> the whole city - but 1,600 people qualify.<br />
Among this population, “almost nobody’s go<strong>in</strong>g to get hous<strong>in</strong>g because there isn’t any,”<br />
DESC’s Margaret K<strong>in</strong>g said. “It doesn’t really matter.”<br />
<strong>The</strong>re is so little hous<strong>in</strong>g, and so much despair. Nonpr<strong>of</strong>it workers with decades <strong>of</strong><br />
experience are shocked by the surge <strong>in</strong> homeless people and <strong>in</strong> the banality <strong>of</strong> the<br />
ways they wound up on the streets.<br />
“It’s a sea <strong>of</strong> humanity crash<strong>in</strong>g aga<strong>in</strong>st services, and services at this po<strong>in</strong>t are<br />
overwhelmed, literally overwhelmed. It’s catastrophic,” said Jeremy Lemo<strong>in</strong>e, an<br />
outreach case manager with REACH, a Seattle homeless-assistance program. “It’s a<br />
refugee crisis right here <strong>in</strong> the States, right here under our noses.”<br />
“I don’t mean to sound hopeless. I generate hope for a liv<strong>in</strong>g for people - that there is a<br />
future for them - but we need to address it now.”<br />
Page 47 <strong>of</strong> 289
Page 48 <strong>of</strong> 289
III. <strong>The</strong> Work<strong>in</strong>g Poor<br />
<strong>The</strong> work<strong>in</strong>g poor are work<strong>in</strong>g people whose <strong>in</strong>comes fall below a given poverty l<strong>in</strong>e<br />
due to lack <strong>of</strong> work hours and/or low wages. Largely because they are earn<strong>in</strong>g such low<br />
wages, the work<strong>in</strong>g poor face numerous obstacles that make it difficult for many <strong>of</strong> them<br />
to f<strong>in</strong>d and keep a job, save up money, and ma<strong>in</strong>ta<strong>in</strong> a sense <strong>of</strong> self-worth.<br />
<strong>The</strong> <strong>of</strong>ficial work<strong>in</strong>g poverty rate <strong>in</strong> the <strong>US</strong> has rema<strong>in</strong>ed relatively static over the past<br />
four decades, but many social scientists argue that the <strong>of</strong>ficial rate is set too low, and<br />
that the proportion <strong>of</strong> workers fac<strong>in</strong>g significant f<strong>in</strong>ancial hardship has <strong>in</strong>stead <strong>in</strong>creased<br />
over the years. Changes <strong>in</strong> the economy, especially the shift from a manufactur<strong>in</strong>gbased<br />
to a service-based economy, have resulted <strong>in</strong> the polarization <strong>of</strong> the labor<br />
market. This means that there are more jobs at the top and the bottom <strong>of</strong> the <strong>in</strong>come<br />
spectrum, but fewer jobs <strong>in</strong> the middle.<br />
<strong>The</strong>re are a wide range <strong>of</strong> anti-poverty policies that have been shown to improve the<br />
situation <strong>of</strong> the work<strong>in</strong>g poor. Research suggests that <strong>in</strong>creas<strong>in</strong>g welfare state<br />
generosity is the most effective way to reduce poverty and work<strong>in</strong>g poverty. Other tools<br />
available to governments are <strong>in</strong>creas<strong>in</strong>g m<strong>in</strong>imum wages across a nation, and<br />
absorb<strong>in</strong>g educational and health care costs for children <strong>of</strong> the work<strong>in</strong>g poor.<br />
Page 49 <strong>of</strong> 289
Conceptualiz<strong>in</strong>g Work<strong>in</strong>g Poverty<br />
In the United States, the issue <strong>of</strong> work<strong>in</strong>g poverty was <strong>in</strong>itially brought to the public's<br />
attention dur<strong>in</strong>g the Progressive Era (1890s–1920s). Progressive Era th<strong>in</strong>kers like<br />
Robert Hunter, Jane Addams, and W.E.B. Du Bois saw society's unequal opportunity<br />
structure as the root cause <strong>of</strong> poverty and work<strong>in</strong>g poverty, but they also saw a l<strong>in</strong>k<br />
between moral factors and poverty. In his study <strong>of</strong> Philadelphia's African American<br />
neighborhoods, W.E.B. Du Bois draws a dist<strong>in</strong>ction between "hardwork<strong>in</strong>g" poor people<br />
who fail to escape poverty due to racial discrim<strong>in</strong>ation and those who are poor due to<br />
moral deficiencies such as laz<strong>in</strong>ess or lack <strong>of</strong> perseverance.<br />
After the Great Depression, the New Deal, and World War II, the United States<br />
experienced an era <strong>of</strong> prosperity dur<strong>in</strong>g which most workers experienced significant<br />
ga<strong>in</strong>s <strong>in</strong> wages and work<strong>in</strong>g conditions. Dur<strong>in</strong>g this period (1930s–1950s), scholars<br />
shifted their attention away from poverty and work<strong>in</strong>g poverty. However, <strong>in</strong> the late<br />
1950s and early 1960s American scholars and policymakers began to revisit the<br />
problem. Influential books like John Kenneth Galbraith's <strong>The</strong> Affluent Society (1958) and<br />
Michael Harr<strong>in</strong>gton's <strong>The</strong> Other America (1962) re<strong>in</strong>vigorated the discussions on<br />
poverty and work<strong>in</strong>g poverty <strong>in</strong> the United States.<br />
S<strong>in</strong>ce the start <strong>of</strong> the War on Poverty <strong>in</strong> the 1960s, scholars and policymakers on both<br />
ends <strong>of</strong> the political spectrum have paid an <strong>in</strong>creas<strong>in</strong>g amount <strong>of</strong> attention to work<strong>in</strong>g<br />
poverty. One <strong>of</strong> the key ongo<strong>in</strong>g debates concerns the dist<strong>in</strong>ction between the work<strong>in</strong>g<br />
and the nonwork<strong>in</strong>g (unemployed) poor. Conservative scholars tend to see nonwork<strong>in</strong>g<br />
poverty as a more urgent problem than work<strong>in</strong>g poverty because they believe that nonwork<br />
is a moral hazard that leads to welfare dependency and laz<strong>in</strong>ess, whereas work,<br />
even poorly paid work, is morally beneficial. In order to solve the problem <strong>of</strong> nonwork<strong>in</strong>g<br />
poverty, some conservative scholars argue that the government must stop "coddl<strong>in</strong>g"<br />
the poor with welfare benefits like AFDC/TANF.<br />
On the other hand, liberal scholars and policymakers <strong>of</strong>ten argue that most work<strong>in</strong>g and<br />
nonwork<strong>in</strong>g poor people are quite similar. Studies compar<strong>in</strong>g s<strong>in</strong>gle mothers on and <strong>of</strong>f<br />
welfare show that receiv<strong>in</strong>g welfare payments does not degrade a person's desire to<br />
f<strong>in</strong>d a job and get <strong>of</strong>f <strong>of</strong> welfare. <strong>The</strong> ma<strong>in</strong> difference between the work<strong>in</strong>g and the<br />
nonwork<strong>in</strong>g poor, they argue, is that the nonwork<strong>in</strong>g poor have a more difficult time<br />
overcom<strong>in</strong>g basic barriers to entry <strong>in</strong>to the labor market, such as arrang<strong>in</strong>g for<br />
affordable childcare, f<strong>in</strong>d<strong>in</strong>g hous<strong>in</strong>g near potential jobs, or arrang<strong>in</strong>g for transportation<br />
to and from work. In order to help the nonwork<strong>in</strong>g poor ga<strong>in</strong> entry <strong>in</strong>to the labor market,<br />
liberal scholars and policymakers argue that the government should provide more<br />
hous<strong>in</strong>g assistance, childcare, and other k<strong>in</strong>ds <strong>of</strong> aid to poor families.<br />
Discussions about the alleviation <strong>of</strong> work<strong>in</strong>g poverty are also politically charged.<br />
Conservative scholars and policymakers <strong>of</strong>ten attribute the prevalence <strong>of</strong> <strong>in</strong>equality and<br />
work<strong>in</strong>g poverty to overregulation and overtaxation, which they claim constricts job<br />
growth. In order to lower the rate <strong>of</strong> work<strong>in</strong>g poverty, conservatives advocate reduc<strong>in</strong>g<br />
welfare benefits and enact<strong>in</strong>g less str<strong>in</strong>gent labor laws. On the other hand, many<br />
Page 50 <strong>of</strong> 289
liberals argue that work<strong>in</strong>g poverty can only be solved through <strong>in</strong>creased, not<br />
decreased, government <strong>in</strong>tervention. This government <strong>in</strong>tervention could <strong>in</strong>clude<br />
workplace reforms (such as higher m<strong>in</strong>imum wages, liv<strong>in</strong>g wage laws, job tra<strong>in</strong><strong>in</strong>g<br />
programs, etc.) and an <strong>in</strong>crease <strong>in</strong> government transfers (such as hous<strong>in</strong>g, food,<br />
childcare, and healthcare subsidies).<br />
Absolute<br />
Measur<strong>in</strong>g Work<strong>in</strong>g Poverty<br />
Accord<strong>in</strong>g to the <strong>US</strong> Department <strong>of</strong> Labor, the work<strong>in</strong>g poor "are persons who spent at<br />
least 27 weeks [<strong>in</strong> the past year] <strong>in</strong> the labor force (that is, work<strong>in</strong>g or look<strong>in</strong>g for work),<br />
but whose <strong>in</strong>comes fell below the <strong>of</strong>ficial poverty level." In other words, if someone<br />
spent more than half <strong>of</strong> the past year <strong>in</strong> the labor force without earn<strong>in</strong>g more than the<br />
<strong>of</strong>ficial poverty threshold, the <strong>US</strong> Department <strong>of</strong> Labor would classify them as "work<strong>in</strong>g<br />
poor." (Note: <strong>The</strong> <strong>of</strong>ficial poverty threshold, which is set by the <strong>US</strong> Census Bureau,<br />
varies depend<strong>in</strong>g on the size <strong>of</strong> a family and the age <strong>of</strong> the family members.) <strong>The</strong> <strong>US</strong><br />
Bureau <strong>of</strong> Labor Statistics calculates work<strong>in</strong>g poverty rates for all work<strong>in</strong>g <strong>in</strong>dividuals, all<br />
families with at least one worker, and all "unrelated <strong>in</strong>dividuals." <strong>The</strong> <strong>in</strong>dividual-level<br />
work<strong>in</strong>g poverty rate calculates the percentage <strong>of</strong> all workers whose <strong>in</strong>comes fall below<br />
the poverty threshold. In 2009, the <strong>in</strong>dividual-level work<strong>in</strong>g poverty rate <strong>in</strong> the <strong>US</strong> was<br />
7%, compared to 4.7% <strong>in</strong> 2000. <strong>The</strong> family-level work<strong>in</strong>g poverty rate only <strong>in</strong>cludes<br />
families <strong>of</strong> two or more people who are related by birth, marriage, or adoption.<br />
Accord<strong>in</strong>g to the Bureau <strong>of</strong> Labor Statistics' def<strong>in</strong>ition <strong>of</strong> family-level work<strong>in</strong>g poverty, a<br />
Page 51 <strong>of</strong> 289
family is work<strong>in</strong>g poor if the comb<strong>in</strong>ed cash <strong>in</strong>come <strong>of</strong> the family falls below the poverty<br />
threshold for a family <strong>of</strong> their size. In 2009, the family-level work<strong>in</strong>g poverty rate <strong>in</strong> the<br />
<strong>US</strong> was 7.9%, compared to 5.6% <strong>in</strong> 2000. F<strong>in</strong>ally, the unrelated <strong>in</strong>dividual work<strong>in</strong>g<br />
poverty rate measures work<strong>in</strong>g poverty among those who do not currently live with any<br />
family members. In 2009, 11.7% <strong>of</strong> employed unrelated <strong>in</strong>dividuals were poor,<br />
compared to 7.6% <strong>in</strong> 2000.<br />
Relative<br />
In Europe and other non-<strong>US</strong>, high-<strong>in</strong>come countries, poverty and work<strong>in</strong>g poverty are<br />
def<strong>in</strong>ed <strong>in</strong> relative terms. A relative measure <strong>of</strong> poverty is based on a country's <strong>in</strong>come<br />
distribution rather than an absolute amount <strong>of</strong> money. Eurostat, the statistical <strong>of</strong>fice <strong>of</strong><br />
the European Union, classifies a household as poor if its <strong>in</strong>come is less than 60 percent<br />
<strong>of</strong> the country's median household <strong>in</strong>come. Accord<strong>in</strong>g to Eurostat, a relative measure <strong>of</strong><br />
poverty is appropriate because "m<strong>in</strong>imal acceptable standards usually differ between<br />
societies accord<strong>in</strong>g to their general level <strong>of</strong> prosperity: someone regarded as poor <strong>in</strong> a<br />
rich developed country might be regarded as rich <strong>in</strong> a poor develop<strong>in</strong>g country."<br />
When conduct<strong>in</strong>g cross-national research on work<strong>in</strong>g poverty, scholars tend to use a<br />
relative measure <strong>of</strong> poverty. In these studies, to be classified as "work<strong>in</strong>g poor," a<br />
household must satisfy the follow<strong>in</strong>g two conditions: 1) at least one member <strong>of</strong> the<br />
household must be "work<strong>in</strong>g" (which can be def<strong>in</strong>ed <strong>in</strong> various ways), and 2) the total<br />
household <strong>in</strong>come must be less than 60% (or 50%, or 40%) <strong>of</strong> the median <strong>in</strong>come for<br />
that country. Brady, Fullerton, and Cross's 2010 cross-national study on work<strong>in</strong>g poverty<br />
<strong>in</strong> high-<strong>in</strong>come countries def<strong>in</strong>es a household as work<strong>in</strong>g poor if 1) it has at least one<br />
employed person and 2) the total household <strong>in</strong>come falls below 50% <strong>of</strong> the median<br />
<strong>in</strong>come for that country. Accord<strong>in</strong>g to this relative def<strong>in</strong>ition, the <strong>US</strong>'s work<strong>in</strong>g poverty<br />
rate was 11% <strong>in</strong> the year 2000, nearly double the rate produced by the <strong>US</strong><br />
government's absolute def<strong>in</strong>ition. For the same year, Canada's work<strong>in</strong>g poverty rate<br />
was 7.8%, the UK's was 4%, and Germany's was 3.8%.<br />
Prevalence and Trends<br />
Poverty is <strong>of</strong>ten associated with joblessness, but a large proportion <strong>of</strong> poor people are<br />
actually work<strong>in</strong>g or look<strong>in</strong>g for work. In 2009, accord<strong>in</strong>g to the <strong>US</strong> Census Bureau's<br />
<strong>of</strong>ficial def<strong>in</strong>ition <strong>of</strong> poverty, 8.8 million <strong>US</strong> families were below the poverty l<strong>in</strong>e (11.1%<br />
<strong>of</strong> all families). Of these families, 5.19 million, or 58.9%, had at least one person who<br />
was classified as work<strong>in</strong>g. In the same year, there were 11.7 million unrelated<br />
<strong>in</strong>dividuals (people who do not live with family members) whose <strong>in</strong>comes fell below the<br />
<strong>of</strong>ficial poverty l<strong>in</strong>e (22% <strong>of</strong> all unrelated <strong>in</strong>dividuals). 3.9 million <strong>of</strong> these poor<br />
<strong>in</strong>dividuals, or 33%, were part <strong>of</strong> the work<strong>in</strong>g poor. <strong>The</strong> cost <strong>of</strong> rais<strong>in</strong>g a child from birth<br />
to age 18 for a middle-<strong>in</strong>come, two-parent family averaged $226,920 last year (not<br />
<strong>in</strong>clud<strong>in</strong>g college), accord<strong>in</strong>g to the U.S. Department <strong>of</strong> Agriculture. That's up nearly<br />
40% -- or more than $60,000—from 10 years ago. Just one year <strong>of</strong> spend<strong>in</strong>g on a child<br />
can cost up to $13,830 <strong>in</strong> 2010, compared to $9,860 a decade ago.<br />
Page 52 <strong>of</strong> 289
Us<strong>in</strong>g the <strong>US</strong> Census Bureau's def<strong>in</strong>ition <strong>of</strong> poverty, the work<strong>in</strong>g poverty rate seems to<br />
have rema<strong>in</strong>ed relatively stable s<strong>in</strong>ce 1978. However, many scholars have argued that<br />
the <strong>of</strong>ficial poverty threshold is too low, and that real wages and work<strong>in</strong>g conditions<br />
have actually decl<strong>in</strong>ed for many workers over the past three or four decades. Social<br />
scientists like Arne Kalleberg have found that the decl<strong>in</strong>e <strong>in</strong> <strong>US</strong> manufactur<strong>in</strong>g and the<br />
subsequent polarization <strong>of</strong> the labor market has led to an overall worsen<strong>in</strong>g <strong>of</strong> wages,<br />
job stability, and work<strong>in</strong>g conditions for people with lower skill levels and less formal<br />
education. From the mid-1940s to the mid-1970s, manufactur<strong>in</strong>g jobs <strong>of</strong>fered many lowskilled<br />
and medium-skilled workers stable, well-pay<strong>in</strong>g jobs. Due to global competition,<br />
technological advances, and other factors, <strong>US</strong> manufactur<strong>in</strong>g jobs have been<br />
disappear<strong>in</strong>g for decades. (From 1970 to 2008, the percentage <strong>of</strong> the labor force<br />
employed <strong>in</strong> the manufactur<strong>in</strong>g sector shrank from 23.4% to 9.1%.) Dur<strong>in</strong>g this period <strong>of</strong><br />
decl<strong>in</strong>e, job growth became polarized on either end <strong>of</strong> the labor market. That is, the jobs<br />
that replaced medium-pay, low- to medium-skill manufactur<strong>in</strong>g jobs were high-pay<strong>in</strong>g,<br />
high-skill jobs and low-pay<strong>in</strong>g, low-skill jobs. <strong>The</strong>refore, many low- to medium-skilled<br />
workers who would have been able to work <strong>in</strong> the manufactur<strong>in</strong>g sector <strong>in</strong> 1970 must<br />
now take low-pay<strong>in</strong>g, precarious jobs <strong>in</strong> the service sector.<br />
<strong>US</strong> Compared To<br />
Europe<br />
Other high-<strong>in</strong>come<br />
countries have also<br />
experienced<br />
decl<strong>in</strong><strong>in</strong>g<br />
manufactur<strong>in</strong>g<br />
sectors over the past<br />
four decades, but<br />
most <strong>of</strong> them have<br />
not experienced as<br />
much labor market<br />
polarization as the United States. Labor market polarization has been the most severe<br />
<strong>in</strong> liberal market economies like the <strong>US</strong>, Brita<strong>in</strong>, and Australia. Countries like Denmark<br />
and France have been subject to the same economic pressures, but due to their more<br />
"<strong>in</strong>clusive" (or "egalitarian") labor market <strong>in</strong>stitutions, such as centralized and solidaristic<br />
collective barga<strong>in</strong><strong>in</strong>g and strong m<strong>in</strong>imum wage laws, they have experienced less<br />
polarization.<br />
Cross-national studies have found that European countries' work<strong>in</strong>g poverty rates are<br />
much lower than the <strong>US</strong>'s. Most <strong>of</strong> this difference can be expla<strong>in</strong>ed by the fact that<br />
European countries' welfare states are more generous than the <strong>US</strong>'s. <strong>The</strong> relationship<br />
between generous welfare states and low rates <strong>of</strong> work<strong>in</strong>g poverty is elaborated upon <strong>in</strong><br />
the "Risk Factors" and "Anti-Poverty Policies" sections.<br />
<strong>The</strong> follow<strong>in</strong>g graph uses data from Brady, Fullerton, and Cross (2010) to show the<br />
work<strong>in</strong>g poverty rates for a small sample <strong>of</strong> countries. Brady, Fullerton, and Cross<br />
Page 53 <strong>of</strong> 289
(2010) accessed this data through the Luxembourg Income Study. This graph measures<br />
household, rather than person-level, poverty rates. A household is coded as "poor" if its<br />
<strong>in</strong>come is less than 50% <strong>of</strong> its country's median <strong>in</strong>come. This is a relative, rather than<br />
absolute, measure <strong>of</strong> poverty. A household is classified as "work<strong>in</strong>g" if at least one<br />
member <strong>of</strong> the household was employed at the time <strong>of</strong> the survey. <strong>The</strong> most important<br />
<strong>in</strong>sight conta<strong>in</strong>ed <strong>in</strong> this graph is that the <strong>US</strong> has strik<strong>in</strong>gly higher work<strong>in</strong>g poverty rates<br />
than European countries.<br />
Risk factors<br />
<strong>The</strong>re are five major categories <strong>of</strong> risk factors that <strong>in</strong>crease a person's likelihood <strong>of</strong><br />
experienc<strong>in</strong>g work<strong>in</strong>g poverty: sectoral factors, demographic factors, economic factors,<br />
labor market <strong>in</strong>stitutions, and welfare generosity. Work<strong>in</strong>g poverty is a phenomenon that<br />
affects a very wide range <strong>of</strong> people, but there are some employment sectors,<br />
demographic groups, political factors, and economic factors that are correlated with<br />
higher rates <strong>of</strong> work<strong>in</strong>g poverty than others. Sectoral and demographic factors help<br />
expla<strong>in</strong> why certa<strong>in</strong> people with<strong>in</strong> a given country are more likely than others to be<br />
work<strong>in</strong>g poor. Political and economic factors can expla<strong>in</strong> why different countries have<br />
different work<strong>in</strong>g poverty rates.<br />
Sectoral<br />
tendencies<br />
Work<strong>in</strong>g poverty is not distributed equally among employment sectors. <strong>The</strong> service<br />
sector has the highest rate <strong>of</strong> work<strong>in</strong>g poverty. In fact, 13.3% <strong>of</strong> <strong>US</strong> service sector<br />
workers found themselves below the poverty l<strong>in</strong>e <strong>in</strong> 2009. Examples <strong>of</strong> low-wage<br />
service sector workers <strong>in</strong>clude fast-food workers, home health aids, waiters/waitresses,<br />
and retail workers.<br />
Page 54 <strong>of</strong> 289
Although the service sector has the highest rate <strong>of</strong> work<strong>in</strong>g poverty, a significant portion<br />
<strong>of</strong> the work<strong>in</strong>g poor are blue-collar workers <strong>in</strong> the manufactur<strong>in</strong>g, agriculture, and<br />
construction <strong>in</strong>dustries.<br />
Most manufactur<strong>in</strong>g jobs used to <strong>of</strong>fer generous wages and benefits, but manufactur<strong>in</strong>g<br />
job quality has decl<strong>in</strong>ed over the years. Nowadays, many <strong>US</strong> manufactur<strong>in</strong>g jobs are<br />
located <strong>in</strong> right-to-work states, where it is nearly impossible for workers to form a union.<br />
This means that<br />
manufactur<strong>in</strong>g employers are<br />
able to pay lower wages and<br />
<strong>of</strong>fer fewer benefits than they<br />
used to.<br />
Demographic Factors<br />
In her book, No Shame <strong>in</strong> My<br />
Game, Kather<strong>in</strong>e Newman<br />
f<strong>in</strong>ds that "[t]he nation's<br />
young, its s<strong>in</strong>gle parents, the<br />
poorly educated, and<br />
m<strong>in</strong>orities are more likely than<br />
other workers to be poor"<br />
(p. 42). <strong>The</strong>se factors, <strong>in</strong><br />
addition to be<strong>in</strong>g part <strong>of</strong> a<br />
large household, be<strong>in</strong>g part <strong>of</strong><br />
a s<strong>in</strong>gle-earner household,<br />
be<strong>in</strong>g female, and hav<strong>in</strong>g a<br />
part-time (<strong>in</strong>stead <strong>of</strong> a fulltime)<br />
job have been found to be important work<strong>in</strong>g poverty "risk factors." Immigrant<br />
workers and self-employed workers are also more likely to be work<strong>in</strong>g poor than other<br />
k<strong>in</strong>ds <strong>of</strong> workers.<br />
<strong>Economic</strong> Factors<br />
<strong>The</strong>re is a widespread assumption that economic growth leads to tighter labor markets<br />
and higher wages. However, the evidence suggests that economic growth does not<br />
always benefit each part <strong>of</strong> the population equally. For example, the 1980s was a period<br />
<strong>of</strong> economic growth and prosperity <strong>in</strong> the United States, but most <strong>of</strong> the economic ga<strong>in</strong>s<br />
were concentrated at the top <strong>of</strong> the <strong>in</strong>come spectrum. This means that people near the<br />
bottom <strong>of</strong> the labor market did not benefit from the economic ga<strong>in</strong>s <strong>of</strong> the 1980s. In fact,<br />
many have argued that low-skilled workers experienced decl<strong>in</strong><strong>in</strong>g prosperity <strong>in</strong> the<br />
1980s. <strong>The</strong>refore, chang<strong>in</strong>g economic conditions do not have as large <strong>of</strong> an impact on<br />
work<strong>in</strong>g poverty rates as one might expect.<br />
Page 55 <strong>of</strong> 289
Labor Market Institutions<br />
Labor markets can be egalitarian, efficient, or somewhere <strong>in</strong> the middle. Accord<strong>in</strong>g to<br />
Brady, Fullerton, and Cross (2010), "[e]fficient labor markets typically feature flexibility,<br />
low unemployment, and higher economic growth, and facilitate the rapid hir<strong>in</strong>g and fir<strong>in</strong>g<br />
<strong>of</strong> workers. Egalitarian labor markets are bolstered by strong labor market <strong>in</strong>stitutions,<br />
higher wages, and greater security" (p562). <strong>The</strong> United States has an efficient labor<br />
market, whereas most European countries have egalitarian labor markets. Each system<br />
has its drawbacks, but the egalitarian labor market model is typically associated with<br />
lower rates <strong>of</strong> work<strong>in</strong>g poverty. One trade<strong>of</strong>f to this is that the "lowest skilled and least<br />
employable" people are sometimes excluded from an egalitarian labor market, and must<br />
<strong>in</strong>stead rely on government aid <strong>in</strong> order to survive (p. 563). If the United States switched<br />
from an efficient to an egalitarian labor market, it might have to <strong>in</strong>crease its welfare state<br />
generosity <strong>in</strong> order to cope with a higher unemployment rate.<br />
Centralized wage barga<strong>in</strong><strong>in</strong>g is a key component <strong>of</strong> egalitarian labor markets. In a<br />
country with centralized wage barga<strong>in</strong><strong>in</strong>g <strong>in</strong>stitutions, wages for entire <strong>in</strong>dustries are<br />
negotiated at the regional or national level. This means that similar workers earn similar<br />
wages, which reduces <strong>in</strong>come <strong>in</strong>equality. Lohmann (2009) f<strong>in</strong>ds that countries with<br />
centralized wage barga<strong>in</strong><strong>in</strong>g <strong>in</strong>stitutions have lower rates <strong>of</strong> "pre-transfer" work<strong>in</strong>g<br />
poverty. <strong>The</strong> "pre-transfer" work<strong>in</strong>g poverty rate is the percentage <strong>of</strong> workers who fall<br />
below the poverty threshold based on their earned wages (not count<strong>in</strong>g government<br />
transfers).<br />
Welfare State Generosity<br />
Cross-national studies are <strong>in</strong> agreement that the most important factor affect<strong>in</strong>g work<strong>in</strong>g<br />
poverty rates is welfare state generosity. A generous welfare state spends a higher<br />
proportion <strong>of</strong> its GDP on th<strong>in</strong>gs like unemployment <strong>in</strong>surance, social security, family<br />
assistance, childcare subsidies, healthcare subsidies, hous<strong>in</strong>g subsidies, transportation<br />
subsidies, and food subsidies. Studies on work<strong>in</strong>g poverty have found that these k<strong>in</strong>ds<br />
<strong>of</strong> government spend<strong>in</strong>g can pull a significant number <strong>of</strong> people out <strong>of</strong> poverty, even if<br />
they earn low wages. Lohmann's 2009 study shows that welfare state generosity has a<br />
significant impact on the "post-transfer" rate <strong>of</strong> work<strong>in</strong>g poverty. <strong>The</strong> "post-transfer" rate<br />
<strong>of</strong> work<strong>in</strong>g poverty is the percentage <strong>of</strong> work<strong>in</strong>g households that fall below the poverty<br />
threshold after government aid has been taken <strong>in</strong>to account.<br />
Different types <strong>of</strong> transfers benefit different k<strong>in</strong>ds <strong>of</strong> low-wage families. Family benefits<br />
will benefit households with children and unemployment benefits will benefit households<br />
that <strong>in</strong>clude workers with significant work experience. Transfers such as old-age<br />
benefits are unlikely to benefit low-wage households unless the elderly are liv<strong>in</strong>g <strong>in</strong> the<br />
same household. Sometimes, even when benefits are available, those who qualify do<br />
not take advantage <strong>of</strong> them. Migrants <strong>in</strong> particular are less likely to take advantage <strong>of</strong><br />
the available benefits.<br />
Obstacles to Uplift<br />
Page 56 <strong>of</strong> 289
<strong>The</strong> work<strong>in</strong>g poor face many <strong>of</strong> the same daily life struggles as the nonwork<strong>in</strong>g poor, but<br />
they also face some unique obstacles. Some studies, many <strong>of</strong> them qualitative, provide<br />
detailed <strong>in</strong>sights <strong>in</strong>to the obstacles that h<strong>in</strong>der workers' ability to f<strong>in</strong>d jobs, keep jobs,<br />
and make ends meet. Some <strong>of</strong> the most common struggles faced by the work<strong>in</strong>g poor<br />
are f<strong>in</strong>d<strong>in</strong>g affordable hous<strong>in</strong>g, arrang<strong>in</strong>g transportation to and from work, buy<strong>in</strong>g basic<br />
necessities, arrang<strong>in</strong>g childcare, hav<strong>in</strong>g unpredictable work schedules, juggl<strong>in</strong>g two or<br />
more jobs, and cop<strong>in</strong>g with low-status work.<br />
Hous<strong>in</strong>g<br />
Work<strong>in</strong>g poor people who do not<br />
have friends or relatives with whom<br />
they can live <strong>of</strong>ten f<strong>in</strong>d themselves<br />
unable to rent an apartment <strong>of</strong> their<br />
own. Although the work<strong>in</strong>g poor are<br />
employed at least some <strong>of</strong> the time,<br />
they <strong>of</strong>ten f<strong>in</strong>d it difficult to save<br />
enough money for a deposit on a<br />
rental property. As a result, many<br />
work<strong>in</strong>g poor people end up <strong>in</strong> liv<strong>in</strong>g<br />
situations that are actually more<br />
costly than a month-to-month rental.<br />
For <strong>in</strong>stance, many work<strong>in</strong>g poor<br />
people, especially those who are <strong>in</strong><br />
some k<strong>in</strong>d <strong>of</strong> transitional phase, rent<br />
rooms <strong>in</strong> week-to-week motels.<br />
<strong>The</strong>se motel rooms tend to cost<br />
much more than a traditional rental, but they are accessible to the work<strong>in</strong>g poor<br />
because they do not require a large deposit. If someone is unable or unwill<strong>in</strong>g to pay for<br />
a room <strong>in</strong> a motel, they might live <strong>in</strong> his/her car, <strong>in</strong> a homeless shelter, or on the street.<br />
This is not a marg<strong>in</strong>al phenomenon; <strong>in</strong> fact, accord<strong>in</strong>g to the 2008 <strong>US</strong> Conference <strong>of</strong><br />
Mayors, one <strong>in</strong> five homeless people are currently employed.<br />
Of course, some work<strong>in</strong>g poor people are able to access hous<strong>in</strong>g subsidies (such as a<br />
Section 8 Hous<strong>in</strong>g Choice Voucher) to help cover their hous<strong>in</strong>g expenses. However,<br />
these hous<strong>in</strong>g subsidies are not available to everyone who meets the Section 8 <strong>in</strong>come<br />
specifications. In fact, less than 25% <strong>of</strong> people who qualify for a hous<strong>in</strong>g subsidy<br />
receive one.<br />
Education<br />
<strong>The</strong> issue with education starts many times with the work<strong>in</strong>g poor from childhood and<br />
follows them <strong>in</strong>to their struggle for a substantial <strong>in</strong>come. Children grow<strong>in</strong>g up <strong>in</strong> families<br />
<strong>of</strong> the work<strong>in</strong>g poor are not provided the same educational opportunities as their middleclass<br />
counterpart. In many cases the low <strong>in</strong>come community is filled with school that are<br />
Page 57 <strong>of</strong> 289
lack<strong>in</strong>g necessities and support needed to form a solid education. This follows students<br />
as they cont<strong>in</strong>ue <strong>in</strong> education. In many cases this h<strong>in</strong>ders the possibility for America's<br />
youth to cont<strong>in</strong>ue on to higher education. <strong>The</strong> grades and credits just are not atta<strong>in</strong>ed <strong>in</strong><br />
many cases, and the lack <strong>of</strong> guidance <strong>in</strong> the schools leaves the children <strong>of</strong> the work<strong>in</strong>g<br />
poor with no degree. Also, the lack <strong>of</strong> funds for cont<strong>in</strong>u<strong>in</strong>g education causes these<br />
children to fall beh<strong>in</strong>d. In many cases, their parents did not cont<strong>in</strong>ue on <strong>in</strong>to higher<br />
education and because <strong>of</strong> this have a difficult time f<strong>in</strong>d<strong>in</strong>g jobs with salaries that can<br />
support a family. Today a college degree is a requirement for many jobs, and it is the<br />
low skill jobs that usually only require a high school degree or GED. <strong>The</strong> <strong>in</strong>equality <strong>in</strong><br />
available education cont<strong>in</strong>ues the vicious cycle <strong>of</strong> families enter<strong>in</strong>g <strong>in</strong>to the work<strong>in</strong>g<br />
poor.<br />
Transportation<br />
Given the fact that many work<strong>in</strong>g poor people do not own a car or cannot afford to drive<br />
their car, where they live can significantly limit where they are able to work, and vice<br />
versa. Given the fact that public transportation <strong>in</strong> many <strong>US</strong> cities is sparse, expensive,<br />
or non-existent, this is a particularly salient obstacle. Some work<strong>in</strong>g poor people are<br />
able to use their social networks—if they have them—to meet their transportation<br />
needs. In a study on low-<strong>in</strong>come s<strong>in</strong>gle mothers, Ed<strong>in</strong> and Le<strong>in</strong> found that s<strong>in</strong>gle<br />
mothers who had someone to drive them to and from work were much more likely to be<br />
able to support themselves without rely<strong>in</strong>g on government aid.<br />
Basic Necessities<br />
Like the unemployed poor, the work<strong>in</strong>g poor struggle to pay for basic necessities like<br />
food, cloth<strong>in</strong>g, hous<strong>in</strong>g, and transportation. In some cases, however, the work<strong>in</strong>g poor's<br />
basic expenses can be higher than the unemployed poor's. For <strong>in</strong>stance, the work<strong>in</strong>g<br />
poor's cloth<strong>in</strong>g expenses may be higher than the unemployed poor's because they must<br />
purchase specific clothes or uniforms for their jobs. Also, because the work<strong>in</strong>g poor are<br />
spend<strong>in</strong>g much <strong>of</strong> their time at work, they may not have the time to prepare their own<br />
food. In this case, they may frequently resort to eat<strong>in</strong>g fast food, which is less healthful<br />
and more expensive than home-prepared food.<br />
Childcare<br />
Work<strong>in</strong>g poor parents with young children, especially s<strong>in</strong>gle parents, face significantly<br />
more childcare-related obstacles than other people. Often, childcare costs can exceed a<br />
low-wage earners' <strong>in</strong>come, mak<strong>in</strong>g work, especially <strong>in</strong> a job with no potential for<br />
advancement, an economically illogical activity. However, some s<strong>in</strong>gle parents are able<br />
to rely on their social networks to provide free or below-market-cost childcare. <strong>The</strong>re are<br />
also some free childcare options provided by the government, such as the Head Start<br />
Program. However, these free options are only available dur<strong>in</strong>g certa<strong>in</strong> hours, which<br />
may limit parents' ability to take jobs that require late-night shifts.<strong>The</strong> U.S. "average"<br />
seems to suggest that for one toddler, <strong>in</strong> full-time day care, on weekdays, the cost is<br />
approximately $600.00 per month. But, that figure can rise to well over $1000.00 per<br />
Page 58 <strong>of</strong> 289
month <strong>in</strong> major metro areas, and fall to less than $350 <strong>in</strong> rural areas.<strong>The</strong> average cost<br />
<strong>of</strong> center-based daycare <strong>in</strong> the United States is $11,666 per year ($972 a month), but<br />
prices range from $3,582 to $18,773 a year ($300 to $1,564 monthly), accord<strong>in</strong>g to the<br />
National Association <strong>of</strong> Child Care Resource & Referral Agencies (NACCRRA).<br />
Work Schedules<br />
Many low-wage jobs force workers to accept irregular schedules. In fact, some<br />
employers will not hire someone unless they have "open availability," which means<br />
be<strong>in</strong>g available to work any time, any day. This makes it difficult for workers to arrange<br />
for childcare and to take on a second job. In addition, work<strong>in</strong>g poor people's work<strong>in</strong>g<br />
hours can fluctuate wildly from one week to the next, mak<strong>in</strong>g it difficult for them to<br />
budget effectively and save up money.<br />
Multiple Jobs<br />
Many low-wage workers have to work multiple jobs <strong>in</strong> order to make ends meet. In<br />
1996, 6.2 percent <strong>of</strong> the workforce held two or more full- or part-time jobs. Most <strong>of</strong> these<br />
people held two part-time jobs or one part-time job and one full-time job, but 4% <strong>of</strong> men<br />
and 2% <strong>of</strong> women held two full-time jobs at the same time. This can be physically<br />
exhaust<strong>in</strong>g and can <strong>of</strong>ten lead to short and long-term health problems.<br />
Low-Status Work<br />
Many low-wage service sector jobs require a great deal <strong>of</strong> customer service work.<br />
Although not all customer service jobs are low-wage or low-status, many <strong>of</strong> them are.<br />
Page 59 <strong>of</strong> 289
Some argue that the low status nature <strong>of</strong> some jobs can have negative psychological<br />
effects on workers, but others argue that low status workers come up with cop<strong>in</strong>g<br />
mechanisms that allow them to ma<strong>in</strong>ta<strong>in</strong> a strong sense <strong>of</strong> self-worth. One <strong>of</strong> these<br />
cop<strong>in</strong>g mechanisms is called boundary work. Boundary work happens when one group<br />
<strong>of</strong> people valorize their own social position by compar<strong>in</strong>g themselves to another group,<br />
who they perceive to be <strong>in</strong>ferior <strong>in</strong> some way. For example, Newman (1999) found that<br />
fast food workers <strong>in</strong> New York City cope with the low-status nature <strong>of</strong> their job by<br />
compar<strong>in</strong>g themselves to the unemployed, who they perceive to be even lower-status<br />
than themselves. Thus, although the low-status nature <strong>of</strong> work<strong>in</strong>g poor people's jobs<br />
may have some negative psychological effects, some, but probably not all, <strong>of</strong> these<br />
negative effects can be counteracted through cop<strong>in</strong>g mechanisms such as boundary<br />
work.<br />
Anti-Poverty Policies<br />
Scholars, policymakers, and others have come up with a variety <strong>of</strong> proposals for how to<br />
reduce or elim<strong>in</strong>ate work<strong>in</strong>g poverty. Most <strong>of</strong> these proposals are directed toward the<br />
United States, but they might also be relevant to other countries. <strong>The</strong> rema<strong>in</strong>der <strong>of</strong> the<br />
section outl<strong>in</strong>es the pros and cons <strong>of</strong> some <strong>of</strong> the most commonly proposed solutions.<br />
Welfare State Generosity<br />
Cross-national studies like Lohmann (2009) and Brady, Fullerton, and Cross (2010)<br />
clearly show that countries with generous welfare states have lower levels <strong>of</strong> work<strong>in</strong>g<br />
poverty than countries with less-generous welfare states, even when factors like<br />
demography, economic performance, and labor market <strong>in</strong>stitutions are taken <strong>in</strong>to<br />
account. Hav<strong>in</strong>g a generous welfare state does two key th<strong>in</strong>gs to reduce work<strong>in</strong>g<br />
poverty: it raises the m<strong>in</strong>imum level <strong>of</strong> wages that people are will<strong>in</strong>g to accept, and it<br />
pulls a large portion <strong>of</strong> low-wage workers out <strong>of</strong> poverty by provid<strong>in</strong>g them with an array<br />
<strong>of</strong> cash and non-cash government benefits. Many th<strong>in</strong>k that <strong>in</strong>creas<strong>in</strong>g the United<br />
States' welfare state generosity would lower the work<strong>in</strong>g poverty rate. A common<br />
critique <strong>of</strong> this proposal is that a generous welfare state would not work because it<br />
would stagnate the economy, raise unemployment, and degrade people's work ethic.<br />
However, as <strong>of</strong> 2011, most European countries have a lower unemployment rate than<br />
the <strong>US</strong>. Furthermore, although Western European economies' growth rates can be<br />
lower than the <strong>US</strong>'s from time to time, their growth rates tend to be more stable,<br />
whereas the <strong>US</strong>'s tends to fluctuate relatively severely. Individual states <strong>of</strong>fer f<strong>in</strong>ancial<br />
assistance for child care, but the aid varies widely. Most assistance is adm<strong>in</strong>istered<br />
through the Child Care and Development Block Grants. Check here to f<strong>in</strong>d the contact<br />
<strong>in</strong>formation for your state. Many subsidies have strict <strong>in</strong>come guidel<strong>in</strong>es and are<br />
generally for families with children under 13 (the age limit is <strong>of</strong>ten extended if the child<br />
has a disability). Many subsidies permit home-based care, but some only accept a day<br />
care center, so check the requirements. If you need to use an authorized provider, ask if<br />
they will put you <strong>in</strong> touch with an agency that can help you f<strong>in</strong>d one.<br />
Page 60 <strong>of</strong> 289
Some states distribute funds through social or health departments or agencies (like this<br />
one <strong>in</strong> Wash<strong>in</strong>gton State). For example, the Children's Cab<strong>in</strong>et <strong>in</strong> Nevada can refer<br />
families to providers, help them apply for subsidies and can even help families who<br />
want to pay a relative for care. North Carol<strong>in</strong>a's Smart Start is a public/private<br />
partnership that <strong>of</strong>fers fund<strong>in</strong>g for child care. Check the National Women's Law Center<br />
for each state's child care assistance policy.<br />
Wages and Benefits<br />
In the conclusion <strong>of</strong> her book, Nickel and Dimed (2001), Barbara Ehrenreich argues that<br />
Americans need to pressure employers to improve worker compensation. Generally<br />
speak<strong>in</strong>g, this implies a need to strengthen the labor movement. Interest<strong>in</strong>gly, crossnational<br />
statistical studies on work<strong>in</strong>g poverty suggest that generous welfare states<br />
have a larger impact on work<strong>in</strong>g poverty than strong labor movements. <strong>The</strong> labor<br />
movements <strong>in</strong> various countries have accomplished this through political parties <strong>of</strong> their<br />
own (labor parties) or strategic alliances with non-labor parties, for <strong>in</strong>stance, when<br />
striv<strong>in</strong>g to put a mean<strong>in</strong>gful m<strong>in</strong>imum wage <strong>in</strong> place. <strong>The</strong> federal government <strong>of</strong>fers a<br />
Flexible Spend<strong>in</strong>g Account (FSA) that's adm<strong>in</strong>istered through workplaces.<br />
If your job <strong>of</strong>fers an FSA (also known as a Dependent Care Account), you can put aside<br />
up to $5,000 <strong>in</strong> per-tax dollars to pay for child care expenses. If both you and your<br />
Page 61 <strong>of</strong> 289
spouse have an FSA, the family limit is $5,000—but you could get as much as $2,000 <strong>in</strong><br />
tax sav<strong>in</strong>gs if your comb<strong>in</strong>ed contributions reach the maximum.<br />
Education and Tra<strong>in</strong><strong>in</strong>g<br />
Some argue that more vocational tra<strong>in</strong><strong>in</strong>g and active labour market policies, especially<br />
<strong>in</strong> growth <strong>in</strong>dustries like healthcare and renewable energy, is the solution to work<strong>in</strong>g<br />
poverty. To be sure, wider availability <strong>of</strong> vocational tra<strong>in</strong><strong>in</strong>g could pull some people out<br />
<strong>of</strong> work<strong>in</strong>g poverty, but the fact rema<strong>in</strong>s that the low-wage service sector is a rapidly<br />
grow<strong>in</strong>g part <strong>of</strong> the <strong>US</strong> economy. Even if more nurs<strong>in</strong>g and clean energy jobs were<br />
added to the economy, there would still be a huge portion <strong>of</strong> the workforce <strong>in</strong> low-wage<br />
service sector jobs like retail, food service, and clean<strong>in</strong>g. <strong>The</strong>refore, it seems clear that<br />
any significant reduction <strong>in</strong> the work<strong>in</strong>g poverty rate will have to come from <strong>of</strong>fer<strong>in</strong>g<br />
higher wages and more benefits to the current, and future, population <strong>of</strong> service sector<br />
workers.<br />
Child Support Assurance<br />
Given the fact that such a large proportion <strong>of</strong> work<strong>in</strong>g poor households are headed by a<br />
s<strong>in</strong>gle mother, one clear way to reduce work<strong>in</strong>g poverty would be to make sure that<br />
children's fathers share the cost <strong>of</strong> child rear<strong>in</strong>g. In cases where the father cannot<br />
provide child support, scholars like Irw<strong>in</strong> Garf<strong>in</strong>kel advocate for the implementation <strong>of</strong> a<br />
child support guarantee, whereby the government pays childcare costs if the father<br />
cannot. Child support is not always a guarantee if the father or mother does not work.<br />
For example, if the parent without custody is not work<strong>in</strong>g then the parent with custody<br />
does not receive any child support unless the non work<strong>in</strong>g parent is employed at their<br />
job longer than 90 days, exclud<strong>in</strong>g if the non beg<strong>in</strong>s to work for its a city or government.<br />
Also, the government does not pay for childcare cost if you make more than the cut <strong>of</strong>f<br />
range (your gross, per county or state.)<br />
Marriage<br />
Households with two wage-earners have a significantly lower rate <strong>of</strong> work<strong>in</strong>g poverty<br />
than households with only one wage-earner. Also, households with two adults, but only<br />
one wage-earner, have lower work<strong>in</strong>g poverty rates than households with only one<br />
adult. <strong>The</strong>refore, it seems clear that hav<strong>in</strong>g two adults <strong>in</strong> a household, especially if there<br />
are children present, is more likely to keep a household out <strong>of</strong> poverty than hav<strong>in</strong>g just<br />
one adult <strong>in</strong> a household. Many scholars and policymakers have used this fact to argue<br />
that encourag<strong>in</strong>g people to get married and stay married is an effective way to reduce<br />
work<strong>in</strong>g poverty (and poverty <strong>in</strong> general). However, this is easier said than done.<br />
Research has shown that low-<strong>in</strong>come people marry less <strong>of</strong>ten than higher-<strong>in</strong>come<br />
people because they have a more difficult time f<strong>in</strong>d<strong>in</strong>g a partner who is employed, which<br />
is <strong>of</strong>ten seen as a prerequisite for marriage. <strong>The</strong>refore, unless the employment<br />
Page 62 <strong>of</strong> 289
opportunity structure is improved, simply <strong>in</strong>creas<strong>in</strong>g the number <strong>of</strong> marriages among<br />
low-<strong>in</strong>come people would be unlikely to lower work<strong>in</strong>g poverty rates.<br />
Ultimately, effective solutions to work<strong>in</strong>g poverty are multifaceted. Each <strong>of</strong> the<br />
aforementioned proposals could help reduce work<strong>in</strong>g poverty <strong>in</strong> the United States, but<br />
they might have a greater impact if at least a few <strong>of</strong> them were pursued simultaneously.<br />
________<br />
5 Myths About <strong>The</strong> Work<strong>in</strong>g Poor In America<br />
September 7, 2016 Posted by Mary Babic<br />
While many <strong>of</strong> us enjoyed a day <strong>of</strong> rest at the tail end <strong>of</strong> a steamy summer, a whole lot<br />
<strong>of</strong> people rolled out <strong>of</strong> bed and headed <strong>in</strong>to work on Labor Day. Of course, they’re the<br />
ones most <strong>in</strong> need <strong>of</strong> a day <strong>of</strong>f.<br />
Work<strong>in</strong>g full-time can be tir<strong>in</strong>g. Work<strong>in</strong>g full-time at many low-wage jobs can be<br />
exhaust<strong>in</strong>g, and stressful. Surviv<strong>in</strong>g on low wages <strong>in</strong> the <strong>US</strong> requires strength and<br />
stam<strong>in</strong>a, perfect health, and some serious penny p<strong>in</strong>ch<strong>in</strong>g.<br />
Page 63 <strong>of</strong> 289
It’s time to bust some myths and pay these workers the wages, and respect, they<br />
deserve. <strong>The</strong>n check out our map and report for more <strong>in</strong>fo on An agenda to give<br />
America’s work<strong>in</strong>g poor a raise.<br />
Myth #1: Most workers <strong>in</strong> low-wage jobs are young or start<strong>in</strong>g out at the entry<br />
level.<br />
If you def<strong>in</strong>e a “low” wage as under $15 per hour, you’re referr<strong>in</strong>g to almost half the<br />
workforce <strong>in</strong> the <strong>US</strong>.<br />
Today 73 percent <strong>of</strong> workers earn<strong>in</strong>g under $15 per hour nationwide are older than 25.<br />
Overall, 58 million workers (44 percent) earn under $15 an hour; 42 million earn under<br />
$12 an hour. Many are parents <strong>of</strong> young children. Over 125 million people, <strong>in</strong>clud<strong>in</strong>g<br />
over 31.5 million children, live <strong>in</strong> households with at least one worker earn<strong>in</strong>g under $15<br />
an hour. That’s more than 42 percent <strong>of</strong> the children <strong>in</strong> the <strong>US</strong>. Roughly one third <strong>of</strong><br />
parents earn<strong>in</strong>g low wages are s<strong>in</strong>gle parents.<br />
While some workers may f<strong>in</strong>d ladders out <strong>of</strong> low-wage jobs, millions stay <strong>in</strong> these jobs<br />
for their work<strong>in</strong>g lives. For example, the median age <strong>of</strong> the more than 1.4 million home<br />
care aides <strong>in</strong> the <strong>US</strong> is 45; nearly half graduated high school and have had some<br />
college education; the majority work full-time. However, with a median wage <strong>of</strong> $10.25<br />
an hour, 54 percent live near poverty. This is one <strong>of</strong> the fastest-grow<strong>in</strong>g occupations <strong>in</strong><br />
the <strong>US</strong>, projected to <strong>in</strong>crease by 26 percent <strong>in</strong> the next ten years.<br />
For decades, <strong>US</strong> workers have faced wage stagnation and a federal m<strong>in</strong>imum wage<br />
that has not budged s<strong>in</strong>ce Congress last raised it <strong>in</strong> 2009 certa<strong>in</strong>ly has not helped. For<br />
seven years, it’s been stuck at $7.25 an hour: $290 a week, $15,000 a year. In that<br />
time, the cost <strong>of</strong> groceries has <strong>in</strong>creased 25 percent; rent has <strong>in</strong>creased over 50<br />
percent.<br />
Myth #2: Most employers provide workers with earned sick time after a certa<strong>in</strong><br />
tenure on the job.<br />
Not only is this not true, <strong>in</strong> a cruel twist <strong>of</strong> fate, it has a disproportionate effect on those<br />
who can least afford it. In the private sector, well-paid workers are much more likely to<br />
enjoy paid sick leave than low-wage workers: 80 percent <strong>of</strong> high-wage workers have<br />
sick time vs. 15 percent <strong>of</strong> low-wage workers.<br />
<strong>The</strong> <strong>US</strong> is unique among developed nations <strong>in</strong> not requir<strong>in</strong>g employers to provide sick<br />
days. In fact, the law does not even protect workers from be<strong>in</strong>g fired if they miss work<br />
due to illness. In a recent Oxfam survey, one <strong>in</strong> seven low-wage women workers<br />
reported hav<strong>in</strong>g lost a job as a result <strong>of</strong> tak<strong>in</strong>g a sick day.<br />
This leaves low-wage workers g<strong>in</strong>gerly walk<strong>in</strong>g a tightrope over a vertig<strong>in</strong>ous drop, <strong>of</strong>ten<br />
hold<strong>in</strong>g hands with young children and ag<strong>in</strong>g parents, pray<strong>in</strong>g that no one will catch a<br />
cold, contract the flu, break a bone, or get a stomach bug. Any hitch, and they could all<br />
Page 64 <strong>of</strong> 289
e fall<strong>in</strong>g toward economic catastrophe: days or weeks without pay can mean miss<strong>in</strong>g<br />
rent, skimp<strong>in</strong>g on groceries, turn<strong>in</strong>g <strong>of</strong>f the heat.<br />
Myth #3: <strong>The</strong> low-wage workforce cuts across all populations: race, gender, age<br />
While this has an element <strong>of</strong> truth, the core reality is that women and people <strong>of</strong> color do<br />
more than their fair share <strong>of</strong> low-wage work.<br />
<strong>The</strong> majority <strong>of</strong> low-wage workers are white, but black and Hispanic workers are far<br />
more likely to be <strong>in</strong> low-wage jobs. More than half (53 percent) <strong>of</strong> black workers and 60<br />
percent <strong>of</strong> Hispanic workers earn under $15 an hour. In some states, the numbers are<br />
stagger<strong>in</strong>g: <strong>in</strong> North Carol<strong>in</strong>a, three quarters <strong>of</strong> Hispanic workers earn under $15 an<br />
hour.<br />
Despite women represent<strong>in</strong>g less than half <strong>of</strong> the workforce (49 percent), they are well<br />
over half (nearly 55 percent) <strong>of</strong> those earn<strong>in</strong>g under $12 an hour. Many low-wage<br />
occupations (childcare workers, cashiers) are dom<strong>in</strong>ated by women. Even <strong>in</strong> other<br />
occupations, however, women earn less per hour than do men.<br />
F<strong>in</strong>ally, black and Hispanic women earn the lowest median wages per hour <strong>of</strong> any<br />
group. Hispanic women earn slightly more than half <strong>of</strong> what white men earn, roughly 54<br />
cents to the dollar; black women make 64 cents to the dollar.<br />
Page 65 <strong>of</strong> 289
Myth #4: Work<strong>in</strong>g longer and harder will pay <strong>of</strong>f.<br />
After years <strong>of</strong> hard work and long hours, some workers start the climb up the ladder to<br />
better jobs. <strong>The</strong>y may become managers <strong>of</strong> the fast food franchise, or shift supervisors<br />
on the l<strong>in</strong>e <strong>in</strong> a plant. <strong>The</strong>y may shift from hourly to salaried, and enjoy an <strong>in</strong>crease <strong>in</strong><br />
benefits and flexibility.<br />
Or not. <strong>The</strong>y may f<strong>in</strong>d they’re work<strong>in</strong>g longer hours and see<strong>in</strong>g their pay actually shr<strong>in</strong>k<br />
per hour. Until the Obama adm<strong>in</strong>istration recently raised the threshold for overtime pay,<br />
the cap had been stuck at $23,600 s<strong>in</strong>ce 1975. Any salaried worker mak<strong>in</strong>g more than<br />
that would not be compensated at “time and a half” for hours worked beyond 40 per<br />
week. This <strong>in</strong>cluded about 92 percent <strong>of</strong> the salaried workforce – and clearly brought<br />
many more benefits to employers than modestly paid employees.<br />
In May, the threshold was raised to $47,476, which impacts 12.5 million workers,<br />
especially women and people <strong>of</strong> color. Still, some <strong>in</strong> Congress are threaten<strong>in</strong>g to block<br />
implementation <strong>of</strong> the updated rule.<br />
Myth #5: Most jobs pay a liv<strong>in</strong>g wage.<br />
Of the top ten occupations <strong>in</strong> the <strong>US</strong> <strong>in</strong> 2015, only two pay a median wage <strong>of</strong> over<br />
$15.25 an hour: registered nurses and secretaries. <strong>The</strong> top three are retail sales at<br />
$10.47, cashiers at $9.82, and food preparation and serv<strong>in</strong>g at $9.09.<br />
Nationwide, more than 11 million people <strong>in</strong> these occupations alone (mostly women)<br />
scramble to susta<strong>in</strong> families on wages that <strong>of</strong>ten fall well below the <strong>of</strong>ficial federal<br />
poverty guidel<strong>in</strong>es.<br />
Many <strong>of</strong> them f<strong>in</strong>d they simply cannot survive on these wages, and turn to government<br />
programs and private charities for help. A recent study from the <strong>Economic</strong> Policy<br />
Institute estimates that 41 million workers tap public assistance programs such as food<br />
stamps, hous<strong>in</strong>g subsidies, and cash assistance. Overall, it mounts up to over $200<br />
billion a year <strong>in</strong> taxpayer dollars.<br />
________<br />
Here’s <strong>The</strong> Pa<strong>in</strong>ful Truth About What It Means To Be<br />
‘Work<strong>in</strong>g Poor’ In America<br />
By Nick W<strong>in</strong>g and Carly Schwartz<br />
05/19/2014 08:23 am ET Updated Dec 06, 2017<br />
In a nation that has long operated on the pr<strong>in</strong>ciple that an “American Dream” is available<br />
to anyone will<strong>in</strong>g to try hard enough, the term “work<strong>in</strong>g poor” may seem to have a bright<br />
Page 66 <strong>of</strong> 289
side. Sure, these <strong>in</strong>dividuals struggle f<strong>in</strong>ancially, but they have jobs — the first and most<br />
essential step toward lift<strong>in</strong>g oneself out <strong>of</strong> poverty, right?<br />
If only it were that simple.<br />
Accord<strong>in</strong>g to 2012 Census data, more than 7 percent <strong>of</strong> American workers fell below the<br />
federal poverty l<strong>in</strong>e, mak<strong>in</strong>g less than $11,170 for a s<strong>in</strong>gle person and $15,130 for a<br />
couple. By some estimates, one <strong>in</strong> four private-sector jobs <strong>in</strong> the U.S. pays under $10<br />
an hour. Last month, Senate Republicans blocked a bill that would have raised the<br />
federal m<strong>in</strong>imum wage from $7.25 to $10.10 an hour, despite overwhelm<strong>in</strong>g public<br />
support for the measure.<br />
And these numbers don’t say anyth<strong>in</strong>g about the many Americans who earn well above<br />
the <strong>of</strong>ficial poverty l<strong>in</strong>e and still barely stay afloat. In HuffPost’s “All Work, No Pay”<br />
series, the work<strong>in</strong>g poor told their own stories, pa<strong>in</strong>t<strong>in</strong>g a devastat<strong>in</strong>g portrait <strong>of</strong> their<br />
day-to-day struggles.<br />
<strong>The</strong>y’re a diverse range <strong>of</strong> people: s<strong>in</strong>gle parents, couples with and without children,<br />
young women with graduate degrees, bus<strong>in</strong>ess owners, seniors and everyone <strong>in</strong><br />
between. <strong>The</strong>ir f<strong>in</strong>ancial situations, however, show many similarities. Jobs generally<br />
provide them with the means to barely scrape by, tread<strong>in</strong>g paycheck-to-paycheck,<br />
earn<strong>in</strong>g just enough to keep from go<strong>in</strong>g under, swallow<strong>in</strong>g their pride sometimes to take<br />
food stamps or visit food banks. Others are entirely out <strong>of</strong> work, tirelessly seek<strong>in</strong>g<br />
employment and rely<strong>in</strong>g on other means to survive.<br />
Page 67 <strong>of</strong> 289
Through their words, we see what it’s really like to be “work<strong>in</strong>g poor” <strong>in</strong> America — and<br />
just how much more it looks like rock bottom than most would imag<strong>in</strong>e.<br />
Be<strong>in</strong>g work<strong>in</strong>g poor means toil<strong>in</strong>g through “pure hell” for next to noth<strong>in</strong>g.<br />
Earlier this year, 55-year-old Glenn Johnson was mak<strong>in</strong>g about $14,000 a year — or<br />
$7.93 an hour — at a Miami-area Burger K<strong>in</strong>g. He’d been <strong>in</strong> and out <strong>of</strong> the fast food<br />
<strong>in</strong>dustry for more than 30 years. Recently he watched as his employer reported a 37<br />
percent <strong>in</strong>crease <strong>in</strong> its quarterly pr<strong>of</strong>it, while cont<strong>in</strong>u<strong>in</strong>g to resist a m<strong>in</strong>imum wage<br />
<strong>in</strong>crease that workers like Johnson have been fight<strong>in</strong>g for.<br />
Johnson described his daily rout<strong>in</strong>e as “pure hell.” It’s a nonstop effort to keep the store<br />
clean and the customers and his managers — most <strong>of</strong> whom are less than half his age<br />
— happy. “Sometimes, I get home and I’m so tired, I eat d<strong>in</strong>ner, take a shower, lay<br />
down to watch TV, and I’m go<strong>in</strong>g to sleep,” he said. “Next morn<strong>in</strong>g comes. I’m tired,<br />
but I’m try<strong>in</strong>g to make it.”<br />
And yet still wish<strong>in</strong>g you could work more.<br />
While Johnson was far from enthusiastic about his work at Burger K<strong>in</strong>g, with no<br />
computer and few immediate prospects <strong>of</strong> another job, he still wished he could clock<br />
more hours. He said he worked about 35 hours a week, but wanted anywhere from 40<br />
to 50, which would make it easier to pay for his $765-a-month rent, gas and any <strong>of</strong> the<br />
th<strong>in</strong>gs he can’t currently afford. S<strong>in</strong>ce Johnson first told his story, his corporate-owned<br />
Burger K<strong>in</strong>g made him full-time and gave him a raise.<br />
Deangelo Belk, a 21-year-old Wendy’s employee mak<strong>in</strong>g $7.50 an hour, also knows the<br />
pa<strong>in</strong> <strong>of</strong> not gett<strong>in</strong>g enough hours to pay for the th<strong>in</strong>gs he wants or to help him save<br />
enough to move out <strong>of</strong> his mother’s house. He works around 10 hours a week and said<br />
that he’s regularly ignored when he asks for more time.<br />
Because you know you’re lucky to have a job, no matter how awful it is.<br />
Vanessa Powell, 29, works full time <strong>in</strong> a Goodwill warehouse <strong>in</strong> Seattle for $9.25 an<br />
hour. She holds a bachelor’s degree <strong>in</strong> English and a master’s <strong>in</strong> bus<strong>in</strong>ess<br />
adm<strong>in</strong>istration. But with her fiancé out <strong>of</strong> work, she’s just grateful to have a job, even<br />
though she occasionally feels it’s “beneath” her. Even with the job, however, it’s<br />
sometimes hard for them to get enough to eat.<br />
“I mean, yeah, it’s dirty work and <strong>of</strong>ten demean<strong>in</strong>g work, but at least it’s work,”<br />
she said. “Even though [my fiancé] only worked part time, it was still someth<strong>in</strong>g. I make<br />
enough to cover rent and electric, but we share a cell phone, which is why it’s k<strong>in</strong>d <strong>of</strong><br />
hard for both <strong>of</strong> us to search for jobs.”<br />
Page 68 <strong>of</strong> 289
But f<strong>in</strong>d<strong>in</strong>g employment can also risk the crucial aid that helps you get by.<br />
Helen Bechtol, 23, is a mother <strong>of</strong> two and a community college student with dreams <strong>of</strong><br />
graduat<strong>in</strong>g from the University <strong>of</strong> North Carol<strong>in</strong>a Wilm<strong>in</strong>gton. To help pay for child care,<br />
she took a second job, which made her <strong>in</strong>eligible for day care assistance.<br />
Ashley Schmidtbauer said her family is “not destitute, but we barely make it month to<br />
month.” She stays at home to raise her kids and has found there aren’t any easy<br />
alternatives. Her husband’s <strong>in</strong>come alone makes the family <strong>in</strong>eligible for day care<br />
assistance. “To be honest, we make roughly $35,000 a year. Somehow, we make over<br />
$10,000 more than their limits allow,” she said. “We are the <strong>in</strong>-betweeners. Not<br />
mak<strong>in</strong>g enough to live ‘comfortably’ — but not ‘poor’ enough to get any<br />
assistance either. We don’t expect handouts. We just want what is best for our<br />
family.”<br />
Be<strong>in</strong>g work<strong>in</strong>g poor means know<strong>in</strong>g it can be expensive just to keep your job.<br />
Joanne Van Vranken, 50, was laid <strong>of</strong>f <strong>in</strong> 2011. After nearly two years <strong>of</strong> unemployment,<br />
she landed a temporary adm<strong>in</strong>istrative assistant position, which requires a 60-mile<br />
round-trip commute every day. Van Vranken’s car is <strong>in</strong> desperate need <strong>of</strong> repair, but<br />
she hasn’t had the money to fix it <strong>in</strong> years. She’s worried her car will die, which could<br />
put her back <strong>in</strong> dire f<strong>in</strong>ancial straits. “And I don’t have the money to buy a new one,” she<br />
said. “But I have to do it, because we need to pay the bills.”<br />
Janet Weatherly, 43, has almost completed her doctoral degree but can’t f<strong>in</strong>d<br />
employment <strong>in</strong> her field. Instead, she’s mak<strong>in</strong>g $11 an hour as a sales associate for a<br />
major retailer. Her job is a 45-m<strong>in</strong>ute drive from her house, and a significant chunk <strong>of</strong><br />
her paycheck goes toward gas money. Weatherly’s parents put her car repairs on their<br />
credit cards. She’d like to f<strong>in</strong>ish her dissertation, but currently can’t afford to get her<br />
documents out <strong>of</strong> a storage unit halfway across the country, much less <strong>in</strong>vest more time<br />
<strong>in</strong> her education.<br />
________<br />
A Pr<strong>of</strong>ile <strong>of</strong> the Work<strong>in</strong>g Poor, 2015<br />
Bureau <strong>of</strong> Labor Statistics – April 2017<br />
In 2015, accord<strong>in</strong>g to the U.S. Census Bureau, about 43.1 million people, or 13.5<br />
percent <strong>of</strong> the nation’s population, lived below the <strong>of</strong>ficial poverty level. (See the<br />
technical notes section for examples <strong>of</strong> poverty levels.) Although the poor were primarily<br />
children and adults who had not participated <strong>in</strong> the labor force dur<strong>in</strong>g the year, 8.6<br />
million <strong>in</strong>dividuals were among the “work<strong>in</strong>g poor” <strong>in</strong> 2015, accord<strong>in</strong>g to data from the<br />
Bureau <strong>of</strong> Labor Statistics; the 8.6 million figure was down from 9.5 million <strong>in</strong> 2014. <strong>The</strong><br />
work<strong>in</strong>g poor are people who spent at least 27 weeks <strong>in</strong> the labor force (that is, work<strong>in</strong>g<br />
or look<strong>in</strong>g for work) but whose <strong>in</strong>comes still fell below the <strong>of</strong>ficial poverty level. In 2015,<br />
the work<strong>in</strong>g-poor rate—the ratio <strong>of</strong> the work<strong>in</strong>g poor to all <strong>in</strong>dividuals <strong>in</strong> the labor force<br />
Page 69 <strong>of</strong> 289
for at least 27 weeks—was 5.6 percent, 0.7 percentage po<strong>in</strong>t lower than the previous<br />
year’s figure.<br />
Follow<strong>in</strong>g are some highlights from the 2015 data:<br />
<br />
<br />
<br />
<br />
<br />
Full-time workers cont<strong>in</strong>ued to be much less likely to be among the work<strong>in</strong>g poor<br />
than were part-time workers. Among persons <strong>in</strong> the labor force for 27 weeks or<br />
more, 3.4 percent <strong>of</strong> those usually employed full time were classified as work<strong>in</strong>g<br />
poor, compared with 14.1 percent <strong>of</strong> part-time workers.<br />
Women were more likely than men to be among the work<strong>in</strong>g poor. In addition,<br />
Blacks and Hispanics cont<strong>in</strong>ued to be more than twice as likely as Whites and<br />
Asians to be among the work<strong>in</strong>g poor.<br />
<strong>The</strong> likelihood <strong>of</strong> be<strong>in</strong>g classified as work<strong>in</strong>g poor dim<strong>in</strong>ishes as workers atta<strong>in</strong><br />
higher levels <strong>of</strong> education. Among those with less than a high school diploma,<br />
16.2 percent <strong>of</strong> those who were <strong>in</strong> the labor force for at least 27 weeks were<br />
classified as work<strong>in</strong>g poor, compared with 1.7 percent <strong>of</strong> college graduates.<br />
Individuals who were employed <strong>in</strong> service occupations cont<strong>in</strong>ued to be more<br />
likely to be among the work<strong>in</strong>g poor than those employed <strong>in</strong> other major<br />
occupational groups.<br />
Among families with at least one member <strong>in</strong> the labor force for 27 weeks or more,<br />
those with children under 18 years old were about 5 times as likely as those<br />
without children to live <strong>in</strong> poverty. Families ma<strong>in</strong>ta<strong>in</strong>ed by women were almost<br />
twice as likely as families ma<strong>in</strong>ta<strong>in</strong>ed by men to be liv<strong>in</strong>g below the poverty level.<br />
Table A. Poverty status <strong>of</strong> people and primary families <strong>in</strong> the labor force for 27 weeks or more,<br />
2007–15 (Numbers <strong>in</strong> thousands)<br />
Characteristic 2007 2008 2009 2010 2011 2012 2013 2014 2015<br />
Total <strong>in</strong> the labor 146,567 147,838 147,902 146,859 147,475 148,735 149,483 150,319 152,230<br />
force 1<br />
In poverty 7,521 8,883 10,391 10,512 10,382 10,612 10,450 9,487 8,560<br />
Work<strong>in</strong>g-poor rate 5.1 6.0 7.0 7.2 7.0 7.1 7.0 6.3 5.6<br />
Unrelated<br />
33,226 32,785 33,798 34,099 33,731 34,810 35,061 35,018 35,953<br />
<strong>in</strong>dividuals<br />
In poverty 2,558 3,275 3,947 3,947 3,621 3,851 4,141 3,395 3,137<br />
Work<strong>in</strong>g-poor rate 7.7 10.0 11.7 11.6 10.7 11.1 11.8 9.7 8.7<br />
Primary families 2 65,158 65,907 65,467 64,931 66,225 66,541 66,462 66,732 67,193<br />
In poverty 4,169 4,538 5,193 5,269 5,469 5,478 5,137 5,108 4,607<br />
Work<strong>in</strong>g-poor rate 6.4 6.9 7.9 8.1 8.3 8.2 7.7 7.7 6.9<br />
1<br />
Includes <strong>in</strong>dividuals <strong>in</strong> families, not shown separately.<br />
2<br />
Primary families with at least one member <strong>in</strong> the labor force for more than half the year.<br />
Source: U.S. Bureau <strong>of</strong> Labor Statistics, Current Population Survey (CPS), Annual Social and <strong>Economic</strong> Supplement<br />
(ASEC).<br />
This report presents data on the relationship between labor force activity and poverty<br />
status <strong>in</strong> 2015 for workers and their families. <strong>The</strong>se data were collected <strong>in</strong> the 2016<br />
Annual Social and <strong>Economic</strong> Supplement to the Current Population Survey. (For a<br />
detailed description <strong>of</strong> the source <strong>of</strong> the data and an explanation <strong>of</strong> the concepts and<br />
def<strong>in</strong>itions used <strong>in</strong> the report, see the technical notes.<br />
Page 70 <strong>of</strong> 289
<strong>The</strong> specific <strong>in</strong>come thresholds used to determ<strong>in</strong>e people’s poverty status vary,<br />
depend<strong>in</strong>g on whether the <strong>in</strong>dividuals are liv<strong>in</strong>g with family members or are liv<strong>in</strong>g alone<br />
or with nonrelatives. For family members, the poverty threshold is determ<strong>in</strong>ed by their<br />
family’s total <strong>in</strong>come; for <strong>in</strong>dividuals not liv<strong>in</strong>g <strong>in</strong> families, their personal <strong>in</strong>come is used<br />
as the determ<strong>in</strong>ant.<br />
Demographic Characteristics<br />
Among those who were <strong>in</strong> the labor force for 27 weeks or more <strong>in</strong> 2015, the number <strong>of</strong><br />
women classified as work<strong>in</strong>g poor (4.5 million) was higher than that <strong>of</strong> men (4.1 million).<br />
<strong>The</strong> work<strong>in</strong>g-poor rate also cont<strong>in</strong>ued to be higher for women (6.3 percent) than for men<br />
(5.0 percent). <strong>The</strong> work<strong>in</strong>g-poor rates for both women and men were down from a year<br />
earlier.<br />
Blacks and Hispanics were more than twice as likely as Whites and Asians to be among<br />
the work<strong>in</strong>g poor. In 2015, the work<strong>in</strong>g-poor rates <strong>of</strong> Blacks and Hispanics were 11.2<br />
percent and 10.1 percent, respectively, compared with 4.8 percent for Whites and 4.1<br />
percent for Asians.<br />
Page 71 <strong>of</strong> 289
Among Whites and Blacks, the work<strong>in</strong>g-poor rate was higher for women than for men.<br />
<strong>The</strong> rates for White women and White men who spent at least 27 weeks <strong>in</strong> the labor<br />
force were 5.2 percent and 4.4 percent, respectively. <strong>The</strong> rate for Black women was<br />
13.3 percent, compared with 8.8 percent for Black men. Among Asians and Hispanics,<br />
the rates for women and men were little different from each other.<br />
Young workers are more likely to be poor than are workers <strong>in</strong> older age groups, <strong>in</strong> part<br />
because earn<strong>in</strong>gs are lower for young workers and the unemployment rate for young<br />
workers is higher. Among youths who were <strong>in</strong> the labor force for 27 weeks or more, 10.8<br />
percent <strong>of</strong> 16- to 19-year-olds and 12.2 percent <strong>of</strong> 20- to 24-year-olds were liv<strong>in</strong>g <strong>in</strong><br />
poverty <strong>in</strong> 2015. Those rates were considerably higher than the rates for workers ages<br />
25 to 34 (6.6 percent) and 35 to 44 (6.4 percent). Workers ages 45 to 54, 55 to 64, and<br />
65 and older had lower work<strong>in</strong>g-poor rates—3.7 percent, 3.4 percent, and 1.6 percent,<br />
respectively—than did the younger age groups.<br />
Educational Atta<strong>in</strong>ment<br />
Achiev<strong>in</strong>g higher levels <strong>of</strong> education reduces the <strong>in</strong>cidence <strong>of</strong> liv<strong>in</strong>g <strong>in</strong> poverty.<br />
Individuals who complete more years <strong>of</strong> education usually have greater access to<br />
Page 72 <strong>of</strong> 289
higher pay<strong>in</strong>g jobs—such as management, pr<strong>of</strong>essional, and related occupations—than<br />
those with fewer years <strong>of</strong> education. Of all the people <strong>in</strong> the labor force for 27 weeks or<br />
more <strong>in</strong> 2015, those with less than a high school diploma had a higher work<strong>in</strong>g-poor<br />
rate (16.2 percent) than did high school graduates with no college (7.6 percent).<br />
Workers with an associate’s degree and those with a bachelor’s degree or higher had<br />
the lowest work<strong>in</strong>g-poor rates (3.8 percent and 1.7 percent, respectively). In 2015, at all<br />
levels <strong>of</strong> educational atta<strong>in</strong>ment, except for bachelor’s degree or higher, women were<br />
more likely than men to be among the work<strong>in</strong>g poor. (Among those with a bachelor’s<br />
degree or higher, men and women were equally likely to be classified as work<strong>in</strong>g poor.)<br />
Blacks and Hispanics generally were more likely to be among the work<strong>in</strong>g poor than<br />
were Whites and Asians with the same educational atta<strong>in</strong>ment.<br />
Occupation<br />
<strong>The</strong> likelihood <strong>of</strong> be<strong>in</strong>g among the<br />
work<strong>in</strong>g poor varies widely by<br />
occupation. Workers <strong>in</strong> occupations<br />
requir<strong>in</strong>g higher education and<br />
characterized by relatively high<br />
earn<strong>in</strong>gs—such as management,<br />
pr<strong>of</strong>essional, and related occupations—<br />
were least likely to be classified as<br />
work<strong>in</strong>g poor. For example, 1.8 percent<br />
<strong>of</strong> those <strong>in</strong> management, pr<strong>of</strong>essional,<br />
and related occupations were among the work<strong>in</strong>g poor <strong>in</strong> 2015. By contrast, <strong>in</strong>dividuals<br />
employed <strong>in</strong> occupations that typically do not require high levels <strong>of</strong> education and that<br />
are characterized by relatively low earn<strong>in</strong>gs were more likely to be among the work<strong>in</strong>g<br />
poor. For <strong>in</strong>stance, 11.6 percent <strong>of</strong> service workers who were <strong>in</strong> the labor force for at<br />
least 27 weeks were classified as work<strong>in</strong>g poor <strong>in</strong> 2015. Indeed, service occupations,<br />
with 3.0 million work<strong>in</strong>g poor, accounted for 38 percent <strong>of</strong> all those classified as work<strong>in</strong>g<br />
poor. Among those employed <strong>in</strong> natural resources, construction, and ma<strong>in</strong>tenance<br />
occupations, 6.9 percent were classified as work<strong>in</strong>g poor. With<strong>in</strong> this occupation group,<br />
14.1 percent <strong>of</strong> workers <strong>in</strong> farm<strong>in</strong>g, fish<strong>in</strong>g, and forestry occupations were among the<br />
work<strong>in</strong>g poor.<br />
Families<br />
In 2015, 4.6 million families were liv<strong>in</strong>g below the poverty level despite hav<strong>in</strong>g at least<br />
one member <strong>in</strong> the labor force for half the year or more. This figure was down from 5.1<br />
million <strong>in</strong> 2014. Among families with only one member <strong>in</strong> the labor force for at least 27<br />
weeks <strong>in</strong> 2015, married-couple families had a lower likelihood <strong>of</strong> liv<strong>in</strong>g below the poverty<br />
level (8.5 percent) than did families ma<strong>in</strong>ta<strong>in</strong>ed by women (23.9 percent) or by men<br />
(14.0 percent).<br />
Among families with at least one member <strong>in</strong> the labor force for more than half the year,<br />
those with children <strong>in</strong> the household were much more likely to live below the poverty<br />
Page 73 <strong>of</strong> 289
level than those without children. <strong>The</strong> proportion <strong>of</strong> families with children under age 18<br />
that lived <strong>in</strong> poverty was 11.1 percent, compared with 2.2 percent for families without<br />
children. Among families with children under 18, the work<strong>in</strong>g-poor rate for those<br />
ma<strong>in</strong>ta<strong>in</strong>ed by women (24.8 percent) was higher than that for those ma<strong>in</strong>ta<strong>in</strong>ed by men<br />
(15.3 percent). Married-couple families with children under 18 had a work<strong>in</strong>g-poor rate<br />
<strong>of</strong> 6.2 percent <strong>in</strong> 2015.<br />
Unrelated <strong>in</strong>dividuals<br />
<strong>The</strong> “unrelated <strong>in</strong>dividuals” category <strong>in</strong>cludes <strong>in</strong>dividuals who live by themselves or with<br />
others not related to them. Of the 36.0 million unrelated <strong>in</strong>dividuals who were <strong>in</strong> the<br />
labor force for half the year or longer, 3.1 million lived below the poverty level <strong>in</strong> 2015,<br />
down from 3.4 million a year earlier. <strong>The</strong> work<strong>in</strong>g-poor rate for unrelated <strong>in</strong>dividuals was<br />
8.7 percent, a decrease <strong>of</strong> 1.0 percentage po<strong>in</strong>t from the previous year’s figure.<br />
With<strong>in</strong> the group <strong>of</strong> unrelated <strong>in</strong>dividuals, teenagers cont<strong>in</strong>ued to be the most likely to<br />
be among the work<strong>in</strong>g poor. In 2015, 46.3 percent <strong>of</strong> teens who were <strong>in</strong> the labor force<br />
for 27 weeks or more and who lived on their own or with others not related to them lived<br />
below the poverty level. Overall, the work<strong>in</strong>g-poor rate for men liv<strong>in</strong>g alone or with<br />
nonrelatives was 8.2 percent, and the rate for women was 9.3 percent. <strong>The</strong> work<strong>in</strong>gpoor<br />
rates for unrelated <strong>in</strong>dividuals were 13.9 percent for Blacks, 10.7 percent for<br />
Hispanics, 8.2 percent for Asians, and 7.7 percent for Whites.<br />
Of the 3.1 million unrelated <strong>in</strong>dividuals considered to be among the work<strong>in</strong>g poor <strong>in</strong><br />
2015, about 3 out <strong>of</strong> 5 lived with others. <strong>The</strong>se <strong>in</strong>dividuals had a much higher work<strong>in</strong>gpoor<br />
rate than <strong>in</strong>dividuals who lived alone. Many unrelated <strong>in</strong>dividuals liv<strong>in</strong>g below the<br />
poverty level may live with others out <strong>of</strong> necessity. By contrast, many <strong>of</strong> those who live<br />
alone do so because they have sufficient <strong>in</strong>come to support themselves. Unrelated<br />
<strong>in</strong>dividuals’ poverty status, however, is determ<strong>in</strong>ed by each person’s resources. <strong>The</strong><br />
pool<strong>in</strong>g <strong>of</strong> resources and shar<strong>in</strong>g <strong>of</strong> liv<strong>in</strong>g expenses may permit some <strong>in</strong>dividuals <strong>in</strong> this<br />
category—who are technically classified as poor—to live at a higher standard than they<br />
would have if they lived alone.<br />
Labor Market Problems<br />
As noted earlier, people who usually work full time are less likely to live <strong>in</strong> poverty than<br />
are those who work part time, yet there rema<strong>in</strong>s a sizable group <strong>of</strong> full-time workers who<br />
live below the poverty threshold. Among those who participated <strong>in</strong> the labor force for 27<br />
weeks or more and usually worked <strong>in</strong> full-time wage and salary jobs, 3.8 million, or 3.2<br />
percent, were classified as work<strong>in</strong>g poor <strong>in</strong> 2015—down from 4.4 million a year earlier.<br />
<strong>The</strong>re are three major labor market problems that can h<strong>in</strong>der a worker’s ability to earn<br />
an <strong>in</strong>come that is above the poverty threshold: low earn<strong>in</strong>gs, periods <strong>of</strong> unemployment,<br />
and <strong>in</strong>voluntary part-time employment.<br />
In 2015, 82 percent <strong>of</strong> the work<strong>in</strong>g poor who usually work full time experienced at least<br />
one <strong>of</strong> the major labor market problems. Low earn<strong>in</strong>gs cont<strong>in</strong>ued to be the most<br />
Page 74 <strong>of</strong> 289
common problem, with 68 percent subject to low earn<strong>in</strong>gs, either as the only problem or<br />
<strong>in</strong> comb<strong>in</strong>ation with other labor market problems. About 31 percent experienced<br />
unemployment as the ma<strong>in</strong> labor market problem or <strong>in</strong> conjunction with other problems.<br />
Four percent <strong>of</strong> the work<strong>in</strong>g poor experience all three problems: low earn<strong>in</strong>gs,<br />
unemployment, and <strong>in</strong>voluntary part-time employment.<br />
Some 685,000, or 18 percent, <strong>of</strong> the work<strong>in</strong>g poor who usually worked full time did not<br />
experience any <strong>of</strong> the three primary labor market problems <strong>in</strong> 2015. <strong>The</strong>ir classification<br />
as work<strong>in</strong>g poor may be expla<strong>in</strong>ed by other factors, <strong>in</strong>clud<strong>in</strong>g short-term employment,<br />
some weeks <strong>of</strong> voluntary part-time work, or a family structure that <strong>in</strong>creases the risk <strong>of</strong><br />
poverty.<br />
********<br />
Concepts and Def<strong>in</strong>itions<br />
Poverty classification. Poverty statistics presented <strong>in</strong> this report are based on def<strong>in</strong>itions<br />
developed by the Social Security Adm<strong>in</strong>istration <strong>in</strong> 1964 and revised by federal<br />
<strong>in</strong>teragency committees <strong>in</strong> 1969 and 1981. <strong>The</strong>se def<strong>in</strong>itions orig<strong>in</strong>ally were based on<br />
the Department <strong>of</strong> Agriculture’s Economy Food Plan and reflected the different<br />
consumption requirements <strong>of</strong> families on the basis <strong>of</strong> factors such as family size and the<br />
number <strong>of</strong> children under 18 years <strong>of</strong> age.<br />
<strong>The</strong> actual poverty<br />
thresholds vary with the<br />
makeup <strong>of</strong> the family. In<br />
2015, the weighted average<br />
poverty threshold for a family<br />
<strong>of</strong> four was $24,257; for a<br />
family <strong>of</strong> n<strong>in</strong>e or more<br />
people, the threshold was<br />
$49,177; and for one person,<br />
it was $12,082. Poverty<br />
thresholds are updated each<br />
year to reflect changes <strong>in</strong> the<br />
Consumer Price Index for All<br />
Urban Consumers (CPI-U).<br />
Thresholds do not vary<br />
geographically.<br />
Low Earn<strong>in</strong>gs. <strong>The</strong> low-earn<strong>in</strong>gs level, as first developed <strong>in</strong> 1987, represented the<br />
average <strong>of</strong> the real value <strong>of</strong> the m<strong>in</strong>imum wage between 1967 and 1987 for a 40-hour<br />
workweek. <strong>The</strong> year 1967 was chosen as the base year because that was the first year<br />
<strong>in</strong> which m<strong>in</strong>imum-wage legislation covered essentially the same broad group <strong>of</strong><br />
workers that currently is covered. <strong>The</strong> low-earn<strong>in</strong>gs level has been adjusted each year<br />
s<strong>in</strong>ce then <strong>in</strong> accordance with the CPI-U, so the measure ma<strong>in</strong>ta<strong>in</strong>s the same real value<br />
that it held <strong>in</strong> 1987. In 2015, the low-earn<strong>in</strong>gs threshold was $348.85 per week.<br />
Page 75 <strong>of</strong> 289
Income. Data on <strong>in</strong>come are limited to money <strong>in</strong>come—before personal <strong>in</strong>come taxes<br />
and payroll deductions—received <strong>in</strong> the calendar year preced<strong>in</strong>g the CPS supplement.<br />
Data on <strong>in</strong>come do not <strong>in</strong>clude the value <strong>of</strong> noncash benefits, such as food stamps,<br />
Medicare, Medicaid, public hous<strong>in</strong>g, and employer-provided benefits.<br />
Labor Force. People <strong>in</strong> the labor force are those who worked or looked for work<br />
sometime dur<strong>in</strong>g the calendar year. <strong>The</strong> number <strong>of</strong> weeks <strong>in</strong> the labor force is<br />
accumulated over the entire year. <strong>The</strong> focus <strong>in</strong> this report is on people who were <strong>in</strong> the<br />
labor force for 27 weeks or more.<br />
Work<strong>in</strong>g Poor. <strong>The</strong> work<strong>in</strong>g poor are people who spent at least 27 weeks <strong>in</strong> the labor<br />
force (that is, work<strong>in</strong>g or look<strong>in</strong>g for work) but whose <strong>in</strong>comes still fell below the <strong>of</strong>ficial<br />
poverty level.<br />
Work<strong>in</strong>g-Poor Rate. This rate is the number <strong>of</strong> <strong>in</strong>dividuals <strong>in</strong> the labor force for at least<br />
27 weeks whose <strong>in</strong>comes still fell below the <strong>of</strong>ficial poverty level, as a percentage <strong>of</strong> all<br />
people who were <strong>in</strong> the labor force for at least 27 weeks dur<strong>in</strong>g the calendar year.<br />
Involuntary Part-Time Workers. <strong>The</strong>se are people who, dur<strong>in</strong>g at least 1 week <strong>of</strong> the<br />
year, worked fewer than 35 hours because <strong>of</strong> slack work or unfavorable bus<strong>in</strong>ess<br />
conditions or because they could not f<strong>in</strong>d full-time work. <strong>The</strong> number <strong>of</strong> weeks <strong>of</strong><br />
<strong>in</strong>voluntary part-time work is accumulated over the year.<br />
Occupation. This term refers to the job <strong>in</strong> which a person worked the most weeks<br />
dur<strong>in</strong>g the calendar year.<br />
Unemployed. Unemployed people are those who looked for work while not employed<br />
or those who were on lay<strong>of</strong>f from a job and were expect<strong>in</strong>g to be recalled to that job.<br />
<strong>The</strong> number <strong>of</strong> weeks unemployed is accumulated over the entire year.<br />
Family. A family is def<strong>in</strong>ed as a group <strong>of</strong> two or more people resid<strong>in</strong>g together who are<br />
related by birth, marriage, or adoption. <strong>The</strong> count <strong>of</strong> families used <strong>in</strong> this report <strong>in</strong>cludes<br />
only primary families. A primary family consists <strong>of</strong> the reference person (the<br />
householder) and all people liv<strong>in</strong>g <strong>in</strong> the household who are related to the reference<br />
person. Families are classified either as married-couple families or as those ma<strong>in</strong>ta<strong>in</strong>ed<br />
by men or women without spouses present. Family status is determ<strong>in</strong>ed at the time <strong>of</strong><br />
the survey <strong>in</strong>terview and, thus, may be different from that <strong>of</strong> the previous year.<br />
Unrelated Individuals. <strong>The</strong>se are people who are not liv<strong>in</strong>g with anyone related to<br />
them by birth, marriage, or adoption. Such <strong>in</strong>dividuals may live alone, reside <strong>in</strong> a<br />
nonrelated family household, or live <strong>in</strong> group quarters with other unrelated <strong>in</strong>dividuals.<br />
Related Children. Related children are children under age 18 (<strong>in</strong>clud<strong>in</strong>g sons,<br />
daughters, stepchildren, and adopted children) <strong>of</strong> the husband, wife, or person<br />
Page 76 <strong>of</strong> 289
ma<strong>in</strong>ta<strong>in</strong><strong>in</strong>g the family, as well as other children related to the householder by birth,<br />
marriage, or adoption.<br />
Race. White, Black or African American, and Asian are categories used to describe the<br />
race <strong>of</strong> people. People <strong>in</strong> these categories are those who selected that race group only.<br />
Data for the two rema<strong>in</strong><strong>in</strong>g race categories—American Indian and Alaska Native, and<br />
Native Hawaiian and Other Pacific Islander—and for people who selected more than<br />
one race category are <strong>in</strong>cluded <strong>in</strong> totals, but are not shown separately because the<br />
number <strong>of</strong> survey respondents is too small to develop estimates <strong>of</strong> sufficient quality for<br />
publication. In the enumeration process, race is determ<strong>in</strong>ed by the household<br />
respondent.<br />
Hispanic or Lat<strong>in</strong>o Ethnicity. This term refers to people who identified themselves <strong>in</strong><br />
the CPS enumeration process as be<strong>in</strong>g <strong>of</strong> Hispanic, Lat<strong>in</strong>o, or Spanish ethnicity. People<br />
whose ethnicity is identified as Hispanic or Lat<strong>in</strong>o may be <strong>of</strong> any race.<br />
Page 77 <strong>of</strong> 289
Page 78 <strong>of</strong> 289
IV. Mental Health<br />
Mental Health<br />
<strong>The</strong> Canadian Observatory on <strong>Homelessness</strong>/Homeless Hub<br />
People with poor mental health are more susceptible to the three ma<strong>in</strong> factors that can<br />
lead to homelessness: poverty, disaffiliation, and personal vulnerability. Because they<br />
<strong>of</strong>ten lack the capacity to susta<strong>in</strong> employment, they have little <strong>in</strong>come. Delusional<br />
th<strong>in</strong>k<strong>in</strong>g may lead them to withdraw from friends, family and other people. This loss <strong>of</strong><br />
support leaves them fewer cop<strong>in</strong>g resources <strong>in</strong> times <strong>of</strong> trouble. Mental illness can also<br />
impair a person’s ability to be resilient and resourceful; it can cloud th<strong>in</strong>k<strong>in</strong>g and impair<br />
judgment. For all these reasons, people with mental illness are at greater risk <strong>of</strong><br />
experienc<strong>in</strong>g homelessness.<br />
<strong>Homelessness</strong>, <strong>in</strong> turn,<br />
amplifies poor mental<br />
health. <strong>The</strong> stress <strong>of</strong><br />
experienc<strong>in</strong>g<br />
homelessness may<br />
exacerbate previous<br />
mental illness and<br />
encourage anxiety, fear,<br />
depression,<br />
sleeplessness and<br />
substance use. <strong>The</strong><br />
needs <strong>of</strong> people<br />
experienc<strong>in</strong>g<br />
homelessness with<br />
mental illnesses are<br />
similar to those without<br />
mental illnesses: physical<br />
safety, education,<br />
transportation, affordable<br />
hous<strong>in</strong>g, and affordable<br />
medical/dental treatment.<br />
When provid<strong>in</strong>g care to<br />
those experienc<strong>in</strong>g<br />
homelessness, it is<br />
essential to create a nonthreaten<strong>in</strong>g<br />
and supportive atmosphere, address basic needs (e.g. food and shelter),<br />
and provide accessible care.<br />
People with mental illness experience homelessness for longer periods <strong>of</strong> time and<br />
Page 79 <strong>of</strong> 289
have less contact with family and friends. In general, 30-35% <strong>of</strong> those experienc<strong>in</strong>g<br />
homelessness, and up to 75% <strong>of</strong> women experienc<strong>in</strong>g homelessness, have mental<br />
illnesses. 20-25% <strong>of</strong> people experienc<strong>in</strong>g homelessness suffer from concurrent<br />
disorders (severe mental illness and addictions). People who haves severe mental<br />
illnesses over-represent those experienc<strong>in</strong>g homelessness, as they are <strong>of</strong>ten released<br />
from hospitals and jails without proper community supports <strong>in</strong> place.<br />
Community-based mental health services play an important role. <strong>Homelessness</strong> could<br />
be drastically reduced if people with severe mental illness were able to access<br />
supportive hous<strong>in</strong>g as well as other necessary community supports.<br />
<strong>The</strong>y encounter more barriers to employment and tend to be <strong>in</strong> poorer health than other<br />
people experienc<strong>in</strong>g homelessness. Hous<strong>in</strong>g outreach services that provide a safe<br />
place to live are a vital component <strong>of</strong> stabiliz<strong>in</strong>g the illness and help<strong>in</strong>g <strong>in</strong>dividuals on<br />
their journey to recovery.<br />
________<br />
Mental Illness and <strong>Homelessness</strong> Are Connected;<br />
But not how you might th<strong>in</strong>k<br />
By Gale Holland<br />
Aug 07, 2017 | 5:00 AM<br />
Even as Los Angeles starts a $1.2-billion homeless hous<strong>in</strong>g construction program,<br />
residents from Temple City to Venice are fight<strong>in</strong>g to keep homeless projects out <strong>of</strong> their<br />
neighborhoods.<br />
But s<strong>in</strong>ce 1995, chronically homeless mentally ill people — a widely shunned subgroup<br />
— have been liv<strong>in</strong>g <strong>in</strong> Santa Monica’s Step Up on Second apartments, a block from the<br />
tourist-friendly Third Street Promenade and close enough to the beach to feel the salt<br />
air.<br />
“Look around. It’s here,” Rep. Timothy F. Murphy (R-Pa.) said dur<strong>in</strong>g a recent visit,<br />
describ<strong>in</strong>g why he sees Step Up’s residential programs as a national model.<br />
Murphy, author <strong>of</strong> a major 2016 mental health reform bill, was <strong>in</strong> Santa Monica to tour<br />
three <strong>of</strong> Step Up’s permanent supportive hous<strong>in</strong>g build<strong>in</strong>gs, which <strong>of</strong>fer apartments and<br />
counsel<strong>in</strong>g, case management and substance abuse treatment to 267 formerly<br />
homeless people with mental health issues.<br />
Dur<strong>in</strong>g the visit, <strong>The</strong> Times <strong>in</strong>terviewed Step Up Executive Director Tod Lipka, staff<br />
members and residents. Dennis Culhane, University <strong>of</strong> Pennsylvania pr<strong>of</strong>essor and<br />
homelessness researcher, and Andrew Sperl<strong>in</strong>g, legislative advocacy director for the<br />
National Alliance on Mental Illness, were <strong>in</strong>terviewed later.<br />
Page 80 <strong>of</strong> 289
Below are their edited responses to common questions about mental illness and<br />
homelessness:<br />
Are most homeless people mentally ill?<br />
A relatively small percentage <strong>of</strong> all homeless people nationwide — 13% to 15% — are<br />
mentally ill, but their symptoms — paranoia and delusions — draw attention and<br />
mislead others <strong>in</strong>to th<strong>in</strong>k<strong>in</strong>g their numbers are greater, Culhane said.<br />
However, Los Angeles’ homeless population skews heavily to s<strong>in</strong>gle adults who have<br />
lived <strong>in</strong> the streets a year or longer — a subgroup with a high <strong>in</strong>cidence <strong>of</strong> mental health<br />
issues. Local authorities estimate that 30% <strong>of</strong> the county’s homeless people have<br />
serious mental illness.<br />
Does chronic homelessness cause mental illness, or is it the other way around?<br />
Lipka said employees at his agency don’t see people develop<strong>in</strong>g serious mental illness<br />
by virtue <strong>of</strong> their homelessness. But “I do believe long-term isolation can lead to mental<br />
illness,” said Steve Elam, Step Up lead life skills coord<strong>in</strong>ator.<br />
Culhane said severely mentally ill people sometimes get treatment and aid that prevents<br />
them from becom<strong>in</strong>g homeless.<br />
How many homeless people are physically or mentally disabled?<br />
Page 81 <strong>of</strong> 289
Culhane said half the country’s homeless people have a physical or mental disability, or<br />
both. But they don’t necessarily qualify for federal disability payments, which <strong>in</strong> any<br />
case are too low — about $800 a month — to cover rent, utilities and other needs, even<br />
with food stamps tacked on, he added. Welfare reform <strong>in</strong> 1996 made it difficult for<br />
people whose impairment stems largely from substance abuse disorders to receive<br />
federal disability aid, Culhane said.<br />
“Instead <strong>of</strong> look<strong>in</strong>g at <strong>in</strong>dividuals and their biographies and conditions, the question is<br />
why is the disability system fail<strong>in</strong>g?” Culhane said.<br />
Is mental illness the result <strong>of</strong> genetics and bra<strong>in</strong> chemistry alone, or does trauma<br />
play a role?<br />
“We’re still figur<strong>in</strong>g that one out,” Sperl<strong>in</strong>g said. A strong case has been made for a<br />
genetic role <strong>in</strong> schizophrenia, but physiological and biological bra<strong>in</strong> development,<br />
environmental stressors and childhood trauma are also thought to <strong>in</strong>fluence mental<br />
health.<br />
“I grew up <strong>in</strong> Jordan Downs and Watts, I’ve seen a lot and I’ve been through two riots,”<br />
said Step Up resident Marv<strong>in</strong> Duckworth, 57. “My sense <strong>of</strong> hope and faith is not that<br />
strong.”<br />
How many mentally ill homeless people have issues with alcohol and drug abuse,<br />
and does drug addiction cause mental illness?<br />
About half <strong>of</strong> the homeless people with severe mental illness also have problems with<br />
alcohol or drugs, Culhane said. Lipka put the percentage <strong>of</strong> his agency’s clients even<br />
higher — 60% to 70% — but he and the other experts said drug use does not cause<br />
severe mental illness. Rather, homeless people with untreated mental illness selfmedicate<br />
to relieve symptoms, Lipka said.<br />
I grew up <strong>in</strong> Jordan Downs and Watts, I’ve seen a lot and I’ve been through two riots.<br />
My sense <strong>of</strong> hope and faith is not that strong.<br />
— Marv<strong>in</strong> Duckworth<br />
What is the role <strong>of</strong> prescribed medication <strong>in</strong> treat<strong>in</strong>g mentally ill homeless<br />
people? Doesn’t it turn them all <strong>in</strong>to zombies?<br />
Medication relieves symptoms, but it “doesn’t create purpose or positive mean<strong>in</strong>g <strong>in</strong><br />
your life, even if you have stabilized with hous<strong>in</strong>g,” Lipka said.<br />
Paula Boutte, Step Up’s Santa Monica program manager, said side effects affect people<br />
differently and medications and dosages <strong>of</strong>ten have to be adjusted over time. “If you<br />
experience drows<strong>in</strong>ess and can’t get up, it’s not quality <strong>of</strong> life,” Boutte said.<br />
Page 82 <strong>of</strong> 289
What about forced medication or other treatment for the most severely mentally<br />
ill homeless people?<br />
For the vast majority <strong>of</strong> homeless people, forc<strong>in</strong>g them to do anyth<strong>in</strong>g is a mistake,<br />
Lipka said.<br />
Sperl<strong>in</strong>g said Laura’s Law — which authorizes court-ordered mental health treatment for<br />
those with serious illness and a recent history <strong>of</strong> repeated violence, crim<strong>in</strong>al activity or<br />
hospitalizations — addresses some cases. But for the 2% to 3% <strong>of</strong> homeless people so<br />
symptomatic that “noth<strong>in</strong>g else works, we may need more options,” Lipka said.<br />
Why do people who grow up <strong>in</strong> foster care or state custody end up homeless?<br />
Children separated from their parents at an early age <strong>of</strong>ten suffer anxiety and<br />
depression, Sperl<strong>in</strong>g said. Lipka said grow<strong>in</strong>g up without stable relationships makes it<br />
difficult to learn life skills. After years <strong>of</strong> liv<strong>in</strong>g <strong>in</strong> group homes, “the only th<strong>in</strong>g I knew<br />
how to do was to shave and take a shower,” said Step Up resident <strong>The</strong>o Rob<strong>in</strong>, 45.<br />
Most young adults need help from family to go out on their own, and homeless youths<br />
are no exception. California’s recent law extend<strong>in</strong>g the cut<strong>of</strong>f for aid to foster children<br />
from age 18 to 21 has reduced the group’s homeless rates, Culhane said.<br />
Do some homeless people prefer to live that way?<br />
Lipka said the vast majority <strong>of</strong> the clients his agency works with — 97% — want hous<strong>in</strong>g<br />
“if the system we had to get <strong>in</strong>to hous<strong>in</strong>g wasn’t so complicated.” Many have been<br />
disappo<strong>in</strong>ted by past promises that fell through.<br />
“Hous<strong>in</strong>g becomes someth<strong>in</strong>g not <strong>in</strong> homeless people’s realm <strong>of</strong> possibility,” Lipka said.<br />
“<strong>The</strong> system has failed them, and then we blame it on them.”<br />
<strong>The</strong> system has failed them, and then we blame it on them.<br />
Page 83 <strong>of</strong> 289
— Tod Lipka, Step Up On Second<br />
Can mentally ill homeless people move on to jobs and live <strong>in</strong>dependently or will<br />
they need to be subsidized forever?<br />
For the chronically homeless <strong>in</strong> their 50s and 60s, stabilization <strong>in</strong> subsidized hous<strong>in</strong>g is<br />
the most realistic outcome, Lipka said. “We could see less <strong>in</strong>tensive, less costly<br />
permanent supportive hous<strong>in</strong>g, but that’s difficult,” he said. “It’s either you’re <strong>in</strong> it or<br />
you’re not.”<br />
Homeless young adults with mental health issues do move on to school, jobs, and <strong>in</strong><br />
some cases, <strong>in</strong>dependent liv<strong>in</strong>g.<br />
“We have a build<strong>in</strong>g for transitional-age youth leav<strong>in</strong>g foster care or state custody; they<br />
have shorter tenancy, reunite with family, take computer classes and move out and live<br />
on their own,” Lipka said.<br />
Should the public pay for mentally ill homeless people to live near the beach<br />
when most people can’t afford to?<br />
Lipka said that Santa Monica, which subsidizes Step Up, recognized that its homeless<br />
people are residents and that a vibrant city needs diversity.<br />
Hous<strong>in</strong>g and support services cost less than we are spend<strong>in</strong>g now on police, courts,<br />
jails and hospitals to manage homelessness, Lipka said. “Not to mention the nuisance<br />
cost <strong>of</strong> homelessness to a community,” he said.<br />
________<br />
Mental Illness and <strong>Homelessness</strong><br />
Tanya J. Peterson<br />
Mental illness and homelessness can be <strong>in</strong>terrelated. In "<strong>The</strong> Homeless Mentally Ill," an<br />
article appear<strong>in</strong>g <strong>in</strong> the Harvard Mental Health Letter (2005), the author asserts that<br />
nearly a third <strong>of</strong> all homeless people <strong>in</strong> the U.S. have a serious mental illness like<br />
schizophrenia, bipolar disorder, or major depression. This means that <strong>of</strong> the estimated<br />
600,000 homeless people <strong>in</strong> the U.S. <strong>in</strong> 2005, approximately 200,000 were seriously<br />
mentally ill. <strong>The</strong> mentally ill homeless numbered nearly a quarter million people.<br />
<strong>Homelessness</strong> and Mental Illness: Does One Cause the Other?<br />
<strong>The</strong> association between mental illness and homelessness isn't quite a cause-andeffect<br />
relationship. <strong>The</strong>re are so many factors at work <strong>in</strong> both mental illness and<br />
homelessness, not to mention the two <strong>of</strong> them together, to say that one unequivocally<br />
causes the other.<br />
Page 84 <strong>of</strong> 289
<strong>The</strong>re most def<strong>in</strong>itely is a relationship between mental illness and homelessness,<br />
though, and each one does contribute to the other <strong>in</strong> a circular fashion. Without help,<br />
the mutual contribution can sp<strong>in</strong> out <strong>of</strong> control.<br />
Mental illness can contribute to homelessness when symptoms become so severe that<br />
the person can't function. For example, he or she might be so disorganized as to be<br />
unable to ma<strong>in</strong>ta<strong>in</strong> a job (and thus pay rent or make house payments). Also, specific<br />
symptoms <strong>of</strong> mental health disorders, such as the manic state <strong>of</strong> bipolar disorder or the<br />
psychotic symptoms and paranoia <strong>of</strong> schizophrenia (paranoia, though, isn't always<br />
present <strong>in</strong> schizophrenia) can not only make it hard to work or care for oneself but can<br />
also severely isolate the person when others don't know what to do.<br />
Mental Illness and <strong>Homelessness</strong>: A L<strong>in</strong>k<br />
<strong>Homelessness</strong> can contribute to<br />
mental illness because <strong>of</strong> the<br />
severe distress caused by liv<strong>in</strong>g<br />
on the streets. <strong>Homelessness</strong> is<br />
traumatic, and as such can lead to<br />
PTSD. Depression, too, <strong>of</strong>ten<br />
develops when people live on the<br />
streets, as can other mental<br />
illnesses. If someone is vulnerable<br />
to mental illness, either from<br />
environmental or genetic factors,<br />
homelessness is very likely to lead<br />
to mental illness (What Causes<br />
Mental Illness? Genetics,<br />
Environment, Risk Factors).<br />
<strong>The</strong> <strong>in</strong>terconnection between homelessness and mental illness is multifaceted. Many<br />
different factors contribute to both <strong>of</strong> them, and they reflect the circular cause-and-effect<br />
relationship between the two.<br />
<br />
<br />
<br />
<br />
Biological risk factors <strong>in</strong>crease the likelihood <strong>of</strong> both mental illness and<br />
subsequent homelessness.<br />
Stressors and triggers such as significant loss, experienc<strong>in</strong>g trauma, abuse, and<br />
others greatly reduce someone's ability to function and <strong>in</strong>crease the risk <strong>of</strong><br />
homelessness.<br />
effects <strong>of</strong> child abuse (physical, emotional, sexual as well as neglect) that carry<br />
<strong>in</strong>to adulthood substance use<br />
psychiatric hospitalizations<br />
Page 85 <strong>of</strong> 289
clashes with the law and time <strong>in</strong> jail (Mental Illness And <strong>Homelessness</strong>: Hose 'em<br />
Down)<br />
little or no access to support systems (mental health care, social support, family<br />
support, etc.)<br />
isolation due to prejudices, misunderstand<strong>in</strong>gs, and mistreatment (Mental Illness<br />
Myths And <strong>The</strong> Damage <strong>The</strong>y Cause)<br />
government policies and <strong>in</strong>surance policies that make access<strong>in</strong>g mental health<br />
care difficult for many and impossible for some; without help and treatment,<br />
mental illness symptoms worsen and the risk <strong>of</strong> homelessness further <strong>in</strong>creases.<br />
While each <strong>of</strong> these contribut<strong>in</strong>g factors can lead to or exacerbate exist<strong>in</strong>g mental<br />
illness as well as result <strong>in</strong> homelessness, it's unlikely that any s<strong>in</strong>gle item will create<br />
mental illness and/or homelessness. Instead, it's the <strong>in</strong>terplay <strong>of</strong> all, or at least several,<br />
<strong>of</strong> them that plays a part <strong>in</strong> the development <strong>of</strong> both mental illness and homelessness.<br />
Support for Mentally Ill Homeless<br />
Despite the fact that it can be difficult to access, there is help available because<br />
homelessness and mental illness shouldn't have to coexist.<br />
<br />
<br />
<br />
<br />
outreach: <strong>in</strong> many cities, organizations have people who hit the streets and meet<br />
the homeless where they are, and they provide <strong>in</strong>formation to help connect the<br />
mentally ill homeless to resources<br />
social security provided by the government (this requires an address, and some<br />
shelters allow people to pick up their mail there, the post <strong>of</strong>fice may allow<br />
homeless <strong>in</strong>dividuals to pick up mail there, or the homeless person may use the<br />
address <strong>of</strong> someone they know)<br />
shelters<br />
temporary hous<strong>in</strong>g; the Department <strong>of</strong> Hous<strong>in</strong>g and Urban Development has a<br />
list <strong>of</strong> onl<strong>in</strong>e resources by state to help people locate temporary hous<strong>in</strong>g<br />
agencies.<br />
<strong>The</strong> key to end<strong>in</strong>g the cycle <strong>of</strong> mental illness and homelessness is treatment for mental<br />
illness (How to F<strong>in</strong>d Mental Health Services <strong>in</strong> Your Area). Without treatment and<br />
support, people with mental illness won't be able to rema<strong>in</strong> <strong>in</strong> hous<strong>in</strong>g once they receive<br />
it. Not just that, but like all human be<strong>in</strong>gs, the homeless mentally ill deserve to have<br />
their basic needs met, and beyond that, create wellbe<strong>in</strong>g.<br />
________<br />
Page 86 <strong>of</strong> 289
Mental Illness and <strong>Homelessness</strong>: Facts and Figures<br />
By M<strong>in</strong>gu Kim '18 | Staff Writer<br />
Posted on July 31, 2017<br />
<strong>Homelessness</strong> is a serious problem <strong>in</strong> the United States – an extensive study by the<br />
U.S. Department <strong>of</strong> Hous<strong>in</strong>g and Urban Development showed that over 500,000 people<br />
are homeless on any given night. This number has been steadily <strong>in</strong>creas<strong>in</strong>g s<strong>in</strong>ce the<br />
1970s, with homelessness becom<strong>in</strong>g prevalent not only <strong>in</strong> major cities but also <strong>in</strong><br />
smaller towns. Mental illness affects a significant proportion <strong>of</strong> the homeless population.<br />
A study by the National Institute <strong>of</strong> Mental Health found that approximately 6% <strong>of</strong><br />
Americans are severely mentally ill, compared to the 20-25% <strong>of</strong> the homeless<br />
population that suffers from severe mental illness. Furthermore, 45% <strong>of</strong> the homeless<br />
population shows history <strong>of</strong> mental illness diagnoses.<br />
Mental illness is also <strong>of</strong>ten cited as a major cause <strong>of</strong> homelessness, illustrat<strong>in</strong>g a<br />
causative relationship that extends beyond mere correlation. Unsurpris<strong>in</strong>gly, mental<br />
illnesses can stra<strong>in</strong> relationships with others, disrupt capabilities <strong>of</strong> self-care, and<br />
<strong>in</strong>terrupt the rout<strong>in</strong>e <strong>of</strong> a daily job, which are all factors that can lead to homelessness.<br />
Also, people who are homeless and suffer from mental illness are more prone to<br />
problems <strong>in</strong> physical health due to neglect <strong>of</strong> self-care, lead<strong>in</strong>g to prevalence <strong>of</strong><br />
respiratory <strong>in</strong>fections, HIV, and substance abuse. Studies show that psychotic homeless<br />
Page 87 <strong>of</strong> 289
<strong>in</strong>dividuals have a higher chance <strong>of</strong> be<strong>in</strong>g physically assaulted. A study <strong>in</strong> Baltimore<br />
showed that nearly one-third <strong>of</strong> homeless women had been raped.<br />
Unfortunately, because <strong>of</strong> the <strong>in</strong>crease <strong>in</strong> factors such as substance abuse, mentally ill,<br />
homeless <strong>in</strong>dividuals are more likely to be <strong>in</strong>carcerated. In fact, every s<strong>in</strong>gle state <strong>in</strong> the<br />
United States arrests more mentally ill people than it hospitalizes. In one report, it was<br />
found that 17.3% <strong>of</strong> prison <strong>in</strong>mates with severe mental illness were homeless prior to<br />
be<strong>in</strong>g arrested and 40% were homeless at one po<strong>in</strong>t <strong>in</strong> their lives, compared to 6% <strong>of</strong><br />
undiagnosed <strong>in</strong>mates. <strong>Homelessness</strong> and <strong>in</strong>carceration <strong>in</strong>creases the risk <strong>of</strong> each other<br />
through a positive feedback loop, caus<strong>in</strong>g a cycle <strong>of</strong> hardship and uncerta<strong>in</strong>ty. This<br />
cycle that these <strong>in</strong>dividuals face between liv<strong>in</strong>g on the streets and <strong>in</strong> prison causes<br />
emotional, f<strong>in</strong>ancial, and physical stress for their families and the community at large.<br />
<strong>The</strong>refore, mental health programs should provide plans for both treatment and<br />
hous<strong>in</strong>g. It has been shown that both treatment without hous<strong>in</strong>g and hous<strong>in</strong>g without<br />
treatment are <strong>in</strong>effective for homeless <strong>in</strong>dividuals with mental illness. Services that aim<br />
to achieve serious improvement need to address both treatment and hous<strong>in</strong>g.<br />
Supported hous<strong>in</strong>g programs <strong>in</strong> the past have <strong>of</strong>fered services <strong>in</strong>clud<strong>in</strong>g treatment,<br />
education, peer support, personal f<strong>in</strong>ance, and liv<strong>in</strong>g support. <strong>The</strong>se programs have<br />
been shown to be some <strong>of</strong> the most effective, although the lack <strong>of</strong> f<strong>in</strong>ancial support has<br />
been crippl<strong>in</strong>g for efforts to help the mentally ill, homeless population. State and city<br />
budgets have been drastically cut over the years, leav<strong>in</strong>g the future <strong>of</strong> the homeless on<br />
the street up <strong>in</strong> the air.<br />
Page 88 <strong>of</strong> 289
V. Affordable Hous<strong>in</strong>g<br />
Affordable Hous<strong>in</strong>g Crisis Forces U.S. Homeless Numbers<br />
Up for First Time S<strong>in</strong>ce Great Recession<br />
By Damien Sharkov on 12/6/17 at 4:36 AM<br />
<strong>Homelessness</strong> <strong>in</strong> the United States has risen for the first time s<strong>in</strong>ce the tail end <strong>of</strong><br />
the Great Recession as 553,742 people slept rough or <strong>in</strong> a shelter <strong>in</strong> a s<strong>in</strong>gle night<br />
earlier this year, with the West Coast fac<strong>in</strong>g a particularly acute problem.<br />
<strong>The</strong> one-night count <strong>in</strong> January represented the first time s<strong>in</strong>ce 2010 that<br />
homelessness <strong>in</strong> the U.S. ticked up, by 0.7 percent overall but by much more <strong>in</strong><br />
<strong>in</strong>dividual cities, NPR reported. <strong>The</strong> statistic came from a government document<br />
released by the Department <strong>of</strong> Hous<strong>in</strong>g and Urban Development (HUD) on<br />
Wednesday.<br />
<strong>The</strong> <strong>in</strong>crease came as a surprise as homelessness levels had been fall<strong>in</strong>g, hav<strong>in</strong>g<br />
dropped by 13 percent s<strong>in</strong>ce 2010. Many communities are mak<strong>in</strong>g progress on<br />
elim<strong>in</strong>at<strong>in</strong>g problems such as homeless veterans, who usually push the figures<br />
up, Ben Carson, HUD secretary, said.<br />
Page 89 <strong>of</strong> 289
<strong>The</strong> peak <strong>in</strong> the spontaneous one-night count stems now, however, from a new<br />
problem fac<strong>in</strong>g big cities—a lack <strong>of</strong> affordable hous<strong>in</strong>g.<br />
“Where we’re not mak<strong>in</strong>g great progress are <strong>in</strong> places like Los Angeles and New<br />
York City,” Carson told NPR. “<strong>The</strong>se happen to be places where the rents are<br />
go<strong>in</strong>g up much faster than the <strong>in</strong>comes.”<br />
<strong>Homelessness</strong> statistics for Los Angeles this year depict an <strong>in</strong>crease <strong>of</strong> nearly 26<br />
percent compared to last year alone. When it comes to homelessness among<br />
veterans, the national statistics would show an encourag<strong>in</strong>g drop <strong>of</strong> 3.2 percent,<br />
were it not for Los Angeles, whose own numbers push the national average for<br />
homeless veterans to an <strong>in</strong>crease <strong>of</strong> 1.5 percent.<br />
Major cities contributed to the overall rise, with New York’s homelessness<br />
<strong>in</strong>creas<strong>in</strong>g by more than 4 percent. It is <strong>in</strong> these cities where wages have<br />
frequently failed to keep up with hous<strong>in</strong>g costs. Accord<strong>in</strong>g to <strong>The</strong> Guardian,<br />
poverty rates have returned to pre-recession levels, while median wages rema<strong>in</strong><br />
at around $17 an hour and rents have <strong>in</strong>creased.<br />
As a whole, chronic or long-term homelessness is a grow<strong>in</strong>g problem, as 12<br />
percent more people experienced it this year compared with 2016. <strong>The</strong> one<br />
positive f<strong>in</strong>d<strong>in</strong>g was that family homelessness was down by 5.4 percent.<br />
Recent figures show there were 58,000 families with children liv<strong>in</strong>g without a ro<strong>of</strong><br />
over their heads or <strong>in</strong> shelters earlier this year. <strong>The</strong> number <strong>of</strong> unaccompanied<br />
homeless youth and children neared 41,000.<br />
________<br />
Affordable Hous<strong>in</strong>g<br />
U.S. Interagency Council on <strong>Homelessness</strong><br />
Last updated on June 22, 2018<br />
For many people, the gap between their current <strong>in</strong>come and the cost <strong>of</strong> hous<strong>in</strong>g <strong>in</strong> their<br />
community puts them at immediate risk <strong>of</strong> a hous<strong>in</strong>g crisis. Hous<strong>in</strong>g needs to be<br />
affordable to those households with the lowest <strong>in</strong>comes who are most at risk <strong>of</strong><br />
homelessness, and efforts to <strong>in</strong>crease access to affordable hous<strong>in</strong>g must be<br />
proportional to the local need.<br />
<strong>The</strong> Solution<br />
<strong>The</strong> Council is work<strong>in</strong>g on the follow<strong>in</strong>g strategies to <strong>in</strong>crease the supply <strong>of</strong> affordable<br />
hous<strong>in</strong>g for those who most need it:<br />
<br />
<br />
Support additional rental hous<strong>in</strong>g subsidies through federal, state, local,<br />
and private resources to <strong>in</strong>dividuals and families experienc<strong>in</strong>g or most at risk <strong>of</strong><br />
homelessness.<br />
Expand the supply <strong>of</strong> affordable rental homes where they are most needed,<br />
through federal, state, and local efforts. Rental subsidies should better target<br />
households earn<strong>in</strong>g significantly less than 30% <strong>of</strong> the Area Median Income.<br />
Page 90 <strong>of</strong> 289
Improve access to federally funded hous<strong>in</strong>g assistance by elim<strong>in</strong>at<strong>in</strong>g<br />
adm<strong>in</strong>istrative barriers and encourag<strong>in</strong>g prioritization <strong>of</strong> people experienc<strong>in</strong>g or<br />
most at risk <strong>of</strong> homelessness. Implement hous<strong>in</strong>g anti-discrim<strong>in</strong>ation and eviction<br />
protection provisions under the Violence Aga<strong>in</strong>st Women Act.<br />
Encourage collaboration between public hous<strong>in</strong>g agencies, multifamily<br />
hous<strong>in</strong>g owners, and homeless services to <strong>in</strong>crease ma<strong>in</strong>stream hous<strong>in</strong>g<br />
opportunities for people experienc<strong>in</strong>g homelessness. Promote guidance on<br />
how public hous<strong>in</strong>g agencies and multifamily hous<strong>in</strong>g owners can adopt<br />
admissions preferences and coord<strong>in</strong>ate with homeless services organizations to<br />
make referrals, assist with applications and lease-up, and provide supportive<br />
services.<br />
Increase service-enriched hous<strong>in</strong>g by co-locat<strong>in</strong>g or connect<strong>in</strong>g services<br />
with affordable hous<strong>in</strong>g. This could be accomplished <strong>in</strong> a wide range <strong>of</strong> ways,<br />
and will vary by community, neighborhood, and development. Examples <strong>in</strong>clude<br />
provid<strong>in</strong>g community space with<strong>in</strong> new affordable hous<strong>in</strong>g to host an after-school<br />
homework room, retr<strong>of</strong>itt<strong>in</strong>g vacant <strong>of</strong>fice space <strong>in</strong> a public hous<strong>in</strong>g complex for<br />
use as an exam<strong>in</strong>ation room for a community health nurse practitioner, provid<strong>in</strong>g<br />
on-site legal cl<strong>in</strong>ics for survivors <strong>of</strong> domestic violence, or co-locat<strong>in</strong>g a community<br />
health center or mental health service provider with<strong>in</strong> an affordable hous<strong>in</strong>g<br />
development.<br />
________<br />
A Map <strong>of</strong> America’s Homeless Problem Reveals <strong>The</strong> Best<br />
And Worst States For Affordable Hous<strong>in</strong>g<br />
Leanna Garfield<br />
Mar. 22, 2018, 11:46 AM<br />
<br />
<br />
<br />
<br />
<br />
An analysis maps the number <strong>of</strong> homeless people per 100,000 residents <strong>in</strong><br />
every <strong>US</strong> state plus Wash<strong>in</strong>gton, DC.<br />
Accord<strong>in</strong>g to the researchers, the number <strong>of</strong> unsheltered homeless people<br />
is on the rise nationwide.<br />
<strong>The</strong> data suggests that states with higher hous<strong>in</strong>g prices have higher rates<br />
<strong>of</strong> homeless people. DC — a city <strong>in</strong> the middle <strong>of</strong> an affordable hous<strong>in</strong>g<br />
crisis — has the highest number <strong>of</strong> homeless people per capita <strong>in</strong> the <strong>US</strong>.<br />
It's a similar story for Hawaii, California, and New York.<br />
Iowa and Nebraska have the fewest number <strong>of</strong> homeless Americans per<br />
capita, and hous<strong>in</strong>g prices are relatively low.<br />
________<br />
Page 91 <strong>of</strong> 289
For decades, the <strong>US</strong> has suffered a homelessness problem with monumental economic<br />
and human costs. At the same time, the country has also been caught <strong>in</strong> an affordable<br />
hous<strong>in</strong>g crisis.<br />
A new analysis suggests a correlation between the two epidemics exists. Look<strong>in</strong>g at<br />
2017 data from the Department <strong>of</strong> Hous<strong>in</strong>g and Urban Development, the San<br />
Francisco-based data agency DataFace mapped the number <strong>of</strong> homeless people per<br />
10,000 residents <strong>in</strong> every state plus Wash<strong>in</strong>gton, DC.<br />
As you can see below, the nation's capital has the highest number <strong>of</strong> homeless per<br />
capita at about 110.<br />
A map that estimates America's homeless problem. DataFace<br />
<strong>The</strong> researchers note that there may be a connection between high hous<strong>in</strong>g prices and<br />
high rates <strong>of</strong> homelessness. As <strong>of</strong> 2017, eight <strong>of</strong> the ten states with the highest rates <strong>of</strong><br />
homelessness (which <strong>in</strong>cludes Wash<strong>in</strong>gton, DC) are among the ten most expensive<br />
places to live. Affordable hous<strong>in</strong>g <strong>in</strong> many DC neighborhoods, for example, has been<br />
scarce <strong>in</strong> recent years. Zillow estimates that the median home value <strong>in</strong> Wash<strong>in</strong>gton is<br />
$553,600, and the median rent price is $2,500 per month as <strong>of</strong> February 2018.<br />
It's a similar story <strong>in</strong> Hawaii, where there are approximately 51 homeless people per<br />
10,000 residents, and home values have <strong>in</strong>creased about 6.6% over the past year. <strong>The</strong><br />
median home value <strong>in</strong> Hawaii is around $628,600, and the monthly median rent price is<br />
$2,300.<br />
Meanwhile, Iowa and Nebraska have the fewest number <strong>of</strong> homeless Americans per<br />
capita, accord<strong>in</strong>g to the analysis. <strong>The</strong>se states also have relatively low hous<strong>in</strong>g prices:<br />
about $132,600 and $157,800 respectively.<br />
<strong>The</strong>re is one major caveat to this study. Even when rely<strong>in</strong>g on government data, it can<br />
be hard to f<strong>in</strong>d the true number <strong>of</strong> people liv<strong>in</strong>g on the streets, especially if they move<br />
locations or reside <strong>in</strong> hidden places. In addition, HUD makes the tallies <strong>in</strong> January,<br />
when many homeless take refuge with family or friends dur<strong>in</strong>g the cold weather. <strong>The</strong>se<br />
Page 92 <strong>of</strong> 289
numbers are then comb<strong>in</strong>ed with a count <strong>of</strong> occupied shelter beds to gauge the success<br />
<strong>of</strong> the previous year's service efforts.<br />
In 2017, the total number <strong>of</strong> homeless Americans <strong>in</strong>creased by 0.7% year-over-year.<br />
<strong>The</strong> number <strong>of</strong> unsheltered homeless grew even more with a jump <strong>of</strong> 9% from 2016.<br />
<strong>The</strong> affordable hous<strong>in</strong>g crisis is likely to endure as well. <strong>The</strong> White House's Fiscal Year<br />
2019 budget proposal, released <strong>in</strong> February, calls for work requirements for those who<br />
receive public hous<strong>in</strong>g subsidies. It would also cut fund<strong>in</strong>g for HUD by $8.8 billion.<br />
________<br />
Hous<strong>in</strong>g and <strong>Homelessness</strong><br />
as a Public Health Issue<br />
American Public Health Association<br />
Nov 07 2017 | Policy Number: 20178<br />
Abstract<br />
<strong>The</strong> United Nations declared hous<strong>in</strong>g to be a fundamental human right <strong>in</strong> 1991, and the<br />
United States reduced overall homelessness by 20% between 2005 and 2013.<br />
However, homelessness cont<strong>in</strong>ues to be a recalcitrant public health problem <strong>in</strong> the<br />
Page 93 <strong>of</strong> 289
United States, as those experienc<strong>in</strong>g homelessness have high rates <strong>of</strong> chronic mental<br />
and physical health conditions, co-occurr<strong>in</strong>g disorders, and barriers to health care and<br />
affordable hous<strong>in</strong>g. Homeless <strong>in</strong>dividuals also overuse emergency services, lead<strong>in</strong>g to<br />
higher treatment costs. Numerous evidence-based strategies are be<strong>in</strong>g employed to<br />
end homelessness by <strong>in</strong>creas<strong>in</strong>g access to hous<strong>in</strong>g options and supportive services for<br />
hous<strong>in</strong>g stability; examples <strong>in</strong>clude the Hous<strong>in</strong>g First model, hous<strong>in</strong>g subsidies for<br />
extremely low-<strong>in</strong>come families, permanent supportive hous<strong>in</strong>g services for those with<br />
complex health needs, and pathways to f<strong>in</strong>ancial stability through access to disability<br />
<strong>in</strong>come and employment support. Interventions <strong>in</strong> hous<strong>in</strong>g, health, and <strong>in</strong>come<br />
stabilization should be holistically <strong>in</strong>tegrated, allow<strong>in</strong>g <strong>in</strong>dividuals experienc<strong>in</strong>g<br />
homelessness to f<strong>in</strong>d their unique path to recovery. To achieve an end to<br />
homelessness, APHA sets forth recommendations for federal, state, and local<br />
policymakers and agencies to work collaboratively <strong>in</strong> fund<strong>in</strong>g evidence-based hous<strong>in</strong>g<br />
acquisition practices and supportive hous<strong>in</strong>g stability services, as well as support<strong>in</strong>g<br />
future <strong>in</strong>novations <strong>in</strong> <strong>in</strong>tegrated services for <strong>in</strong>dividuals experienc<strong>in</strong>g homelessness.<br />
Relationship to Exist<strong>in</strong>g APHA Policy Statements<br />
<br />
<br />
<br />
<br />
<br />
APHA Policy Statement 9718(PP): Support<strong>in</strong>g a National Priority to Elim<strong>in</strong>ate<br />
<strong>Homelessness</strong><br />
APHA Policy Statement 9611: L<strong>in</strong>kage <strong>of</strong> Medical Services for Low-Income<br />
Populations with Mental Health, Substance Abuse, and Other Addictions<br />
APHA Policy Statement 9210: <strong>Homelessness</strong> as a Public Health Problem<br />
APHA Policy Statement 9003: Health Care for Homeless Pregnant Teenagers<br />
APHA Policy Statement 8413: Basic Needs <strong>of</strong> the Homeless and Homeless<br />
Mentally Ill <strong>in</strong> the <strong>US</strong><br />
Problem Statement<br />
<strong>The</strong> United Nations declared “the right to adequate hous<strong>in</strong>g” to be a fundamental<br />
human right <strong>in</strong> 1991. Across the European Union, more than 400,000 <strong>in</strong>dividuals are<br />
homeless on any given night, with an estimated 4.1 million people experienc<strong>in</strong>g a<br />
homeless episode each year (although vary<strong>in</strong>g def<strong>in</strong>itions and methodologies make it<br />
challeng<strong>in</strong>g to determ<strong>in</strong>e precise numbers). <strong>The</strong> United States has made significant<br />
progress <strong>in</strong> end<strong>in</strong>g homelessness s<strong>in</strong>ce its Open<strong>in</strong>g Doors plan was implemented <strong>in</strong><br />
2010, but it rema<strong>in</strong>s a recalcitrant public health problem.<br />
<strong>The</strong> 2016 U.S. Department <strong>of</strong> Hous<strong>in</strong>g and Urban Development (HUD) Annual<br />
Homeless Assessment Report to Congress estimated that 549,928 people experienced<br />
homelessness on a s<strong>in</strong>gle night <strong>in</strong> 2016, with 32% <strong>of</strong> <strong>in</strong>dividuals stay<strong>in</strong>g <strong>in</strong> unsheltered<br />
locations. Demographically, more than 39% <strong>of</strong> <strong>in</strong>dividuals experienc<strong>in</strong>g homelessness<br />
self-identified as Black or African American, a significant overrepresentation relative to<br />
the percentage <strong>in</strong> the U.S. population as a whole (13.3% <strong>in</strong> 2016). One <strong>in</strong> five people<br />
Page 94 <strong>of</strong> 289
experienc<strong>in</strong>g homelessness were Hispanic or Lat<strong>in</strong>o, 3% were Native American, 2%<br />
were <strong>of</strong> Pacific Islander descent, and 1% were <strong>of</strong> Asian descent. Men represented 60%<br />
<strong>of</strong> those counted; 40% were women, and less than 1% were transgender.<br />
Geographically, New York, Florida, and California had the highest numbers <strong>of</strong> people<br />
experienc<strong>in</strong>g homelessness, although significant <strong>in</strong>creases <strong>in</strong> the number <strong>of</strong> homeless<br />
people were seen <strong>in</strong> rural states such as Idaho, Wyom<strong>in</strong>g, and Oklahoma. <strong>The</strong> count<br />
<strong>in</strong>cluded 39,471 veterans, with 8% <strong>of</strong> that total accounted for by female veterans. Of all<br />
homeless <strong>in</strong>dividuals, almost 121,000 were children (22% <strong>of</strong> the total), 35,686 (7%)<br />
were unaccompanied young people 18 to 24 years <strong>of</strong> age, and more than a third were<br />
experienc<strong>in</strong>g homelessness as part <strong>of</strong> a family. It is important to note that these figures<br />
capture a s<strong>in</strong>gle po<strong>in</strong>t <strong>in</strong> time, and millions more adults and children experience<br />
episodes <strong>of</strong> homelessness dur<strong>in</strong>g a given year or are at risk <strong>of</strong> experienc<strong>in</strong>g<br />
homelessness as a result <strong>of</strong> f<strong>in</strong>ancial and hous<strong>in</strong>g <strong>in</strong>stability.<br />
It is difficult to obta<strong>in</strong> accurate data on the prevalence <strong>of</strong> youth homelessness <strong>in</strong> the<br />
United States; accord<strong>in</strong>g to estimates, however. between 500,000 and 2.1 million young<br />
people 13 to 21 years old are homeless. Homeless youths are typically def<strong>in</strong>ed as<br />
unaccompanied <strong>in</strong>dividuals 12 years or older (up to age 17, 21, or 25) who live <strong>in</strong><br />
shelters, on the street, or <strong>in</strong> other unstable liv<strong>in</strong>g conditions without family support.<br />
Overall, homeless youths are more likely than their housed counterparts to experience<br />
negative health outcomes, <strong>in</strong>clud<strong>in</strong>g chronic health conditions or problems such as HIV,<br />
substance abuse, violence, and mental health issues. Such risks are a consequence <strong>of</strong><br />
street-entrenched lifestyles as well as early childhood traumas <strong>in</strong>clud<strong>in</strong>g family<br />
breakdowns, discrim<strong>in</strong>ation, and poverty. In addition, historically marg<strong>in</strong>alized groups<br />
Page 95 <strong>of</strong> 289
are disproportionally represented <strong>in</strong> homeless youth populations. Lesbian, gay,<br />
bisexual, transgender, queer, and question<strong>in</strong>g (LGBTQ) youths represent between 30%<br />
and 45% <strong>of</strong> the overall homeless youth population, as compared with an estimated 5%<br />
to 10% <strong>of</strong> the overall youth population. LGBTQ homeless youths are significantly more<br />
likely than their heterosexual homeless youth counterparts to have major depressive<br />
episodes, posttraumatic stress disorder, suicidal ideation, and at least one suicide<br />
attempt. In addition, they have <strong>in</strong>creased rates <strong>of</strong> sexual and violent victimization.<br />
Homeless youths are also three times more likely to be pregnant, to have impregnated<br />
someone, or to already be a parent.<br />
Many homeless youths seek health services only when peer advice and self-care are no<br />
longer effective, and m<strong>in</strong>or, treatable <strong>in</strong>juries <strong>of</strong>ten escalate <strong>in</strong>to more severe health<br />
problems. This problem is compounded by limited access to health care among<br />
homeless youths, who frequently use drop-<strong>in</strong> centers that provide free, <strong>in</strong>stant health<br />
care and emergency rooms that <strong>of</strong>ten fail to <strong>of</strong>fer the necessary level <strong>of</strong> care and are<br />
much more expensive than the services <strong>of</strong> a primary care physician. Access to<br />
preventative health care directly affects young people’s ability to safely and successfully<br />
exit the streets.<br />
Similarly, hous<strong>in</strong>g <strong>in</strong>stability and homelessness among children and families is a<br />
significant issue, with an estimated 2.5 million children (one <strong>in</strong> every 30) experienc<strong>in</strong>g<br />
homelessness <strong>in</strong> a given year. Child and family homelessness is likely undercounted <strong>in</strong><br />
national surveys, as many families “double up” with friends or relatives and may<br />
withhold <strong>in</strong>formation about their hous<strong>in</strong>g <strong>in</strong>stability to avoid stigma. Furthermore, an<br />
estimated 51% <strong>of</strong> homeless children are younger than 6 years and may not be<br />
accurately counted, as they do not attend school. Risk factors for family homelessness<br />
<strong>in</strong>clude <strong>in</strong>adequate social support, domestic violence, a history <strong>of</strong> children be<strong>in</strong>g placed<br />
<strong>in</strong> foster care, parental drug or alcohol use, parental mental illness, and racial/ethnic<br />
m<strong>in</strong>ority family background. As a corollary, children who experience family<br />
homelessness are at risk <strong>of</strong> higher stress levels, health problems, and need for pediatric<br />
health care dur<strong>in</strong>g and after such adverse episodes. Homeless children display mental<br />
health symptoms requir<strong>in</strong>g cl<strong>in</strong>ical evaluations at a rate <strong>of</strong> two to four times that <strong>of</strong> their<br />
low-<strong>in</strong>come housed peers, and they <strong>of</strong>ten exhibit developmental or cognitive delays.<br />
Research <strong>in</strong>dicates that 90% <strong>of</strong> mothers experienc<strong>in</strong>g homelessness have been<br />
exposed to at least one form <strong>of</strong> severe traumatic stress, and between 20% and 50% <strong>of</strong><br />
women cite <strong>in</strong>timate partner violence as the cause <strong>of</strong> their homelessness.<br />
End<strong>in</strong>g homelessness is a public health issue, as those experienc<strong>in</strong>g homelessness<br />
have high rates <strong>of</strong> chronic mental and physical health conditions, co-occurr<strong>in</strong>g<br />
disorders, and barriers to care, such as <strong>in</strong>ability to access care when needed or comply<br />
with prescribed medications. <strong>The</strong> correlation between disabilities and homelessness is<br />
high, with almost 20% <strong>of</strong> <strong>in</strong>dividuals experienc<strong>in</strong>g homelessness <strong>in</strong> 2016 report<strong>in</strong>g a<br />
severe mental illness and 17% report<strong>in</strong>g a chronic substance use problem. Research on<br />
personal and structural barriers <strong>in</strong> access<strong>in</strong>g treatment for co-occurr<strong>in</strong>g substance use<br />
and mental health disorders <strong>in</strong>dicates that <strong>in</strong>dividuals experienc<strong>in</strong>g homelessness or<br />
those with crim<strong>in</strong>al justice <strong>in</strong>volvement <strong>of</strong>ten have fewer treatment resources, lack<br />
Page 96 <strong>of</strong> 289
transportation, and have more limited access to services, particularly those <strong>in</strong> rural<br />
areas. <strong>The</strong>se barriers to treatment may lead to <strong>in</strong>creases <strong>in</strong> chronic conditions and may<br />
h<strong>in</strong>der hous<strong>in</strong>g and <strong>in</strong>come stability.<br />
Research also <strong>in</strong>dicates that <strong>in</strong>dividuals experienc<strong>in</strong>g homelessness have a risk <strong>of</strong><br />
mortality that is 1.5 to 11.5 times greater than the risk <strong>in</strong> the general population.<br />
Research across the European Union and Canada supports f<strong>in</strong>d<strong>in</strong>gs <strong>of</strong> higher mortality<br />
rates and chronic disease loads among <strong>in</strong>dividuals experienc<strong>in</strong>g homelessness than<br />
among those who are housed. Liv<strong>in</strong>g <strong>in</strong> an unsheltered or temporary location can<br />
exacerbate conditions such as diabetes and<br />
hepatitis C, which a study <strong>in</strong> Boston showed to be<br />
two times and 12 times, respectively, more<br />
prevalent <strong>in</strong> a cohort experienc<strong>in</strong>g homelessness<br />
than <strong>in</strong> the general population. Manag<strong>in</strong>g diabetes<br />
requires access to clean needles and test<strong>in</strong>g<br />
supplies and refrigeration <strong>of</strong> <strong>in</strong>sul<strong>in</strong>, and treat<strong>in</strong>g<br />
hepatitis C depends on detailed medication<br />
management, which can be difficult or impossible<br />
for <strong>in</strong>dividuals experienc<strong>in</strong>g homelessness. Along<br />
with treatment <strong>of</strong> chronic health conditions, stable<br />
hous<strong>in</strong>g is <strong>in</strong>tegral <strong>in</strong> prevent<strong>in</strong>g communicable<br />
diseases such as tuberculosis and HIV. In<br />
addition, food <strong>in</strong>security (def<strong>in</strong>ed as be<strong>in</strong>g without<br />
access to food or not hav<strong>in</strong>g the ability to acquire<br />
food), as faced by many who are homeless, can further worsen mental health<br />
outcomes.<br />
Furthermore, <strong>in</strong>dividuals experienc<strong>in</strong>g homelessness overuse emergency services,<br />
lead<strong>in</strong>g to higher costs for treatment. Studies report that a quarter to one third <strong>of</strong><br />
homeless <strong>in</strong>dividuals are hospitalized dur<strong>in</strong>g a given year and that these <strong>in</strong>dividuals<br />
have significantly higher rates <strong>of</strong> emergency department (ED) use than the general<br />
population. A national study <strong>of</strong> ED use showed that homeless <strong>in</strong>dividuals were three<br />
times more likely than members <strong>of</strong> the non-homeless population to return to the same<br />
ED with<strong>in</strong> 3 days <strong>of</strong> an evaluation <strong>in</strong> that department and twice as likely to use an ED<br />
with<strong>in</strong> 1 week <strong>of</strong> a hospitalization. <strong>The</strong> study also revealed that homeless <strong>in</strong>dividuals<br />
were more likely to be transported to the hospital via an ambulance, further <strong>in</strong>creas<strong>in</strong>g<br />
treatment costs.<br />
Research on factors predict<strong>in</strong>g ED use among <strong>in</strong>dividuals experienc<strong>in</strong>g homelessness<br />
shows that unstable hous<strong>in</strong>g status and disease burden are more predictive <strong>of</strong> overuse<br />
than <strong>in</strong>sured status. A study <strong>in</strong> Toronto reported that homeless <strong>in</strong>sured adults visited an<br />
ED eight times more frequently than their low-<strong>in</strong>come housed counterparts, while a<br />
study <strong>in</strong> Boston concluded that unstable hous<strong>in</strong>g, mental illness, and substance use<br />
disorders were significantly associated with frequent ED use among homeless <strong>in</strong>sured<br />
patients. <strong>The</strong>se costs add up, and research estimates that ma<strong>in</strong>ta<strong>in</strong><strong>in</strong>g a person liv<strong>in</strong>g<br />
on the street or <strong>in</strong> a shelter can cost between $35,000 and $150,000 annually,<br />
Page 97 <strong>of</strong> 289
account<strong>in</strong>g for added expenses due to ED use and contact with law enforcement. As a<br />
result, <strong>in</strong>creas<strong>in</strong>g hous<strong>in</strong>g stability and end<strong>in</strong>g homelessness are critical factors <strong>in</strong><br />
reduc<strong>in</strong>g health system costs.<br />
However, the lack <strong>of</strong> affordable hous<strong>in</strong>g and high rent costs are barriers to achiev<strong>in</strong>g<br />
hous<strong>in</strong>g stability. HUD def<strong>in</strong>es households with <strong>in</strong>comes 30% or more below their area<br />
median as “extremely low <strong>in</strong>come,” and <strong>in</strong> 2016 the National Low Income Hous<strong>in</strong>g<br />
Coalition found that only 3.2 million affordable hous<strong>in</strong>g units were available for the 10.4<br />
million extremely low-<strong>in</strong>come households <strong>in</strong> the United States. Without access to<br />
affordable hous<strong>in</strong>g, 75% <strong>of</strong> extremely low-<strong>in</strong>come households are severely cost<br />
burdened, pay<strong>in</strong>g 50% or more <strong>of</strong> their <strong>in</strong>come toward hous<strong>in</strong>g costs. <strong>The</strong>se hous<strong>in</strong>g<br />
shortages have a particular impact on <strong>in</strong>dividuals with disabl<strong>in</strong>g conditions. A 2014<br />
study showed that the national average rent for a modest one-bedroom unit exceeded<br />
100% <strong>of</strong> monthly Social Security Supplemental Security Income (SSI) payments, and<br />
the national average rent for a studio/efficiency was equivalent to 90% <strong>of</strong> monthly SSI<br />
payments. Hous<strong>in</strong>g subsidies, such as HUD’s hous<strong>in</strong>g choice vouchers (HCVs), are<br />
critical to assist<strong>in</strong>g <strong>in</strong>dividuals <strong>in</strong> access<strong>in</strong>g safe, affordable hous<strong>in</strong>g without be<strong>in</strong>g too<br />
cost burdened to meet other basic needs such as food and transportation.<br />
Individuals with complex health needs, particularly those with severe mental illness and<br />
co-occurr<strong>in</strong>g substance use disorders, <strong>of</strong>ten have difficulty <strong>in</strong> ma<strong>in</strong>ta<strong>in</strong><strong>in</strong>g hous<strong>in</strong>g<br />
without appropriate supportive services, even with the provision <strong>of</strong> affordable hous<strong>in</strong>g.<br />
Increased access to low-barrier, permanent hous<strong>in</strong>g with wraparound supportive<br />
services is essential to meet<strong>in</strong>g the needs <strong>of</strong> this population. Key supportive hous<strong>in</strong>g<br />
services <strong>in</strong>clude medical and psychiatric treatment, case management, and resources<br />
designed to support <strong>in</strong>dependent liv<strong>in</strong>g, which are <strong>of</strong>ten funded through Medicaid.<br />
Income stability is critical to reta<strong>in</strong><strong>in</strong>g hous<strong>in</strong>g for <strong>in</strong>dividuals who have disabl<strong>in</strong>g<br />
conditions, and cash benefits and health <strong>in</strong>surance provided by Social Security disability<br />
programs, SSI, and Social Security Disability Insurance (SSDI) make it possible for<br />
these <strong>in</strong>dividuals to access important treatment and supportive services. However,<br />
despite high levels <strong>of</strong> disabl<strong>in</strong>g conditions, many <strong>in</strong>dividuals experienc<strong>in</strong>g homelessness<br />
never apply for benefits, and those who do have a very low chance <strong>of</strong> approval without<br />
receiv<strong>in</strong>g active assistance <strong>in</strong> document<strong>in</strong>g their disabilities. Nationwide, an average <strong>of</strong><br />
28% <strong>of</strong> all <strong>in</strong>itial SSI/SSDI applications are approved, and this figure can be as low as<br />
10% to 15% among <strong>in</strong>dividuals experienc<strong>in</strong>g homelessness. Denials typically result<br />
from the Social Security Adm<strong>in</strong>istration’s <strong>in</strong>ability to contact <strong>in</strong>dividuals, missed<br />
appo<strong>in</strong>tments, and, more generally, lack <strong>of</strong> adequate documentation. People<br />
experienc<strong>in</strong>g homelessness face many challenges when apply<strong>in</strong>g for disability benefits,<br />
<strong>in</strong>clud<strong>in</strong>g <strong>in</strong>consistent treatment, difficulty <strong>in</strong> locat<strong>in</strong>g medical records, lack <strong>of</strong> a stable<br />
address or telephone number for contact with Social Security, and difficulty <strong>in</strong><br />
understand<strong>in</strong>g complex and fragmented application processes.<br />
Further imped<strong>in</strong>g <strong>in</strong>come stability is the high prevalence <strong>of</strong> unemployment (estimated to<br />
be as high as 80% to 90%) among <strong>in</strong>dividuals experienc<strong>in</strong>g homelessness, particularly<br />
those with severe mental illness. Frequently cited barriers to employment <strong>in</strong>clude<br />
Page 98 <strong>of</strong> 289
difficulties <strong>in</strong> obta<strong>in</strong><strong>in</strong>g psychiatric care, substance use, crim<strong>in</strong>al histories, lack <strong>of</strong> child<br />
care, and limited education. Lack<strong>in</strong>g a stable address, phone, work attire, and<br />
transportation further compounds barriers to stable employment. While day labor<br />
positions may provide limited <strong>in</strong>come for homeless <strong>in</strong>dividuals, particularly those with<br />
lower educational atta<strong>in</strong>ment and crim<strong>in</strong>al and alcohol use histories, they are not a<br />
reliable form <strong>of</strong> <strong>in</strong>come due to exploitation and <strong>in</strong>equality <strong>in</strong> the day labor market.<br />
Increas<strong>in</strong>g access to permanent, supportive employment options among <strong>in</strong>dividuals<br />
experienc<strong>in</strong>g homelessness is critical for <strong>in</strong>come stability.<br />
F<strong>in</strong>ally, crim<strong>in</strong>alization measures <strong>in</strong> effect across the United States that target activities<br />
associated with homelessness are not only <strong>in</strong>effective <strong>in</strong> reduc<strong>in</strong>g homelessness and<br />
costly to enforce but serve as a barrier to <strong>in</strong>come and hous<strong>in</strong>g stability. In 2016, the<br />
National Law Center on <strong>Homelessness</strong> and Poverty conducted a survey <strong>of</strong> the<br />
municipal codes <strong>in</strong> 187 cities and found that despite a shortage <strong>of</strong> hous<strong>in</strong>g and shelter<br />
options, many cities are choos<strong>in</strong>g to crim<strong>in</strong>ally punish <strong>in</strong>dividuals for carry<strong>in</strong>g out lifesusta<strong>in</strong><strong>in</strong>g<br />
tasks such as sleep<strong>in</strong>g <strong>in</strong> public, loiter<strong>in</strong>g, sitt<strong>in</strong>g or ly<strong>in</strong>g down <strong>in</strong> public,<br />
sleep<strong>in</strong>g <strong>in</strong> vehicles, shar<strong>in</strong>g food, and panhandl<strong>in</strong>g. <strong>The</strong> survey results showed that<br />
53% <strong>of</strong> cities prohibit sitt<strong>in</strong>g or ly<strong>in</strong>g down <strong>in</strong> public places, 43% prohibit sleep<strong>in</strong>g <strong>in</strong><br />
vehicles, 76% prohibit begg<strong>in</strong>g <strong>in</strong> particular public places, and 9% prohibit shar<strong>in</strong>g food<br />
with people experienc<strong>in</strong>g homelessness. <strong>The</strong>se crim<strong>in</strong>alization measures do noth<strong>in</strong>g to<br />
address the underly<strong>in</strong>g causes <strong>of</strong> homelessness, as most police <strong>in</strong>terventions are<br />
temporary and result <strong>in</strong> a f<strong>in</strong>e that homeless <strong>in</strong>dividuals are <strong>of</strong>ten not able to pay,<br />
Page 99 <strong>of</strong> 289
exacerbat<strong>in</strong>g their f<strong>in</strong>ancial <strong>in</strong>stability. Crim<strong>in</strong>alization <strong>of</strong> these measures is costly for<br />
taxpayers to enforce, and a study <strong>in</strong> Colorado showed that six <strong>of</strong> the state’s cities spent<br />
more than $5 million enforc<strong>in</strong>g 14 anti-homelessness ord<strong>in</strong>ances. Crim<strong>in</strong>al records<br />
negatively affect an <strong>in</strong>dividual’s access to hous<strong>in</strong>g, benefits, and employment, and<br />
these barriers are not limited to homeless adults. Homeless children and youths are<br />
also subject to liability under these ord<strong>in</strong>ances, along with ord<strong>in</strong>ances that apply<br />
uniquely to them such as status <strong>of</strong>fenses and truancy.<br />
As documented above, <strong>in</strong>dividuals and families experienc<strong>in</strong>g homelessness are more<br />
vulnerable to health <strong>in</strong>equities and have disproportionately poor health outcomes. <strong>The</strong><br />
World Health Organization emphasizes that improv<strong>in</strong>g social determ<strong>in</strong>ants <strong>of</strong> health is<br />
critical <strong>in</strong> achiev<strong>in</strong>g health equity with<strong>in</strong> a generation. Improv<strong>in</strong>g the conditions <strong>of</strong> daily<br />
life for vulnerable <strong>in</strong>dividuals, tackl<strong>in</strong>g the structural drivers <strong>of</strong> <strong>in</strong>equities (e.g., <strong>in</strong>effective<br />
social programs or <strong>in</strong>equitable economic opportunities), and rais<strong>in</strong>g public awareness <strong>of</strong><br />
social determ<strong>in</strong>ants <strong>of</strong> health are crucial to this process,[38] as are recogniz<strong>in</strong>g<br />
homelessness <strong>in</strong> the United States as a public health issue, address<strong>in</strong>g barriers<br />
h<strong>in</strong>der<strong>in</strong>g access to treatment and hous<strong>in</strong>g, and cont<strong>in</strong>u<strong>in</strong>g to support research that<br />
measures the effectiveness <strong>of</strong> social policies designed to end homelessness.<br />
Recent successes <strong>in</strong> address<strong>in</strong>g homelessness demonstrate that there are available<br />
solutions to this public health issue. From 2005 to 2013, overall homelessness<br />
decreased by 20%, while chronic homelessness decreased by 42% and homelessness<br />
among veterans by 24%. <strong>The</strong>se reductions have been attributed, at least <strong>in</strong> part, to<br />
concurrent dissem<strong>in</strong>ation and implementation <strong>of</strong> data-driven, results-oriented<br />
approaches to hous<strong>in</strong>g and homelessness. <strong>The</strong>se <strong>in</strong>terventions vary, as does the<br />
quality <strong>of</strong> evidence support<strong>in</strong>g them, accord<strong>in</strong>g to differ<strong>in</strong>g types or characteristics <strong>of</strong><br />
homelessness and the unique barriers faced.<br />
Evidence-Based Strategies to Address the Problem<br />
Numerous evidence-based strategies are be<strong>in</strong>g employed to end homelessness by<br />
<strong>in</strong>creas<strong>in</strong>g access to hous<strong>in</strong>g options and supportive services for hous<strong>in</strong>g stability.<br />
Examples <strong>of</strong> these evidence-based strategies are described below.<br />
Hous<strong>in</strong>g First Model: <strong>The</strong> Hous<strong>in</strong>g First model was developed as an alternative to the<br />
paradigm that <strong>in</strong>dividuals need to achieve “hous<strong>in</strong>g read<strong>in</strong>ess” by atta<strong>in</strong><strong>in</strong>g sobriety,<br />
comply<strong>in</strong>g with psychiatric treatment, and learn<strong>in</strong>g skills for <strong>in</strong>dependent liv<strong>in</strong>g prior to<br />
qualify<strong>in</strong>g for a permanent hous<strong>in</strong>g placement. In contrast, the Hous<strong>in</strong>g First model is<br />
based on the tenet that hous<strong>in</strong>g is a basic right and should be provided without<br />
prerequisites; this harm reduction approach values consumers’ choices <strong>in</strong> terms <strong>of</strong> their<br />
own needs and read<strong>in</strong>ess for treatment or substance use reduction. While the Hous<strong>in</strong>g<br />
First model encourages the provision <strong>of</strong> supportive wraparound services, its use is not<br />
limited to permanent supportive hous<strong>in</strong>g, and the pr<strong>in</strong>ciples should be applied whenever<br />
hous<strong>in</strong>g services are provided to <strong>in</strong>dividuals experienc<strong>in</strong>g homelessness.<br />
Page 100 <strong>of</strong> 289
A review <strong>of</strong> 31 studies focus<strong>in</strong>g on outcomes associated with the Hous<strong>in</strong>g First model<br />
showed that the model resulted <strong>in</strong> faster hous<strong>in</strong>g placements than traditional treatmentdependent<br />
programs as well as <strong>in</strong>creased levels <strong>of</strong> hous<strong>in</strong>g retention, <strong>in</strong>clud<strong>in</strong>g among<br />
<strong>in</strong>dividuals with co-occurr<strong>in</strong>g substance dependence and mental disorders. <strong>The</strong><br />
<strong>in</strong>creased levels <strong>of</strong> hous<strong>in</strong>g retention also led to decreases <strong>in</strong> costly shelter use and<br />
fewer jail stays. In addition, several <strong>of</strong> the studies documented that participants reported<br />
a higher perceived quality <strong>of</strong> life and sense <strong>of</strong> choice. Conversely, <strong>in</strong> another study,<br />
<strong>in</strong>dividuals who had to enter <strong>in</strong>terim hous<strong>in</strong>g and wait for an available permanent<br />
hous<strong>in</strong>g placement reported worsen<strong>in</strong>g mental health symptoms, reduced their<br />
engagement with service providers, and had <strong>in</strong>consistent progress <strong>in</strong> non-hous<strong>in</strong>grelated<br />
recovery goals.<br />
Interventions <strong>in</strong>corporat<strong>in</strong>g the Hous<strong>in</strong>g First model are not limited to urban sett<strong>in</strong>gs.<br />
While rural sett<strong>in</strong>gs may have additional challenges (e.g., limited hous<strong>in</strong>g stock), the<br />
Hous<strong>in</strong>g First pr<strong>in</strong>ciples can be equally effective. An evaluation <strong>of</strong> Hous<strong>in</strong>g First<br />
<strong>in</strong>terventions implemented <strong>in</strong> rural areas <strong>in</strong> Vermont demonstrated an 85% hous<strong>in</strong>g<br />
retention rate over 3 years. A critical aspect <strong>of</strong> the successful implementation <strong>of</strong> this<br />
model was landlord engagement, particularly among tenants with crim<strong>in</strong>al histories or<br />
substance abuse disorders. In a study <strong>of</strong> landlord perceptions <strong>of</strong> participat<strong>in</strong>g <strong>in</strong><br />
Hous<strong>in</strong>g First, many <strong>of</strong> the landlords reported see<strong>in</strong>g the social value <strong>of</strong> help<strong>in</strong>g<br />
<strong>in</strong>dividuals <strong>in</strong>tegrate <strong>in</strong>to the community. <strong>The</strong>se landlords <strong>in</strong>dicated that they were more<br />
will<strong>in</strong>g to rent to tenants whom they would have not rented to before. Innovative landlord<br />
engagement at the community level can result <strong>in</strong> significantly <strong>in</strong>creased hous<strong>in</strong>g<br />
Page 101 <strong>of</strong> 289
opportunities for people experienc<strong>in</strong>g homelessness. Policies aimed at end<strong>in</strong>g and<br />
prevent<strong>in</strong>g homelessness should prioritize use <strong>of</strong> the Hous<strong>in</strong>g First model given its<br />
positive hous<strong>in</strong>g, health, and economic outcomes.<br />
Hous<strong>in</strong>g subsidies, <strong>in</strong>clud<strong>in</strong>g hous<strong>in</strong>g choice vouchers: More than 5.1 million low<strong>in</strong>come<br />
households <strong>in</strong> the United States receive federal rental assistance so that they<br />
can afford hous<strong>in</strong>g, with funds directed to elderly citizens, people with disabilities,<br />
veterans, and work<strong>in</strong>g families. Federal rental assistance is delivered through a number<br />
<strong>of</strong> programs, <strong>in</strong>clud<strong>in</strong>g public hous<strong>in</strong>g, Section 8 project-based hous<strong>in</strong>g, U.S.<br />
Department <strong>of</strong> Agriculture <strong>in</strong>itiatives, and the HCV program. <strong>The</strong> HCV program serves<br />
the largest number <strong>of</strong> households, 2.1 million, and allows very-low-<strong>in</strong>come families,<br />
<strong>in</strong>dividuals with disabilities, and the elderly to choose safe, affordable hous<strong>in</strong>g <strong>in</strong> the<br />
private market. Public hous<strong>in</strong>g agencies (PHAs) receive HUD fund<strong>in</strong>g to adm<strong>in</strong>ister the<br />
program and pay a subsidy directly to a landlord on behalf <strong>of</strong> the family; the family is<br />
responsible for the cost difference between the actual rent <strong>of</strong> the property and the<br />
subsidized amount, which is typically 30% <strong>of</strong> the family’s monthly adjusted <strong>in</strong>come.<br />
Federal rental assistance allows <strong>in</strong>dividuals and families to exit homelessness and<br />
greatly reduces hous<strong>in</strong>g <strong>in</strong>stability and overcrowd<strong>in</strong>g. In addition, research <strong>in</strong>to the<br />
effects <strong>of</strong> vouchers on families with children <strong>in</strong>dicates that voucher use cuts foster care<br />
placements <strong>in</strong> half (as children are not removed from homes due to hous<strong>in</strong>g <strong>in</strong>stability)<br />
and greatly reduces the number <strong>of</strong> moves from one school to another, which <strong>in</strong> turn<br />
improves academic performance and reduces behavioral and attention problems. By<br />
spend<strong>in</strong>g less on rent, families are also better able to meet food and other basic needs<br />
such as transportation, educational support for children, and health care. In HUD’s<br />
Family Options Study, which evaluated the effectiveness <strong>of</strong> various types <strong>of</strong> hous<strong>in</strong>g<br />
support for homeless families, researchers found substantial long-term benefits from the<br />
use <strong>of</strong> permanent supportive hous<strong>in</strong>g subsidies. Families who received priority access<br />
to these subsidies reduced their hous<strong>in</strong>g <strong>in</strong>stability by more than half, as evidenced by<br />
reductions <strong>in</strong> subsequent stays <strong>in</strong> shelters and places not meant for human habitation.<br />
<strong>The</strong>y also showed improvements <strong>in</strong> multiple measures <strong>of</strong> adult and child well-be<strong>in</strong>g and<br />
reduced their food <strong>in</strong>security.<br />
Permanent supportive hous<strong>in</strong>g: Permanent supportive hous<strong>in</strong>g is a comb<strong>in</strong>ation <strong>of</strong> safe,<br />
stable hous<strong>in</strong>g and supportive services for <strong>in</strong>dividuals who have serious mental<br />
illnesses or other disabl<strong>in</strong>g conditions and who need additional services to rema<strong>in</strong> stably<br />
housed. It is recognized by the Substance Abuse and Mental Health Services<br />
Adm<strong>in</strong>istration, HUD, and the U.S. Interagency Council on <strong>Homelessness</strong> as an<br />
evidence-based practice for chronically homeless <strong>in</strong>dividuals or those with complex<br />
health needs. Through this model, <strong>in</strong>dividuals receive flexible support based on their<br />
choices and needs, which can <strong>in</strong>clude case management, substance abuse or mental<br />
health counsel<strong>in</strong>g, assistance <strong>in</strong> <strong>in</strong>creas<strong>in</strong>g their <strong>in</strong>come through employment or<br />
disability benefits, tra<strong>in</strong><strong>in</strong>g <strong>in</strong> <strong>in</strong>dependent liv<strong>in</strong>g skills, vocational services, and other<br />
tenancy support services. <strong>The</strong>se supportive services are a critical part <strong>of</strong> improv<strong>in</strong>g<br />
hous<strong>in</strong>g stability outcomes <strong>in</strong> permanent hous<strong>in</strong>g programs. An example <strong>of</strong> a federal<br />
permanent supportive hous<strong>in</strong>g <strong>in</strong>itiative is the HUD-VASH (Veteran Affairs Supportive<br />
Page 102 <strong>of</strong> 289
Hous<strong>in</strong>g) Program, which comb<strong>in</strong>es HCV rental assistance for homeless veterans with<br />
case management and cl<strong>in</strong>ical services provided by the Department <strong>of</strong> Veterans Affairs<br />
(VA). From 2008 to 2015, more than 85,000 HUD-VASH vouchers were awarded. A<br />
review <strong>of</strong> research on permanent supportive hous<strong>in</strong>g showed that this model is effective<br />
<strong>in</strong> reduc<strong>in</strong>g homelessness, <strong>in</strong>creas<strong>in</strong>g hous<strong>in</strong>g stability, and reduc<strong>in</strong>g hospitalizations<br />
and ED use. <strong>The</strong>re are multiple types <strong>of</strong> permanent supportive hous<strong>in</strong>g programs that<br />
can facilitate better health outcomes and promote hous<strong>in</strong>g stability, <strong>in</strong>clud<strong>in</strong>g Hous<strong>in</strong>g<br />
First, harm reduction, and consumer-driven program designs.<br />
Numerous additional studies have documented that supportive hous<strong>in</strong>g for chronically<br />
homeless <strong>in</strong>dividuals reduces expensive ED usage. A study <strong>in</strong> Oregon revealed a 55%<br />
reduction <strong>in</strong> Medicaid claims for <strong>in</strong>dividuals 1 year after they obta<strong>in</strong>ed hous<strong>in</strong>g, while<br />
research <strong>in</strong> Chicago showed that hous<strong>in</strong>g and supportive services led to a 29%<br />
reduction <strong>in</strong> hospital days and a 24% reduction <strong>in</strong> ED visits. In addition, the New York<br />
Frequent Users Service Enhancement <strong>in</strong>itiative, which provided supportive hous<strong>in</strong>g to<br />
200 <strong>in</strong>dividuals with frequent jail and shelter stays, documented that 91% <strong>of</strong> participants<br />
rema<strong>in</strong>ed stably housed after 12 months, and annual total costs for crisis medical and<br />
behavioral health care services were reduced by $7,308 per person.<br />
<strong>The</strong> levels and types <strong>of</strong> support services <strong>of</strong>fered are <strong>in</strong>tentionally designed to be flexible<br />
and adaptive to the population be<strong>in</strong>g housed by a given program. <strong>The</strong> variety and extent<br />
<strong>of</strong> the service needs <strong>of</strong> tenants <strong>in</strong> permanent supportive hous<strong>in</strong>g must <strong>in</strong>fluence the<br />
types <strong>of</strong> services provided. Fund<strong>in</strong>g for effective permanent supportive hous<strong>in</strong>g program<br />
delivery should ensure appropriate staff-to-tenant ratios and services. Some tenant<br />
populations (particularly those with special needs) and services are more resource<br />
<strong>in</strong>tensive than others, requir<strong>in</strong>g programs to <strong>in</strong>crease the proportion <strong>of</strong> costs relative to<br />
hous<strong>in</strong>g subsidization and operat<strong>in</strong>g costs. Insufficient resources allocated to supportive<br />
Page 103 <strong>of</strong> 289
services result <strong>in</strong> underperformance with respect to program outcomes (e.g., hous<strong>in</strong>g<br />
<strong>in</strong>stability, unsafe conditions for tenants and staff).<br />
National Hous<strong>in</strong>g Trust Fund: <strong>The</strong> U.S. Congress established the National Hous<strong>in</strong>g<br />
Trust Fund (NHTF) under the Hous<strong>in</strong>g and <strong>Economic</strong> Recovery Act <strong>of</strong> 2008. This block<br />
grant, adm<strong>in</strong>istered by HUD, is <strong>in</strong>tended to supplement other federal and state efforts to<br />
provide safe, affordable hous<strong>in</strong>g for extremely low-<strong>in</strong>come households and families<br />
experienc<strong>in</strong>g homelessness. States are allocated a m<strong>in</strong>imum <strong>of</strong> $3 million per year and<br />
use these funds to acquire or construct new affordable hous<strong>in</strong>g units and rehabilitate<br />
exist<strong>in</strong>g units; 80% <strong>of</strong> the fund<strong>in</strong>g is dedicated to rental hous<strong>in</strong>g. <strong>The</strong> NHTF began<br />
receiv<strong>in</strong>g contributions from Freddie Mac and Fannie Mae <strong>in</strong> 2014, and HUD allocated<br />
the first $174 million <strong>in</strong> May 2016. This federal support for <strong>in</strong>creas<strong>in</strong>g the number <strong>of</strong><br />
affordable hous<strong>in</strong>g units is <strong>in</strong>valuable <strong>in</strong> terms <strong>of</strong> ensur<strong>in</strong>g hous<strong>in</strong>g stability and end<strong>in</strong>g<br />
homelessness; however, additional fund<strong>in</strong>g mechanisms to <strong>in</strong>crease contributions to the<br />
NHTF are necessary to ensure that states and the District <strong>of</strong> Columbia receive enough<br />
funds to support these goals.<br />
Increas<strong>in</strong>g <strong>in</strong>come support to promote hous<strong>in</strong>g stability: <strong>The</strong> federal strategy to end<br />
homelessness, Open<strong>in</strong>g Doors, emphasizes the need for <strong>in</strong>dividual economic security <strong>in</strong><br />
order to achieve hous<strong>in</strong>g stability. Programs aimed at <strong>in</strong>creas<strong>in</strong>g <strong>in</strong>come stability and<br />
f<strong>in</strong>ancial <strong>in</strong>dependence should be <strong>in</strong>tegrated <strong>in</strong>to hous<strong>in</strong>g and health <strong>in</strong>terventions, as<br />
the provision <strong>of</strong> hous<strong>in</strong>g alone will not be sufficient to end and prevent homelessness.<br />
In the case <strong>of</strong> <strong>in</strong>dividuals with disabl<strong>in</strong>g conditions, <strong>in</strong>creas<strong>in</strong>g access to Social Security<br />
disability benefit programs or VA disability benefits for veterans helps provide the cash<br />
benefits and health coverage that are key for hous<strong>in</strong>g retention. With respect to<br />
overcom<strong>in</strong>g barriers <strong>in</strong> application processes, research <strong>in</strong>dicates that comprehensive<br />
application assistance can <strong>in</strong>crease the approval rate for homeless <strong>in</strong>dividuals from<br />
28% to 73%. Additional research documents that programs provid<strong>in</strong>g SSI/SSDI<br />
application assistance to homeless <strong>in</strong>dividuals exit<strong>in</strong>g the justice system report<br />
<strong>in</strong>creased hous<strong>in</strong>g stability and reductions <strong>in</strong> rearrests and <strong>in</strong>carcerations, thus<br />
decreas<strong>in</strong>g system costs.<br />
Increas<strong>in</strong>g <strong>in</strong>come stability through employment is also critical to hous<strong>in</strong>g stability, and<br />
while unemployment rates are high among <strong>in</strong>dividuals experienc<strong>in</strong>g homelessness,<br />
research shows that most members <strong>of</strong> this population, particularly those with severe<br />
mental illness, want to work and are capable <strong>of</strong> work<strong>in</strong>g. Supportive employment<br />
services have documented success <strong>in</strong> <strong>in</strong>creas<strong>in</strong>g access to and retention <strong>of</strong> competitive<br />
employment. A 2014 study revealed that, among <strong>in</strong>dividuals with psychiatric disabilities,<br />
those who received employer-provided accommodations for their disabilities worked<br />
7.68 more hours per month and reta<strong>in</strong>ed their job for almost 7 months longer; also, each<br />
job accommodation <strong>in</strong>dividuals received reduced their risk <strong>of</strong> job term<strong>in</strong>ation by almost<br />
13%. In addition, the Individual Placement and Support (IPS) model, which focuses on<br />
competitive employment, consumer preferences, rapid job search, and <strong>in</strong>dividualized<br />
job support and does not require extensive pre-employment read<strong>in</strong>ess or tra<strong>in</strong><strong>in</strong>g, has<br />
demonstrated success across 23 randomized controlled trials <strong>in</strong>volv<strong>in</strong>g <strong>in</strong>dividuals with<br />
Page 104 <strong>of</strong> 289
mental illnesses. Across these studies, an average <strong>of</strong> 60% <strong>of</strong> <strong>in</strong>dividuals us<strong>in</strong>g the IPS<br />
model obta<strong>in</strong>ed competitive employment; also, these <strong>in</strong>dividuals reta<strong>in</strong>ed their <strong>in</strong>itial job<br />
placement for 8 to 10 months and reported higher self-esteem and reduced mental<br />
health service use.<br />
<strong>Homelessness</strong> Prevention Programs: While <strong>in</strong>terventions for those experienc<strong>in</strong>g<br />
literal homelessness are critical, public policy and resources should also focus on<br />
prevent<strong>in</strong>g homelessness, particularly among youths, families, and veterans. Youths<br />
exit<strong>in</strong>g foster care are at high risk <strong>of</strong> homelessness due to lack <strong>of</strong> social support, poorer<br />
health outcomes, and underemployment, and many young homeless families are led by<br />
those who recently exited foster care. Homeless prevention programs for youths<br />
transition<strong>in</strong>g from foster care should <strong>in</strong>clude <strong>in</strong>creased access to mentor<strong>in</strong>g,<br />
employment and education support, and connection with permanent hous<strong>in</strong>g. In<br />
addition to educational and vocational resources, supportive services for families who<br />
are at risk <strong>of</strong> homelessness should focus on identify<strong>in</strong>g and address<strong>in</strong>g developmental<br />
delays <strong>in</strong> children, <strong>in</strong>creas<strong>in</strong>g access to treatment for parental substance abuse or<br />
mental health conditions, and provid<strong>in</strong>g parental support. Multidiscipl<strong>in</strong>ary teams<br />
work<strong>in</strong>g across schools, cl<strong>in</strong>ics, and social services are critical <strong>in</strong> identify<strong>in</strong>g children<br />
and families <strong>in</strong> need and arrang<strong>in</strong>g for appropriate resources.<br />
In the case <strong>of</strong> veterans who are at risk <strong>of</strong> homelessness, the VA has dedicated more<br />
than $1 billion <strong>in</strong> fund<strong>in</strong>g for homelessness prevention and rapid rehous<strong>in</strong>g <strong>in</strong>itiatives<br />
Page 105 <strong>of</strong> 289
through the Supportive Services for Veteran Families (SSVF) program. In the first four<br />
years <strong>of</strong> the program, which began <strong>in</strong> 2012, SSVF served more than 238,000 veterans,<br />
and 87% <strong>of</strong> those who received homelessness prevention assistance were able to<br />
access or ma<strong>in</strong>ta<strong>in</strong> permanent hous<strong>in</strong>g at the end <strong>of</strong> the assistance, which lasted 96<br />
days on average. More than half <strong>of</strong> veterans served through SSVF have one or more<br />
disabl<strong>in</strong>g conditions, and most (70%) earned less than 30% <strong>of</strong> the median <strong>in</strong>come <strong>in</strong><br />
their area upon program entrance. <strong>The</strong> SSVF program achieves successful<br />
homelessness prevention by provid<strong>in</strong>g time-limited cash assistance comb<strong>in</strong>ed with<br />
targeted service-<strong>in</strong>tensive <strong>in</strong>terventions to support access to employment and benefits.<br />
<strong>The</strong> VA has shown that limited-cost, short-term prevention efforts can be successful <strong>in</strong><br />
rega<strong>in</strong><strong>in</strong>g hous<strong>in</strong>g stability, and further research should explore the applicability <strong>of</strong> such<br />
f<strong>in</strong>d<strong>in</strong>gs to other subpopulations.<br />
Evaluations <strong>of</strong> programs aim<strong>in</strong>g to prevent homelessness have yielded mixed results. In<br />
New York City, one such program was shown to reduce new shelter entries by 5% to<br />
11% on average. Shelter length <strong>of</strong> stay, while not typically a targeted outcome <strong>of</strong><br />
prevention programs, nevertheless does not appear to be effected by prevention efforts.<br />
HUD’s <strong>Homelessness</strong> Prevention and Rapid Re-Hous<strong>in</strong>g Program was discont<strong>in</strong>ued <strong>in</strong><br />
2012 after demonstrat<strong>in</strong>g only mixed success. However, the lack <strong>of</strong> any <strong>in</strong>crease <strong>in</strong><br />
homelessness from 2009 to 2012 dur<strong>in</strong>g an economic recession <strong>in</strong> the United States<br />
has been attributed to large-scale <strong>in</strong>creases <strong>in</strong> prevention fund<strong>in</strong>g. In addition, many<br />
lessons were learned from the implementation <strong>of</strong> that program, and these lessons have<br />
led to a better understand<strong>in</strong>g <strong>of</strong> how to generate and measure program impact. Other<br />
countries, such as England and Germany, have documented greater success <strong>in</strong><br />
homeless prevention programs; however, these countries have more widely available<br />
hous<strong>in</strong>g subsidies, greater access to public or social hous<strong>in</strong>g, and more flexible cash<br />
assistance.<br />
Constructive Alternatives to <strong>The</strong> Crim<strong>in</strong>alization <strong>of</strong> <strong>Homelessness</strong>: Many states<br />
and municipalities cont<strong>in</strong>ue to pass laws that crim<strong>in</strong>alize behaviors associated with<br />
homelessness, such as shar<strong>in</strong>g food and loiter<strong>in</strong>g. While some <strong>of</strong> these laws have been<br />
struck down, many more are tak<strong>in</strong>g up costly resources to enforce and are <strong>in</strong>effective <strong>in</strong><br />
reduc<strong>in</strong>g homelessness or the crim<strong>in</strong>alized behavior they are <strong>in</strong>tended to deter.<br />
Internationally, human rights courts and national constitutional courts are <strong>in</strong>creas<strong>in</strong>gly<br />
recogniz<strong>in</strong>g a fundamental right to hous<strong>in</strong>g and pursu<strong>in</strong>g hous<strong>in</strong>g-related solutions to<br />
these behaviors, rather than a crim<strong>in</strong>al remedy. As a result, it is critical for communities<br />
<strong>in</strong> the United States to adopt constructive alternatives to crim<strong>in</strong>aliz<strong>in</strong>g basic lifesusta<strong>in</strong><strong>in</strong>g<br />
activities that <strong>in</strong>dividuals must perform <strong>in</strong> public spaces if there is no shelter<br />
or hous<strong>in</strong>g available.<br />
<strong>The</strong> hous<strong>in</strong>g-focused solutions detailed above are critical to reduc<strong>in</strong>g the behaviors that<br />
these laws are designed to deter. Individuals and families who have a safe, permanent<br />
place to live will no longer need to sleep <strong>in</strong> public or be targeted as loiter<strong>in</strong>g. However,<br />
while pursu<strong>in</strong>g hous<strong>in</strong>g is the ultimate goal, decrim<strong>in</strong>aliz<strong>in</strong>g the life-susta<strong>in</strong><strong>in</strong>g behaviors<br />
<strong>of</strong> people experienc<strong>in</strong>g homelessness and recogniz<strong>in</strong>g their fundamental human rights<br />
are essential. Money spent on enforcement <strong>of</strong> these laws could <strong>in</strong>stead be spent on<br />
Page 106 <strong>of</strong> 289
develop<strong>in</strong>g affordable hous<strong>in</strong>g options, re<strong>in</strong>vest<strong>in</strong>g <strong>in</strong> community services for homeless<br />
citizens, or establish<strong>in</strong>g street outreach teams to <strong>in</strong>crease engagement <strong>in</strong> services.<br />
<strong>Homelessness</strong> outreach teams staffed by police <strong>of</strong>ficers <strong>in</strong> Houston, M<strong>in</strong>nesota, and<br />
Milwaukee have proved successful <strong>in</strong> divert<strong>in</strong>g homeless <strong>in</strong>dividuals away from jails<br />
when they are <strong>in</strong> a mental health crisis, sav<strong>in</strong>g the crim<strong>in</strong>al justice system additional<br />
funds. F<strong>in</strong>ally, many cities and states across the country have enacted a homeless bill<br />
<strong>of</strong> rights, which is legislation that prohibits the crim<strong>in</strong>alization <strong>of</strong> homelessness and<br />
discrim<strong>in</strong>ation aga<strong>in</strong>st those experienc<strong>in</strong>g homelessness. <strong>The</strong>se rights <strong>in</strong>clude the right<br />
to move freely <strong>in</strong> public places, share food, rest, and ask for donations while be<strong>in</strong>g<br />
protected from harassment from police or others.<br />
Summary: In conclusion, there is no s<strong>in</strong>gle strategy sufficient to completely address or<br />
end homelessness. Interventions <strong>in</strong> hous<strong>in</strong>g, health, and <strong>in</strong>come stabilization should be<br />
holistically <strong>in</strong>tegrated, allow<strong>in</strong>g <strong>in</strong>dividuals experienc<strong>in</strong>g homelessness to f<strong>in</strong>d their<br />
unique path to recovery. Further <strong>in</strong>novations and strategic <strong>in</strong>terventions beyond the<br />
currently accepted evidence-based strategies will likely be required to achieve this goal.<br />
Such <strong>in</strong>novations will require <strong>in</strong>terdiscipl<strong>in</strong>ary and cross-sector collaboration, <strong>in</strong>clud<strong>in</strong>g<br />
coord<strong>in</strong>ated, focused efforts from policymakers, governmental agencies, social services<br />
agencies, the health care <strong>in</strong>dustry, and researchers.<br />
Page 107 <strong>of</strong> 289
Oppos<strong>in</strong>g Arguments<br />
Those oppos<strong>in</strong>g state fund<strong>in</strong>g for shelters, permanent hous<strong>in</strong>g, and social welfare<br />
programs for the homeless <strong>of</strong>ten cite systemic <strong>in</strong>efficiencies and fraud. <strong>The</strong>y claim that<br />
these funds could be better used to create jobs or provide family and career counsel<strong>in</strong>g.<br />
Others argue that s<strong>in</strong>ce an <strong>in</strong>dividual is responsible for his or her homelessness,<br />
provid<strong>in</strong>g such support is immoral because it creates a culture <strong>of</strong> dependency and<br />
encourages free-riders. <strong>The</strong> argument that “homelessness is a choice” <strong>in</strong>cludes the<br />
belief that <strong>in</strong>dividuals are choos<strong>in</strong>g not to work, and thus to not have <strong>in</strong>come for<br />
hous<strong>in</strong>g, and the belief that <strong>in</strong>dividuals are homeless through “deviant” life choices such<br />
as us<strong>in</strong>g drugs or alcohol. However, these l<strong>in</strong>es <strong>of</strong> argument disregard the health and<br />
economic factors lead<strong>in</strong>g to homelessness (as discussed above). Be<strong>in</strong>g homeless is a<br />
complex issue cover<strong>in</strong>g <strong>in</strong>dividual adults and children, as well as two-person and s<strong>in</strong>gleparent<br />
families.<br />
Respond<strong>in</strong>g to homeless families raises some complex ethical issues, such as whether<br />
it is better to keep children with parents <strong>in</strong> a homeless shelter or whether or not to return<br />
abuse victims to potentially dangerous situations. While these concerns are valid and<br />
could be addressed if better evidence were made available, this does not preclude the<br />
need to provide support to families and their children <strong>in</strong> times <strong>of</strong> need. Children who<br />
experience family homelessness are at risk <strong>of</strong> higher stress levels, health problems, and<br />
need for pediatric health care, which also <strong>in</strong>creases costs to the overall system when<br />
<strong>in</strong>terventions to address episodes <strong>of</strong> homelessness are not addressed.<br />
In addition, there is political and philosophical opposition to prioritiz<strong>in</strong>g social services<br />
for hous<strong>in</strong>g and homeless programs (so-called “political will”) with<strong>in</strong> governmental<br />
entities and <strong>in</strong> communities at large that contribute their taxes to such programs and<br />
elect representatives to reflect such priorities. Under-prioritization <strong>of</strong> such services tends<br />
to disregard the preventative and cost-sav<strong>in</strong>g characteristics <strong>of</strong> social services aimed at<br />
address<strong>in</strong>g homelessness and <strong>in</strong>stead focuses on opportunity cost trade-<strong>of</strong>fs and a<br />
cost-m<strong>in</strong>imization approach to governance. This means that such political will fails to<br />
recognize the costs <strong>of</strong> services already be<strong>in</strong>g supported to address the adverse effects<br />
<strong>of</strong> homelessness such as health care and crim<strong>in</strong>al justice system costs.<br />
Another political solution <strong>of</strong>ten pr<strong>of</strong>fered comes <strong>in</strong> the form <strong>of</strong> exclusionary or punitive<br />
policies tasked to law enforcement services. <strong>The</strong>se policies, such as bans on<br />
panhandl<strong>in</strong>g or sleep<strong>in</strong>g <strong>in</strong> public, are counterproductive to the <strong>in</strong>terventional objectives<br />
<strong>of</strong> hous<strong>in</strong>g and homelessness agencies. However, these services have been shown to<br />
stem from socialized reactions such as disgust or a desire for physical separation from<br />
symbols <strong>of</strong> poverty, and they were not derived from evidence-based or outcomeoriented<br />
solutions. Instead, these policies are studied <strong>in</strong> similar terms to the microaggression<br />
phenomena associated with homelessness, such as dangerousness,<br />
assumptions <strong>of</strong> substance abuse, laz<strong>in</strong>ess, and <strong>in</strong>tellectual <strong>in</strong>feriority. Such negative<br />
public perceptions <strong>of</strong> <strong>in</strong>dividuals experienc<strong>in</strong>g homelessness also implicitly support and<br />
bolster counterarguments to implementation <strong>of</strong> hous<strong>in</strong>g and homelessness services.<br />
Page 108 <strong>of</strong> 289
While the HCV program provides much-needed assistance to <strong>in</strong>dividuals experienc<strong>in</strong>g<br />
homelessness, critics argue that wait<strong>in</strong>g lists for these vouchers are extensive, with<br />
many PHAs not accept<strong>in</strong>g new applicants and many eligible voucher holders wait<strong>in</strong>g 2<br />
years for an available unit. PHAs are constra<strong>in</strong>ed by the amount <strong>of</strong> funds they receive<br />
from HUD and cannot serve every household that qualifies for the program; as a result,<br />
PHAs must ration vouchers and have wide discretion over eligibility criteria.<br />
Furthermore, a recent meta-analysis <strong>of</strong> the program documents that participants are not<br />
mov<strong>in</strong>g to areas <strong>of</strong> lower poverty, thus not fulfill<strong>in</strong>g one <strong>of</strong> the program aims <strong>of</strong><br />
deconcentrat<strong>in</strong>g areas <strong>of</strong> poverty, and that almost one third <strong>of</strong> qualify<strong>in</strong>g families are<br />
return<strong>in</strong>g vouchers unused. Limitations on voucher usage result from a variety <strong>of</strong><br />
factors, <strong>in</strong>clud<strong>in</strong>g participants not be<strong>in</strong>g able to afford a security deposit, lengthy wait<br />
times for PHA <strong>in</strong>spections <strong>of</strong> properties before move-<strong>in</strong>, and unpredictable tim<strong>in</strong>g <strong>of</strong><br />
voucher availability. In addition, <strong>in</strong>dividual landlords have the choice <strong>of</strong> whether or not to<br />
accept vouchers from applicants, which decreases the geographic and socioeconomic<br />
range <strong>of</strong> sites available to those access<strong>in</strong>g the program. However, many <strong>of</strong> these<br />
limitations can be overcome through adequately fund<strong>in</strong>g the HCV program to reduce<br />
wait<strong>in</strong>g lists and <strong>in</strong>creas<strong>in</strong>g the stability <strong>of</strong> voucher availability. In addition, programs that<br />
foster <strong>in</strong>come stability and f<strong>in</strong>ancial <strong>in</strong>dependence can enable families to return<br />
Page 109 <strong>of</strong> 289
vouchers when they are no longer needed, allow<strong>in</strong>g PHAs to target voucher use toward<br />
families with the highest needs.<br />
Such regulatory limits to the effectiveness <strong>of</strong> hous<strong>in</strong>g vouchers also play a role <strong>in</strong> the<br />
causal pathway to homelessness, along with limit<strong>in</strong>g the effectiveness <strong>of</strong> <strong>in</strong>terventions<br />
to resolve it. <strong>Economic</strong> conditions such as fluctuations <strong>in</strong> wage and employment levels,<br />
the ris<strong>in</strong>g costs <strong>of</strong> hous<strong>in</strong>g even at the lowest levels, and <strong>in</strong>come or wage gaps all play a<br />
part <strong>in</strong> driv<strong>in</strong>g <strong>in</strong>dividuals <strong>in</strong>to episodes <strong>of</strong> homelessness, <strong>in</strong>creas<strong>in</strong>g the complexity <strong>of</strong><br />
the problem. Similarly, beyond such economic drivers, there are a wide range <strong>of</strong><br />
reasons why <strong>in</strong>dividuals become homeless. Families may experience homelessness as<br />
a result <strong>of</strong> conditions <strong>in</strong> or outside <strong>of</strong> their control, such as unsafe home environments,<br />
traumatic or violent events, natural disasters, unexpected costs that overwhelm f<strong>in</strong>ancial<br />
safety nets, and temporary lapses <strong>in</strong> availability for employment. <strong>The</strong>se complexities<br />
can be po<strong>in</strong>ted to as a reason for programs’ <strong>in</strong>ability to “end” homelessness, but they do<br />
not eclipse support for expansion <strong>of</strong> programs that seek to solve current homelessness<br />
or prevent future homelessness from occurr<strong>in</strong>g.<br />
This issue <strong>of</strong> complex economic, systemic, and social drivers is also connected to the<br />
notion that hous<strong>in</strong>g support and other homelessness services will end up be<strong>in</strong>g a<br />
permanent crutch to <strong>in</strong>dividuals access<strong>in</strong>g them. In fact, such a model <strong>of</strong> homelessness<br />
simultaneously supports the case that homelessness is <strong>in</strong> some ways beyond the<br />
control <strong>of</strong> the <strong>in</strong>dividuals it affects, contrary to the aforementioned negative perceptions<br />
held by political entities and members <strong>of</strong> society. If the complex web <strong>of</strong> causes <strong>of</strong><br />
homelessness stems even <strong>in</strong> part from factors external to <strong>in</strong>dividual behaviors or<br />
characteristics, then <strong>in</strong>terventions <strong>in</strong>tended to either temporarily or systematically<br />
remedy those factors cannot be dismissed outright.<br />
F<strong>in</strong>ally, the popular media <strong>of</strong>ten cites widespread fraud <strong>in</strong> social programs as a reason<br />
to defund hous<strong>in</strong>g and <strong>in</strong>come support services. Despite media portrayals <strong>of</strong><br />
widespread disability fraud, the Social Security Adm<strong>in</strong>istration found <strong>in</strong> 2012 that only<br />
1% <strong>of</strong> payments were <strong>in</strong>accurate and that most cases <strong>of</strong> fraud are detected prior to an<br />
<strong>in</strong>dividual receiv<strong>in</strong>g payment. Similarly, HUD found that just over 1% <strong>of</strong> families liv<strong>in</strong>g <strong>in</strong><br />
public hous<strong>in</strong>g exceeded <strong>in</strong>come limits, and the agency has taken action to encourage<br />
PHAs to withdraw vouchers from these families and target vouchers to those with the<br />
highest needs.<br />
Action Steps<br />
This policy statement represents APHA’s strong commitment to end<strong>in</strong>g and prevent<strong>in</strong>g<br />
homelessness. As a means <strong>of</strong> reach<strong>in</strong>g this goal, APHA:<br />
1. Calls upon federal agencies such as HUD and the U.S. Department <strong>of</strong> Health<br />
and Human Services, states, and local providers <strong>of</strong> hous<strong>in</strong>g and homelessness<br />
services to promote programs that demonstrate adherence to the Hous<strong>in</strong>g First<br />
model, prioritiz<strong>in</strong>g low-barrier access to hous<strong>in</strong>g for <strong>in</strong>dividuals experienc<strong>in</strong>g<br />
homelessness across all hous<strong>in</strong>g program types, with an emphasis on harm<br />
Page 110 <strong>of</strong> 289
eduction approaches to hous<strong>in</strong>g and consumer-driven program designs and<br />
structures.<br />
2. Urges Congress to adequately appropriate funds for rental assistance options,<br />
<strong>in</strong>clud<strong>in</strong>g the HCV program, to ensure that HUD and the U.S. Department <strong>of</strong><br />
Agriculture can meet future commitments and community needs for affordable<br />
hous<strong>in</strong>g.<br />
3. Urges Congress to identify additional fund<strong>in</strong>g mechanisms for the National<br />
Hous<strong>in</strong>g Trust Fund to ensure that states receive adequate fund<strong>in</strong>g to <strong>in</strong>crease<br />
the availability <strong>of</strong> affordable hous<strong>in</strong>g units.<br />
4. Urges federal, state, and local agencies fund<strong>in</strong>g hous<strong>in</strong>g and homelessness<br />
services to expand their commitments to provide resources for permanent<br />
supportive hous<strong>in</strong>g programs, rapid rehous<strong>in</strong>g programs, and prevention <strong>of</strong><br />
homelessness appropriate to levels <strong>of</strong> unmet need, as demonstrated <strong>in</strong> federal<br />
reports.<br />
5. Calls upon federal, state, and local agencies fund<strong>in</strong>g or provid<strong>in</strong>g regulatory<br />
oversight for hous<strong>in</strong>g and homelessness services to provide sufficient fund<strong>in</strong>g for<br />
supportive services <strong>in</strong> all hous<strong>in</strong>g and homelessness <strong>in</strong>terventions and flexible<br />
Page 111 <strong>of</strong> 289
program budget<strong>in</strong>g to permit appropriate funds for supportive services to meet<br />
the greater needs <strong>of</strong> high-acuity populations.<br />
6. Urges federal, state, and local agencies fund<strong>in</strong>g hous<strong>in</strong>g and homelessness<br />
services to adopt a “health <strong>in</strong> all policies” approach to policy decision mak<strong>in</strong>g by<br />
<strong>in</strong>corporat<strong>in</strong>g health considerations <strong>in</strong>to impact estimates, evaluations, and<br />
report<strong>in</strong>g across all sectors and policy-mak<strong>in</strong>g or policy-guid<strong>in</strong>g entities <strong>in</strong>volved<br />
with hous<strong>in</strong>g and homeless services.<br />
7. Calls upon federal, state, and local agencies to identify and adopt alternative<br />
solutions to crim<strong>in</strong>aliz<strong>in</strong>g homelessness, <strong>in</strong>clud<strong>in</strong>g adoption <strong>of</strong> a homeless bill <strong>of</strong><br />
rights.<br />
8. Urges federal, state, and local agencies fund<strong>in</strong>g hous<strong>in</strong>g and homelessness<br />
services to support tailor<strong>in</strong>g <strong>of</strong> <strong>in</strong>terventions for special populations demonstrated<br />
to be at excess risk <strong>of</strong> homelessness, particularly vulnerable while homeless, or<br />
disparately access<strong>in</strong>g or receiv<strong>in</strong>g hous<strong>in</strong>g or homelessness services.<br />
9. Calls upon federal, state, and local agencies to promote allocation <strong>of</strong> expanded<br />
and new funds for services that target prevention <strong>of</strong> homelessness, <strong>in</strong>clud<strong>in</strong>g<br />
rental assistance, outreach to schools and low-<strong>in</strong>come communities, and<br />
vocational and educational resources and supportive services for families found<br />
to be at risk <strong>of</strong> homelessness.<br />
10. Calls upon federal, state, and local agencies to provide comprehensive<br />
assistance to homeless <strong>in</strong>dividuals with disabl<strong>in</strong>g conditions <strong>in</strong> apply<strong>in</strong>g for any<br />
disability benefits for which they qualify.<br />
11. Calls upon federal, state, and local agencies to promote allocation <strong>of</strong> funds and<br />
services that provide <strong>in</strong>dividualized employment support and tra<strong>in</strong><strong>in</strong>g to assist<br />
homeless <strong>in</strong>dividuals <strong>in</strong> obta<strong>in</strong><strong>in</strong>g competitive employment.<br />
12. Calls upon federal, state, and local agencies to promote regulatory opportunities<br />
and provide technical assistance highlight<strong>in</strong>g improved <strong>in</strong>tegration <strong>of</strong><br />
occupational tra<strong>in</strong><strong>in</strong>g, mental health care, primary health care, medicolegal and<br />
legal services, and other ancillary services <strong>in</strong>to hous<strong>in</strong>g or homelessness<br />
program services.<br />
13. Urges federal, state, and local agencies to <strong>in</strong>crease fund<strong>in</strong>g for academic and<br />
community-based research to develop the necessary evidence base for current<br />
<strong>in</strong>terventions and evaluate the impact <strong>of</strong> new programs as they are developed,<br />
<strong>in</strong>corporat<strong>in</strong>g guidance from consumer priorities and the expertise <strong>of</strong> the scientific<br />
community.<br />
________<br />
Page 112 <strong>of</strong> 289
Assess<strong>in</strong>g the Role <strong>of</strong> Public Hous<strong>in</strong>g Agencies <strong>in</strong><br />
Address<strong>in</strong>g <strong>Homelessness</strong><br />
U.S. Department <strong>of</strong> Hous<strong>in</strong>g and Urban Development<br />
PD&R Edge Onl<strong>in</strong>e Magaz<strong>in</strong>e<br />
Although the number <strong>of</strong> people <strong>in</strong> the United States who experienced homelessness<br />
decl<strong>in</strong>ed by more than 8 percent between 2007 and 2013, homelessness rema<strong>in</strong>s a<br />
press<strong>in</strong>g problem. As many as 1.5 million people stay <strong>in</strong> emergency shelters or<br />
transitional hous<strong>in</strong>g at some time over the course <strong>of</strong> a year — a number that does not<br />
<strong>in</strong>clude those who require but do not receive such assistance. HUD is committed to<br />
address<strong>in</strong>g homelessness and work<strong>in</strong>g toward the goals outl<strong>in</strong>ed <strong>in</strong> the Obama<br />
adm<strong>in</strong>istration’s 2010 plan Open<strong>in</strong>g Doors: Federal Strategic Plan to Prevent and End<br />
<strong>Homelessness</strong>.<br />
A recent study commissioned by HUD’s Office <strong>of</strong> Policy Development and Research<br />
<strong>in</strong>vestigates how public hous<strong>in</strong>g agencies (PHAs) contribute to efforts to prevent and<br />
end homelessness — particularly through the adm<strong>in</strong>istration <strong>of</strong> their Hous<strong>in</strong>g Choice<br />
Voucher (HCV) and public hous<strong>in</strong>g programs. <strong>The</strong><br />
research, “Study <strong>of</strong> PHAs’ Efforts to Serve People<br />
Experienc<strong>in</strong>g <strong>Homelessness</strong>,” consisted <strong>of</strong> a web-based<br />
survey <strong>of</strong> the nearly 4,000 local PHAs (with an 80%<br />
response rate) and a follow-up telephone survey <strong>of</strong> 120<br />
selected PHAs. <strong>The</strong> surveys explore the extent to which<br />
PHAs make explicit efforts to target hous<strong>in</strong>g assistance to<br />
homeless households, the barriers PHAs face when<br />
assist<strong>in</strong>g people experienc<strong>in</strong>g homelessness, how PHAs<br />
<strong>in</strong>teract with community partners, and how HUD can help<br />
PHAs enhance their efforts to address homelessness.<br />
Key F<strong>in</strong>d<strong>in</strong>gs<br />
<strong>The</strong> study revealed, overall, that 24 percent <strong>of</strong> PHAs,<br />
controll<strong>in</strong>g 53 percent <strong>of</strong> all assisted hous<strong>in</strong>g units, make<br />
an explicit effort to target hous<strong>in</strong>g assistance to homeless households. For the purposes<br />
<strong>of</strong> this study, these efforts were described <strong>in</strong> three separate categories: 1) general<br />
preferences, which enable the PHA to purposefully order their wait<strong>in</strong>g list to ensure that<br />
hous<strong>in</strong>g resources reach specified populations ahead <strong>of</strong> those who may also be eligible<br />
for hous<strong>in</strong>g assistance, 2) limited preferences, which function similar to a general<br />
preference, but cap the number <strong>of</strong> vouchers or units that may be allocated to a specified<br />
population, and 3) modification <strong>of</strong> screen<strong>in</strong>g, which refers to changes <strong>in</strong> screen<strong>in</strong>g<br />
procedures or other policies that may serve as barriers to homeless households seek<strong>in</strong>g<br />
to access or utilize hous<strong>in</strong>g assistance.<br />
Page 113 <strong>of</strong> 289
Additional key f<strong>in</strong>d<strong>in</strong>gs concern which PHA characteristics are associated with targeted<br />
PHA efforts to serve homeless households.<br />
<br />
PHAs are more likely to make an effort to serve homeless households if the<br />
PHAs are large (adm<strong>in</strong>ister<strong>in</strong>g 5,000 or more units), are located <strong>in</strong> metropolitan<br />
areas or areas with large numbers <strong>of</strong> people experienc<strong>in</strong>g homelessness, have<br />
statewide jurisdictions, or participate <strong>in</strong> other local efforts to address<br />
homelessness, such as Cont<strong>in</strong>uums <strong>of</strong> Care (CoCs) — which are regional<br />
entities established to identify and coord<strong>in</strong>ate emergency, transitional, and<br />
permanent hous<strong>in</strong>g services for people experienc<strong>in</strong>g homelessness.<br />
PHA adm<strong>in</strong>istration <strong>of</strong> HUD McK<strong>in</strong>ney-Vento homeless assistance programs —<br />
Supportive Hous<strong>in</strong>g Program, Shelter Plus Care program, and Section 8 SRO<br />
Moderate Rehabilitation program — was found to have a statistically significant<br />
effect on the likelihood that a PHA would use a strong general preference. More<br />
than half <strong>of</strong> PHAs that adm<strong>in</strong>ister these programs make a special effort to serve<br />
people experienc<strong>in</strong>g homelessness.<br />
<br />
<br />
<br />
<br />
PHAs that adm<strong>in</strong>ister special-purpose vouchers (SPVs) for difficult-to-house<br />
groups such as nonelderly disabled persons are more likely to make efforts to<br />
serve people experienc<strong>in</strong>g homelessness; 45 percent <strong>of</strong> PHAs adm<strong>in</strong>ister<strong>in</strong>g<br />
SPVs make some effort to serve people experienc<strong>in</strong>g homelessness compared<br />
with 20 percent <strong>of</strong> those that do not adm<strong>in</strong>ister SPVs.<br />
Only 17 percent <strong>of</strong> PHAs that do not adm<strong>in</strong>ister HUD programs targeted at<br />
homeless households make efforts to serve persons experienc<strong>in</strong>g homelessness<br />
<strong>in</strong> their HCV and public hous<strong>in</strong>g programs.<br />
Small PHAs are less likely than larger ones to have established a limited<br />
preference for homeless households or modified screen<strong>in</strong>g processes, but they<br />
are just as likely as larger PHAs to use general preferences targeted to homeless<br />
households.<br />
It is more common for a limited preference for homeless households to be<br />
established with<strong>in</strong> both tenant-based and project-based voucher programs than<br />
public hous<strong>in</strong>g programs.<br />
Other factors, such as the culture <strong>of</strong> a PHA or the priorities <strong>of</strong> an executive director, may<br />
also <strong>in</strong>fluence a PHA’s engagement with homeless households, but these factors are<br />
difficult to measure. In addition, various real or perceived barriers may dissuade PHAs<br />
from engag<strong>in</strong>g <strong>in</strong> efforts to serve people experienc<strong>in</strong>g homelessness. <strong>The</strong> most<br />
common barrier cited by PHAs is concern that homeless applicants may be removed<br />
from the wait<strong>in</strong>g list because they lack a fixed address and cannot be found when the<br />
PHA is ready to make an <strong>of</strong>fer <strong>of</strong> assistance. Other barriers cited by PHAs <strong>in</strong>clude<br />
homeless households lack<strong>in</strong>g the necessary eligibility documentation, as well as<br />
need<strong>in</strong>g hous<strong>in</strong>g search or landlord assistance when us<strong>in</strong>g HCVs.<br />
Page 114 <strong>of</strong> 289
PHAs are serv<strong>in</strong>g formerly homeless households through numerous approaches. Many<br />
PHAs forge relationships with local public and nonpr<strong>of</strong>it community organizations to<br />
identify and help persons experienc<strong>in</strong>g homelessness. <strong>The</strong>se community partners may<br />
refer households to the PHA; help households prepare documentation to demonstrate<br />
eligibility for hous<strong>in</strong>g assistance; or <strong>of</strong>fer support services such as case management,<br />
food assistance, or employment and vocational tra<strong>in</strong><strong>in</strong>g.<br />
How HUD Can Encourage Further PHA Efforts<br />
<strong>The</strong>se research f<strong>in</strong>d<strong>in</strong>gs provide a basis for understand<strong>in</strong>g which types <strong>of</strong> PHAs are<br />
currently strongly engaged <strong>in</strong> address<strong>in</strong>g homelessness, and helps shed light on<br />
potential opportunities for PHAs that have previously not made special efforts to serve<br />
homeless households. Based on their f<strong>in</strong>d<strong>in</strong>gs, the researchers recommend that HUD<br />
encourage large PHAs to establish a limited preference for homeless households, and<br />
work with their local CoC on the target population to which the limited preference should<br />
be directed, and encourage smaller PHAs to establish a general preference for<br />
homeless households. <strong>The</strong> researchers suggest that PHAs <strong>of</strong> all sizes would benefit<br />
from tra<strong>in</strong><strong>in</strong>g to better understand and implement recent HUD guidel<strong>in</strong>es (PIH Notice<br />
2013–15 (HA)) that clarify def<strong>in</strong>itions <strong>of</strong> homelessness and permissible preference<br />
policies. HUD could also encourage PHAs to learn from one another and to partner with<br />
local groups that serve people experienc<strong>in</strong>g homelessness, especially CoCs.<br />
This study provides a po<strong>in</strong>t-<strong>in</strong>-time snapshot <strong>of</strong> PHA efforts to serve people<br />
experienc<strong>in</strong>g homelessness that can serve as a basel<strong>in</strong>e from which to measure future<br />
change. <strong>The</strong> f<strong>in</strong>d<strong>in</strong>gs should guide HUD <strong>in</strong> promot<strong>in</strong>g best practices and advocat<strong>in</strong>g for<br />
support as the Department cont<strong>in</strong>ues to help PHAs <strong>in</strong> their work to end homelessness <strong>in</strong><br />
their local community.<br />
Page 115 <strong>of</strong> 289
Page 116 <strong>of</strong> 289
VI. Public Assistance<br />
Pennsylvania<br />
Pennsylvania eviction prevention and Homeless Assistance Program.<br />
Families fac<strong>in</strong>g eviction or foreclosure <strong>in</strong> Pennsylvania can get help from the Homeless<br />
Assistance Program. This is adm<strong>in</strong>istered by non-pr<strong>of</strong>its across the state <strong>in</strong> partnership<br />
with the Pennsylvania Department <strong>of</strong> Public Welfare. Us<strong>in</strong>g government grants, there<br />
are emergency funds available for pay<strong>in</strong>g rent, energy bills, security deposits, and other<br />
hous<strong>in</strong>g expenses. For those that are currently homeless and seek<strong>in</strong>g a new home,<br />
support is <strong>of</strong>fered to them as well, <strong>in</strong>clud<strong>in</strong>g access to shelters and transitional hous<strong>in</strong>g.<br />
<strong>The</strong> state tries to take a pro-active approach to tack<strong>in</strong>g homelessness. Government<br />
<strong>of</strong>ficials and representatives from the various non-pr<strong>of</strong>its listed below know it is better<br />
for the <strong>in</strong>dividual, and less expensive for the state, to provide emergency help to stop<br />
the eviction or foreclosure from occurr<strong>in</strong>g <strong>in</strong> the first place. So this is a key goal <strong>of</strong> HAP.<br />
In addition to f<strong>in</strong>ancial support, <strong>in</strong>dividuals will have access to ongo<strong>in</strong>g case<br />
management services. Staff from an <strong>in</strong>take site will work with clients on identify<strong>in</strong>g<br />
their needs and challenges. This will touch on a number <strong>of</strong> topics, <strong>in</strong>clud<strong>in</strong>g budget<strong>in</strong>g,<br />
employment, and credit counsel<strong>in</strong>g.<br />
<strong>The</strong> objective to solve the underly<strong>in</strong>g cause <strong>of</strong> why someone became homeless <strong>in</strong> the<br />
first place or why they are fac<strong>in</strong>g eviction. Another goal <strong>of</strong> the Case Management<br />
component <strong>of</strong> Homeless Assistance Program is to provide clients with the tools and<br />
skills they need to ga<strong>in</strong> stability and end a cycle <strong>of</strong> homelessness.<br />
While the case management approach will vary by county and agency, the many<br />
services that may be available <strong>in</strong>clude, but are not limited to, home management,<br />
budget<strong>in</strong>g, life skills, job preparation, and referral to public benefits, if needed.<br />
Emergency rental or mortgage assistance may be <strong>of</strong>fered, depend<strong>in</strong>g on county and<br />
fund<strong>in</strong>g levels. Families fac<strong>in</strong>g eviction or foreclosure may qualify for help. In addition to<br />
that, the currently homeless may be <strong>of</strong>fered assistance with pay<strong>in</strong>g a security deposit as<br />
Page 117 <strong>of</strong> 289
part <strong>of</strong> HAP. Regardless, all emergency assistance is very limited, and some families<br />
may be issued a loan as part <strong>of</strong> the Homeless Assistance Program. Most <strong>of</strong> it is <strong>of</strong>fered<br />
on a first come and served basis to those that qualify.<br />
Your county will also <strong>of</strong>fer mediation and counsel<strong>in</strong>g with your landlord. In some case,<br />
free legal aid may be provided <strong>in</strong> an effort to stop the eviction from occurr<strong>in</strong>g. Grants<br />
that are issued from HAP may also be applied <strong>in</strong> order to move a family out <strong>of</strong> shelter<br />
<strong>in</strong>to a low <strong>in</strong>come apartment <strong>in</strong> Pennsylvania. So this is where a deposit or first months<br />
rent may be paid.<br />
Short term shelter is for the currently homeless. This is only for those with no<br />
permanent residence due to an eviction or foreclosure. <strong>The</strong>re are also shelters <strong>in</strong><br />
Pennsylvania for victims <strong>of</strong> domestic violence, veterans, children, and others. Guests <strong>of</strong><br />
the centers will also be provided with case management services to assist with secur<strong>in</strong>g<br />
employment, stability and more permanent hous<strong>in</strong>g.<br />
Vouchers for motels or hotels may be distributed <strong>in</strong> some counties us<strong>in</strong>g HAP funds.<br />
<strong>The</strong>se will be issued when all shelters are full. <strong>The</strong>y can generally be issued when the<br />
homeless families’ health or safety is at risk, such as dur<strong>in</strong>g cold w<strong>in</strong>ter weather or<br />
when a family (such as a s<strong>in</strong>gle mom) needs to keep their children safe. Or free<br />
vouchers can help <strong>in</strong>dividuals that were just evicted and that need a place for a nigh.<br />
Many charities may also <strong>of</strong>fer emergency motel vouchers.<br />
Those who exist the shelter may take part <strong>in</strong> the Pennsylvania Department <strong>of</strong> Public<br />
Welfare Bridge Hous<strong>in</strong>g. It is the state’s name for a transitional situation. It is the next<br />
step up from an emergency shelter to a permanent home. This service will allow <strong>in</strong>come<br />
qualified families to live <strong>in</strong> a shared facility or apartment for up to 18 months. <strong>The</strong>y will<br />
need to pay a portion <strong>of</strong> their <strong>in</strong>come for rent and receive support from case managers<br />
from the non-pr<strong>of</strong>it <strong>in</strong> their county. If the Bride program is not available, additional short<br />
term transitional hous<strong>in</strong>g programs may be provided.<br />
Organizations That Offer Homeless Assistance<br />
Adams County<br />
Courthouse, 117 Baltimore Street<br />
Gettysburg, Pennsylvania 17325<br />
Phone - (717) 337-9820<br />
Allegheny County<br />
Bureau <strong>of</strong> Hunger and Hous<strong>in</strong>g Services<br />
One Smithfield Street, Human Services Build<strong>in</strong>g, 2nd Floor,<br />
Pittsburgh, PA 15222-2225<br />
(412) 350-4354<br />
Whether it is a cash grant for a security deposit, or legal aid, non-pr<strong>of</strong>its will try to stop<br />
an eviction.<br />
Page 118 <strong>of</strong> 289
Armstrong County<br />
Community Action Agency<br />
705 Butler Road<br />
Kittann<strong>in</strong>g, PA 16201<br />
Telephone: (724) 548-3433<br />
Beaver County<br />
Community Services Program <strong>of</strong> Beaver County<br />
1013 8th Avenue<br />
Beaver Falls, PA 15010<br />
(724) 847-3889<br />
Bedford County<br />
Center for Community Action<br />
Address is 195 Drive In Lane<br />
Everett, Pennsylvania 15537<br />
(814) 643-4202<br />
Berks County<br />
Human Services/ Grants Coord<strong>in</strong>ator, County <strong>of</strong> Berks<br />
633 Court Street, 13th Floor<br />
Read<strong>in</strong>g, PA 19601<br />
Ma<strong>in</strong> number - (610) 478-6194<br />
Blair County<br />
Human Services Office<br />
423 Allegheny Street Suite 443<br />
Hollidaysburg, PA 16648-2022<br />
(814) 693-3112<br />
Bradford County<br />
Human Services<br />
220 Ma<strong>in</strong> Street, Unit One<br />
Towanda, Pennsylvania 18848<br />
(570) 265-1761<br />
Bucks County<br />
Opportunity Council<br />
Adm<strong>in</strong>istration Build<strong>in</strong>g, 100 Doyle Street<br />
Doylestown, PA 18901<br />
(215) 345-8175<br />
<strong>The</strong> Welfare Department runs the ESA program. This can provide f<strong>in</strong>ancial help to stop<br />
an eviction or homelessness as well as other support, <strong>in</strong>clud<strong>in</strong>g loans and more for<br />
rehous<strong>in</strong>g services.<br />
Page 119 <strong>of</strong> 289
Butler County<br />
Community Action Program<br />
Butler, PA 16003-1208<br />
(724) 284-5125<br />
Cambria County<br />
Human Services Department<br />
Location is Central Park Complex, 110 Frankl<strong>in</strong> Street, Suite 400<br />
Johnstown, PA 15901-1831<br />
Call the center at (814) 534-2658<br />
Cameron County<br />
Northern Tier Community Action Corp.<br />
P.O. Box 389<br />
Emporium, PA 15834<br />
(814) 486-1161<br />
Carbon County<br />
County Action Committee for Human Services<br />
267 South 2nd Street<br />
Leighton, Pennsylvania 18235<br />
(610) 377-6400<br />
Centre County<br />
Office <strong>of</strong> Adult Services<br />
Willowbank Office Build<strong>in</strong>g 420 Holmes Street<br />
Bellefonte, PA 16823<br />
(814) 355-6768<br />
Chester County<br />
Departments <strong>of</strong> Community Development<br />
Government Services Center, Suite 365, 601 Westtown Road, P.O. Box 2747<br />
West Chester, PA 19382-4541<br />
(610) 344-6900<br />
Clarion County<br />
Human Services Build<strong>in</strong>g<br />
214 South 7th Avenue, Suite B<br />
Clarion, PA 16214<br />
Ma<strong>in</strong> number - (814) 226-9280<br />
Clearfield County<br />
Central PA Community Action, Inc.<br />
P.O. Box 792, 207 East Cherry Street<br />
Clearfield, PA 16830<br />
(814) 765-1551 or (800) 822-2610<br />
Page 120 <strong>of</strong> 289
Cl<strong>in</strong>ton County<br />
Plann<strong>in</strong>g Commission,<br />
232 East Ma<strong>in</strong> Street<br />
Lock Haven, Pennsylvania 17745<br />
(570) 893-4081<br />
Columbia County<br />
Human Services Department, Courthouse Columbia County<br />
P.O. Box 380,<br />
Bloomsburg, PA 17015<br />
(570) 389-5700<br />
Crawford County<br />
Human Services<br />
18282 Technology Drive, Suite 101<br />
Meadville, PA 16335<br />
(814) 373-2613<br />
Cumberland County<br />
Ag<strong>in</strong>g and Community Services<br />
401 E. Louther St., Suite 204<br />
Carlisle, PA 17013<br />
Number for <strong>in</strong>take is (717) 243-4691<br />
Dauph<strong>in</strong> County<br />
Mental Health & Mental Retardation<br />
100 Chestnut Street<br />
Harrisburg, PA 17101<br />
Tel: (717) 780-7050<br />
Erie County<br />
Department <strong>of</strong> Human Services, Office <strong>of</strong> Mental Health & Mental Retardation<br />
154 West N<strong>in</strong>th Street<br />
Erie, PA 16501<br />
(814) 451-6800<br />
Fayette County<br />
Office <strong>of</strong> Human & Community Services, FACT Transit Center<br />
825 Airport Road<br />
Lemont Furnace, PA 15456<br />
(724) 628-7433<br />
Forest County<br />
Courthouse, 526 Elm Street, Box 3<br />
Page 121 <strong>of</strong> 289
Tionesta, Pennsylvania 16353<br />
(814) 755-3537<br />
Frankl<strong>in</strong> County<br />
Human Services<br />
425 Frankl<strong>in</strong> Farm Lane<br />
Chambersburg, Pennsylvania 17202<br />
Phone - (717) 263-5060<br />
Fulton County<br />
Services for Children<br />
219 North 2nd Street<br />
McConnellsburg, PA 17233<br />
(717) 485-3553<br />
Greene County<br />
Department <strong>of</strong> Human Services<br />
19 S. Wash<strong>in</strong>gton Street, Ft. Jackson Bldg. 3rd Floor<br />
Waynesburg, PA 15370<br />
(724) 852-5276<br />
Hunt<strong>in</strong>gdon County<br />
Center for Community Action<br />
207 Fifth Street<br />
Hunt<strong>in</strong>gdon, PA 16652<br />
(814) 643-4202 or 1 (888) 644-4202<br />
Indiana County<br />
Department <strong>of</strong> Human Services<br />
300 Indian Spr<strong>in</strong>gs Road, Suite 203, P.O. Box 187<br />
Indiana, PA 15701<br />
For <strong>in</strong>formation on rental or grant programs, dial (724) 463-8200<br />
Jefferson County<br />
Community Action, Inc.<br />
105 Grace Way, Millcreek Center<br />
Punxsutawney, PA 15767-1209<br />
(814) 938-3302<br />
Juniata County<br />
Miffl<strong>in</strong>/Juniata Human Services Department<br />
20 North Wayne Street<br />
Lewistown, PA 17044<br />
(717) 248-6733<br />
Page 122 <strong>of</strong> 289
Lackawanna County<br />
Department <strong>of</strong> Human Services<br />
200 Adams Avenue, 6th Flr.<br />
Scranton, PA 18503<br />
(570) 963-6790<br />
Other services are also available.<br />
Lancaster County<br />
Community Action Program<br />
601 South Queen Street Box 599<br />
Lancaster, PA, 17608<br />
(717) 299-7301<br />
Non-pr<strong>of</strong>its and the Department <strong>of</strong> Welfare coord<strong>in</strong>ate eviction prevention and<br />
rehous<strong>in</strong>g programs. While fund<strong>in</strong>g is limited, help is arranged for families liv<strong>in</strong>g <strong>in</strong><br />
poverty, senior citizens and others.<br />
Lawrence County<br />
Community Action Partnership<br />
241 West Grant Street, P.O. Box 189<br />
New Castle, Pennsylvania 16103<br />
Ma<strong>in</strong> number - (724) 658-7258<br />
Lebanon County<br />
Human Services<br />
503 Oak Street<br />
Lebanon, PA 17042<br />
(717) 273-9328<br />
Lehigh County<br />
Ag<strong>in</strong>g & Adult Services<br />
17 S. 7th St.<br />
Allentown PA 18101<br />
Dial 610-782-3179<br />
Homeless assistance from other non-pr<strong>of</strong>its <strong>in</strong> Lehigh County may be arranged too.<br />
Whether it is a free hotel voucher for the homeless, or grants to stop an eviction, various<br />
forms <strong>of</strong> assistance are provided by Allentown based agencies.<br />
Luzerne County<br />
Luzerne County Office <strong>of</strong> Human Services<br />
111 North Pennsylvania Boulevard<br />
Wilkes Barre, PA 18701<br />
(570) 826-8800<br />
Lycom<strong>in</strong>g County<br />
United Way<br />
Page 123 <strong>of</strong> 289
1225 Clayton Avenue<br />
Williamsport, PA 17701<br />
(570) 323-9448<br />
McKean County<br />
YWCA<br />
24 West Corydon Street<br />
Bradford, Pennsylvania 16701<br />
Dial (814) 368-4235 for details on the HAP - Homeless Assistance Program.<br />
Mercer County<br />
Shenango Valley Urban League<br />
601 Indiana Avenue<br />
Farrell, PA 16121<br />
(724) 981-5310<br />
Miffl<strong>in</strong> County<br />
Miffl<strong>in</strong>/Juniata Human Services Department<br />
20 North Wayne Street, Courthouse<br />
Lewistown, PA 17044<br />
(717) 242-5452<br />
Monroe County Adm<strong>in</strong>istrative Center<br />
One Quaker Plaza, Room 204<br />
Stroudsburg, PA 18360-2164<br />
(570) 517-3129<br />
Montgomery County<br />
Community Based Services, Office <strong>of</strong> Ag<strong>in</strong>g & Adult Services, Montgomery County<br />
Human Services Center<br />
Location 1430 Dekalb Street, P.O. Box 311<br />
Norristown, Pennsylvania 19404-0311<br />
Dial (610) 278-3601 for <strong>in</strong>formation on homeless prevention.<br />
Montour County<br />
Director <strong>of</strong> Human Services, Human Service Build<strong>in</strong>g<br />
112 Woodb<strong>in</strong>e Lane, Suite 3<br />
Danville, PA 17821<br />
(570) 271-3028<br />
Northhampton County<br />
Department <strong>of</strong> Human Services, Northampton County Government Center<br />
669 Wash<strong>in</strong>gton Street<br />
Easton, PA 18042-7491<br />
(610) 559-3010<br />
Page 124 <strong>of</strong> 289
Northumberland County Adult Services<br />
322 North Second Street, Build<strong>in</strong>g B-Second Floor<br />
Sunbury, PA 17801<br />
(570) 495-2204<br />
Perry County<br />
Human Service Department<br />
P.O. Box 436<br />
New Bloomfield, PA 17068<br />
(717) 582-8703<br />
Philadelphia County and City<br />
Office <strong>of</strong> Supportive Hous<strong>in</strong>g<br />
MSB-10th Floor, 1401 JFK Blvd.<br />
Philadelphia, Pennsylvania 19107<br />
(215) 686-7105<br />
Tenants that are <strong>in</strong> a crisis as well as the homeless can apply for help from local<br />
agencies. <strong>The</strong>re are a number <strong>of</strong> non-pr<strong>of</strong>its that may provide rental deposits, legal aid,<br />
or other forms <strong>of</strong> homeless prevention listed above and below.<br />
Pike County<br />
Human Services at the Adm<strong>in</strong>istration Build<strong>in</strong>g<br />
506 Broad Street<br />
Milford, PA 18337<br />
Telephone: (570) 296-3494<br />
Potter County<br />
Human Services<br />
P.O. Box 241, North Street<br />
Roulette, PA 16746<br />
Call - (814) 544-7315<br />
Schuylkill County<br />
Block Grant Programs<br />
Address: 420 North Centre Street, Room 6<br />
Pottsville, PA 17901<br />
Dial (570) 628-1190<br />
Somerset County<br />
Tableland Services, Inc.<br />
535 East Ma<strong>in</strong> Street<br />
Somerset, Pennsylvania 15501<br />
Telephone - (814) 445-9628<br />
Page 125 <strong>of</strong> 289
Sullivan County<br />
<strong>The</strong> Trehab Center<br />
10 Public Avenue<br />
P.O. Box 366<br />
Montrose, PA 18801<br />
(570) 278-5227<br />
Susquehanna County<br />
<strong>The</strong> Trehab Center<br />
10 Public Avenue, P.O. Box 366<br />
Montrose, PA 18801<br />
(570) 278-5227<br />
Tioga County<br />
Human Services<br />
Location is 1873 Shumway Hill Road<br />
P.O. Box 766<br />
Wellsboro, PA 16901<br />
(570) 724-5766<br />
Union County<br />
Union-Snyder Community Action Agency<br />
713 Bridge Street, Suite 10<br />
Sel<strong>in</strong>sgrove, PA 17870<br />
(570) 374-0181<br />
Venango County<br />
Office <strong>of</strong> <strong>Economic</strong> Opportunity<br />
1 Dale Avenue, P.O. Box 1130<br />
Frankl<strong>in</strong>, PA 16323<br />
(814) 432-9767<br />
Warren County<br />
<strong>Economic</strong> Opportunity Council<br />
1209 Pennsylvania West, P.O. Box 16365<br />
Warren, Pennsylvania 16365<br />
(814) 726-2400<br />
Wash<strong>in</strong>gton County<br />
Homeless Services<br />
100 West Beau Street, Suite 703<br />
Wash<strong>in</strong>gton, PA 15301<br />
Ma<strong>in</strong> number is (724) 228-5935<br />
Wayne County<br />
<strong>The</strong> Trehab Center, Susquehanna / Wayne Counties<br />
Page 126 <strong>of</strong> 289
10 Public Avenue, P.O. Box 366<br />
Montrose, PA 18801<br />
For <strong>in</strong>formation, dial (570) 278-3338<br />
Westmoreland County<br />
Department <strong>of</strong> Human Services<br />
Location is 2 North Ma<strong>in</strong> Street, Room 303<br />
Greensburg, PA 15601<br />
Ma<strong>in</strong> phone number is (724) 830-3305<br />
Wyom<strong>in</strong>g County<br />
Commission on <strong>Economic</strong> Opportunity, Wyom<strong>in</strong>g County Division<br />
P. O. Box 74<br />
Tunkhannock, Pennsylvania 18657<br />
(570) 836-4090<br />
York County<br />
Department <strong>of</strong> Human Services<br />
100 West Market Street, Suite 401<br />
York, PA 17401<br />
Ma<strong>in</strong> phone - (717) 771-9347<br />
<strong>The</strong> homeless can apply for rental or utility deposits, and families with a vacate notice<br />
may be provided help as well. Various support services are arranged.<br />
________<br />
Nationwide<br />
National Coalition for the Homeless<br />
AZ » DIRECTORY<br />
<strong>The</strong>re are lots <strong>of</strong> great organizations work<strong>in</strong>g to help prevent and end homelessness<br />
and hunger across the country. Search NCH’s Directory <strong>of</strong> Member and Advocacy<br />
programs, or f<strong>in</strong>d further resources below.<br />
National Directories and Resources:<br />
Homeless Shelter Directory | Shelter List<strong>in</strong>gs<br />
Health Care providers | Shelters allow<strong>in</strong>g pets | Women’s Shelters | Homeless<br />
Accommodation Directory | Transitional Hous<strong>in</strong>g | Food Pantries | Sleep Study and<br />
Accommodation Directory<br />
Page 127 <strong>of</strong> 289
HUD Resources | HUD Local Offices | Homeless Cont<strong>in</strong>uum <strong>of</strong> Care | SAMHSA<br />
<strong>Homelessness</strong> and Hous<strong>in</strong>g Resources | Federal Affordable Hous<strong>in</strong>g Assistance<br />
Statewide Directories:<br />
Connecticut | Louisiana | New Hampshire | Western Massachusetts | Wash<strong>in</strong>gton<br />
City Directories:<br />
Los Angeles, CA | New Orleans | San Francisco, CA | Santa Cruz, CA | Seattle | Tampa<br />
Bay, FL | Wash<strong>in</strong>gton, DC<br />
________<br />
Assist<strong>in</strong>g Homeless People – Work<strong>in</strong>g to End <strong>Homelessness</strong><br />
Volunteers <strong>of</strong> America<br />
<br />
<br />
<br />
Over 670,000 Americans are homeless;<br />
48 million people go hungry every night;<br />
46.2 million Americans live <strong>in</strong> poverty.<br />
Volunteers <strong>of</strong> America works to prevent and end homelessness through a range <strong>of</strong><br />
support services <strong>in</strong>clud<strong>in</strong>g eviction prevention, emergency services, transitional hous<strong>in</strong>g<br />
and permanent affordable hous<strong>in</strong>g. Once we engage homeless <strong>in</strong>dividuals, <strong>in</strong>clud<strong>in</strong>g<br />
youth and families with children, we stay with them for as long as it takes to return them<br />
to self-sufficiency.<br />
How We Help End <strong>Homelessness</strong><br />
We reach out to homeless <strong>in</strong>dividuals through street outreach and mobile outreach<br />
services and once we engage with homeless <strong>in</strong>dividuals, youth and families with<br />
children, we provide assistance that ranges from pay<strong>in</strong>g a first month’s rent to <strong>of</strong>fer<strong>in</strong>g<br />
permanent supportive hous<strong>in</strong>g so that people with disabilities can become stable and<br />
productive members <strong>of</strong> their communities. In 2013, we helped over 83,000 homeless<br />
<strong>in</strong>dividuals.<br />
We have found that, without supportive services, hous<strong>in</strong>g is <strong>of</strong>ten not enough to end<br />
homelessness. From help<strong>in</strong>g homeless youth, to provid<strong>in</strong>g assistance <strong>in</strong> obta<strong>in</strong><strong>in</strong>g<br />
disability benefits, to provid<strong>in</strong>g transportation, to <strong>of</strong>fer<strong>in</strong>g <strong>in</strong>tensive job tra<strong>in</strong><strong>in</strong>g<br />
assistance to homeless veterans, we operate a number <strong>of</strong> <strong>in</strong>novative supportive<br />
services programs to support our efforts <strong>of</strong> end<strong>in</strong>g homelessness <strong>in</strong> America.<br />
EMERGENCY SHELTER<br />
Page 128 <strong>of</strong> 289
While permanent hous<strong>in</strong>g, <strong>of</strong>ten coupled with supportive services, is the best way to<br />
end homelessness, many <strong>in</strong>dividuals and families need short-term stabilization before<br />
they can f<strong>in</strong>d hous<strong>in</strong>g that will meet their long term needs. That’s why Volunteers <strong>of</strong><br />
America, for over 100 years, has provided emergency assistance to homeless persons<br />
<strong>in</strong> the form <strong>of</strong> homeless shelters.<br />
DROP-IN CENTERS<br />
S<strong>in</strong>ce homeless persons can be reluctant to leave the streets and accept emergency<br />
shelter or transitional hous<strong>in</strong>g, we operate drop-<strong>in</strong> centers — places where homeless<br />
youth or adults can get <strong>of</strong>f the streets and f<strong>in</strong>d a temporary safe haven. And <strong>of</strong>ten, when<br />
homeless persons beg<strong>in</strong> to trust drop-<strong>in</strong> center staff, they agree to leave the streets and<br />
enter transitional or permanent hous<strong>in</strong>g.<br />
PERMANENT SUPPORTIVE HO<strong>US</strong>ING<br />
For a significant number <strong>of</strong> homeless Americans with mental or physical impairments,<br />
<strong>of</strong>ten coupled with drug and/or alcohol use issues, long-term homelessness can only be<br />
ended by provid<strong>in</strong>g permanent hous<strong>in</strong>g coupled with <strong>in</strong>tensive supportive services.<br />
TRANSITIONAL HO<strong>US</strong>ING<br />
Our transitional hous<strong>in</strong>g programs are operated with one goal <strong>in</strong> m<strong>in</strong>d — to help<br />
<strong>in</strong>dividuals and families obta<strong>in</strong> permanent hous<strong>in</strong>g as quickly as possible. Our<br />
programs serve diverse populations — from women and children who are victims <strong>of</strong><br />
domestic violence to homeless veterans who have spent years liv<strong>in</strong>g on the streets.<br />
Page 129 <strong>of</strong> 289
Page 130 <strong>of</strong> 289
VII. Homeless Shelters<br />
Homeless Shelters are a type <strong>of</strong> homeless service agency which provide<br />
temporary residence for homeless <strong>in</strong>dividuals and families. Shelters exist to provide<br />
residents with safety and protection from exposure to the weather while simultaneously<br />
reduc<strong>in</strong>g the environmental impact on the community. <strong>The</strong>y are similar to, but<br />
dist<strong>in</strong>guishable from, various types <strong>of</strong> emergency shelters, which are typically operated<br />
for specific circumstances and populations - flee<strong>in</strong>g natural disasters or abusive social<br />
circumstances. Extreme weather conditions create problems similar to disaster<br />
management scenarios, and are handled with warm<strong>in</strong>g centers, which typically operate<br />
for short durations dur<strong>in</strong>g adverse weather.<br />
Hardships <strong>of</strong> <strong>The</strong> Homeless Population<br />
Hundreds <strong>of</strong> homeless <strong>in</strong>dividuals die each year from diseases, untreated medical<br />
conditions, lack <strong>of</strong> nutrition, starvation, and freez<strong>in</strong>g to death. In a mild-w<strong>in</strong>tered San<br />
Francisco <strong>in</strong> 1998, the death rate for homeless people was 58% larger than that <strong>of</strong> the<br />
general population. In New Orleans, approximately 10,000 homeless were unaccounted<br />
for after Hurricane Katr<strong>in</strong>a <strong>in</strong> 2005.<br />
Page 131 <strong>of</strong> 289
Residents <strong>of</strong> homeless shelters may also be exposed to bed bugs which have been<br />
grow<strong>in</strong>g more prevalent <strong>in</strong> countries such as the United States, Canada and <strong>in</strong><br />
Europe. Some residents <strong>of</strong> shelters have reported sleep<strong>in</strong>g <strong>in</strong> roach-<strong>in</strong>fested spaces at<br />
various shelters.<br />
In Wash<strong>in</strong>gton, D.C., statistics <strong>in</strong>dicate that 63% <strong>of</strong> homeless people suffer from a lack<br />
<strong>of</strong> access to regular bath<strong>in</strong>g. Another 58% with<strong>in</strong> the same city are unable to obta<strong>in</strong><br />
sufficient levels <strong>of</strong> sleep. Areas such as showers and bathrooms <strong>in</strong> shelters <strong>of</strong>ten have<br />
restricted access with limited hours.<br />
Homeless <strong>in</strong>dividuals also have great trouble f<strong>in</strong>d<strong>in</strong>g storage locations for their<br />
belong<strong>in</strong>gs.<br />
Homeless <strong>in</strong>dividuals <strong>in</strong> the United States are subject to be<strong>in</strong>g arrested and held <strong>in</strong> jail<br />
for "quality <strong>of</strong> life" violations or for public <strong>in</strong>toxication. In Hawaii, homeless people are<br />
banned from sitt<strong>in</strong>g or ly<strong>in</strong>g on the streets.<br />
LGBT People and Homeless Shelters<br />
<strong>The</strong> LGBT homeless are at <strong>in</strong>creased risk <strong>of</strong> violence compared to other<br />
groups. Transgender people are also at danger <strong>of</strong> be<strong>in</strong>g placed <strong>in</strong>to the <strong>in</strong>correct<br />
shelters. In some cases, transgender women can be turned away from women's<br />
shelters. This can place their safety at risk.<br />
Men and Homeless Shelters<br />
In a national survey conducted <strong>in</strong> the United States the f<strong>in</strong>d<strong>in</strong>gs showed that <strong>of</strong> the<br />
surveyed homeless, two-thirds are men and most likely to be s<strong>in</strong>gle adults between the<br />
ages <strong>of</strong> 25 and 54.<br />
One out <strong>of</strong> every four men experiences domestic violence. In addition, young men who<br />
have been abused as children are more likely to become homeless and are at risk <strong>of</strong><br />
becom<strong>in</strong>g chronically homeless if they are not liv<strong>in</strong>g <strong>in</strong> a permanent situation by age 24.<br />
Women and Homeless Shelters<br />
Women are at great risk <strong>of</strong> both homelessness and poverty because they are most<br />
likely to bear child-rear<strong>in</strong>g responsibilities and vulnerable to become victims <strong>of</strong> family<br />
members or "<strong>in</strong>timate partners." In a survey conducted <strong>in</strong> the 2013 showed that <strong>in</strong> an<br />
emergency shelter <strong>in</strong> Texas, women were the majority population.<br />
Homeless women, both those with children and without, experience higher rates <strong>of</strong><br />
physical illness than men. <strong>The</strong>y are also more likely to be hyper-vigilant and have high<br />
levels <strong>of</strong> stress. Women seek<strong>in</strong>g refuge from domestic violence are not always able to<br />
f<strong>in</strong>d rooms <strong>in</strong> shelters. Some women have been turned away from homeless shelters<br />
because shelter staff believe that turn<strong>in</strong>g women away will stop people from hav<strong>in</strong>g sex<br />
<strong>in</strong>side the shelter.<br />
Page 132 <strong>of</strong> 289
Homeless women who are <strong>of</strong> childbear<strong>in</strong>g age also face unique hygiene<br />
issues because <strong>of</strong> menstruation. Homeless shelters have noted that<br />
both tampons and sanitary pads "top the list <strong>of</strong> needs at shelters" because <strong>of</strong> their high<br />
cost and because they are not donated <strong>of</strong>ten.<br />
Hous<strong>in</strong>g First Practice<br />
Alternative Models and Management Philosophies<br />
<strong>The</strong> homeless shelters across the country act merely as emergency shelter systems<br />
that can only hold a fraction <strong>of</strong> the rapidly <strong>in</strong>creas<strong>in</strong>g homeless population. <strong>The</strong> Hous<strong>in</strong>g<br />
First practice provides an alternative to the current network <strong>of</strong> homeless shelters. <strong>The</strong><br />
program targets the large problem with<strong>in</strong> the United States which is a lack <strong>of</strong> affordable<br />
hous<strong>in</strong>g. This methodology attempts to place homeless families back <strong>in</strong>to <strong>in</strong>dependent<br />
liv<strong>in</strong>g situations as quickly as possible. <strong>The</strong> Hous<strong>in</strong>g First practice has achieved<br />
success from the fact that homeless families are more responsive to social services<br />
support once when they are <strong>in</strong> their own hous<strong>in</strong>g. It provides crisis <strong>in</strong>tervention,<br />
affordable rental hous<strong>in</strong>g, and gives each family a grace period <strong>of</strong> six months to a year<br />
<strong>of</strong> social service to allow the family to get back on their feet. <strong>The</strong> effectiveness <strong>of</strong> this<br />
concept is that it assists homeless families <strong>in</strong> identify<strong>in</strong>g their needs and recogniz<strong>in</strong>g the<br />
choices they must make. From this po<strong>in</strong>t families can create better options for them and<br />
plan strategies for liv<strong>in</strong>g on their own.<br />
Page 133 <strong>of</strong> 289
Empowerment Model<br />
Some shelters propose "empowerment models", where <strong>in</strong>stead <strong>of</strong> serv<strong>in</strong>g "clients", they<br />
empower "participants". <strong>The</strong> goal is to become agents <strong>in</strong> their own futures and<br />
dest<strong>in</strong>ies.<br />
Such models tend to focus on assist<strong>in</strong>g participants to access their rights and to fulfill<br />
their responsibilities as citizens. Sometimes this <strong>in</strong>cludes contribut<strong>in</strong>g f<strong>in</strong>ancially towards<br />
the provision <strong>of</strong> the shelters they are resid<strong>in</strong>g <strong>in</strong>. In Australia, legislation requires those<br />
resid<strong>in</strong>g <strong>in</strong> Government funded shelters to contribute a figure similar to 25% <strong>of</strong> their own<br />
<strong>in</strong>come, <strong>in</strong> return for support and accommodation. Consequently, many shelters <strong>in</strong><br />
Australia rely on participant contributions for as much as 20% <strong>of</strong> their budgets.<br />
Religious Shelters<br />
Another model is Dorothy's Place <strong>in</strong> Sal<strong>in</strong>as, CA. It is actually a day center which<br />
coord<strong>in</strong>ates with multiple church and synagogue congregations to l<strong>in</strong>k up to night time<br />
shelter opportunities. Dorothy's Place is closely affiliated with faith based community<br />
service groups, <strong>in</strong>clud<strong>in</strong>g the Franciscan Worker and Companions <strong>of</strong> the Way Interfaith<br />
Dharma community. <strong>The</strong>y propose that they are <strong>in</strong> search <strong>of</strong> "possibilitarians", a theme<br />
resonat<strong>in</strong>g with the prom<strong>in</strong>ent m<strong>in</strong>istry <strong>of</strong> "possibility th<strong>in</strong>k<strong>in</strong>g" promoted by Reformed<br />
Church <strong>of</strong> Americam<strong>in</strong>ister Robert Schuller.<br />
<strong>The</strong> Rescue Mission <strong>in</strong> Milwaukee, M<strong>in</strong>nesota is an extreme example <strong>of</strong> help<strong>in</strong>g the<br />
homeless through religion. In order to receive a free meal at the Rescue Mission,<br />
residents must first attend a Christian prayer service.<br />
<strong>The</strong> Salvation Army is a social support service organization that also functions as a<br />
religious group. <strong>The</strong> programs <strong>of</strong> the Salvation Army are designed to assist women,<br />
children, elderly men, families, and those who are battl<strong>in</strong>g drug addictions.<br />
Vehicles as Shelter<br />
Around the late 2000s, <strong>in</strong> Santa Barbara and other areas <strong>in</strong> California, groups <strong>of</strong><br />
recently homeless began to camp out <strong>in</strong> their cars <strong>in</strong> park<strong>in</strong>g lots with the coord<strong>in</strong>ated<br />
support <strong>of</strong> a local non-pr<strong>of</strong>it group. <strong>The</strong>se <strong>in</strong>dividuals and families were <strong>of</strong>ten unable to<br />
afford rent or mortgage, but still had jobs, cars, <strong>in</strong>surance and other types <strong>of</strong> support<br />
structures. In Santa Barbara, an estimated 55 <strong>in</strong>dividuals camped out every night <strong>in</strong><br />
various private and public lots, some reserved for women only. As more people began<br />
to camp <strong>in</strong> their vehicles, California cities began to pass laws aga<strong>in</strong>st sleep<strong>in</strong>g <strong>in</strong><br />
vehicles, like the 2013 ord<strong>in</strong>ance passed <strong>in</strong> Palo Alto. However, many <strong>of</strong> these laws <strong>in</strong><br />
different municipalities were later struck down <strong>in</strong> higher courts as unconstitutional, like<br />
the Los Angeles ban which was judged by the 9th Circuit Court <strong>of</strong> Appeals <strong>in</strong><br />
2014. Some cities chose to repeal their own bans on sleep<strong>in</strong>g <strong>in</strong> vehicles. In Los<br />
Angeles <strong>in</strong> 2015, approximately 9,500 homeless have turned their cars <strong>in</strong>to<br />
Page 134 <strong>of</strong> 289
homes. In Hawaii, a Honolulu-based company is retr<strong>of</strong>itt<strong>in</strong>g five retired city buses <strong>in</strong>to<br />
mobile shelters which provide a place to sleep and get a shower.<br />
Community Attitudes<br />
Community attitude towards homeless shelters varies widely, but one study found that<br />
older people, men, homeowners and all people mak<strong>in</strong>g larger <strong>in</strong>comes were <strong>of</strong>ten<br />
adverse to the concept <strong>of</strong> homeless shelters <strong>in</strong> general. Calgary neighborhoods<br />
recognize the need for shelters, but many don't want to situate a shelter near their own<br />
homes. A similar response came from residents <strong>in</strong> Oahu. In communities such as<br />
Portland, Oregon, where the weather can be quite harsh, there is an extensive network<br />
<strong>of</strong> supporters. <strong>The</strong>se operate an <strong>in</strong>formal restaurant, the "Sisters <strong>of</strong> the Road" cafe,<br />
which supports both homeless shelter residents and also some unsheltered persons. At<br />
the opposite end <strong>of</strong> the spectrum, jurisdictions such as Santa Barbara, California,<br />
feature ongo<strong>in</strong>g disputes <strong>in</strong> an <strong>of</strong>ten highly adversarial mode. Disputes have even<br />
reached such schemes as re-arrang<strong>in</strong>g benches on city sidewalks to discourage<br />
panhandlers. In another 2011 <strong>in</strong>cident, an eight unit supportive hous<strong>in</strong>g project which<br />
had been approved was called back onto city council agenda the follow<strong>in</strong>g week <strong>in</strong><br />
order to allow approximately 35 public comments pro and con, despite the fact that the<br />
measure had just been approved.<br />
Page 135 <strong>of</strong> 289
<strong>The</strong>re have at times been concerns raised about the transmission <strong>of</strong> diseases <strong>in</strong> the<br />
homeless population housed <strong>in</strong> shelters, although public health pr<strong>of</strong>essionals contend<br />
that such concerns are <strong>in</strong>flated. In addition, a study published <strong>in</strong> 2014 conducted<br />
<strong>in</strong> Marseille, France found that respiratory illnesses <strong>in</strong> homeless shelters were not<br />
significantly different from the general population. In addition, dur<strong>in</strong>g the<br />
peak <strong>in</strong>fluenza months, the shelter occupants did not test positive for the flu virus and<br />
the researchers hypothesize that be<strong>in</strong>g isolated from others may have been the reason<br />
they were virus-free. However, outbreaks <strong>of</strong> tuberculosis <strong>in</strong> have been reported<br />
occurr<strong>in</strong>g <strong>in</strong> shelters with<strong>in</strong> three large Ohio cities <strong>in</strong> the 1990s.<br />
A question has been raised as just how much money donated to the charities that run<br />
the shelters actually gets to the homeless people and the required services. In many<br />
cases, there is a large overhead <strong>in</strong> adm<strong>in</strong>istrative costs, which compromise the money<br />
for their homeless clients.<br />
Internal Problems In Homeless Shelters<br />
<strong>The</strong>re is sometimes corruption and theft by the employees <strong>of</strong> a shelter as evidenced by<br />
a 2011 <strong>in</strong>vestigative report by FOX 25 TV <strong>in</strong> Boston where<strong>in</strong> a number <strong>of</strong> Boston public<br />
shelter employees were found steal<strong>in</strong>g large amounts <strong>of</strong> food over a period <strong>of</strong> time from<br />
the shelter's kitchen for their private use and cater<strong>in</strong>g. Residents have reported that<br />
personal items, such as underwear, was stolen by other residents while they were<br />
occupied.<br />
Shelters can become dangerously overcrowded when too many occupants are allowed<br />
entry to the shelter.<br />
Shelters sometimes are unable to meet state standards for occupancy, such as test<strong>in</strong>g<br />
fire spr<strong>in</strong>klers or ensur<strong>in</strong>g that exits are clearly marked. In New York city, 2015, the state<br />
withheld fund<strong>in</strong>g from many shelters which did not meet standards or which had poor<br />
conditions.<br />
Shelter employees are sometimes at risk from violence perpetrated by the residents<br />
they are serv<strong>in</strong>g. In order to address problems faced by employees who are try<strong>in</strong>g to<br />
help the homeless <strong>in</strong> New York, the Department <strong>of</strong> Homeland<br />
Security <strong>in</strong>creased security at some shelters and conducted security assessments <strong>of</strong><br />
shelters <strong>in</strong> 2015. While many employees <strong>of</strong> shelters know that there is a risk when<br />
work<strong>in</strong>g <strong>in</strong> high-crime neighborhoods or with <strong>in</strong>dividuals who are mentally ill, they<br />
cont<strong>in</strong>ue to work at homeless shelters because they feel that they are perform<strong>in</strong>g a<br />
public service ak<strong>in</strong> to the police or firefighters.<br />
External Problems <strong>of</strong> Homeless Shelters<br />
Several problems emerge when a homeless shelter is present. Homeless shelters have<br />
been argued by some to have a negative effect on bus<strong>in</strong>esses. Bus<strong>in</strong>esses for years<br />
have compla<strong>in</strong>ed that they frequently witness pedestrians be<strong>in</strong>g stopped outside their<br />
Page 136 <strong>of</strong> 289
stores by homeless people begg<strong>in</strong>g for money. Such <strong>in</strong>stances have led to the creation<br />
<strong>of</strong> local laws that prohibit "aggressive panhandl<strong>in</strong>g." Another problem is that it is <strong>of</strong>ten<br />
difficult to decide on where a homeless shelter should be built and how to zone the area<br />
where a shelter can be built. Neighborhoods, as well as schools, argue that homeless<br />
shelters br<strong>in</strong>g <strong>in</strong> bad elements to their surround<strong>in</strong>gs. <strong>The</strong>re are additionally far too many<br />
shelters that have become noth<strong>in</strong>g but hous<strong>in</strong>g facilities; they fail to provide job tra<strong>in</strong><strong>in</strong>g<br />
or education that would assist the homeless population with ga<strong>in</strong><strong>in</strong>g their own hous<strong>in</strong>g.<br />
Hous<strong>in</strong>g through homeless shelters <strong>of</strong>fers no last<strong>in</strong>g solutions, just temporary ones.<br />
Drugs and alcohol also tend to surround homeless shelters. Most shelters prohibit<br />
residential use <strong>of</strong> illegal drugs and alcohol, but enforcement is sporadic <strong>in</strong> many<br />
locations. Lastly, no classification system for shelters has been put <strong>in</strong>to effect. <strong>The</strong>re are<br />
no mechanisms or facilities to separate those who have mental illnesses from the rest <strong>of</strong><br />
the shelter population.<br />
United States<br />
In the United States, the "shelter movement" began to grow significantly dur<strong>in</strong>g the<br />
1970s when there was a high rate <strong>of</strong> unemployment, hous<strong>in</strong>g costs were ris<strong>in</strong>g and<br />
<strong>in</strong>dividuals with severe mental illnesses were be<strong>in</strong>g de<strong>in</strong>stitutionalized. In the 1980s,<br />
homelessness was becom<strong>in</strong>g a "national epidemic" <strong>in</strong> the United States and help<strong>in</strong>g<br />
pr<strong>of</strong>essionals created shelters as "temporary havens." Shelter occupation had more<br />
than doubled by the late 1980s and it doubled aga<strong>in</strong> by 2000. Statistics from 2011 show<br />
Page 137 <strong>of</strong> 289
that "on a given night <strong>in</strong> January 2010, 407,966 <strong>in</strong>dividuals were housed <strong>in</strong>side<br />
homeless shelters, transitional hous<strong>in</strong>g or on the streets. Alternatively, jails have been<br />
used for healthcare enrollment by citizens <strong>in</strong> certa<strong>in</strong> states.<br />
Homeless shelters need to provide a variety <strong>of</strong> services to diverse residents. Homeless<br />
shelters, like La Posada Providencia <strong>in</strong> San Benito, Texas, may also house asylum<br />
seekers, ma<strong>in</strong>ly from Mexico, Central America and South America. Shelters also<br />
provide outreach to residents who are unable to use a shelter or who choose not to use<br />
a shelter. Outreach may <strong>in</strong>clude provid<strong>in</strong>g cloth<strong>in</strong>g for cold weather or food. Very few<br />
shelters have case managers that locate resources locally, such as rides to a<br />
department <strong>of</strong> social services where healthcare can be acquired.<br />
Most shelters typically expect residents to exit <strong>in</strong> the morn<strong>in</strong>g and occupy themselves<br />
elsewhere dur<strong>in</strong>g the day, return<strong>in</strong>g for an even<strong>in</strong>g meal and to sleep. Dur<strong>in</strong>g times <strong>of</strong><br />
<strong>in</strong>clement weather, shelters may provide services outside <strong>of</strong> their normal<br />
hours. Curfews vary widely but tend to be at an earlier hour than adults typically might<br />
return to a home. <strong>The</strong>re are also daytime-only homeless shelters, where the homeless<br />
can go when they cannot stay <strong>in</strong>side at their night time sleep<strong>in</strong>g shelter dur<strong>in</strong>g the day.<br />
Such an early model <strong>of</strong> a daytime homeless shelter provid<strong>in</strong>g multi-faceted services<br />
is Sa<strong>in</strong>t Francis House <strong>in</strong> Boston, Massachusetts which was <strong>of</strong>ficially founded <strong>in</strong> 1984. It<br />
was based on the settlement house, clubhouse and community center support and<br />
social service models.<br />
In the United States, the Department <strong>of</strong> Hous<strong>in</strong>g and Urban Development (HUD) has<br />
shown <strong>in</strong> recent studies that about 5 million Americans qualify to use homeless shelters.<br />
As poverty levels cont<strong>in</strong>ue to rise, it is estimated that the number <strong>of</strong> homeless shelters,<br />
<strong>in</strong> particular <strong>in</strong> the United States, will cont<strong>in</strong>ue to rise. Based on a survey <strong>of</strong> 24 U.S.<br />
cities the average stay <strong>in</strong> a homeless shelter was found to be on average about seven<br />
months out <strong>of</strong> the year.<br />
Statistics <strong>of</strong> Homeless Population With<strong>in</strong> <strong>The</strong> United States<br />
A study by the National Law Center on <strong>Homelessness</strong> and Poverty estimates that 2.3 to<br />
3.5 million Americans experience homelessness<br />
annually. Alaska, California, Nevada, Oregon, Colorado, and Hawaii are the states with<br />
the highest concentration <strong>of</strong> homeless people. Around 1.5 million children or one <strong>of</strong> out<br />
every 50 children <strong>in</strong> America are homeless. Many Americans suffer from the state <strong>of</strong><br />
“chronic homelessness,” which is where an <strong>in</strong>dividual has a disabl<strong>in</strong>g condition who has<br />
been cont<strong>in</strong>uously homeless for over a year or has been homeless on at least four<br />
different <strong>in</strong>stances with<strong>in</strong> four years. About 23% <strong>of</strong> the homeless population has been<br />
tagged as “chronic homeless.” Veterans also represent close to 40% <strong>of</strong> homeless men<br />
with<strong>in</strong> the United States. Racial demographics <strong>of</strong> the Homeless Population <strong>of</strong> the United<br />
States can be represented as:<br />
Whites: 39%<br />
African-Americans: 42%<br />
Page 138 <strong>of</strong> 289
Hispanics: 13%<br />
Native Americans: 4%<br />
Asians: 2%<br />
Approximately 40% <strong>of</strong> all homeless youth <strong>in</strong> the United States identify<br />
as LGBT (Lesbian, Gay, Bisexual, Transgender). In San Francisco, approximately 29%<br />
<strong>of</strong> all the homeless <strong>in</strong> that city are on the LGBT spectrum. <strong>The</strong> National Center for<br />
Transgender Equality reports that 1 <strong>in</strong> 5 transgender <strong>in</strong>dividuals has experienced be<strong>in</strong>g<br />
homeless at least once <strong>in</strong> their lives.<br />
Pet ownership among the homeless varies, but estimates <strong>in</strong>dicate that about 5 and 10<br />
percent <strong>of</strong> the homeless <strong>in</strong> the United States have a pet.<br />
<strong>Homelessness</strong> appears to be largely concentrated with<strong>in</strong> urban areas. Central cities<br />
hold 71% <strong>of</strong> the homeless population while the suburbs have 21% <strong>of</strong> the homeless<br />
population. Only 9% <strong>of</strong> the homeless class can be located with<strong>in</strong> rural areas.<br />
Operations and Role <strong>in</strong> U.S. Society<br />
Homeless shelters are usually operated by a non-pr<strong>of</strong>it agency or a municipal agency,<br />
or are associated with a church. <strong>The</strong>y almost always have Section 501(c)3 corporate<br />
organization with a Board <strong>of</strong> Directors pulled from various sectors <strong>of</strong> the community.<br />
Page 139 <strong>of</strong> 289
Often, such Boards <strong>in</strong>clude clergy, elected <strong>of</strong>ficials, and even shelter residents and<br />
people from the surround<strong>in</strong>g community.<br />
Shelters which are funded by the United States Department <strong>of</strong> Hous<strong>in</strong>g and Urban<br />
Development (HUD) require residents to have identification.<br />
Homeless shelters <strong>of</strong>ten provide other services to the community at large. <strong>The</strong> classic<br />
example is the soup kitchen for persons who are not stay<strong>in</strong>g at the shelter. Others<br />
<strong>in</strong>clude support groups, and/or substance abuse treatment. If they do not <strong>of</strong>fer any <strong>of</strong><br />
these services, they can usually refer their clients to agencies that do. Supportive<br />
hous<strong>in</strong>g <strong>in</strong>tegrates services <strong>in</strong> a more assertive fashion. <strong>The</strong> typical pathway through<br />
the <strong>in</strong>terlock<strong>in</strong>g system is that a person may start <strong>in</strong> a shelter and move<br />
through transitional hous<strong>in</strong>g <strong>in</strong>to supportive hous<strong>in</strong>g and f<strong>in</strong>ally <strong>in</strong>dependent hous<strong>in</strong>g.<br />
Centers <strong>in</strong> the United States are also <strong>of</strong>ten coord<strong>in</strong>ated with outside programs both for<br />
their mission-specific operations and for ancillary services. For communication <strong>of</strong> their<br />
availability, most coord<strong>in</strong>ate with the Federally mandated 2-1-1 or the 3-1-1 phone<br />
<strong>in</strong>formation system which allow needy persons to f<strong>in</strong>d out where shelters are<br />
located. For transportation to shelters, some <strong>of</strong>fer free transportation,[15] particularly <strong>in</strong><br />
cases <strong>of</strong> persons be<strong>in</strong>g released from jail. Some jails have specific staff assigned to<br />
placement <strong>of</strong> persons be<strong>in</strong>g released.<br />
List <strong>of</strong> National Organizations <strong>in</strong> the U.S Support<strong>in</strong>g Homeless Shelters<br />
Across the United States there are several national organizations that assist <strong>in</strong> the<br />
found<strong>in</strong>g and the upkeep <strong>of</strong> homeless shelters. <strong>The</strong> ma<strong>in</strong> national organizations are:<br />
<strong>The</strong> National Alliance to End <strong>Homelessness</strong><br />
<strong>The</strong> Salvation Army<br />
<strong>The</strong> National Coalition for the Homeless<br />
<strong>The</strong> Emergency Food and Shelter Program (United Way)<br />
<strong>The</strong> Department <strong>of</strong> Veterans Affairs<br />
Feed<strong>in</strong>g America<br />
Hous<strong>in</strong>g Assistance Council<br />
Help <strong>US</strong>A. [58]<br />
United States Libraries<br />
Homeless shelters <strong>of</strong>ten work with other organizations <strong>in</strong> order to support and help the<br />
homeless improve their situations, <strong>in</strong>clud<strong>in</strong>g libraries. <strong>The</strong>y <strong>of</strong>ten work with the coalition<br />
to grant a temporary library card for homeless coalition members who can use a shelter<br />
as a local address. This is <strong>in</strong>tend<strong>in</strong>g to give new patrons the opportunity to utilize the<br />
computer services, books, programs, and more that the library <strong>of</strong>fers.<br />
Page 140 <strong>of</strong> 289
Government Assistance Programs <strong>in</strong> the United States<br />
Homeless <strong>in</strong>dividuals with<strong>in</strong> the United States are assisted through various Federal<br />
programs. Examples <strong>in</strong>clude the Social Security Disability Insurance (SSD) and the<br />
Social Security Supplemental Income (SSI) programs. Such applicants may qualify<br />
through their medical records. <strong>The</strong> Social Security Disability Insurance service extends<br />
benefits to families if they have earned sufficient work “credits.” <strong>The</strong> Social Security<br />
Supplemental Income service <strong>of</strong>fers f<strong>in</strong>ancial assistance towards <strong>in</strong>dividuals <strong>in</strong> need<br />
who are disabled, bl<strong>in</strong>d or elderly.<br />
HUD estimates that it costs $60,000 each year to house a homeless family <strong>in</strong> a<br />
shelter. Because <strong>of</strong> this, HUD has various programs <strong>in</strong> place to help families, <strong>in</strong>clud<strong>in</strong>g<br />
rapid rehous<strong>in</strong>g and permanent hous<strong>in</strong>g vouchers. Hous<strong>in</strong>g vouchers from HUD are<br />
considered especially important for help<strong>in</strong>g to prevent families with children from<br />
becom<strong>in</strong>g homeless and also to help these families be able to leave the shelter system<br />
permanently.<br />
<strong>The</strong> Department <strong>of</strong> Veterans Affairs is solely aimed at help<strong>in</strong>g homeless veterans.<br />
Although this organization assists a specific concentration <strong>of</strong> <strong>in</strong>dividuals, it currently<br />
constitutes the largest network <strong>of</strong> homeless treatment with<strong>in</strong> the United States.<br />
Australia<br />
Other Countries<br />
In Australia, due to government fund<strong>in</strong>g requirements, most homelessness services fill<br />
the role <strong>of</strong> both daytime and night time shelters. Shelters develop empowerment based<br />
"wrap around" services <strong>in</strong> which residents are case managed and supported <strong>in</strong> their<br />
efforts to become self-reliant. An example <strong>of</strong> such a service provider <strong>in</strong> this area <strong>in</strong><br />
Australia is Najidah.<br />
Youth refuges <strong>in</strong> Australia provide both a residential sett<strong>in</strong>g for crisis accommodation as<br />
well as case management to assist young people to live <strong>in</strong>dependently. Youth refuges<br />
are a relatively new form <strong>of</strong> homeless shelters. In New South Wales the early refuges<br />
Page 141 <strong>of</strong> 289
<strong>in</strong>clude Caretakers Cottage, Young People's Refuge, Taldamunde Youth Services, all<br />
founded <strong>in</strong> the mid-1970s.<br />
Canada<br />
Canada has an estimated homeless population somewhere between 150,000 and<br />
300,000 people as reported <strong>in</strong> 2014. Canada has responded to an <strong>in</strong>crease <strong>in</strong><br />
homelessness by <strong>in</strong>creas<strong>in</strong>g the amount <strong>of</strong> shelter space available to <strong>in</strong>dividuals. A<br />
study done <strong>in</strong> Canada also found that <strong>in</strong>dividuals enter<strong>in</strong>g shelters and drop-<strong>in</strong><br />
centers experienced a loss <strong>of</strong> their own sense <strong>of</strong> personhood. <strong>The</strong>rapeutic Conversation<br />
therapy has been tested and found successful <strong>in</strong> Calgary with a small group <strong>of</strong><br />
homeless shelter residents <strong>in</strong> improv<strong>in</strong>g their mental health outcomes. Calgary has<br />
seen an <strong>in</strong>crease <strong>in</strong> the amount <strong>of</strong> homelessness, partly due to the "lack <strong>of</strong> affordable<br />
rental units."<br />
A nationwide volunteer group <strong>in</strong> Canada, the Angels <strong>in</strong> the Night, sponsored by Invis-<br />
Mortgage Intelligence, donates cold-weather clothes and other supplies to the<br />
homeless, visit<strong>in</strong>g shelters and <strong>in</strong>dividuals on the streets.<br />
In 2015, Clean the World began a Canadian Operations Center <strong>in</strong> Montreal order to<br />
supply soap for homeless shelters. Clean the World distributes and recycles hygiene<br />
supplies such as soap and shampoo.<br />
Ch<strong>in</strong>a<br />
In Ch<strong>in</strong>a, homeless estimates vary, s<strong>in</strong>ce the Social Welfare Department does not<br />
consider those liv<strong>in</strong>g <strong>in</strong> temporary shelters to be "homeless." <strong>The</strong>re may be<br />
approximately 1 to 1.5 million homeless children who have left their families because <strong>of</strong><br />
extreme poverty, family issues or abuse.<br />
In the city <strong>of</strong> Dali, there is an annual conference for "beggars." In 2014, a governmentsponsored<br />
shelter <strong>in</strong> Henan prov<strong>in</strong>ce which houses 20 homeless <strong>in</strong>dividuals was under<br />
scrut<strong>in</strong>y for ty<strong>in</strong>g children to trees and provid<strong>in</strong>g <strong>in</strong>adequate sleep<strong>in</strong>g areas.<br />
India<br />
India def<strong>in</strong>es homelessness as not be<strong>in</strong>g <strong>in</strong> residence <strong>of</strong> a "census house" which must<br />
be a structure with a ro<strong>of</strong>.<br />
In India, youth can become homeless because <strong>of</strong> child abandonment. Youth<br />
<strong>in</strong> Jammu and Kashmir who live <strong>in</strong> shelters reported high prevalence <strong>of</strong> emotional and<br />
physical abuse, and emotional and physical neglect while liv<strong>in</strong>g <strong>in</strong> homeless shelters.<br />
Homeless <strong>in</strong>dividuals and families <strong>in</strong> India face challenges access<strong>in</strong>g water and hygiene<br />
services. A 2011 Census <strong>of</strong> India found that safe dr<strong>in</strong>k<strong>in</strong>g water coverage <strong>in</strong> urban<br />
areas is at 91.9% while regular sanitation access is at 81.4%. <strong>The</strong>re is a significant lack<br />
<strong>of</strong> hous<strong>in</strong>g <strong>in</strong> major urban areas <strong>in</strong> India. People come from the rural part <strong>of</strong> India to look<br />
Page 142 <strong>of</strong> 289
for work and when there are no accommodations for hous<strong>in</strong>g build their own shelters,<br />
<strong>of</strong>ten known as "hutments."<br />
Statistics <strong>of</strong> Homeless Population With<strong>in</strong> India<br />
Accord<strong>in</strong>g to the 2011 Census, there were 1.77 million homeless people <strong>in</strong> India, or<br />
0.15% <strong>of</strong> the country's total population. In India, the cities with the greatest number <strong>of</strong><br />
homeless <strong>in</strong>dividuals and families are Greater Mumbai, Delhi, Kolkata, Chennai,<br />
and Bangalore.<br />
Japan<br />
<strong>The</strong> number <strong>of</strong> homeless<br />
<strong>in</strong>dividuals <strong>in</strong> Japan as<br />
recorded <strong>in</strong> 2003, was<br />
around 25,296. Numbers <strong>of</strong><br />
those without homes have<br />
been<br />
"<strong>in</strong>creas<strong>in</strong>g<br />
dramatically" s<strong>in</strong>ce the<br />
"bubble economy" collapsed<br />
<strong>in</strong> the 1990s. In Tokyo,<br />
around 2007, many<br />
homeless <strong>in</strong>dividuals were<br />
cleared out <strong>of</strong> their<br />
temporary residences <strong>in</strong> city<br />
parks. In 2011,<br />
the earthquake and tsunami left many <strong>in</strong>dividuals homeless and liv<strong>in</strong>g <strong>in</strong> shelters.<br />
United K<strong>in</strong>gdom<br />
"Sleep<strong>in</strong>g rough" or "rough sleep<strong>in</strong>g" is term<strong>in</strong>ology <strong>in</strong> the United K<strong>in</strong>gdom for sleep<strong>in</strong>g<br />
without shelter. In addition, "not all homeless people are entitled to hous<strong>in</strong>g." Shelters<br />
like 'Jimmy's', <strong>in</strong> Cambridge, provide access to those who would otherwise be "sleep<strong>in</strong>g<br />
rough", <strong>of</strong>fer<strong>in</strong>g temporary accommodation and support services <strong>in</strong> the basement <strong>of</strong><br />
a Baptist Church <strong>in</strong> the city center.<br />
________<br />
<strong>The</strong> Hous<strong>in</strong>g First Model<br />
Hous<strong>in</strong>g First is a relatively recent <strong>in</strong>novation <strong>in</strong> human service programs and social<br />
policy regard<strong>in</strong>g treatment <strong>of</strong> the homeless and is an alternative to a system <strong>of</strong><br />
emergency shelter/transitional hous<strong>in</strong>g progressions. Rather than mov<strong>in</strong>g homeless<br />
<strong>in</strong>dividuals through different "levels" <strong>of</strong> hous<strong>in</strong>g, whereby each level moves them closer<br />
to "<strong>in</strong>dependent hous<strong>in</strong>g" (for example: from the streets to a public shelter, and from a<br />
Page 143 <strong>of</strong> 289
public shelter to a transitional hous<strong>in</strong>g program, and from there to their own apartment<br />
<strong>in</strong> the community), Hous<strong>in</strong>g First moves the homeless <strong>in</strong>dividual or household<br />
immediately from the streets or homeless shelters <strong>in</strong>to their own accommodation. "<br />
Hous<strong>in</strong>g First approaches are based on the concept that a homeless <strong>in</strong>dividual or<br />
household's first and primary need is to obta<strong>in</strong> stable hous<strong>in</strong>g, and that other issues that<br />
may affect the household can and should be addressed once hous<strong>in</strong>g is obta<strong>in</strong>ed. In<br />
contrast, many other programs operate from a model <strong>of</strong> "hous<strong>in</strong>g read<strong>in</strong>ess" — that is,<br />
that an <strong>in</strong>dividual or household must address other issues that may have led to the<br />
episode <strong>of</strong> homelessness prior to enter<strong>in</strong>g hous<strong>in</strong>g.<br />
General Pr<strong>in</strong>ciples<br />
Hous<strong>in</strong>g First is an approach that <strong>of</strong>fers permanent, affordable hous<strong>in</strong>g as quickly as<br />
possible for <strong>in</strong>dividuals and families experienc<strong>in</strong>g homelessness, and then provides the<br />
supportive services and connections to the community-based supports people need to<br />
keep their hous<strong>in</strong>g and avoid return<strong>in</strong>g to homelessness. <strong>The</strong> pr<strong>in</strong>ciples beh<strong>in</strong>d this<br />
approach are:<br />
1. Move people <strong>in</strong>to hous<strong>in</strong>g directly from streets and shelters without preconditions<br />
<strong>of</strong> treatment acceptance or compliance;<br />
2. <strong>The</strong> provider is obligated to br<strong>in</strong>g robust support services to the hous<strong>in</strong>g. <strong>The</strong>se<br />
services are predicated on assertive engagement, not coercion;<br />
3. Cont<strong>in</strong>ued tenancy is not dependent on participation <strong>in</strong> services;<br />
4. Units targeted to most disabled and vulnerable homeless members <strong>of</strong> the<br />
community;<br />
5. Embraces harm-reduction approach to addictions rather than mandat<strong>in</strong>g<br />
abst<strong>in</strong>ence. At the same time, the provider must be prepared to support resident<br />
commitment to recovery;<br />
6. Residents must have leases and tenant protections under the law;<br />
7. Can be implemented as either a project-based or scattered site model.<br />
History and Evolution<br />
In Los Angeles, California <strong>in</strong> 1988, the "Hous<strong>in</strong>g First" Program for families was<br />
launched at Beyond Shelter by Tanya Tull <strong>in</strong> response to a sharp <strong>in</strong>crease <strong>in</strong> the<br />
number <strong>of</strong> homeless families with children. <strong>The</strong> "hous<strong>in</strong>g first" approach for families<br />
<strong>in</strong>cludes <strong>in</strong>-depth screen<strong>in</strong>g and assessment for child safety. Families should not be<br />
relocated to rental hous<strong>in</strong>g if there are <strong>in</strong>dicators that a child might be <strong>in</strong> danger. In<br />
"hous<strong>in</strong>g first" for families, services are available before, dur<strong>in</strong>g, and after relocation to<br />
rental hous<strong>in</strong>g - but engagement is not a requirement for participation. Unfortunately the<br />
"hous<strong>in</strong>g first" philosophy was <strong>of</strong>ten mis<strong>in</strong>terpreted <strong>in</strong> later years and, today, many<br />
government programs promote faulty application <strong>of</strong> "hous<strong>in</strong>g first." For households with<br />
children, appropriate services and monitor<strong>in</strong>g may be delivered through home visits,<br />
outpatient treatment, or l<strong>in</strong>k<strong>in</strong>g to appropriate services <strong>in</strong> the community at-large.<br />
Page 144 <strong>of</strong> 289
In 1992 Dr. Sam Tsemberis, a faculty member <strong>of</strong> the Department <strong>of</strong> Psychiatry <strong>of</strong><br />
the New York University School <strong>of</strong> Medic<strong>in</strong>e, founded Pathways to Hous<strong>in</strong>g <strong>in</strong> New York<br />
City. Hous<strong>in</strong>g First for the chronically homeless is premised on the notion that hous<strong>in</strong>g<br />
is a basic human right, and so should not be denied to anyone, even if they are abus<strong>in</strong>g<br />
alcohol or other substances. <strong>The</strong> Hous<strong>in</strong>g First model, thus, is philosophically <strong>in</strong><br />
contrast to models that require the homeless to abjure substance-abuse and seek<br />
treatment <strong>in</strong> exchange for hous<strong>in</strong>g.<br />
Hous<strong>in</strong>g First, when supported by the United States Department <strong>of</strong> Hous<strong>in</strong>g and Urban<br />
Development, does not only provide hous<strong>in</strong>g. <strong>The</strong> model, used by nonpr<strong>of</strong>it agencies<br />
throughout America, also provides wraparound case management services to the<br />
tenants. This case management provides stability for homeless <strong>in</strong>dividuals, which<br />
<strong>in</strong>creases their success. It allows for accountability and promotes self-sufficiency. <strong>The</strong><br />
hous<strong>in</strong>g provided through government supported Hous<strong>in</strong>g First programs is permanent<br />
and "affordable," mean<strong>in</strong>g that tenants pay 30% <strong>of</strong> their <strong>in</strong>come towards rent. Hous<strong>in</strong>g<br />
First, as pioneered by Pathways to Hous<strong>in</strong>g, targets <strong>in</strong>dividuals with disabilities. This<br />
hous<strong>in</strong>g is supported through two HUD programs. <strong>The</strong>y are the Supportive<br />
Hous<strong>in</strong>g Program and the Shelter Plus Care Program. Pathways' Hous<strong>in</strong>g First model<br />
has been recognized by the Substance Abuse and Mental Health Services<br />
Adm<strong>in</strong>istration as an Evidence-based practice.<br />
<strong>The</strong> Hous<strong>in</strong>g First Model is executed through either a scattered-site or project-based<br />
implementation. A scattered-site Hous<strong>in</strong>g First program is a model <strong>in</strong> which residents<br />
are <strong>of</strong>fered the opportunity <strong>of</strong> be<strong>in</strong>g housed <strong>in</strong> <strong>in</strong>dividual hous<strong>in</strong>g units throughout a<br />
community. This model <strong>in</strong>tegrates participants <strong>in</strong> a community as opposed to<br />
assembl<strong>in</strong>g multiple or all participants <strong>in</strong> one project or location. In a project-based<br />
Page 145 <strong>of</strong> 289
Hous<strong>in</strong>g First implementation, residents are <strong>of</strong>fered units with<strong>in</strong> a s<strong>in</strong>gle hous<strong>in</strong>g project<br />
or site. This model congregates multiple or all participants <strong>in</strong> one locality. In both the<br />
scattered-site and project-based Hous<strong>in</strong>g First programs, residents are given access to<br />
a wide variety <strong>of</strong> supportive health and rehabilitation services which they have the<br />
option, although not mandatory, to participate <strong>in</strong> and receive treatment.<br />
Hous<strong>in</strong>g First is currently endorsed by the United States Interagency Council on<br />
<strong>Homelessness</strong> (<strong>US</strong>ICH) as a "best practice" for governments and service-agencies to<br />
use <strong>in</strong> their fight to end chronic homelessness <strong>in</strong> America.<br />
Hous<strong>in</strong>g First programs currently operate throughout the United States <strong>in</strong> cities such<br />
as New Orleans, Louisiana; Plattsburgh, New York; Anchorage, Alaska; M<strong>in</strong>neapolis,<br />
M<strong>in</strong>nesota; New York City; District <strong>of</strong> Columbia; Denver, Colorado; San Francisco,<br />
California; Atlanta, Georgia; Chicago, Ill<strong>in</strong>ois; Qu<strong>in</strong>cy, Massachusetts; Philadelphia,<br />
Pennsylvania; Salt Lake City, Utah; Seattle, Wash<strong>in</strong>gton; Los Angeles; Aust<strong>in</strong>,<br />
Texas; and Cleveland, Ohio, among many others, and are <strong>in</strong>tended to be crucial<br />
aspects <strong>of</strong> communities' so-called "10-Year Plans To End Chronic <strong>Homelessness</strong>" also<br />
advocated by <strong>US</strong>ICH. Rapid Re-Hous<strong>in</strong>g is based on Hous<strong>in</strong>g First pr<strong>in</strong>ciples and is<br />
considered a subset <strong>of</strong> the Hous<strong>in</strong>g First approach. Rapid Re-Hous<strong>in</strong>g differs primarily<br />
<strong>in</strong> the provision <strong>of</strong> short-term rent subsidies (generally 3–6 months), after which the<br />
tenant either pays rent without a subsidy or has access to a Section 8 Hous<strong>in</strong>g Choice<br />
voucher or the equivalent.<br />
Evidence and Outcomes<br />
In Massachusetts, the Home & Healthy for Good program reported some significant<br />
outcomes that were favorable especially <strong>in</strong> the area <strong>of</strong> cost sav<strong>in</strong>gs.<br />
<strong>The</strong> Denver Hous<strong>in</strong>g First Collaborative, operated by the Colorado Coalition for the<br />
Homeless, provides hous<strong>in</strong>g through a Hous<strong>in</strong>g First approach to more than 200<br />
chronically homeless <strong>in</strong>dividuals. A 2006 cost study documented a significant reduction<br />
<strong>in</strong> the use and cost <strong>of</strong> emergency services by program participants as well as <strong>in</strong>creased<br />
health status. Emergency room visits and costs were reduced by an average <strong>of</strong> 34.3<br />
percent. Hospital <strong>in</strong>patient costs were reduced by 66 percent. Detox visits were reduced<br />
by 82 percent. Incarceration days and costs were reduced by 76 percent. 77 percent <strong>of</strong><br />
those enter<strong>in</strong>g the program cont<strong>in</strong>ued to be housed <strong>in</strong> the program after two years.<br />
Researchers <strong>in</strong> Seattle, Wash<strong>in</strong>gton, partner<strong>in</strong>g with the Downtown Emergency Service<br />
Center, found that provid<strong>in</strong>g hous<strong>in</strong>g and support services for homeless alcoholics costs<br />
taxpayers less than leav<strong>in</strong>g them on the street, where taxpayer money goes towards<br />
police and emergency health care. Results <strong>of</strong> the study funded by the Substance Abuse<br />
Policy Research Program (SAPRP) <strong>of</strong> the Robert Wood Johnson Foundation appeared<br />
<strong>in</strong> the Journal <strong>of</strong> the American Medical Association April, 2009. This first <strong>US</strong> controlled<br />
assessment <strong>of</strong> the effectiveness <strong>of</strong> Hous<strong>in</strong>g First specifically target<strong>in</strong>g chronically<br />
homeless alcoholics showed that the program saved taxpayers more than $4 million<br />
over the first year <strong>of</strong> operation. Dur<strong>in</strong>g the first six months, even after consider<strong>in</strong>g the<br />
Page 146 <strong>of</strong> 289
cost <strong>of</strong> adm<strong>in</strong>ister<strong>in</strong>g the hous<strong>in</strong>g, 95 residents <strong>in</strong> a Hous<strong>in</strong>g First program <strong>in</strong> downtown<br />
Seattle, the study reported an average cost-sav<strong>in</strong>gs <strong>of</strong> 53 percent—nearly <strong>US</strong> $2,500<br />
per month per person <strong>in</strong> health and social services, compared to the per month costs <strong>of</strong><br />
a wait-list control group <strong>of</strong> 39 homeless people. Further, stable hous<strong>in</strong>g also results <strong>in</strong><br />
reduced dr<strong>in</strong>k<strong>in</strong>g among homeless alcoholics.<br />
In Utah, there has been "a 72 percent decrease overall s<strong>in</strong>ce enact<strong>in</strong>g the plan <strong>in</strong> 2005"<br />
accord<strong>in</strong>g to the Utah Division <strong>of</strong> Hous<strong>in</strong>g and Community Development.<br />
In August 2007, the <strong>US</strong> Department <strong>of</strong> Hous<strong>in</strong>g and Urban Development reported that<br />
the number <strong>of</strong> chronically homeless <strong>in</strong>dividuals liv<strong>in</strong>g on the streets or <strong>in</strong> shelters<br />
dropped by an unprecedented 30 percent, from 175,914 people <strong>in</strong> 2005 to 123,833 <strong>in</strong><br />
2007. This was credited <strong>in</strong> part to the "hous<strong>in</strong>g first" approach; Congress <strong>in</strong> 1999<br />
directed that HUD spend 30% <strong>of</strong> its fund<strong>in</strong>g on the method.<br />
In September 2010, it was reported that the Hous<strong>in</strong>g First Initiative had significantly<br />
reduced the chronic homeless s<strong>in</strong>gle person population <strong>in</strong> Boston, Massachusetts,<br />
although homeless families were still <strong>in</strong>creas<strong>in</strong>g <strong>in</strong> number. Some shelters were<br />
reduc<strong>in</strong>g the number <strong>of</strong> beds due to lowered numbers <strong>of</strong> homeless, and some<br />
Page 147 <strong>of</strong> 289
emergency shelter facilities were clos<strong>in</strong>g, especially the emergency Boston Night<br />
Center. By 2015, Boston Mayor Marty Walsh had announced a 3-year plan to end<br />
chronic homelessness, focus<strong>in</strong>g on coord<strong>in</strong>at<strong>in</strong>g efforts among public agencies and<br />
nonpr<strong>of</strong>it organizations provid<strong>in</strong>g services to homeless men and women.<br />
In 2013, the estimated national public cost <strong>of</strong> chronic homelessness was between $3.7<br />
and $4.7 billion accord<strong>in</strong>g to the United States Interagency Council on<br />
<strong>Homelessness</strong> (<strong>US</strong>ICH). Through Hous<strong>in</strong>g First programs, chronically homeless<br />
<strong>in</strong>dividuals are us<strong>in</strong>g fewer hospital resources, spend<strong>in</strong>g less time <strong>in</strong> costly <strong>in</strong>carceration<br />
and requir<strong>in</strong>g fewer emergency room visits. For example, a review <strong>of</strong> the impact <strong>of</strong><br />
permanent supportive hous<strong>in</strong>g and case management on the health <strong>of</strong> the chronically<br />
homeless found evidence that these services have a positive impact on health<br />
outcomes such as self-reported mental health status and substance use, a large impact<br />
on health care utilization, and a reduction <strong>in</strong> Medicaid health care costs. Studies <strong>in</strong> New<br />
York City and <strong>in</strong> Utah have shown that every homeless person housed <strong>in</strong> programs<br />
such as Hous<strong>in</strong>g First saves taxpayers $10,000 and $8,000 a year, respectively. A<br />
research study at University <strong>of</strong> Northern Carol<strong>in</strong>a also reported that a hous<strong>in</strong>g project<br />
for the chronically homeless called Moore Place had saved the county $2.4 million.<br />
Post–2007 <strong>US</strong> Policy and Legislation<br />
<strong>The</strong> United States Congress appropriated $25 million <strong>in</strong> the McK<strong>in</strong>ney-Vento Homeless<br />
Assistance Grants for 2008 to show the effectiveness <strong>of</strong> Rapid Re-hous<strong>in</strong>g programs <strong>in</strong><br />
reduc<strong>in</strong>g family homelessness.<br />
In February 2009, President Obama signed the American Recovery and Re<strong>in</strong>vestment<br />
Act <strong>of</strong> 2009 part <strong>of</strong> which addressed homelessness prevention, allocat<strong>in</strong>g $1.5 billion for<br />
a Homeless Prevention Fund. <strong>The</strong> fund<strong>in</strong>g for it was called the "<strong>Homelessness</strong><br />
Prevention and Rapid Re-Hous<strong>in</strong>g Program" (HPRP), and was distributed us<strong>in</strong>g the<br />
formula for the Emergency Shelter Grants (ESG) program.<br />
On May 20, 2009, President Obama signed the Homeless Emergency Assistance and<br />
Rapid Transition to Hous<strong>in</strong>g (HEARTH) Act <strong>in</strong>to Public Law (Public Law 111-22 or "PL<br />
111-22"), reauthoriz<strong>in</strong>g HUD's Homeless Assistance programs. It was part <strong>of</strong><br />
the Help<strong>in</strong>g Families Save <strong>The</strong>ir Homes Act <strong>of</strong> 2009. <strong>The</strong> HEARTH act allows for the<br />
prevention <strong>of</strong> homelessness, rapid re-hous<strong>in</strong>g, consolidation <strong>of</strong> hous<strong>in</strong>g programs, and<br />
new homeless categories. In the eighteen months after the bill's sign<strong>in</strong>g, HUD must<br />
make regulations implement<strong>in</strong>g this new McK<strong>in</strong>ney program.<br />
In late 2009, some homeless advocacy organizations, such as the National Coalition for<br />
the Homeless, reported and published perceived problems with the HEARTH Act <strong>of</strong><br />
2009 as a HUD McK<strong>in</strong>ney-Vento Reauthorization bill, especially with regard to privacy,<br />
def<strong>in</strong>itional <strong>in</strong>eligibility, community roles, and restrictions on eligibile activities.<br />
On June 22, 2010, the United States Interagency Council on<br />
<strong>Homelessness</strong> presented Open<strong>in</strong>g Doors: Federal Strategic Plan to Prevent and End<br />
Page 148 <strong>of</strong> 289
<strong>Homelessness</strong> to the Obama Adm<strong>in</strong>istration and Congress. This is the nation's first<br />
comprehensive strategy as mandated by the HEARTH Act and <strong>in</strong>cludes Hous<strong>in</strong>g First<br />
as a best practice for reach<strong>in</strong>g the goal <strong>of</strong> end<strong>in</strong>g chronic homelessness by 2015.<br />
On June 11, 2014 the 100,000 Homes Campaign <strong>in</strong> the United States, launched <strong>in</strong> 2010<br />
to "help communities around the country place 100,000 chronically homeless people<br />
<strong>in</strong>to permanent supportive hous<strong>in</strong>g" announced that it reached its four-year goal <strong>of</strong><br />
hous<strong>in</strong>g 100,000 chronically homeless people nearly two months before its July 29<br />
deadl<strong>in</strong>e.<br />
New York Times journalist David Bornste<strong>in</strong> summarized key elements <strong>of</strong> the 100,000<br />
Homes Campaign that campaign leaders attribute to its success. [39] This <strong>in</strong>cluded<br />
learn<strong>in</strong>g <strong>in</strong>dividual homeless people's "name and need" by mobiliz<strong>in</strong>g volunteers to go<br />
very early <strong>in</strong> the morn<strong>in</strong>g to check on them, establish<strong>in</strong>g a "vulnerability <strong>in</strong>dex" so they<br />
could prioritize certa<strong>in</strong> homeless people and "br<strong>in</strong>g hous<strong>in</strong>g advocates and agency<br />
representatives together to streaml<strong>in</strong>e the placement processes, and share ideas about<br />
how to cut through red tape."<br />
Application to Family <strong>Homelessness</strong><br />
<strong>The</strong> Hous<strong>in</strong>g First methodology was <strong>in</strong>itially developed <strong>in</strong> 1988 <strong>in</strong> Los Angeles,<br />
California, to address an <strong>in</strong>crease <strong>in</strong> family homelessness. <strong>The</strong> basic methodology<br />
Page 149 <strong>of</strong> 289
helps homeless families to relocate from shelters and transitional hous<strong>in</strong>g directly <strong>in</strong>to<br />
permanent rental hous<strong>in</strong>g <strong>in</strong> the community at-large as quickly as possible, with homebased<br />
case management support for a traditional period <strong>of</strong> time. In other words, the<br />
services traditionally be<strong>in</strong>g provided <strong>in</strong> transitional hous<strong>in</strong>g were <strong>in</strong>stead provided to<br />
families after they had been assisted <strong>in</strong> relocat<strong>in</strong>g to permanent hous<strong>in</strong>g at rents they<br />
could afford. This was a major <strong>in</strong>novation <strong>in</strong> the field at the time. <strong>The</strong> basic premise was<br />
that families were more responsive to <strong>in</strong>terventions and support from a stable<br />
permanent hous<strong>in</strong>g base than while still homeless. In the 2009 HEARTH Act, the<br />
Hous<strong>in</strong>g First approach to end<strong>in</strong>g homelessness was codified <strong>in</strong>to law. Hous<strong>in</strong>g First<br />
programs for families differ dramatically from Hous<strong>in</strong>g First for the chronically homeless,<br />
as children are <strong>in</strong>volved. Beyond Shelter's leadership promoted this new approach<br />
across the country for the next 20 years, work<strong>in</strong>g collaboratively with the National<br />
Alliance to End <strong>Homelessness</strong>.<br />
Australia<br />
Outside the United States<br />
In South Australia, the State Government <strong>of</strong> Premier Mike Rann (2002 to 2011)<br />
committed substantial fund<strong>in</strong>g to a series <strong>of</strong> <strong>in</strong>itiatives designed to combat<br />
homelessness. Advised by Social Inclusion Commissioner David Cappo and the<br />
founder <strong>of</strong> New York's Common Ground program, Rosanne Haggerty, the Rann<br />
Government established Common Ground Adelaide, build<strong>in</strong>g high quality <strong>in</strong>ner city<br />
apartments (comb<strong>in</strong>ed with <strong>in</strong>tensive support) for "rough sleep<strong>in</strong>g" homeless people.<br />
<strong>The</strong> government also funded the Street to Home program and a hospital liaison service<br />
designed to assist homeless people who are admitted to the emergency departments <strong>of</strong><br />
Adelaide's major public hospitals. Rather than be<strong>in</strong>g released back <strong>in</strong>to homelessness,<br />
patients identified as rough sleepers are found accommodation backed by pr<strong>of</strong>essional<br />
support. Common Ground and Street to Home now operate across Australia <strong>in</strong> other<br />
states.<br />
Canada<br />
In its <strong>Economic</strong> Action Plan 2013, the Federal Government <strong>of</strong> Canada proposed $119<br />
million annually from March 2014 until March 2019—with $600 million <strong>in</strong> new fund<strong>in</strong>g—<br />
to renew its <strong>Homelessness</strong> Partner<strong>in</strong>g Strategy (HPS). In deal<strong>in</strong>g with homelessness <strong>in</strong><br />
Canada, the focus is on the Hous<strong>in</strong>g First model. Thus, private or public organizations<br />
across Canada are eligible to receive HPS subsidies to implement Hous<strong>in</strong>g First<br />
programs. In 2008, the Federal Government <strong>of</strong> Canada funded a five-year<br />
demonstration program, the At Home/Chez Soi project, aimed at provid<strong>in</strong>g evidence<br />
about what services and systems best help people experienc<strong>in</strong>g serious mental illness<br />
and homelessness. Launched <strong>in</strong> November 2009 and end<strong>in</strong>g <strong>in</strong> March 2013, the At<br />
Home/Chez Soi project was actively address<strong>in</strong>g the hous<strong>in</strong>g need by <strong>of</strong>fer<strong>in</strong>g Hous<strong>in</strong>g<br />
First programs to people with mental illness who were experienc<strong>in</strong>g homelessness <strong>in</strong><br />
five cities: Vancouver, W<strong>in</strong>nipeg, Toronto, Montréal and Moncton. In total, At<br />
Home/Chez Soi has provided more than 1,000 Canadians with hous<strong>in</strong>g.<br />
Page 150 <strong>of</strong> 289
Hous<strong>in</strong>g First has grown <strong>in</strong> popularity <strong>in</strong> Canada and used <strong>in</strong> many Canadian ten-year<br />
plans to end homelessness, such as those <strong>in</strong> Edmonton and Calgary, Alberta. Hous<strong>in</strong>g<br />
First: A Canadian Perspective (TM) is spearheaded by Pathways to Hous<strong>in</strong>g Calgary<br />
and director Sue Fortune. Canadian adaptations to Hous<strong>in</strong>g First have demonstrated<br />
positive outcomes as documented on the website: www.thealex.ca (Hous<strong>in</strong>g Programs;<br />
Pathways to Hous<strong>in</strong>g). Canadian implementations <strong>of</strong> Hous<strong>in</strong>g First must be tailored to<br />
Canadian homelessness, resources, politics and philosophy.<br />
In Calgary, Alberta, the Alex Pathways to Hous<strong>in</strong>g Calgary which opened <strong>in</strong> 2007, has<br />
150 <strong>in</strong>dividuals <strong>in</strong> scatter site homes <strong>in</strong> 2013. Clients pay 30 percent <strong>of</strong> their <strong>in</strong>come<br />
towards their rent: 85 percent <strong>of</strong> Pathways to Hous<strong>in</strong>g clients receive Assured Income<br />
for the Severely Handicapped (AISH) benefits and 15 percent receive Alberta Works.<br />
<strong>The</strong> Alex Pathways to Hous<strong>in</strong>g uses a Hous<strong>in</strong>g First model, but it also uses Assertive<br />
Community Treatment (ACT), an <strong>in</strong>tegrated approach to healthcare where clients<br />
access a team <strong>of</strong> "nurses, mental health specialists, justice specialists and substance<br />
abuse specialists." Director Sue Fortune is committed to the 10 Year Plan To End<br />
<strong>Homelessness</strong> <strong>in</strong> the Calgary Region. Fortune reported that the Hous<strong>in</strong>g First approach<br />
resulted <strong>in</strong> a 66 percent decl<strong>in</strong>e <strong>in</strong> days hospitalized (from one year prior to <strong>in</strong>take<br />
compared to one year <strong>in</strong> the program), a 38 percent decl<strong>in</strong>e <strong>in</strong> times <strong>in</strong> emergency<br />
room, a 41 percent decl<strong>in</strong>e <strong>in</strong> EMS events, a 79 percent decl<strong>in</strong>e <strong>in</strong> days <strong>in</strong> jail and a 30<br />
Page 151 <strong>of</strong> 289
percent decl<strong>in</strong>e <strong>in</strong> police <strong>in</strong>teractions. Sue Fortune, Director <strong>of</strong> Alex Pathways to<br />
Hous<strong>in</strong>g <strong>in</strong> Calgary <strong>in</strong> her 2013 presentation entitled "Canadian Adaptations us<strong>in</strong>g<br />
Hous<strong>in</strong>g First: A Canadian Perspective" argued that less than 1% <strong>of</strong> exist<strong>in</strong>g clients<br />
return to shelters or rough sleep<strong>in</strong>g; clients spend 76% fewer days <strong>in</strong> jail; clients have<br />
35% decl<strong>in</strong>e <strong>in</strong> police <strong>in</strong>teractions.<br />
Pathways to Hous<strong>in</strong>g Canada describes the Hous<strong>in</strong>g First as a "client-driven strategy<br />
that provides immediate access to an apartment without requir<strong>in</strong>g <strong>in</strong>itial participation <strong>in</strong><br />
psychiatric treatment or treatment for sobriety."<br />
F<strong>in</strong>land<br />
In 2007 the center-right government <strong>of</strong> Matti Vanhanen began a special program <strong>of</strong> four<br />
wise men to elim<strong>in</strong>ate homelessness <strong>in</strong> F<strong>in</strong>land by 2015.<br />
<strong>The</strong> program to reduce long-term homelessness targets just some homeless people.<br />
Assessed on the basis <strong>of</strong> social, health and f<strong>in</strong>ancial circumstances, this is the hard<br />
core <strong>of</strong> homelessness. <strong>The</strong> programme to reduce long-term homelessness focuses on<br />
the 10 biggest urban growth centres, where most <strong>of</strong> the homeless are to be found. <strong>The</strong><br />
ma<strong>in</strong> priority, however, is the Hels<strong>in</strong>ki Metropolitan Area, and especially Hels<strong>in</strong>ki itself,<br />
where long-term homelessness is concentrated.<br />
<strong>The</strong> program is structured around the hous<strong>in</strong>g first pr<strong>in</strong>ciple. Solutions to social and<br />
health problems cannot be a condition for organiz<strong>in</strong>g accommodation: on the contrary,<br />
accommodation is a requirement which also allows other problems <strong>of</strong> people who have<br />
been homeless to be solved. Hav<strong>in</strong>g somewhere to live makes it possible to strengthen<br />
life management skills and is conducive to purposeful activity.<br />
Because <strong>of</strong> all the reasons there are for long-term homelessness, if it is to be cut there<br />
need to be simultaneous measures at different levels, i.e. universal hous<strong>in</strong>g and social<br />
policy measures, the prevention <strong>of</strong> homelessness and targeted action to reduce longterm<br />
homelessness.<br />
<strong>The</strong> program’s objectives are:<br />
To halve long-term homelessness by 2011<br />
To elim<strong>in</strong>ate homelessness entirely by 2015<br />
More effective measures to prevent homelessness<br />
France<br />
<strong>The</strong> French government launched a Hous<strong>in</strong>g First-like program <strong>in</strong> France <strong>in</strong> 2010 <strong>in</strong> 4<br />
major cities - Toulouse, Marseille, Lille and Paris - called "Un chez-Soi d'abord". It<br />
follows the same pr<strong>in</strong>ciples as the Canadian and <strong>US</strong> programs: it is focused on<br />
homeless people with mental illness or addicted to drugs or alcohol. <strong>The</strong> plan is on a<br />
three-year basis for each <strong>in</strong>dividual, liv<strong>in</strong>g <strong>in</strong> accommodation provided by an NGO.<br />
Page 152 <strong>of</strong> 289
Clients are given any needed help with social issues and medical care. <strong>The</strong> first houses<br />
have been work<strong>in</strong>g <strong>in</strong> three cities s<strong>in</strong>ce 2011 and a hundred apartments have been<br />
planned <strong>in</strong> Paris start<strong>in</strong>g <strong>in</strong> May 2012.<br />
Several NGOs are <strong>in</strong>volved <strong>in</strong> this trial. <strong>The</strong>y provide rental management and social<br />
support for tenants.<br />
Those NGOs are l<strong>in</strong>ked with scientists <strong>in</strong>vestigat<strong>in</strong>g the results <strong>of</strong> the experiment and<br />
serve as a relay for <strong>in</strong>formation and status reports on the targeted public. <strong>The</strong> lead team<br />
<strong>of</strong> "Un chez-soi d'abord" is expect<strong>in</strong>g results to be published around 2017.<br />
Japan<br />
Though homeless support groups like non-pr<strong>of</strong>it<br />
organization Moyai, Bigissue, Médec<strong>in</strong>s du Monde Japan have requested Hous<strong>in</strong>g First,<br />
Japanese government does not have a Hous<strong>in</strong>g First program yet. Traditionally, the<br />
government <strong>of</strong>fers public hous<strong>in</strong>g so-called Koei-jutaku for low-<strong>in</strong>come people by public<br />
hous<strong>in</strong>g law and it is run by local government. Rent fees are subject to change<br />
accord<strong>in</strong>g to household <strong>in</strong>come. Because applicants must be selected by lottery, low<strong>in</strong>come<br />
people cannot live <strong>in</strong> the hous<strong>in</strong>g soon though they have an advantage. <strong>The</strong>re<br />
are a couple <strong>of</strong> Hous<strong>in</strong>g First-like programs. Non-pr<strong>of</strong>it organization<br />
Page 153 <strong>of</strong> 289
Littleones renovates discarded or empty homes and they rent the rooms to s<strong>in</strong>gle<br />
mothers with f<strong>in</strong>ancial and occupational support. Tsukuroi Tokyo fund advocates a<br />
hous<strong>in</strong>g first and they built a shelter specially for homeless people.<br />
United K<strong>in</strong>gdom<br />
<strong>The</strong> UK government announced plans for a Hous<strong>in</strong>g First pilot program <strong>in</strong> the West<br />
Midlands, Liverpool, and Manchester, along with fund<strong>in</strong>g <strong>of</strong> £28m. This followed<br />
publication <strong>of</strong> a report entitled Hous<strong>in</strong>g First by the Centre for Social Justice which cited<br />
the results from the F<strong>in</strong>nish application <strong>of</strong> Hous<strong>in</strong>g First.<br />
One-Size-Fits-All<br />
Criticism <strong>of</strong> Hous<strong>in</strong>g First<br />
Ralph DaCosta Nunez, the President and CEO <strong>of</strong> the Institute for Children, Poverty and<br />
<strong>Homelessness</strong> (ICPH), who is also a Pr<strong>of</strong>essor at Columbia University, predicted this<br />
one-size-fits-all is dest<strong>in</strong>ed to fail as statistics <strong>in</strong> New York City prove. Dr. Nunez<br />
described the approach as "'public stupidity'" rather than "'public policy'". He also<br />
compla<strong>in</strong>ed that Hous<strong>in</strong>g First "is all that’s left after the other poverty fight<strong>in</strong>g programs<br />
have been underfunded or elim<strong>in</strong>ated." Nunez advocates for a three tiered approach to<br />
address<strong>in</strong>g homelessness with Hous<strong>in</strong>g First as only the first component <strong>of</strong> that<br />
approach.<br />
Follow<strong>in</strong>g Panelák: A Failed Communist Model<br />
Sharam Kohan, a social policy expert and economist, compared the Hous<strong>in</strong>g First<br />
model to Panelák <strong>of</strong> the former communist countries that tried to end homelessness by<br />
provid<strong>in</strong>g permanent and unconditional public hous<strong>in</strong>g. Dr. Kohan criticized Hous<strong>in</strong>g<br />
First model for follow<strong>in</strong>g Panelák's failed philosophy and approaches. Dr. Kohan po<strong>in</strong>ts<br />
to a grow<strong>in</strong>g number <strong>of</strong> reports from communities that have implemented Hous<strong>in</strong>g First<br />
programs which are "credited with creat<strong>in</strong>g slums and slumlord."<br />
Limits <strong>of</strong> Evidence Based Policy<br />
On July 31, 2011, Pr<strong>of</strong>. Victoria Stanhope, Ph.D., <strong>of</strong> New York University School <strong>of</strong><br />
Social Work and Pr<strong>of</strong>. Kerry Dunn, J.D., Ph.D., <strong>of</strong> University <strong>of</strong> New England School <strong>of</strong><br />
Social Work, published “<strong>The</strong> curious case <strong>of</strong> Hous<strong>in</strong>g First; <strong>The</strong> limits <strong>of</strong> evidence-based<br />
policy” <strong>in</strong> the International Journal <strong>of</strong> Law and Psychiatry. Drs. Stanhope and Dunn<br />
gave an overview <strong>of</strong> evidence-based policy and presented “critiques based on its<br />
reliance on positivist methods and technical approach to policy mak<strong>in</strong>g. Us<strong>in</strong>g these<br />
critiques as a framework, the paper discusse[d] the case <strong>of</strong> Hous<strong>in</strong>g First, a policy<br />
adopted by the Bush Adm<strong>in</strong>istration <strong>in</strong> order to address the problem <strong>of</strong> chronic<br />
homelessness.” Accord<strong>in</strong>g to Drs. Stanhope and Dunn, the Hous<strong>in</strong>g First “is an<br />
example <strong>of</strong> research-driven policy mak<strong>in</strong>g but also resulted <strong>in</strong> a progressive policy be<strong>in</strong>g<br />
promoted by a conservative adm<strong>in</strong>istration. In discuss<strong>in</strong>g the case, the paper elaborates<br />
Page 154 <strong>of</strong> 289
on the relationship between evidence and policy, argu<strong>in</strong>g that evidence-based policy<br />
fails to <strong>in</strong>tegrate evidence and values <strong>in</strong>to policy deliberations. <strong>The</strong> paper concludes<br />
with alternative models <strong>of</strong> policy decision-mak<strong>in</strong>g and their implications for research.”<br />
Hous<strong>in</strong>g First has been criticized on its failure to address broader service outcomes,<br />
namely substance abuse (<strong>in</strong> one case, it was argued that the only reason substance<br />
abuse outcomes were no worse was that the residents were not severely<br />
addicted). <strong>The</strong>se criticisms have been rebutted on the grounds that Hous<strong>in</strong>g First is a<br />
program to end homelessness not to reduce substance abuse, though more recent<br />
research <strong>in</strong>dicates it is more effective than traditional approaches <strong>in</strong> this regard as<br />
well. This exchange highlights the way <strong>in</strong> which the selection <strong>of</strong> outcomes sets both the<br />
terms <strong>of</strong> the debate and the parameters <strong>of</strong> “what works.” Embedded <strong>in</strong> that mantra are a<br />
priori decisions about what constitutes work<strong>in</strong>g and for whom; <strong>in</strong> this case it was stable<br />
hous<strong>in</strong>g for the chronic homeless.<br />
Accord<strong>in</strong>g to Stanhope, Hous<strong>in</strong>g First “asserts a right to hous<strong>in</strong>g. Such a material right<br />
is an anathema to neoliberal ideology and challenges deeply held beliefs that have<br />
shaped <strong>US</strong> welfare from its <strong>in</strong>ception: That no one has a right to a government benefit<br />
unless they have proved themselves to be deserv<strong>in</strong>g or worthy (e.g., "TANF"), or have<br />
earned it (e.g., social <strong>in</strong>surance).”<br />
Page 155 <strong>of</strong> 289
Page 156 <strong>of</strong> 289
VIII. <strong>The</strong> Crim<strong>in</strong>alization <strong>of</strong><br />
<strong>Homelessness</strong><br />
National Coalition for <strong>The</strong> Homeless<br />
<strong>The</strong> crim<strong>in</strong>alization <strong>of</strong> homelessness refers to measures that prohibit life-susta<strong>in</strong><strong>in</strong>g<br />
activities such as sleep<strong>in</strong>g/camp<strong>in</strong>g, eat<strong>in</strong>g, sitt<strong>in</strong>g, and/or ask<strong>in</strong>g for money/resources<br />
<strong>in</strong> public spaces. <strong>The</strong>se ord<strong>in</strong>ances <strong>in</strong>clude crim<strong>in</strong>al penalties for violations <strong>of</strong> these<br />
acts.<br />
<strong>The</strong>re are multiple types <strong>of</strong> crim<strong>in</strong>alization measures which <strong>in</strong>clude:<br />
<br />
Carry<strong>in</strong>g out sweeps (confiscat<strong>in</strong>g personal property <strong>in</strong>clud<strong>in</strong>g tents, bedd<strong>in</strong>g,<br />
papers, cloth<strong>in</strong>g, medications, etc.) <strong>in</strong> city areas where homeless people live.<br />
<br />
<br />
<br />
Mak<strong>in</strong>g panhandl<strong>in</strong>g illegal.<br />
Mak<strong>in</strong>g it illegal for groups to share food with homeless persons <strong>in</strong> public spaces.<br />
Enforc<strong>in</strong>g a “quality <strong>of</strong> life” ord<strong>in</strong>ance relat<strong>in</strong>g to public activity and hygiene.<br />
Page 157 <strong>of</strong> 289
Unfortunately, over the past 25 years, cities across the country have penalized people<br />
who are forced to carryout out life-susta<strong>in</strong><strong>in</strong>g activities on the street and <strong>in</strong> public<br />
spaces; despite the fact these communities lack adequate affordable hous<strong>in</strong>g and<br />
shelter space. Ultimately, many <strong>of</strong> these measures are designed to move homeless<br />
persons out <strong>of</strong> sight, and at times out <strong>of</strong> a given city.<br />
Why Is This An Issue?<br />
Crim<strong>in</strong>alization measures that punish homelessness and activities necessary to survive<br />
on the street are counterproductive to end<strong>in</strong>g homelessness. Associated f<strong>in</strong>es and<br />
crim<strong>in</strong>al records provide greater barriers for many to becom<strong>in</strong>g re-housed, and <strong>of</strong>ten<br />
perpetuate negative sentiments towards people who are homeless.<br />
<strong>The</strong> <strong>US</strong> Interagency Council on <strong>Homelessness</strong> has strongly advised local governments<br />
not to enact laws crim<strong>in</strong>aliz<strong>in</strong>g homelessness because they create additional barriers for<br />
homeless people, fail to <strong>in</strong>crease access to services, and underm<strong>in</strong>e the impact <strong>of</strong><br />
service providers.<br />
Consequently, many crim<strong>in</strong>alization measures:<br />
VIOLATE HOMELESS PERSONS’ CONSTITUTIONAL RIGHTS<br />
<br />
<br />
<br />
1st Amendment protection <strong>of</strong> free speech – Laws restrict<strong>in</strong>g speech like begg<strong>in</strong>g<br />
targets speech based on content, or does not allow for alternative channels <strong>of</strong><br />
communication.<br />
4th Amendment protection from unreasonable search and seizure – Law<br />
enforcement be<strong>in</strong>g allowed to destroy a homeless person’s belong<strong>in</strong>gs.<br />
8th Amendment protection from cruel and unusual punishment – Impos<strong>in</strong>g<br />
crim<strong>in</strong>al penalties for engag<strong>in</strong>g <strong>in</strong> necessary life susta<strong>in</strong><strong>in</strong>g activities.<br />
14th Amendment protect<strong>in</strong>g citizenship, due process, and equal protection –<br />
Vague statutes which do not give a person notice <strong>of</strong> prohibited conduct and<br />
encourage arbitrary enforcement.<br />
EXACERBATE THE SITUATION<br />
A crim<strong>in</strong>al record adds to the already difficult situation <strong>of</strong> f<strong>in</strong>d<strong>in</strong>g employment,<br />
gett<strong>in</strong>g hous<strong>in</strong>g, or be<strong>in</strong>g eligible for certa<strong>in</strong> services.<br />
Additionally, the crim<strong>in</strong>alization <strong>of</strong> homelessness adds to an already<br />
overburdened crim<strong>in</strong>al justice system by deta<strong>in</strong><strong>in</strong>g <strong>in</strong>dividuals who have not<br />
committed serious crimes. One night <strong>in</strong> jail costs 3x more on average than a<br />
shelter, and law enforcement is both unprepared and <strong>in</strong>capable <strong>of</strong> handl<strong>in</strong>g<br />
homelessness and related issues.<br />
CREATE ISSUES OF MORALITY<br />
<strong>The</strong>re is a clear moral issue with punish<strong>in</strong>g someone for carry<strong>in</strong>g out life-susta<strong>in</strong><strong>in</strong>g<br />
activities <strong>in</strong> public when there are no alternatives. People who are already suffer<strong>in</strong>g are<br />
be<strong>in</strong>g punished further for suffer<strong>in</strong>g.<br />
Page 158 <strong>of</strong> 289
Additionally, the crim<strong>in</strong>alization <strong>of</strong> homelessness is aimed at the visual ramifications <strong>of</strong><br />
homelessness, not the root causes. Not only does it fail to address the underly<strong>in</strong>g<br />
causes, but it further underm<strong>in</strong>es the challenges <strong>of</strong> homelessness.<br />
TAKING ACTION<br />
What Can Be Done?<br />
<strong>The</strong> trend <strong>of</strong> crim<strong>in</strong>aliz<strong>in</strong>g homelessness cont<strong>in</strong>ues to grow. Among the 188 cities<br />
reviewed <strong>in</strong> NCH’s report, the follow<strong>in</strong>g <strong>in</strong>creases were identified <strong>in</strong> crim<strong>in</strong>alization<br />
measures:<br />
<br />
<br />
<br />
7% <strong>in</strong>crease <strong>in</strong> prohibitions on begg<strong>in</strong>g or panhandl<strong>in</strong>g<br />
7% <strong>in</strong>crease <strong>in</strong> prohibitions on camp<strong>in</strong>g <strong>in</strong> particular public places<br />
10% <strong>in</strong>crease <strong>in</strong> prohibitions on loiter<strong>in</strong>g <strong>in</strong> particular public places<br />
By focus<strong>in</strong>g on revers<strong>in</strong>g the crim<strong>in</strong>alization <strong>of</strong> homelessness, the additional obstacles<br />
homeless people face can be removed from the already difficult task <strong>of</strong> help<strong>in</strong>g resolve<br />
homelessness.<br />
Many statewide Homeless Bill <strong>of</strong> Rights have passed or are be<strong>in</strong>g considered that<br />
provide alternatives to crim<strong>in</strong>alization and protection <strong>of</strong> the civil rights <strong>of</strong> people<br />
experienc<strong>in</strong>g homelessness.<br />
Page 159 <strong>of</strong> 289
PUBLICATIONS AND DOCUMENTS<br />
<br />
<br />
<br />
National Coalition for the Homeless - Share No More: <strong>The</strong> Crim<strong>in</strong>alization <strong>of</strong><br />
Efforts to Feed People <strong>in</strong> Need, Report 2014<br />
National Law Center on <strong>Homelessness</strong> & Poverty, National Coalition for the<br />
Homeless - Homes Not Handcuffs: <strong>The</strong> Crim<strong>in</strong>alization <strong>of</strong> <strong>Homelessness</strong> <strong>in</strong> U.S.<br />
Cities<br />
National Law Center on <strong>Homelessness</strong> & Poverty (NLCHP) - No Safe Place: <strong>The</strong><br />
Crim<strong>in</strong>alization <strong>of</strong> Homeless <strong>in</strong> U.S. Cities<br />
NCH LINKS<br />
<br />
<br />
<br />
Homeless Bill <strong>of</strong> Rights<br />
Hate Crimes Aga<strong>in</strong>st People Experienc<strong>in</strong>g <strong>Homelessness</strong><br />
"You Don't Need a Home to Vote" Campaign<br />
Other Resources<br />
<br />
<br />
About the <strong>in</strong>tersection <strong>of</strong> the crim<strong>in</strong>alization <strong>of</strong> mental illness and homelessness<br />
Tools for stopp<strong>in</strong>g street harassment<br />
________<br />
Help Us End <strong>The</strong> Crim<strong>in</strong>alization <strong>of</strong> <strong>Homelessness</strong><br />
National Law Center on <strong>Homelessness</strong> and Poverty<br />
In response to a troubl<strong>in</strong>g <strong>in</strong>crease <strong>in</strong> laws that crim<strong>in</strong>alize homelessness the National<br />
Law Center on <strong>Homelessness</strong> and Poverty launched the Hous<strong>in</strong>g Not Handcuffs<br />
campaign to help combat this trend. <strong>The</strong> Hous<strong>in</strong>g Not Handcuffs campaign is centered<br />
around the belief that no homeless person should be penalized for simply carry<strong>in</strong>g out<br />
basic human functions and should be able to live with dignity.<br />
Whether you are an experienced advocate, a person experienc<strong>in</strong>g or who has<br />
experienced homelessness, a concerned neighbor, a small bus<strong>in</strong>ess owner, a<br />
government <strong>of</strong>ficial, or anyone <strong>in</strong> between, you can make a difference to this campaign.<br />
Endorse the Hous<strong>in</strong>g Not Handcuffs campaign today.<br />
<strong>Homelessness</strong> cont<strong>in</strong>ues to be a national crisis, affect<strong>in</strong>g millions <strong>of</strong> people each year,<br />
<strong>in</strong>clud<strong>in</strong>g a ris<strong>in</strong>g number <strong>of</strong> families. Homeless people, like all people, must engage <strong>in</strong><br />
activities such as sleep<strong>in</strong>g or sitt<strong>in</strong>g down <strong>in</strong> order to survive. Yet, <strong>in</strong> communities<br />
across the nation, these harmless, unavoidable behaviors are treated as crim<strong>in</strong>al<br />
activity under laws that crim<strong>in</strong>alize homelessness.<br />
<strong>Homelessness</strong> is caused by a severe shortage <strong>of</strong> affordable hous<strong>in</strong>g.<br />
Page 160 <strong>of</strong> 289
A lack <strong>of</strong> affordable hous<strong>in</strong>g is the lead<strong>in</strong>g cause <strong>of</strong> homelessness, and the problem is<br />
worsen<strong>in</strong>g. Ris<strong>in</strong>g rents, historically low vacancy rates, and the cont<strong>in</strong>ued decl<strong>in</strong>e <strong>of</strong><br />
federally subsidized hous<strong>in</strong>g have led to a 7.2 million unit shortage <strong>of</strong> affordable rental<br />
units available to our nation’s lowest <strong>in</strong>come renters. This means that for every 100<br />
extremely poor households <strong>in</strong> the country, only 31 will f<strong>in</strong>d affordable and available<br />
rental units.<br />
<strong>The</strong>re are fewer available shelter beds than homeless people <strong>in</strong> major cities across the<br />
nation. In some places, the gap between available space and human need is significant,<br />
leav<strong>in</strong>g hundreds or, <strong>in</strong> some cases, thousands <strong>of</strong> people with no choice but to struggle<br />
for survival <strong>in</strong> outdoor, public places.<br />
Despite the lack <strong>of</strong> affordable hous<strong>in</strong>g and shelter space, many cities have chosen to<br />
crim<strong>in</strong>ally punish people liv<strong>in</strong>g on the street for do<strong>in</strong>g what any human be<strong>in</strong>g must do to<br />
survive.<br />
Problems Arise when Cities turn to Crim<strong>in</strong>alization Measures<br />
Crim<strong>in</strong>alization measures do noth<strong>in</strong>g to address the underly<strong>in</strong>g causes <strong>of</strong> homelessness<br />
and, <strong>in</strong>stead, only worsen the problem. <strong>The</strong>re has been an <strong>in</strong>crease <strong>in</strong> laws<br />
crim<strong>in</strong>aliz<strong>in</strong>g homelessness as <strong>in</strong>dicated <strong>in</strong> the Law Center's latest report, Hous<strong>in</strong>g Not<br />
Handcuffs. While the <strong>in</strong>crease is seen for nearly every surveyed category <strong>of</strong><br />
crim<strong>in</strong>alization law, the most dramatic uptick has been <strong>in</strong> city-wide bans on fundamental<br />
human activities. This <strong>in</strong>crease <strong>in</strong> city-wide bans shows that the nature <strong>of</strong> crim<strong>in</strong>alization<br />
is chang<strong>in</strong>g and that cities are mov<strong>in</strong>g toward prohibit<strong>in</strong>g unavoidable, life susta<strong>in</strong><strong>in</strong>g<br />
Page 161 <strong>of</strong> 289
activities throughout entire communities rather than <strong>in</strong> specific areas, effectively<br />
crim<strong>in</strong>aliz<strong>in</strong>g a homeless person’s very existence.<br />
Crim<strong>in</strong>alization Questions Fundamental Rights<br />
Crim<strong>in</strong>alization laws raise important constitutional concerns, and courts across the<br />
country have found that many such laws violate the rights <strong>of</strong> homeless people. Courts<br />
have <strong>in</strong>validated or enjo<strong>in</strong>ed enforcement <strong>of</strong> crim<strong>in</strong>alization laws on the grounds that<br />
they violate constitutional protections such as the right to freedom <strong>of</strong> speech under the<br />
First Amendment, freedom from cruel and unusual punishment under the Eighth<br />
Amendment, and the right to due process <strong>of</strong> law guaranteed by the Fourteenth<br />
Amendment.<br />
Moreover, the crim<strong>in</strong>alization <strong>of</strong> homelessness violates <strong>in</strong>ternational human<br />
rights treaties to which the U.S. is a party. In 2014, the U.N. Human Rights Committee,<br />
review<strong>in</strong>g U.S. compliance under the International Covenant on Civil and Political<br />
Rights, found that the crim<strong>in</strong>alization <strong>of</strong> homelessness <strong>in</strong> the U.S. violated the treaty.<br />
Crim<strong>in</strong>alization Misuses Public Resources<br />
Us<strong>in</strong>g the crim<strong>in</strong>al justice system to address homelessness misuses police resources to<br />
address a social problem. This overuse <strong>of</strong> police to solve social problems has been<br />
criticized by many – <strong>in</strong>clud<strong>in</strong>g police <strong>of</strong>ficers – as contribut<strong>in</strong>g to the current climate <strong>of</strong><br />
tension between police and neighborhoods subjected to unnecessarily high levels <strong>of</strong><br />
police activity.<br />
Crim<strong>in</strong>alization is Cost Ineffective<br />
Crim<strong>in</strong>alization is the most expensive and least effective way <strong>of</strong> address<strong>in</strong>g<br />
homelessness. A grow<strong>in</strong>g body <strong>of</strong> research compar<strong>in</strong>g the cost <strong>of</strong> homelessness<br />
(<strong>in</strong>clud<strong>in</strong>g the cost <strong>of</strong> crim<strong>in</strong>alization) with the cost <strong>of</strong> provid<strong>in</strong>g hous<strong>in</strong>g to homeless<br />
people shows that hous<strong>in</strong>g is the most affordable option. With state and local budgets<br />
stretched to their limit, rational, cost-effective policies are needed – not <strong>in</strong>effective<br />
measures that waste precious taxpayer dollars.<br />
Crim<strong>in</strong>alization Laws Should Be Replaced with Constructive Solutions to End<strong>in</strong>g<br />
<strong>Homelessness</strong><br />
Crim<strong>in</strong>alization is not the answer to meet<strong>in</strong>g the needs <strong>of</strong> cities that are concerned<br />
about homelessness. <strong>The</strong>re are sensible, cost-effective, and humane solutions to<br />
homelessness, which a number <strong>of</strong> cities have pursued.<br />
________<br />
Page 162 <strong>of</strong> 289
Crim<strong>in</strong>alization <strong>of</strong> <strong>Homelessness</strong> Increases <strong>in</strong> U.S. Cities<br />
National Low Income Hous<strong>in</strong>g Coalition<br />
A report by the National Law Center on <strong>Homelessness</strong> and Poverty (NLCHP) found an<br />
<strong>in</strong>crease <strong>in</strong> the crim<strong>in</strong>alization <strong>of</strong> homelessness over the past 10 years <strong>in</strong> U.S. cities.<br />
NLCHP recommends more sensible, humane, and effective policies to address<br />
homelessness that range from repeal<strong>in</strong>g laws that crim<strong>in</strong>alize homelessness to<br />
expand<strong>in</strong>g access to affordable hous<strong>in</strong>g.<br />
Local governments <strong>in</strong>creas<strong>in</strong>gly face dw<strong>in</strong>dl<strong>in</strong>g resources, particularly for affordable<br />
hous<strong>in</strong>g, to contend with homelessness. Rather than focus on the root causes <strong>of</strong><br />
homelessness, many cities have enacted laws that make life-susta<strong>in</strong><strong>in</strong>g activities for the<br />
homeless, such as sleep<strong>in</strong>g <strong>in</strong> public spaces, illegal. <strong>The</strong>se laws represent a clear <strong>in</strong>tent<br />
to remove the homeless from public spaces, despite the lack <strong>of</strong> other options for<br />
homeless <strong>in</strong>dividuals.<br />
NLCHP surveyed the ord<strong>in</strong>ances <strong>of</strong> 187 cities for the last 10 years. Among these cities:<br />
• Thirty-three percent prohibit camp<strong>in</strong>g <strong>in</strong> public citywide, and 50% prohibit<br />
camp<strong>in</strong>g <strong>in</strong> particular public places.<br />
• Eighteen percent prohibit sleep<strong>in</strong>g <strong>in</strong> public citywide, and 27% prohibit sleep<strong>in</strong>g<br />
<strong>in</strong> particular public places.<br />
Page 163 <strong>of</strong> 289
• Thirty-n<strong>in</strong>e percent prohibit liv<strong>in</strong>g <strong>in</strong> vehicles.<br />
• Forty-seven percent prohibit sitt<strong>in</strong>g and ly<strong>in</strong>g down <strong>in</strong> particular public places.<br />
• Twenty-seven percent prohibit panhandl<strong>in</strong>g citywide, and 61% prohibit<br />
panhandl<strong>in</strong>g <strong>in</strong> particular public places.<br />
• Thirty-two percent have citywide prohibitions on loiter<strong>in</strong>g, loaf<strong>in</strong>g, and vagrancy,<br />
and 54% have similar prohibitions for specific public places.<br />
<strong>The</strong> prevalence <strong>of</strong> these laws, particularly citywide prohibitions, have dramatically<br />
<strong>in</strong>creased over the past 10 years. S<strong>in</strong>ce 2006, citywide bans on loiter<strong>in</strong>g, loaf<strong>in</strong>g, and<br />
vagrancy <strong>in</strong>creased by 88%, on sitt<strong>in</strong>g and ly<strong>in</strong>g down <strong>in</strong> certa<strong>in</strong> public places <strong>in</strong>creased<br />
by 52%, on panhandl<strong>in</strong>g grew by 43%, on camp<strong>in</strong>g <strong>in</strong>creased by 69%, and on sleep<strong>in</strong>g<br />
<strong>in</strong> public <strong>in</strong>creased by 31%.<br />
<strong>The</strong> report recommends repeal<strong>in</strong>g laws that crim<strong>in</strong>alize homelessness and tra<strong>in</strong><strong>in</strong>g law<br />
enforcement <strong>of</strong>ficials on how to respond to a homeless person with a mental health<br />
crisis to reduce the likelihood <strong>of</strong> them go<strong>in</strong>g to jail rather than gett<strong>in</strong>g treatment. <strong>The</strong><br />
report identifies the lack <strong>of</strong> affordable hous<strong>in</strong>g as the key issue driv<strong>in</strong>g homelessness.<br />
<strong>The</strong> report recommends strengthen<strong>in</strong>g tenant protections, <strong>in</strong>creas<strong>in</strong>g the m<strong>in</strong>imum<br />
wage, and expand<strong>in</strong>g the supply <strong>of</strong> hous<strong>in</strong>g affordable to the lowest <strong>in</strong>come<br />
households.<br />
________<br />
THE CRIMINALIZATION OF HOMELESSNESS:<br />
AN EXPLAINER<br />
Bidish Sarma, Jessica Brand | Jun 29, 2018<br />
Most even<strong>in</strong>gs, Aguirre Dick rides his bike about three miles from the streets <strong>of</strong> Waikiki<br />
<strong>in</strong> Honolulu to the slopes <strong>of</strong> a volcano, where he sleeps. If he doesn’t make that trek, he<br />
could be arrested. A 2014 law made it illegal to sit or lie down on the public sidewalks <strong>in</strong><br />
Waikiki. As a result <strong>of</strong> this law, those without homes, like Aguirre, live <strong>in</strong> constant fear <strong>of</strong><br />
be<strong>in</strong>g pushed <strong>in</strong>to the crim<strong>in</strong>al justice system simply because they are too poor to own<br />
or rent lodg<strong>in</strong>g.<br />
In San Diego, police arrested a pregnant Alexis Leftridge as she slept <strong>in</strong> her tent and<br />
jailed her for several days. Leftridge became homeless after los<strong>in</strong>g her nurs<strong>in</strong>g job <strong>in</strong><br />
2014 — without money for rent, she was evicted. To get out <strong>of</strong> jail, she agreed to an<br />
order to stay away from the area, but she now has so many that she does not know<br />
where to go. Accord<strong>in</strong>g to plead<strong>in</strong>gsfiled <strong>in</strong> a lawsuit aga<strong>in</strong>st the city, she is afraid she<br />
will be arrested for “walk<strong>in</strong>g along the wrong street.” She has subsequently given birth<br />
Page 164 <strong>of</strong> 289
to a baby boy and currently has a room at a shelter. But, because the shelter is with<strong>in</strong><br />
the “stay away” area, she is at risk <strong>of</strong> re-arrest.<br />
In Houston, Texas, Spencer Stevens became homeless <strong>in</strong> 2015 after los<strong>in</strong>g his job as a<br />
forklift operator. He has congestive heart failure, which prevents him from tak<strong>in</strong>g<br />
another manual labor job. Liv<strong>in</strong>g under the highway median, he cooks meals on his<br />
griddle. If legal challenges fail, he could be arrested for both liv<strong>in</strong>g and cook<strong>in</strong>g there.<br />
Houston has made it illegal to block a sidewalk, stand on a roadway median, sleep on<br />
public property or <strong>in</strong> a makeshift shelter, or have a heat<strong>in</strong>g device <strong>in</strong> public.<br />
Every day, law enforcement <strong>of</strong>ficers across the country issue tickets to those<br />
experienc<strong>in</strong>g homelessness as they engage <strong>in</strong> basic, life-susta<strong>in</strong><strong>in</strong>g behaviors, like<br />
sleep<strong>in</strong>g on the streets or cook<strong>in</strong>g a meal <strong>in</strong> public on a griddle. Prosecutors then<br />
frequently charge those <strong>in</strong>dividuals with crimes. By rely<strong>in</strong>g upon law enforcement to<br />
address an issue that should more appropriately be considered as fall<strong>in</strong>g with<strong>in</strong> the<br />
doma<strong>in</strong> <strong>of</strong> public health, communities are expend<strong>in</strong>g a tremendous amount <strong>of</strong> public<br />
money unnecessarily and <strong>in</strong>effectively, and exacerbat<strong>in</strong>g the underly<strong>in</strong>g causes <strong>of</strong><br />
homelessness. Below, we discuss the destructive and <strong>of</strong>ten devastat<strong>in</strong>g human and<br />
f<strong>in</strong>ancial costs <strong>of</strong> crim<strong>in</strong>aliz<strong>in</strong>g homelessness <strong>in</strong> America.<br />
1. <strong>Homelessness</strong> is a chronic problem.<br />
Experts believe that as many as two million people <strong>in</strong> the country experience<br />
homelessness at some po<strong>in</strong>t <strong>in</strong> a given year, with about 500,000 liv<strong>in</strong>g without a home<br />
Page 165 <strong>of</strong> 289
each night. About 15 percent <strong>of</strong> those are chronically homeless, mean<strong>in</strong>g they have<br />
been without a home for years.<br />
Racial m<strong>in</strong>orities comprise a significant percentage <strong>of</strong> the population experienc<strong>in</strong>g<br />
homelessness. While African Americans represent about 12.5 percent <strong>of</strong> the general<br />
population, they represent over 40 percent <strong>of</strong> the homeless population.<br />
In some communities, there has been a significant <strong>in</strong>crease <strong>in</strong> the population <strong>of</strong> Lat<strong>in</strong>os<br />
fac<strong>in</strong>g homelessness. Many experience acute fear or face unique obstacles as a result<br />
<strong>of</strong> their uncerta<strong>in</strong> legal status. Consider Hector, a homeless man <strong>in</strong> New York who does<br />
not utilize shelter services because he is afraid that he will be identified and then<br />
deported. He lives near the tra<strong>in</strong> tracks along with several others who have refused to<br />
enter shelters s<strong>in</strong>ce President Trump’s immigration crackdown.<br />
Military veterans confront homelessness at an alarm<strong>in</strong>g rate. More than 10 percent <strong>of</strong><br />
the adult homeless population has served <strong>in</strong> the military.<br />
Survivors <strong>of</strong> domestic violence also experience high rates <strong>of</strong> homelessness. A recent<br />
study <strong>in</strong> M<strong>in</strong>nesota showed that 35 percent <strong>of</strong> homeless women reported domestic<br />
abuse as a cause.<br />
A 2017 nationwide survey revealed that, on a given night, almost 41,000 people<br />
experienc<strong>in</strong>g homelessness were 24 years old or younger, 12 percent <strong>of</strong> whom were<br />
below age 18. Many <strong>of</strong> these young people have suffered significant trauma. Youth who<br />
identify as LGBTQ, have special needs or disabilities, or are pregnant or parent<strong>in</strong>g are<br />
also more likely to become homeless.<br />
Half <strong>of</strong> those experienc<strong>in</strong>g homelessness have a physical or mental disability, or both.<br />
2. <strong>The</strong> crim<strong>in</strong>alization <strong>of</strong> homelessness is grow<strong>in</strong>g.<br />
Hundreds <strong>of</strong> jurisdictions across the U.S. have crim<strong>in</strong>alized homelessness, and the<br />
trend shows no signs <strong>of</strong> abat<strong>in</strong>g. Laws crim<strong>in</strong>aliz<strong>in</strong>g homelessness have multiplied <strong>in</strong><br />
the last 10 years <strong>in</strong> 187 studied cities. <strong>The</strong> report calls out several jurisdictions <strong>in</strong> a “Hall<br />
<strong>of</strong> Shame” section, <strong>in</strong>clud<strong>in</strong>g Honolulu, Denver, and Dallas.<br />
In 2016, Honolulu adopted a spate <strong>of</strong> laws that target homeless people, and police<br />
ramped up enforcement <strong>of</strong> these “quality <strong>of</strong> life” ord<strong>in</strong>ances. Why? Pressure from the<br />
bus<strong>in</strong>ess and tourism <strong>in</strong>dustry, which <strong>in</strong> the past has funded airfare to the ma<strong>in</strong>land for<br />
homeless people who came to Hawaii.<br />
In Denver, the state’s 76 largest cities have, as a group, passed 351 ord<strong>in</strong>ances that<br />
target homeless people, <strong>in</strong>clud<strong>in</strong>g bans on camp<strong>in</strong>g and bans on shar<strong>in</strong>g food outside.<br />
Page 166 <strong>of</strong> 289
In Dallas, police issued 11,000 “sleep<strong>in</strong>g <strong>in</strong> public” citations between 2011 and 2015.<br />
Police also stopped people for loiter<strong>in</strong>g, panhandl<strong>in</strong>g, and for sleep<strong>in</strong>g <strong>in</strong> public spaces<br />
<strong>in</strong> the city — even though the city lacks sufficient shelter beds.<br />
In late 2017 <strong>in</strong> Portland, Oregon, the Columbia Sportswear CEO called for more polic<strong>in</strong>g<br />
<strong>of</strong> the homeless population after mov<strong>in</strong>g his company headquarters downtown. In<br />
response, the head <strong>of</strong> the Bus<strong>in</strong>ess for a Better Portland urged the city to adopt “holistic<br />
and collaborative solutions” to systemically address the underly<strong>in</strong>g causes <strong>of</strong><br />
homelessness. Activists also fired back by protest<strong>in</strong>g the city’s “no-sit” laws <strong>in</strong> front <strong>of</strong><br />
Columbia Sportswear’s downtown store, forc<strong>in</strong>g the company to close for the day.<br />
3.<br />
Crim<strong>in</strong>aliz<strong>in</strong>g<br />
homelessness<br />
does noth<strong>in</strong>g<br />
to address its<br />
root causes.<br />
<strong>The</strong> causes <strong>of</strong><br />
homelessness<br />
vary, but<br />
experts largely<br />
agree that both<br />
structural and<br />
<strong>in</strong>dividual<br />
factors play a<br />
role. Structural<br />
factors <strong>in</strong>clude<br />
poverty,<br />
<strong>in</strong>adequate<br />
affordable<br />
hous<strong>in</strong>g, <strong>in</strong>adequate access to mean<strong>in</strong>gful public assistance, decreased availability <strong>of</strong><br />
mental health care, and discrim<strong>in</strong>ation.<br />
In Detroit, for example, advocates report that an <strong>in</strong>creas<strong>in</strong>g number <strong>of</strong> families<br />
experience homelessness because the city lacks affordable hous<strong>in</strong>g and has a high rate<br />
<strong>of</strong> evictions. About 3,000 children experience homelessness each year <strong>in</strong> Detroit.<br />
Similarly, <strong>in</strong> San Diego, skyrocket<strong>in</strong>g rents, low vacancy rates, and a severe shortage <strong>of</strong><br />
affordable hous<strong>in</strong>g have placed the city at a “tipp<strong>in</strong>g po<strong>in</strong>t.” Over the past year, there<br />
has been a 14 percent <strong>in</strong>crease <strong>in</strong> people liv<strong>in</strong>g on the streets <strong>in</strong> San Diego. This<br />
situation is likely to grow worse, as California has cut $200 million from the city’s<br />
affordable hous<strong>in</strong>g programs over the past six years.<br />
<strong>The</strong>re are also personal factors that can cause homelessness, <strong>in</strong>clud<strong>in</strong>g traumatic<br />
events, family crises, and the onset <strong>of</strong> mental or physical problems.<br />
Page 167 <strong>of</strong> 289
In an <strong>in</strong>terview with NPR, David Pirtle described why, even when temperatures dropped<br />
below freez<strong>in</strong>g, he stayed on the streets. Suffer<strong>in</strong>g from schizophrenia, he feared large<br />
crowds and experienced paranoia, so he avoided shelters: “All I can say is that my fear<br />
<strong>of</strong> the unknown, <strong>of</strong> what might be wait<strong>in</strong>g for me at that shelter, was worse than my fear<br />
<strong>of</strong> the known risk, you know, <strong>of</strong> stay<strong>in</strong>g out on the street.”<br />
Dorothy Edwards spent eight years on the streets <strong>of</strong> Pasadena, California, where she<br />
slept <strong>in</strong> alleys and ate food out <strong>of</strong> Dumpsters, smok<strong>in</strong>g meth to ward <strong>of</strong>f depression.<br />
Dur<strong>in</strong>g that time, she was repeatedly sexually assaulted. She checked herself <strong>in</strong>to a<br />
psychiatric ward on numerous occasions, but kept return<strong>in</strong>g to the streets. It took eight<br />
years for counselors to diagnose her with depression and post-traumatic stress<br />
disorder. Now receiv<strong>in</strong>g adequate treatment, she lives <strong>in</strong> an apartment with her dog and<br />
is actively look<strong>in</strong>g for a job.<br />
4. <strong>The</strong>se laws crim<strong>in</strong>alize what for many is life-susta<strong>in</strong><strong>in</strong>g behavior.<br />
Instead <strong>of</strong> address<strong>in</strong>g the root causes <strong>of</strong> homelessness, states and cities have adopted<br />
hundreds <strong>of</strong> laws mak<strong>in</strong>g it harder for homeless people to survive.<br />
Camp<strong>in</strong>g, sleep<strong>in</strong>g, or ly<strong>in</strong>g down <strong>in</strong> public<br />
Accord<strong>in</strong>g to a 2014 analysis <strong>of</strong> 187 American cities by the National Law Center on<br />
<strong>Homelessness</strong> & Poverty, over half prohibited camp<strong>in</strong>g, sitt<strong>in</strong>g, or ly<strong>in</strong>g down <strong>in</strong> certa<strong>in</strong><br />
areas, and a third banned these activities citywide. Cities <strong>of</strong>ten outlaw these practices<br />
without provid<strong>in</strong>g additional shelter beds..<br />
In Houston, a city ord<strong>in</strong>ance, enacted allegedly for “safety,” makes it illegal to sleep <strong>in</strong> a<br />
tent, box, or other makeshift shelter on public property. A federal district judge issued a<br />
temporary restra<strong>in</strong><strong>in</strong>g order aga<strong>in</strong>st the ban, writ<strong>in</strong>g that those <strong>in</strong>dividuals targeted by<br />
the ord<strong>in</strong>ance are “<strong>in</strong>voluntarily <strong>in</strong> public, harmlessly attempt<strong>in</strong>g to shelter themselves —<br />
an act they cannot realistically forgo, and that is <strong>in</strong>tegral to their status as unsheltered<br />
homeless <strong>in</strong>dividuals.” But <strong>in</strong> December, the judge lifted her order.<br />
In Dallas, one <strong>in</strong>dividual, Sarge, has been ticketed repeatedly for sleep<strong>in</strong>g <strong>in</strong> public,<br />
someth<strong>in</strong>g he must do to survive. He estimates that he has received around 75 tickets<br />
over the years.<br />
In Aust<strong>in</strong>, a man named Ross reports be<strong>in</strong>g “herded like cattle” because <strong>of</strong> the city’s<br />
anti-camp<strong>in</strong>g law. “<strong>The</strong>y have a law say<strong>in</strong>g you can’t sit down. So if you don’t have<br />
anywhere to live and all the homeless shelters are full, then where do you go? Do you<br />
walk <strong>in</strong> a circle 24 hours a day?<br />
You have to sleep and if you slow down to sleep you go to jail for it, which I’ve done,<br />
that’s pretty much where you get to sleep.”<br />
Page 168 <strong>of</strong> 289
Begg<strong>in</strong>g <strong>in</strong> Public (Panhandl<strong>in</strong>g)<br />
Accord<strong>in</strong>g to the 2014 National Law Center on <strong>Homelessness</strong> & Poverty report, there<br />
was a 25 percent <strong>in</strong>crease <strong>in</strong> anti-panhandl<strong>in</strong>g laws between 2011 and 2014.<br />
In 2014 <strong>in</strong> Denver, police arrested 300 people for panhandl<strong>in</strong>g. In New York, police<br />
arrested a homeless man after he asked a police <strong>of</strong>ficer if he had a dollar to spare.<br />
Jason Metts <strong>of</strong> Fayetteville, North Carol<strong>in</strong>a, reports that he is disabled and can’t work.<br />
“To survive,” he told a reporter, he has started panhandl<strong>in</strong>g. Police have arrested him<br />
seven times. “I’m not steal<strong>in</strong>g, I’m not robb<strong>in</strong>g people, and I’m not approach<strong>in</strong>g<br />
anybody. Those that give to me roll down their w<strong>in</strong>dows, I’m not scar<strong>in</strong>g them,” Metts<br />
stated.<br />
Encroachment — stor<strong>in</strong>g property <strong>in</strong> public ways<br />
Laws across the country make it illegal for<br />
<strong>in</strong>dividuals to place property on public ways. For<br />
those with no home, there is no other place to<br />
store their belong<strong>in</strong>gs.<br />
In San Diego, police cited Army veteran Eric<br />
Arundel several times after he placed his tarp,<br />
bedd<strong>in</strong>g, cloth<strong>in</strong>g, medication, and toiletries on the<br />
sidewalk.<br />
He suffers from pneumonia and uses the tarp to stay warm. Also <strong>in</strong> San Diego, police<br />
cited Jeff Hayes for encroachment, even though he had nowhere to store his<br />
belong<strong>in</strong>gs. Hayes became homeless as a result <strong>of</strong> suffer<strong>in</strong>g from multiple sclerosis,<br />
which made it impossible for him to work.<br />
He had no crim<strong>in</strong>al record until receiv<strong>in</strong>g the encroachment charge. He then missed his<br />
court date because he was <strong>in</strong> the hospital for sepsis. Both Arundel and Hayes are<br />
pla<strong>in</strong>tiffs <strong>in</strong> a federal lawsuit challeng<strong>in</strong>g the law.<br />
Liv<strong>in</strong>g <strong>in</strong> Vehicles<br />
City laws <strong>of</strong>ten preclude people from sleep<strong>in</strong>g <strong>in</strong> their parked cars dur<strong>in</strong>g certa<strong>in</strong> hours<br />
<strong>of</strong> the night.<br />
Nearly 7,000 people live <strong>in</strong> their cars <strong>in</strong> Los Angeles, but the city recently enacted<br />
regulations bann<strong>in</strong>g park<strong>in</strong>g “for habitation purposes” on residential streets from 9 p.m.<br />
to 6 a.m. New ord<strong>in</strong>ances also make it illegal to live <strong>in</strong> a vehicle parked with<strong>in</strong> a block <strong>of</strong><br />
schools, daycare facilities, and parks. Santa Monica, Malibu, and Culver City have<br />
similar bans <strong>in</strong> place, as does San Diego.<br />
Page 169 <strong>of</strong> 289
Food Shar<strong>in</strong>g<br />
Controversial city ord<strong>in</strong>ances ban organizations from feed<strong>in</strong>g people <strong>in</strong> public, claim<strong>in</strong>g<br />
that do<strong>in</strong>g so constitutes a public health and safety risk.<br />
Police arrested seven people <strong>in</strong> Tampa, Florida, for distribut<strong>in</strong>g food to homeless people<br />
without a permit. Members <strong>of</strong> the Tampa-based organization Food Not Bombs stated<br />
that the arrests prove the city is crim<strong>in</strong>aliz<strong>in</strong>g compassion.<br />
In response to a hepatitis A outbreak <strong>in</strong> San Diego, the El Cajon City Council passed an<br />
emergency ord<strong>in</strong>ance prohibit<strong>in</strong>g food distribution on any city-owned property. In<br />
November, activists handed out 100 bagged lunches, call<strong>in</strong>g the ord<strong>in</strong>ance “a punitive<br />
measure to dehumanize and crim<strong>in</strong>alize the homeless.” <strong>The</strong> city f<strong>in</strong>ally lifted the ban <strong>in</strong><br />
late January.<br />
In Atlanta, on the Sunday before Thanksgiv<strong>in</strong>g 2017, two Food Not Bombs activists<br />
went to a local park to hand out food to the homeless, as they do every Sunday. But on<br />
that day, police ticketed them, cit<strong>in</strong>g a rarely enforced law requir<strong>in</strong>g organizations to<br />
obta<strong>in</strong> a permit before distribut<strong>in</strong>g food. Accord<strong>in</strong>g to a flier distributed by the Atlanta<br />
Department <strong>of</strong> Public Safety (that cites no actual evidence), enforcement is necessary<br />
because “many people become dependent on these activities, lead<strong>in</strong>g them to stay on<br />
the streets <strong>in</strong>stead <strong>of</strong> seek<strong>in</strong>g the help and support they truly need.”<br />
5. Laws crim<strong>in</strong>aliz<strong>in</strong>g homelessness make the problem worse.<br />
In addition to be<strong>in</strong>g unfair and <strong>of</strong>ten <strong>in</strong>humane, these laws exacerbate the problems<br />
they purport to address.<br />
Individuals who are saddled with crim<strong>in</strong>al records for engag<strong>in</strong>g <strong>in</strong> survival activities like<br />
sleep<strong>in</strong>g on the street face steeper challenges f<strong>in</strong>d<strong>in</strong>g jobs, hous<strong>in</strong>g, or other benefits<br />
like food stamps, thus perpetuat<strong>in</strong>g the cycle <strong>of</strong> homelessness. Under federal law,<br />
people who have spent more than 90 days <strong>in</strong>carcerated lose their “chronic<br />
homelessness” status and are no longer a priority for permanent hous<strong>in</strong>g.<br />
Stay-away orders—<strong>of</strong>ten issued alongside tickets for sleep<strong>in</strong>g <strong>in</strong> public—also keep<br />
people from access<strong>in</strong>g social services that they urgently need. In San Diego, for<br />
example, most social service providers are downtown. But police regularly issue stay<br />
away orders from these locations to those found sleep<strong>in</strong>g on the street. This means<br />
they can’t get food stamps or other assistance without risk<strong>in</strong>g arrest.<br />
Similarly, stay-away orders cause people to lose touch with service providers who are<br />
help<strong>in</strong>g them f<strong>in</strong>d hous<strong>in</strong>g. Accord<strong>in</strong>g to one such service provider <strong>in</strong> Baltimore, when<br />
homeless people seek<strong>in</strong>g hous<strong>in</strong>g “are forced out <strong>of</strong> their (outdoor) home bases and<br />
seek refuge <strong>in</strong> other parts <strong>of</strong> town, people <strong>of</strong>ten lose touch with the po<strong>in</strong>ts <strong>of</strong> contact we<br />
have for them. Thus, they lose their long-term hous<strong>in</strong>g opportunity.”<br />
Page 170 <strong>of</strong> 289
<strong>The</strong>se charges <strong>of</strong>ten carry f<strong>in</strong>es that people cannot pay—and unpaid f<strong>in</strong>es eventually<br />
lead to jail time. In Dallas, for example, citations for sleep<strong>in</strong>g <strong>in</strong> public <strong>of</strong>ten carry $150-<br />
$300 tickets. Most homeless <strong>in</strong>dividuals cannot afford these f<strong>in</strong>es, and may, as a result,<br />
skip court dates. Many also miss court because they have no address to receive court<br />
notices, or because they lack money for transportation. Miss<strong>in</strong>g court can lead to arrest<br />
warrants, more charges and jail, thus driv<strong>in</strong>g them deeper <strong>in</strong>to the crim<strong>in</strong>al justice<br />
system.<br />
6.Crim<strong>in</strong>aliz<strong>in</strong>g homelessness is expensive.<br />
Studies show that it costs more to jail those who are homeless than to provide them<br />
with shelter. On average, one day <strong>in</strong> jail costs $87, whereas a shelter bed costs $28.<br />
And that, <strong>in</strong> turn, diverts money from implement<strong>in</strong>g effective solutions. In San Diego,<br />
homelessness is a serious problem. But, while <strong>of</strong>ficials focus on ticket<strong>in</strong>g and jail<strong>in</strong>g<br />
people, they neglect to address the root causes <strong>of</strong> homelessness, such as an<br />
<strong>in</strong>adequate supply <strong>of</strong> affordable hous<strong>in</strong>g. This negligence was on full display dur<strong>in</strong>g the<br />
hepatitis A outbreak that killed at least 16 people and caused over 400 to get sick.<br />
7.Crim<strong>in</strong>aliz<strong>in</strong>g<br />
homelessness may be<br />
unconstitutional.<br />
Aside from be<strong>in</strong>g<br />
counterproductive, there’s<br />
ample evidence that<br />
crim<strong>in</strong>aliz<strong>in</strong>g homelessness<br />
violates the Constitution.<br />
<strong>The</strong> First Amendment<br />
Freedom <strong>of</strong> Expression: In<br />
2015, <strong>in</strong> Reed v. Gilbert, the<br />
Supreme Court struck down a<br />
ban on the public display <strong>of</strong><br />
signs for religious services,<br />
rul<strong>in</strong>g that laws regulat<strong>in</strong>g the<br />
content <strong>of</strong> signs are<br />
presumptively unconstitutional.<br />
Rely<strong>in</strong>g on that case, the<br />
Seventh Circuit and other federal district courts have struck down panhandl<strong>in</strong>g laws <strong>in</strong><br />
Colorado, Florida, Ill<strong>in</strong>ois, and Massachusetts, f<strong>in</strong>d<strong>in</strong>g that they impermissibly regulate<br />
expressive conduct.<br />
Fundamental Right To Travel: In Florida <strong>in</strong> 1992, a Federal District Court declared<br />
Miami’s sit-sleep-lie laws a violation <strong>of</strong> the right to travel, writ<strong>in</strong>g that, “Prevent<strong>in</strong>g<br />
Page 171 <strong>of</strong> 289
homeless <strong>in</strong>dividuals from perform<strong>in</strong>g activities that are ‘necessities <strong>of</strong> life,’ such as<br />
sleep<strong>in</strong>g, <strong>in</strong> any public place when they have nowhere else to go, effectively penalizes<br />
migration.”<br />
<strong>The</strong> Eighth Amendment<br />
Cruel and Unusual Punishment: In 2006, the N<strong>in</strong>th Circuit Court <strong>of</strong> Appeals struck<br />
down Los Angeles’s city ord<strong>in</strong>ance prohibit<strong>in</strong>g sleep<strong>in</strong>g, sitt<strong>in</strong>g, or ly<strong>in</strong>g on the street at<br />
any time <strong>of</strong> the day. <strong>The</strong> court ruled that the ord<strong>in</strong>ance unconstitutionally crim<strong>in</strong>alized<br />
unavoidable conduct. <strong>The</strong> city had a major hous<strong>in</strong>g shortage and an <strong>in</strong>adequate supply<br />
<strong>of</strong> shelter beds. <strong>Homelessness</strong>, the court held, is “a chronic state that may have been<br />
acquired ‘<strong>in</strong>nocently or <strong>in</strong>voluntarily.” Thus punish<strong>in</strong>g people for sleep<strong>in</strong>g on the<br />
streets—an <strong>in</strong>evitable consequence—violated the Eighth Amendment.<br />
<strong>The</strong> Fourteenth Amendment<br />
Vagueness: Courts have struck down anti-loiter<strong>in</strong>g laws as unconstitutionally vague. For<br />
example, <strong>in</strong> a 1972 Supreme Court decision, the court compla<strong>in</strong>ed that, because <strong>of</strong> its<br />
unspecific language, an ord<strong>in</strong>ance <strong>in</strong> Jacksonville, Florida, placed “almost unfettered<br />
discretion <strong>in</strong> the hands <strong>of</strong> the police.”<br />
Attorneys are challeng<strong>in</strong>g San Diego’s encroachment laws, orig<strong>in</strong>ally enacted to force<br />
people to remove trash b<strong>in</strong>s from sidewalks. However, police are us<strong>in</strong>g the law to force<br />
the homeless to leave public places. Attorneys are argu<strong>in</strong>g that the law is<br />
unconstitutionally vague because it provides almost no notice for what is crim<strong>in</strong>al —<br />
mak<strong>in</strong>g it potentially illegal to even place a bag on the sidewalk for just a moment.<br />
Equal Protection: In response to an “emergency” homeless street sweep <strong>of</strong><br />
encampments, the ACLU <strong>of</strong> Indiana recently filed a lawsuit aga<strong>in</strong>st the city <strong>of</strong><br />
Indianapolis. <strong>The</strong> lawsuit alleges that the city targets homeless people while exempt<strong>in</strong>g<br />
others, rais<strong>in</strong>g due process and equal protection concerns.<br />
8.Prosecutors and state legislators can choose to stop crim<strong>in</strong>aliz<strong>in</strong>g<br />
homelessness.<br />
Prosecutors can refuse to charge for violations <strong>of</strong> laws that specifically target the<br />
homeless population, like bans on camp<strong>in</strong>g and panhandl<strong>in</strong>g. In Spokane, Wash<strong>in</strong>gton,<br />
for example, the city and district attorneys have embraced <strong>in</strong>itiatives to dismiss citations<br />
for <strong>of</strong>fenses that homeless people <strong>in</strong>cur when engag<strong>in</strong>g <strong>in</strong> life-susta<strong>in</strong><strong>in</strong>g activities <strong>in</strong><br />
exchange for commitments to utilize hous<strong>in</strong>g and social services.<br />
Prosecutors can side with those challeng<strong>in</strong>g the constitutionality <strong>of</strong> laws crim<strong>in</strong>aliz<strong>in</strong>g<br />
homelessness. In 2015, the Department <strong>of</strong> Justice filed a “statement <strong>of</strong> <strong>in</strong>terest” argu<strong>in</strong>g<br />
that Idaho’s laws crim<strong>in</strong>aliz<strong>in</strong>g sleep<strong>in</strong>g <strong>in</strong> public were unconstitutional. “It should be<br />
uncontroversial that punish<strong>in</strong>g conduct that is a universal and unavoidable consequence<br />
<strong>of</strong> be<strong>in</strong>g human violates the Eighth Amendment. … If a person literally has nowhere<br />
Page 172 <strong>of</strong> 289
else to go, then enforcement <strong>of</strong> the anti-camp<strong>in</strong>g ord<strong>in</strong>ance aga<strong>in</strong>st that person<br />
crim<strong>in</strong>alizes her for be<strong>in</strong>g homeless.”<br />
Prosecutors can also champion homeless courts and diversion programs, which allow<br />
people to avoid crim<strong>in</strong>al charges after tak<strong>in</strong>g life-skills classes or sign<strong>in</strong>g up for social<br />
services. In Seattle and Santa Fe, <strong>of</strong>ficials have implemented a Law Enforcement<br />
Assisted Diversion (LEAD) program that places people <strong>in</strong> treatment programs prearrest.<br />
Prosecutors can agree to dismiss outstand<strong>in</strong>g warrants for unpaid f<strong>in</strong>es and quality-<strong>of</strong>life<br />
<strong>of</strong>fenses. In Los Angeles, <strong>in</strong> 2015, the city attorney agreed to do just that if people<br />
accepted social services, job tra<strong>in</strong><strong>in</strong>g, and drug and alcohol treatment. His <strong>of</strong>fice put<br />
together cl<strong>in</strong>ics to help the homeless population participate.<br />
Page 173 <strong>of</strong> 289
<strong>The</strong> most straightforward path to end<strong>in</strong>g the crim<strong>in</strong>alization <strong>of</strong> homelessness runs<br />
through state legislatures. State and local <strong>of</strong>ficials should refra<strong>in</strong> from pass<strong>in</strong>g new laws<br />
that target homeless <strong>in</strong>dividuals, and they should repeal exist<strong>in</strong>g laws that crim<strong>in</strong>alize<br />
life-susta<strong>in</strong><strong>in</strong>g and necessary behaviors.<br />
Page 174 <strong>of</strong> 289
IX. Traditional Solutions<br />
Hous<strong>in</strong>g Affordability and <strong>Homelessness</strong><br />
National Alliance to End <strong>Homelessness</strong><br />
<strong>The</strong> nation is currently fac<strong>in</strong>g one <strong>of</strong> the most severe affordable hous<strong>in</strong>g crises <strong>in</strong><br />
history. Not surpris<strong>in</strong>gly, those liv<strong>in</strong>g <strong>in</strong> poverty are the most significantly affected.<br />
In the 1970s,<br />
communities had<br />
plenty <strong>of</strong> affordable<br />
hous<strong>in</strong>g. That meant<br />
that when a family or<br />
<strong>in</strong>dividual experienced<br />
a crisis and lost<br />
hous<strong>in</strong>g, they could<br />
quickly f<strong>in</strong>d another<br />
place to live. But by the<br />
mid-1980s, a shr<strong>in</strong>k<strong>in</strong>g<br />
supply <strong>of</strong> low-cost<br />
hous<strong>in</strong>g resulted, and<br />
the comb<strong>in</strong>ation <strong>of</strong><br />
ris<strong>in</strong>g rents and slow,<br />
stagnant wage growth<br />
for lower-<strong>in</strong>come<br />
people has cont<strong>in</strong>ued<br />
and worsened.<br />
at risk <strong>of</strong> hous<strong>in</strong>g <strong>in</strong>stability and homelessness.<br />
Today, 11<br />
million extremely low<strong>in</strong>come<br />
households<br />
pay at least half <strong>of</strong> their<br />
<strong>in</strong>come toward<br />
hous<strong>in</strong>g, putt<strong>in</strong>g them<br />
<strong>The</strong> Solution to <strong>Homelessness</strong>: Hous<strong>in</strong>g<br />
<strong>The</strong> solution to homelessness is straightforward: hous<strong>in</strong>g. By connect<strong>in</strong>g people<br />
experienc<strong>in</strong>g homelessness to hous<strong>in</strong>g and services, they have a platform from which<br />
they can address other areas that may have contributed to their homelessness, such as<br />
employment, health, and substance abuse.<br />
Page 175 <strong>of</strong> 289
Homeless Assistance Programs<br />
<strong>The</strong>re are two homelessness-focused hous<strong>in</strong>g models that have been demonstrated to<br />
effectively end homelessness. <strong>The</strong>y are:<br />
<br />
<br />
Permanent Supportive Hous<strong>in</strong>g: Permanent supportive hous<strong>in</strong>g is long-term<br />
rental assistance and supportive services. It is targeted to <strong>in</strong>dividuals and<br />
families with chronic illnesses, disabilities, mental health issues, or substance<br />
use disorders who have experienced long-term or repeated homelessness.<br />
Rapid Re-Hous<strong>in</strong>g: Rapid re-hous<strong>in</strong>g provides short-term rental assistance and<br />
services. <strong>The</strong> goals are to help people obta<strong>in</strong> hous<strong>in</strong>g quickly, <strong>in</strong>crease selfsufficiency,<br />
and stay housed.<br />
Public Hous<strong>in</strong>g and Voucher Programs<br />
Adm<strong>in</strong>istered by HUD, public hous<strong>in</strong>g and voucher programs provide decent and safe<br />
affordable hous<strong>in</strong>g for low-<strong>in</strong>come people and play a critical role <strong>in</strong> reduc<strong>in</strong>g<br />
homelessness.<br />
<br />
<br />
Hous<strong>in</strong>g Choice Voucher Program (Commonly Known As “Section 8“) has<br />
become the dom<strong>in</strong>ant form <strong>of</strong> federal hous<strong>in</strong>g assistance. <strong>The</strong> program, which<br />
provides vouchers to low-<strong>in</strong>come households to help them pay for hous<strong>in</strong>g <strong>in</strong> the<br />
private market, has been found to sharply reduce homelessness.<br />
Public Hous<strong>in</strong>g is federally-funded hous<strong>in</strong>g that is rented at subsidized rates to<br />
eligible low-<strong>in</strong>come families, the elderly, and persons with disabilities.<br />
While both public hous<strong>in</strong>g and hous<strong>in</strong>g vouchers are proven to end homelessness, only<br />
one <strong>in</strong> four households that are eligible for such assistance receive it due to lack<br />
<strong>of</strong> fund<strong>in</strong>g.<br />
Tackl<strong>in</strong>g the Affordable Hous<strong>in</strong>g Crisis<br />
In many places across America, there is simply not enough available affordable<br />
hous<strong>in</strong>g. Without this hous<strong>in</strong>g stock, many homeless Americans are likely to cont<strong>in</strong>ue to<br />
cycle <strong>in</strong> and out <strong>of</strong> homelessness.<br />
<strong>The</strong> priority now must be to expand the supply <strong>of</strong> affordable hous<strong>in</strong>g. To do this, there is<br />
a need to <strong>in</strong>crease HUD’s ability to serve and house low-<strong>in</strong>come <strong>in</strong>dividuals.<br />
________<br />
Page 176 <strong>of</strong> 289
Hous<strong>in</strong>g First<br />
Hous<strong>in</strong>g First is a relatively recent <strong>in</strong>novation <strong>in</strong> human service programs<br />
and social policy regard<strong>in</strong>g treatment <strong>of</strong> the homeless and is an alternative to a system<br />
<strong>of</strong> emergency shelter/transitional hous<strong>in</strong>g progressions. Rather than mov<strong>in</strong>g homeless<br />
<strong>in</strong>dividuals through different "levels" <strong>of</strong> hous<strong>in</strong>g, whereby each level moves them closer<br />
to "<strong>in</strong>dependent hous<strong>in</strong>g" (for example: from the streets to a public shelter, and from a<br />
public shelter to a transitional hous<strong>in</strong>g program, and from there to their own apartment<br />
<strong>in</strong> the community), Hous<strong>in</strong>g First moves the homeless <strong>in</strong>dividual or household<br />
immediately from the streets or homeless shelters <strong>in</strong>to their own accommodation. "<br />
Hous<strong>in</strong>g First approaches are based on the concept that a homeless <strong>in</strong>dividual or<br />
household's first and primary need is to obta<strong>in</strong> stable hous<strong>in</strong>g, and that other issues that<br />
may affect the household can and should be addressed once hous<strong>in</strong>g is obta<strong>in</strong>ed. In<br />
contrast, many other programs operate from a model <strong>of</strong> "hous<strong>in</strong>g read<strong>in</strong>ess" — that is,<br />
that an <strong>in</strong>dividual or household must address other issues that may have led to the<br />
episode <strong>of</strong> homelessness prior to enter<strong>in</strong>g hous<strong>in</strong>g.<br />
Page 177 <strong>of</strong> 289
General Pr<strong>in</strong>ciples<br />
Hous<strong>in</strong>g First is an approach that <strong>of</strong>fers permanent, affordable hous<strong>in</strong>g as quickly as<br />
possible for <strong>in</strong>dividuals and families experienc<strong>in</strong>g homelessness, and then provides the<br />
supportive services and connections to the community-based supports people need to<br />
keep their hous<strong>in</strong>g and avoid return<strong>in</strong>g to homelessness. <strong>The</strong> pr<strong>in</strong>ciples beh<strong>in</strong>d this<br />
approach are:<br />
1. Move people <strong>in</strong>to hous<strong>in</strong>g directly from streets and shelters without preconditions<br />
<strong>of</strong> treatment acceptance or compliance;<br />
2. <strong>The</strong> provider is obligated to br<strong>in</strong>g robust support services to the hous<strong>in</strong>g. <strong>The</strong>se<br />
services are predicated on assertive engagement, not coercion;<br />
3. Cont<strong>in</strong>ued tenancy is not dependent on participation <strong>in</strong> services;<br />
4. Units targeted to most disabled and vulnerable homeless members <strong>of</strong> the<br />
community;<br />
5. Embraces harm-reduction approach to addictions rather than mandat<strong>in</strong>g<br />
abst<strong>in</strong>ence. At the same time, the provider must be prepared to support resident<br />
commitment to recovery;<br />
6. Residents must have leases and tenant protections under the law;<br />
7. Can be implemented as either a project-based or scattered site model.<br />
History and Evolution<br />
In Los Angeles, California <strong>in</strong> 1988, the "Hous<strong>in</strong>g First" Program for families was<br />
launched at Beyond Shelter by Tanya Tull <strong>in</strong> response to a sharp <strong>in</strong>crease <strong>in</strong> the<br />
number <strong>of</strong> homeless families with children. <strong>The</strong> "hous<strong>in</strong>g first" approach for families<br />
<strong>in</strong>cludes <strong>in</strong>-depth screen<strong>in</strong>g and assessment for child safety. Families should not be<br />
relocated to rental hous<strong>in</strong>g if there are <strong>in</strong>dicators that a child might be <strong>in</strong> danger. In<br />
"hous<strong>in</strong>g first" for families, services are available before, dur<strong>in</strong>g, and after relocation to<br />
rental hous<strong>in</strong>g - but engagement is not a requirement for participation. Unfortunately the<br />
"hous<strong>in</strong>g first" philosophy was <strong>of</strong>ten mis<strong>in</strong>terpreted <strong>in</strong> later years and, today, many<br />
government programs promote faulty application <strong>of</strong> "hous<strong>in</strong>g first." For households with<br />
children, appropriate services and monitor<strong>in</strong>g may be delivered through home visits,<br />
outpatient treatment, or l<strong>in</strong>k<strong>in</strong>g to appropriate services <strong>in</strong> the community at-large.<br />
In 1992 Dr. Sam Tsemberis, a faculty member <strong>of</strong> the Department <strong>of</strong> Psychiatry <strong>of</strong><br />
the New York University School <strong>of</strong> Medic<strong>in</strong>e, founded Pathways to Hous<strong>in</strong>g <strong>in</strong> New York<br />
City. Hous<strong>in</strong>g First for the chronically homeless is premised on the notion that hous<strong>in</strong>g<br />
is a basic human right, and so should not be denied to anyone, even if they are abus<strong>in</strong>g<br />
alcohol or other substances. <strong>The</strong> Hous<strong>in</strong>g First model, thus, is philosophically <strong>in</strong><br />
Page 178 <strong>of</strong> 289
contrast to models that require the homeless to abjure substance-abuse and seek<br />
treatment <strong>in</strong> exchange for hous<strong>in</strong>g.<br />
Hous<strong>in</strong>g First, when supported by the United States Department <strong>of</strong> Hous<strong>in</strong>g and Urban<br />
Development, does not only provide hous<strong>in</strong>g. <strong>The</strong> model, used by nonpr<strong>of</strong>it agencies<br />
throughout America, also provides wraparound case management services to the<br />
tenants. This case management provides stability for homeless <strong>in</strong>dividuals, which<br />
<strong>in</strong>creases their success. It allows for accountability and promotes self-sufficiency. <strong>The</strong><br />
hous<strong>in</strong>g provided through government supported Hous<strong>in</strong>g First programs is permanent<br />
and "affordable," mean<strong>in</strong>g that tenants pay 30% <strong>of</strong> their <strong>in</strong>come towards rent. Hous<strong>in</strong>g<br />
First, as pioneered by Pathways to Hous<strong>in</strong>g, targets <strong>in</strong>dividuals with disabilities. This<br />
hous<strong>in</strong>g is supported through two HUD programs. <strong>The</strong>y are the Supportive<br />
Hous<strong>in</strong>g Program and the Shelter Plus Care Program. Pathways' Hous<strong>in</strong>g First model<br />
has been recognized by the Substance Abuse and Mental Health Services<br />
Adm<strong>in</strong>istration as an Evidence-based practice.<br />
<strong>The</strong> Hous<strong>in</strong>g First Model is executed through either a scattered-site or project-based<br />
implementation. A scattered-site Hous<strong>in</strong>g First program is a model <strong>in</strong> which residents<br />
are <strong>of</strong>fered the opportunity <strong>of</strong> be<strong>in</strong>g housed <strong>in</strong> <strong>in</strong>dividual hous<strong>in</strong>g units throughout a<br />
community. This model <strong>in</strong>tegrates participants <strong>in</strong> a community as opposed to<br />
assembl<strong>in</strong>g multiple or all participants <strong>in</strong> one project or location. In a project-based<br />
Hous<strong>in</strong>g First implementation, residents are <strong>of</strong>fered units with<strong>in</strong> a s<strong>in</strong>gle hous<strong>in</strong>g project<br />
or site. This model congregates multiple or all participants <strong>in</strong> one locality. In both the<br />
scattered-site and project-based Hous<strong>in</strong>g First programs, residents are given access to<br />
a wide variety <strong>of</strong> supportive health and rehabilitation services which they have the<br />
option, although not mandatory, to participate <strong>in</strong> and receive treatment.<br />
Page 179 <strong>of</strong> 289
Hous<strong>in</strong>g First is currently endorsed by the United States Interagency Council on<br />
<strong>Homelessness</strong> (<strong>US</strong>ICH) as a "best practice" for governments and service-agencies to<br />
use <strong>in</strong> their fight to end chronic homelessness <strong>in</strong> America.<br />
Hous<strong>in</strong>g First programs currently operate throughout the United States <strong>in</strong> cities such<br />
as New Orleans, Louisiana; Plattsburgh, New York; Anchorage, Alaska; M<strong>in</strong>neapolis,<br />
M<strong>in</strong>nesota; New York City; District <strong>of</strong> Columbia; Denver, Colorado; San Francisco,<br />
California; Atlanta, Georgia; Chicago, Ill<strong>in</strong>ois; Qu<strong>in</strong>cy, Massachusetts; Philadelphia,<br />
Pennsylvania; Salt Lake City, Utah; Seattle, Wash<strong>in</strong>gton;Los Angeles; Aust<strong>in</strong>,<br />
Texas; and Cleveland, Ohio, among many others, and are <strong>in</strong>tended to be crucial<br />
aspects <strong>of</strong> communities' so-called "10-Year Plans To End Chronic <strong>Homelessness</strong>" also<br />
advocated by <strong>US</strong>ICH. Rapid Re-Hous<strong>in</strong>g is based on Hous<strong>in</strong>g First pr<strong>in</strong>ciples and is<br />
considered a subset <strong>of</strong> the Hous<strong>in</strong>g First approach. Rapid Re-Hous<strong>in</strong>g differs primarily<br />
<strong>in</strong> the provision <strong>of</strong> short-term rent subsidies (generally 3–6 months), after which the<br />
tenant either pays rent without a subsidy or has access to a Section 8 Hous<strong>in</strong>g Choice<br />
voucher or the equivalent.<br />
Evidence and Outcomes<br />
In Massachusetts, the Home & Healthy for Good program reported some significant<br />
outcomes that were favorable especially <strong>in</strong> the area <strong>of</strong> cost sav<strong>in</strong>gs.<br />
<strong>The</strong> Denver Hous<strong>in</strong>g First Collaborative, operated by the Colorado Coalition for the<br />
Homeless, provides hous<strong>in</strong>g through a Hous<strong>in</strong>g First approach to more than 200<br />
chronically homeless <strong>in</strong>dividuals. A 2006 cost study documented a significant reduction<br />
<strong>in</strong> the use and cost <strong>of</strong> emergency services by program participants as well as <strong>in</strong>creased<br />
health status. Emergency room visits and costs were reduced by an average <strong>of</strong> 34.3<br />
percent. Hospital <strong>in</strong>patient costs were reduced by 66 percent. Detox visits were reduced<br />
by 82 percent. Incarceration days and costs were reduced by 76 percent. 77 percent <strong>of</strong><br />
those enter<strong>in</strong>g the program cont<strong>in</strong>ued to be housed <strong>in</strong> the program after two years.<br />
Researchers <strong>in</strong> Seattle, Wash<strong>in</strong>gton, partner<strong>in</strong>g with the Downtown Emergency Service<br />
Center, found that provid<strong>in</strong>g hous<strong>in</strong>g and support services for homeless alcoholics costs<br />
taxpayers less than leav<strong>in</strong>g them on the street, where taxpayer money goes towards<br />
police and emergency health care. Results <strong>of</strong> the study funded by the Substance Abuse<br />
Policy Research Program (SAPRP) <strong>of</strong> the Robert Wood Johnson Foundation appeared<br />
<strong>in</strong> the Journal <strong>of</strong> the American Medical Association April, 2009. This first <strong>US</strong> controlled<br />
assessment <strong>of</strong> the effectiveness <strong>of</strong> Hous<strong>in</strong>g First specifically target<strong>in</strong>g chronically<br />
homeless alcoholics showed that the program saved taxpayers more than $4 million<br />
over the first year <strong>of</strong> operation. Dur<strong>in</strong>g the first six months, even after consider<strong>in</strong>g the<br />
cost <strong>of</strong> adm<strong>in</strong>ister<strong>in</strong>g the hous<strong>in</strong>g, 95 residents <strong>in</strong> a Hous<strong>in</strong>g First program <strong>in</strong> downtown<br />
Seattle, the study reported an average cost-sav<strong>in</strong>gs <strong>of</strong> 53 percent—nearly <strong>US</strong> $2,500<br />
per month per person <strong>in</strong> health and social services, compared to the per month costs <strong>of</strong><br />
a wait-list control group <strong>of</strong> 39 homeless people. Further, stable hous<strong>in</strong>g also results <strong>in</strong><br />
reduced dr<strong>in</strong>k<strong>in</strong>g among homeless alcoholics.<br />
Page 180 <strong>of</strong> 289
In Utah, there has been "a 72 percent decrease overall s<strong>in</strong>ce enact<strong>in</strong>g the plan <strong>in</strong> 2005"<br />
accord<strong>in</strong>g to the Utah Division <strong>of</strong> Hous<strong>in</strong>g and Community Development.<br />
In August 2007, the <strong>US</strong> Department <strong>of</strong> Hous<strong>in</strong>g and Urban Development reported that<br />
the number <strong>of</strong> chronically homeless <strong>in</strong>dividuals liv<strong>in</strong>g on the streets or <strong>in</strong> shelters<br />
dropped by an unprecedented 30 percent, from 175,914 people <strong>in</strong> 2005 to 123,833 <strong>in</strong><br />
2007. This was credited <strong>in</strong> part to the "hous<strong>in</strong>g first" approach; Congress <strong>in</strong> 1999<br />
directed that HUD spend 30% <strong>of</strong> its fund<strong>in</strong>g on the method.<br />
In September 2010, it was reported that the Hous<strong>in</strong>g First Initiative had significantly<br />
reduced the chronic homeless s<strong>in</strong>gle person population <strong>in</strong> Boston, Massachusetts,<br />
although homeless families were still <strong>in</strong>creas<strong>in</strong>g <strong>in</strong> number. Some shelters were<br />
reduc<strong>in</strong>g the number <strong>of</strong> beds due to lowered numbers <strong>of</strong> homeless, and some<br />
emergency shelter facilities were clos<strong>in</strong>g, especially the emergency Boston Night<br />
Center. By 2015, Boston Mayor Marty Walsh had announced a 3-year plan to end<br />
chronic homelessness, focus<strong>in</strong>g on coord<strong>in</strong>at<strong>in</strong>g efforts among public agencies and<br />
nonpr<strong>of</strong>it organizations provid<strong>in</strong>g services to homeless men and women.<br />
Page 181 <strong>of</strong> 289
In 2013, the estimated national public cost <strong>of</strong> chronic homelessness was between $3.7<br />
and $4.7 billion accord<strong>in</strong>g to the United States Interagency Council on<br />
<strong>Homelessness</strong> (<strong>US</strong>ICH). Through Hous<strong>in</strong>g First programs, chronically homeless<br />
<strong>in</strong>dividuals are us<strong>in</strong>g fewer hospital resources, spend<strong>in</strong>g less time <strong>in</strong> costly <strong>in</strong>carceration<br />
and requir<strong>in</strong>g fewer emergency room visits. For example, a review <strong>of</strong> the impact <strong>of</strong><br />
permanent supportive hous<strong>in</strong>g and case management on the health <strong>of</strong> the chronically<br />
homeless found evidence that these services have a positive impact on health<br />
outcomes such as self-reported mental health status and substance use, a large impact<br />
on health care utilization, and a reduction <strong>in</strong> Medicaid health care costs. Studies <strong>in</strong> New<br />
York City and <strong>in</strong> Utah have shown that every homeless person housed <strong>in</strong> programs<br />
such as Hous<strong>in</strong>g First saves taxpayers $10,000 and $8,000 a year, respectively. A<br />
research study at University <strong>of</strong> Northern Carol<strong>in</strong>a also reported that a hous<strong>in</strong>g project<br />
for the chronically homeless called Moore Place had saved the county $2.4 million.<br />
Post–2007 <strong>US</strong> Policy and Legislation<br />
<strong>The</strong> United States Congress appropriated $25 million <strong>in</strong> the McK<strong>in</strong>ney-Vento Homeless<br />
Assistance Grants for 2008 to show the effectiveness <strong>of</strong> Rapid Re-hous<strong>in</strong>g programs <strong>in</strong><br />
reduc<strong>in</strong>g family homelessness.<br />
In February 2009, President Obama signed the American Recovery and Re<strong>in</strong>vestment<br />
Act <strong>of</strong> 2009 part <strong>of</strong> which addressed homelessness prevention, allocat<strong>in</strong>g $1.5 billion for<br />
a Homeless Prevention Fund. <strong>The</strong> fund<strong>in</strong>g for it was called the "<strong>Homelessness</strong><br />
Prevention and Rapid Re-Hous<strong>in</strong>g Program" (HPRP), and was distributed us<strong>in</strong>g the<br />
formula for the Emergency Shelter Grants (ESG) program.<br />
On May 20, 2009, President Obama signed the Homeless Emergency Assistance and<br />
Rapid Transition to Hous<strong>in</strong>g (HEARTH) Act <strong>in</strong>to Public Law (Public Law 111-22 or "PL<br />
111-22"), reauthoriz<strong>in</strong>g HUD's Homeless Assistance programs. It was part <strong>of</strong><br />
the Help<strong>in</strong>g Families Save <strong>The</strong>ir Homes Act <strong>of</strong> 2009. <strong>The</strong> HEARTH act allows for the<br />
prevention <strong>of</strong> homelessness, rapid re-hous<strong>in</strong>g, consolidation <strong>of</strong> hous<strong>in</strong>g programs, and<br />
new homeless categories. In the eighteen months after the bill's sign<strong>in</strong>g, HUD must<br />
make regulations implement<strong>in</strong>g this new McK<strong>in</strong>ney program.<br />
In late 2009, some homeless advocacy organizations, such as the National Coalition for<br />
the Homeless, reported and published perceived problems with the HEARTH Act <strong>of</strong><br />
2009 as a HUD McK<strong>in</strong>ney-Vento Reauthorization bill, especially with regard to privacy,<br />
def<strong>in</strong>itional <strong>in</strong>eligibility, community roles, and restrictions on eligibile activities.<br />
On June 22, 2010, the United States Interagency Council on<br />
<strong>Homelessness</strong> presented Open<strong>in</strong>g Doors: Federal Strategic Plan to Prevent and End<br />
<strong>Homelessness</strong> to the Obama Adm<strong>in</strong>istration and Congress. This is the nation's first<br />
comprehensive strategy as mandated by the HEARTH Act and <strong>in</strong>cludes Hous<strong>in</strong>g First<br />
as a best practice for reach<strong>in</strong>g the goal <strong>of</strong> end<strong>in</strong>g chronic homelessness by 2015.<br />
Page 182 <strong>of</strong> 289
On June 11, 2014 the 100,000 Homes Campaign <strong>in</strong> the United States, launched <strong>in</strong> 2010<br />
to "help communities around the country place 100,000 chronically homeless people<br />
<strong>in</strong>to permanent supportive hous<strong>in</strong>g" announced that it reached its four-year goal <strong>of</strong><br />
hous<strong>in</strong>g 100,000 chronically homeless<br />
people nearly two months before its<br />
July 29 deadl<strong>in</strong>e.<br />
New York Times journalist David<br />
Bornste<strong>in</strong> summarized key elements <strong>of</strong><br />
the 100,000 Homes Campaign that<br />
campaign leaders attribute to its<br />
success. This <strong>in</strong>cluded learn<strong>in</strong>g<br />
<strong>in</strong>dividual homeless people's "name<br />
and need" by mobiliz<strong>in</strong>g volunteers to<br />
go very early <strong>in</strong> the morn<strong>in</strong>g to check on<br />
them, establish<strong>in</strong>g a "vulnerability<br />
<strong>in</strong>dex" so they could prioritize certa<strong>in</strong><br />
homeless people and "br<strong>in</strong>g hous<strong>in</strong>g<br />
advocates and agency representatives<br />
together to streaml<strong>in</strong>e the placement<br />
processes, and share ideas about how<br />
to cut through red tape."<br />
Application to Family <strong>Homelessness</strong><br />
<strong>The</strong> Hous<strong>in</strong>g First methodology was<br />
<strong>in</strong>itially developed <strong>in</strong> 1988 <strong>in</strong> Los<br />
Angeles, California, to address an<br />
<strong>in</strong>crease <strong>in</strong> family homelessness. <strong>The</strong><br />
basic methodology helps homeless<br />
families to relocate from shelters and<br />
transitional hous<strong>in</strong>g directly <strong>in</strong>to<br />
permanent rental hous<strong>in</strong>g <strong>in</strong> the<br />
community at-large as quickly as<br />
possible, with home-based case<br />
management support for a traditional<br />
period <strong>of</strong> time. In other words, the<br />
services traditionally be<strong>in</strong>g provided <strong>in</strong><br />
transitional hous<strong>in</strong>g were <strong>in</strong>stead<br />
provided to families after they had been assisted <strong>in</strong> relocat<strong>in</strong>g to permanent hous<strong>in</strong>g at<br />
rents they could afford. This was a major <strong>in</strong>novation <strong>in</strong> the field at the time. <strong>The</strong> basic<br />
premise was that families were more responsive to <strong>in</strong>terventions and support from a<br />
stable permanent hous<strong>in</strong>g base than while still homeless. In the 2009 HEARTH Act, the<br />
Hous<strong>in</strong>g First approach to end<strong>in</strong>g homelessness was codified <strong>in</strong>to law. Hous<strong>in</strong>g First<br />
programs for families differ dramatically from Hous<strong>in</strong>g First for the chronically homeless,<br />
as children are <strong>in</strong>volved. Beyond Shelter's leadership promoted this new approach<br />
Page 183 <strong>of</strong> 289
across the country for the next 20 years, work<strong>in</strong>g collaboratively with the National<br />
Alliance to End <strong>Homelessness</strong>.<br />
Australia<br />
Outside the United States<br />
In South Australia, the State Government <strong>of</strong> Premier Mike Rann (2002 to 2011)<br />
committed substantial fund<strong>in</strong>g to a series <strong>of</strong> <strong>in</strong>itiatives designed to combat<br />
homelessness. Advised by Social Inclusion Commissioner David Cappo and the<br />
founder <strong>of</strong> New York's Common Ground program, Rosanne Haggerty, the Rann<br />
Government established Common Ground Adelaide, build<strong>in</strong>g high quality <strong>in</strong>ner city<br />
apartments (comb<strong>in</strong>ed with <strong>in</strong>tensive support) for "rough sleep<strong>in</strong>g" homeless people.<br />
<strong>The</strong> government also funded the Street to Home program and a hospital liaison service<br />
designed to assist homeless people who are admitted to the emergency departments <strong>of</strong><br />
Adelaide's major public hospitals. Rather than be<strong>in</strong>g released back <strong>in</strong>to homelessness,<br />
patients identified as rough sleepers are found accommodation backed by pr<strong>of</strong>essional<br />
support. Common Ground and Street to Home now operate across Australia <strong>in</strong> other<br />
states.<br />
Canada<br />
In its <strong>Economic</strong> Action Plan 2013, the Federal Government <strong>of</strong> Canada proposed $119<br />
million annually from March 2014 until March 2019—with $600 million <strong>in</strong> new fund<strong>in</strong>g—<br />
to renew its <strong>Homelessness</strong> Partner<strong>in</strong>g Strategy (HPS). In deal<strong>in</strong>g with homelessness <strong>in</strong><br />
Canada, the focus is on the Hous<strong>in</strong>g First model. Thus, private or public organizations<br />
across Canada are eligible to receive HPS subsidies to implement Hous<strong>in</strong>g First<br />
programs. In 2008, the Federal Government <strong>of</strong> Canada funded a five-year<br />
demonstration program, the At Home/Chez Soi project, aimed at provid<strong>in</strong>g evidence<br />
about what services and systems best help people experienc<strong>in</strong>g serious mental illness<br />
and homelessness. Launched <strong>in</strong> November 2009 and end<strong>in</strong>g <strong>in</strong> March 2013, the At<br />
Home/Chez Soi project was actively address<strong>in</strong>g the hous<strong>in</strong>g need by <strong>of</strong>fer<strong>in</strong>g Hous<strong>in</strong>g<br />
First programs to people with mental illness who were experienc<strong>in</strong>g homelessness <strong>in</strong><br />
five cities: Vancouver, W<strong>in</strong>nipeg, Toronto, Montréal and Moncton. In total, At<br />
Home/Chez Soi has provided more than 1,000 Canadians with hous<strong>in</strong>g.<br />
Hous<strong>in</strong>g First has grown <strong>in</strong> popularity <strong>in</strong> Canada and used <strong>in</strong> many Canadian ten-year<br />
plans to end homelessness, such as those <strong>in</strong> Edmonton and Calgary, Alberta. Hous<strong>in</strong>g<br />
First: A Canadian Perspective (TM) is spearheaded by Pathways to Hous<strong>in</strong>g Calgary<br />
and director Sue Fortune. Canadian adaptations to Hous<strong>in</strong>g First have demonstrated<br />
positive outcomes as documented on the website: www.thealex.ca (Hous<strong>in</strong>g Programs;<br />
Pathways to Hous<strong>in</strong>g). Canadian implementations <strong>of</strong> Hous<strong>in</strong>g First must be tailored to<br />
Canadian homelessness, resources, politics and philosophy.<br />
In Calgary, Alberta, the Alex Pathways to Hous<strong>in</strong>g Calgary which opened <strong>in</strong> 2007, has<br />
150 <strong>in</strong>dividuals <strong>in</strong> scatter site homes <strong>in</strong> 2013. Clients pay 30 percent <strong>of</strong> their <strong>in</strong>come<br />
Page 184 <strong>of</strong> 289
towards their rent: 85 percent <strong>of</strong> Pathways to Hous<strong>in</strong>g clients receive Assured Income<br />
for the Severely Handicapped (AISH) benefits and 15 percent receive Alberta Works.<br />
<strong>The</strong> Alex Pathways to Hous<strong>in</strong>g uses a Hous<strong>in</strong>g First model, but it also uses Assertive<br />
Community Treatment (ACT), an <strong>in</strong>tegrated approach to healthcare where clients<br />
access a team <strong>of</strong> "nurses, mental health specialists, justice specialists and substance<br />
abuse specialists." Director<br />
Sue Fortune is committed<br />
to the 10 Year Plan To End<br />
Homelessless <strong>in</strong> the<br />
Calgary Region. Fortune<br />
reported that the Hous<strong>in</strong>g<br />
First approach resulted <strong>in</strong> a<br />
66 percent decl<strong>in</strong>e <strong>in</strong> days<br />
hospitalized (from one year<br />
prior to <strong>in</strong>take compared to<br />
one year <strong>in</strong> the program), a<br />
38 percent decl<strong>in</strong>e <strong>in</strong> times<br />
<strong>in</strong> emergency room, a 41<br />
percent decl<strong>in</strong>e <strong>in</strong> EMS<br />
events, a 79 percent<br />
decl<strong>in</strong>e <strong>in</strong> days <strong>in</strong> jail and a<br />
30 percent decl<strong>in</strong>e <strong>in</strong> police<br />
<strong>in</strong>teractions. Sue Fortune,<br />
Director <strong>of</strong> Alex Pathways<br />
to Hous<strong>in</strong>g <strong>in</strong> Calgary <strong>in</strong> her<br />
2013 presentation entitled<br />
"Canadian Adaptations<br />
us<strong>in</strong>g Hous<strong>in</strong>g First: A Canadian Perspective" argued that less than 1% <strong>of</strong> exist<strong>in</strong>g<br />
clients return to shelters or rough sleep<strong>in</strong>g; clients spend 76% fewer days <strong>in</strong> jail; clients<br />
have 35% decl<strong>in</strong>e <strong>in</strong> police <strong>in</strong>teractions.<br />
Pathways to Hous<strong>in</strong>g Canada describes the Hous<strong>in</strong>g First as a "client-driven strategy<br />
that provides immediate access to an apartment without requir<strong>in</strong>g <strong>in</strong>itial participation <strong>in</strong><br />
psychiatric treatment or treatment for sobriety."<br />
F<strong>in</strong>land<br />
In 2007 the centre-right government <strong>of</strong> Matti Vanhanen began a special program <strong>of</strong> four<br />
wise men to elim<strong>in</strong>ate homelessness <strong>in</strong> F<strong>in</strong>land by 2015.<br />
<strong>The</strong> programme to reduce long-term homelessness targets just some homeless people.<br />
Assessed on the basis <strong>of</strong> social, health and f<strong>in</strong>ancial circumstances, this is the hard<br />
core <strong>of</strong> homelessness. <strong>The</strong> programme to reduce long-term homelessness focuses on<br />
the 10 biggest urban growth centres, where most <strong>of</strong> the homeless are to be found. <strong>The</strong><br />
ma<strong>in</strong> priority, however, is the Hels<strong>in</strong>ki Metropolitan Area, and especially Hels<strong>in</strong>ki itself,<br />
where long-term homelessness is concentrated.<br />
Page 185 <strong>of</strong> 289
<strong>The</strong> programme is structured around the hous<strong>in</strong>g first pr<strong>in</strong>ciple. Solutions to social and<br />
health problems cannot be a condition for organis<strong>in</strong>g accommodation: on the contrary,<br />
accommodation is a requirement which also allows other problems <strong>of</strong> people who have<br />
been homeless to be solved. Hav<strong>in</strong>g somewhere to live makes it possible to strengthen<br />
life management skills and is conducive to purposeful activity.<br />
Because <strong>of</strong> all the reasons there are for long-term homelessness, if it is to be cut there<br />
need to be simultaneous measures at different levels, i.e. universal hous<strong>in</strong>g and social<br />
policy measures, the prevention <strong>of</strong> homelessness and targeted action to reduce longterm<br />
homelessness.<br />
<strong>The</strong> programme’s objectives are:<br />
To halve long-term homelessness by 2011<br />
To elim<strong>in</strong>ate homelessness entirely by 2015<br />
More effective measures to prevent homelessness<br />
France<br />
<strong>The</strong> French government launched a Hous<strong>in</strong>g First-like program <strong>in</strong> France <strong>in</strong> 2010 <strong>in</strong> 4<br />
major cities - Toulouse, Marseille, Lille and Paris - called "Un chez-Soi d'abord". It<br />
follows the same pr<strong>in</strong>ciples as the Canadian and <strong>US</strong> programs: it is focused on<br />
homeless people with mental illness or addicted to drugs or alcohol. <strong>The</strong> plan is on a<br />
three-year basis for each <strong>in</strong>dividual, liv<strong>in</strong>g <strong>in</strong> accommodation provided by an NGO.<br />
Clients are given any needed help with social issues and medical care. <strong>The</strong> first houses<br />
have been work<strong>in</strong>g <strong>in</strong> three cities s<strong>in</strong>ce 2011 and a hundred apartments have been<br />
planned <strong>in</strong> Paris start<strong>in</strong>g <strong>in</strong> May 2012.<br />
Several NGOs are <strong>in</strong>volved <strong>in</strong> this trial. <strong>The</strong>y provide rental management and social<br />
support for tenants.<br />
Those NGOs are l<strong>in</strong>ked with scientists <strong>in</strong>vestigat<strong>in</strong>g the results <strong>of</strong> the experiment and<br />
serve as a relay for <strong>in</strong>formation and status reports on the targeted public. <strong>The</strong> lead team<br />
<strong>of</strong> "Un chez-soi d'abord" is expect<strong>in</strong>g results to be published around 2017.<br />
Japan<br />
Though homeless support groups like non-pr<strong>of</strong>it<br />
organization Moyai, Bigissue, Médec<strong>in</strong>s du Monde Japan have requested Hous<strong>in</strong>g First,<br />
Japanese government does not have a Hous<strong>in</strong>g First program yet. Traditionally, the<br />
government <strong>of</strong>fers public hous<strong>in</strong>g so-called Koei-jutaku for low-<strong>in</strong>come people by public<br />
hous<strong>in</strong>g law and it is run by local government. Rent fees are subject to change<br />
accord<strong>in</strong>g to household <strong>in</strong>come. Because applicants must be selected by lottery, low<strong>in</strong>come<br />
people cannot live <strong>in</strong> the hous<strong>in</strong>g soon though they have an advantage. <strong>The</strong>re<br />
Page 186 <strong>of</strong> 289
are a couple <strong>of</strong> Hous<strong>in</strong>g First-like programs. Non-pr<strong>of</strong>it organization<br />
Littleones renovates discarded or empty homes and they rent the rooms to s<strong>in</strong>gle<br />
mothers with f<strong>in</strong>ancial and occupational support. Tsukuroi Tokyo fund advocates a<br />
hous<strong>in</strong>g first and they built a shelter specially for homeless people.<br />
United K<strong>in</strong>gdom<br />
<strong>The</strong> UK government announced plans for a Hous<strong>in</strong>g First pilot programme <strong>in</strong> the West<br />
Midlands, Liverpool, and Manchester, along with fund<strong>in</strong>g <strong>of</strong> £28m. This followed<br />
publication <strong>of</strong> a report entitled Hous<strong>in</strong>g First by the Centre for Social Justice which cited<br />
the results from the F<strong>in</strong>nish application <strong>of</strong> Hous<strong>in</strong>g First.<br />
Criticism <strong>of</strong><br />
Hous<strong>in</strong>g First<br />
One-Size-Fits-<br />
All<br />
Ralph DaCosta<br />
Nunez, the<br />
President and<br />
CEO <strong>of</strong> the<br />
Institute for<br />
Children, Poverty<br />
and<br />
<strong>Homelessness</strong><br />
(ICPH), who is<br />
also a Pr<strong>of</strong>essor<br />
at Columbia<br />
University, predicted this one-size-fits-all is dest<strong>in</strong>ed to fail as statistics <strong>in</strong> New York City<br />
prove. Dr. Nunez described the approach as "'public stupidity'" rather than "'public<br />
policy'". He also compla<strong>in</strong>ed that Hous<strong>in</strong>g First "is all that’s left after the other poverty<br />
fight<strong>in</strong>g programs have been underfunded or elim<strong>in</strong>ated." Nunez advocates for a three<br />
tiered approach to address<strong>in</strong>g homelessness with Hous<strong>in</strong>g First as only the first<br />
component <strong>of</strong> that approach.<br />
Follow<strong>in</strong>g Panelák: A Failed Communist Model<br />
Sharam Kohan, a social policy expert and economist, compared the Hous<strong>in</strong>g First<br />
model to Panelák <strong>of</strong> the former communist countries that tried to end homelessness by<br />
provid<strong>in</strong>g permanent and unconditional public hous<strong>in</strong>g. Dr. Kohan criticized Hous<strong>in</strong>g<br />
First model for follow<strong>in</strong>g Panelák's failed philosophy and approaches. Dr. Kohan po<strong>in</strong>ts<br />
to a grow<strong>in</strong>g number <strong>of</strong> reports from communities that have implemented Hous<strong>in</strong>g First<br />
programs which are "credited with creat<strong>in</strong>g slums and slumlord."<br />
Page 187 <strong>of</strong> 289
Limits <strong>of</strong> Evidence Based Policy<br />
On July 31, 2011, Pr<strong>of</strong>. Victoria Stanhope, Ph.D., <strong>of</strong> New York University School <strong>of</strong><br />
Social Work and Pr<strong>of</strong>. Kerry Dunn, J.D., Ph.D., <strong>of</strong> University <strong>of</strong> New England School <strong>of</strong><br />
Social Work, published “<strong>The</strong> curious case <strong>of</strong> Hous<strong>in</strong>g First; <strong>The</strong> limits <strong>of</strong> evidence-based<br />
policy” <strong>in</strong> the International Journal <strong>of</strong> Law and Psychiatry. Drs. Stanhope and Dunn<br />
gave an overview <strong>of</strong> evidence-based policy and presented “critiques based on its<br />
reliance on positivist methods and technical approach to policy mak<strong>in</strong>g. Us<strong>in</strong>g these<br />
critiques as a framework, the paper discusse[d] the case <strong>of</strong> Hous<strong>in</strong>g First, a policy<br />
adopted by the Bush Adm<strong>in</strong>istration <strong>in</strong> order to address the problem <strong>of</strong> chronic<br />
homelessness.” Accord<strong>in</strong>g to Drs. Stanhope and Dunn, the Hous<strong>in</strong>g First “is an<br />
example <strong>of</strong> research-driven policy mak<strong>in</strong>g but also resulted <strong>in</strong> a progressive policy be<strong>in</strong>g<br />
promoted by a conservative adm<strong>in</strong>istration. In discuss<strong>in</strong>g the case, the paper elaborates<br />
on the relationship between evidence and policy, argu<strong>in</strong>g that evidence-based policy<br />
fails to <strong>in</strong>tegrate evidence and values <strong>in</strong>to policy deliberations. <strong>The</strong> paper concludes<br />
with alternative models <strong>of</strong> policy decision-mak<strong>in</strong>g and their implications for research.”<br />
Hous<strong>in</strong>g First has been criticized on its failure to address broader service outcomes,<br />
namely substance abuse (<strong>in</strong> one case, it was argued that the only reason substance<br />
abuse outcomes were no worse was that the residents were not severely<br />
addicted). <strong>The</strong>se criticisms have been rebutted on the grounds that Hous<strong>in</strong>g First is a<br />
program to end homelessness not to reduce substance abuse, though more recent<br />
research <strong>in</strong>dicates it is more effective than traditional approaches <strong>in</strong> this regard as<br />
well. This exchange highlights the way <strong>in</strong> which the selection <strong>of</strong> outcomes sets both the<br />
terms <strong>of</strong> the debate and the parameters <strong>of</strong> “what works.” Embedded <strong>in</strong> that mantra are a<br />
priori decisions about what constitutes work<strong>in</strong>g and for whom; <strong>in</strong> this case it was stable<br />
hous<strong>in</strong>g for the chronic homeless.<br />
Accord<strong>in</strong>g to Stanhope, Hous<strong>in</strong>g First “asserts a right to hous<strong>in</strong>g. Such a material right<br />
is an anathema to neoliberal ideology and challenges deeply held beliefs that have<br />
shaped <strong>US</strong> welfare from its <strong>in</strong>ception: That no one has a right to a government benefit<br />
unless they have proved themselves to be deserv<strong>in</strong>g or worthy (e.g., "TANF"), or have<br />
earned it (e.g., social <strong>in</strong>surance).”<br />
________<br />
Page 188 <strong>of</strong> 289
X. <strong>The</strong> Advocacy Foundation<br />
Balanced Home-Mortgage Initiative<br />
<strong>The</strong> Flexible, Income-Based, Unlimited-Term, Strategic Mortgage.<br />
by John C Johnson III<br />
We have a better idea! We call it <strong>The</strong> Flexible, Income-Based, Unlimited-Term,<br />
Strategic Mortgage.<br />
Here’s how our formula works:<br />
1. First We Determ<strong>in</strong>e <strong>The</strong> Value <strong>of</strong> the Home, and That’s<br />
What Sets the Foundation for Payment<br />
Real Estate Appraisal, Property Valuation or Land Valuation is<br />
the process <strong>of</strong> develop<strong>in</strong>g an op<strong>in</strong>ion <strong>of</strong> value for real property (usually market value).<br />
Real estate transactions <strong>of</strong>ten require appraisals because they occur <strong>in</strong>frequently and<br />
every property is unique (especially their location, a key factor <strong>in</strong> valuation), unlike<br />
corporate stocks, which are traded daily and are identical (thus a centralized Walrasian<br />
auction like a stock exchange is unrealistic). Appraisal reports form the basis for<br />
mortgage loans, settl<strong>in</strong>g estates and divorces, taxation, and so on. Sometimes an<br />
appraisal report is used to set the sale price <strong>of</strong> a property.<br />
Most, but not all, countries require<br />
appraisers to be licensed or certified.<br />
Appraisers are <strong>of</strong>ten known as "property<br />
valuers" or "land valuers"; <strong>in</strong> British English<br />
they are "valuation surveyors". If the<br />
appraiser's op<strong>in</strong>ion is based on market<br />
value, then it must also be based on the<br />
highest and best use <strong>of</strong> the real property. In<br />
the United States, mortgage valuations <strong>of</strong><br />
improved residential properties are generally<br />
reported on a standardized form like the<br />
Uniform Residential Appraisal Report. Appraisals <strong>of</strong> more complex properties (e.g.,<br />
<strong>in</strong>come-produc<strong>in</strong>g, raw land) are <strong>of</strong>ten reported <strong>in</strong> narrative format.<br />
Types <strong>of</strong> Value<br />
<strong>The</strong>re are several types and def<strong>in</strong>itions <strong>of</strong> value sought by a real estate appraisal. Some<br />
<strong>of</strong> the most common are:<br />
Page 189 <strong>of</strong> 289
Market value – <strong>The</strong> price at which an asset would trade <strong>in</strong> a competitive<br />
Walrasian auction sett<strong>in</strong>g. Market value is usually <strong>in</strong>terchangeable with open<br />
market value or fair value. International Valuation Standards (IVS) def<strong>in</strong>e:<br />
Market value – the estimated amount for which an asset or liability should<br />
exchange on the valuation date between a will<strong>in</strong>g buyer and a will<strong>in</strong>g seller <strong>in</strong> an<br />
arm's length transaction, after proper market<strong>in</strong>g and where the parties had each<br />
acted knowledgeably, prudently and without compulsion.<br />
<br />
<br />
Value-<strong>in</strong>-use, or use value – <strong>The</strong> net present value (NPV) <strong>of</strong> a cash flow that an<br />
asset generates for a specific owner under a specific use. Value-<strong>in</strong>-use is the<br />
value to one particular user, and may be above or below the market value <strong>of</strong> a<br />
property.<br />
Investment value – is the value to one particular <strong>in</strong>vestor, and may or may not<br />
be higher than the market value <strong>of</strong> a property. Differences between the<br />
<strong>in</strong>vestment value <strong>of</strong> an asset and its market value provide the motivation for<br />
buyers or sellers to enter the marketplace. International Valuation Standards<br />
(IVS) def<strong>in</strong>e:<br />
Investment value – the value <strong>of</strong> an asset to the owner or a prospective owner<br />
for <strong>in</strong>dividual <strong>in</strong>vestment or operational objectives.<br />
<br />
<br />
Insurable Value – is the value <strong>of</strong> real property covered by an <strong>in</strong>surance policy.<br />
Generally it does not <strong>in</strong>clude the site value.<br />
Liquidation Value – may be analyzed as either a forced liquidation or an<br />
orderly liquidation and is a commonly sought standard <strong>of</strong> value <strong>in</strong> bankruptcy<br />
proceed<strong>in</strong>gs. It assumes a seller who is compelled to sell after an exposure<br />
period which is less than the market-normal time-frame.<br />
Price versus Value<br />
<strong>The</strong>re can be differences between what the property is really worth (market value) and<br />
what it cost to buy it (price). A price paid might not represent that property's market<br />
value. Sometimes, special considerations may have been present, such as a special<br />
relationship between the buyer and the seller where one party had control or significant<br />
<strong>in</strong>fluence over the other party. In other cases, the transaction may have been just one <strong>of</strong><br />
several properties sold or traded between two parties. In such cases, the price paid for<br />
any particular piece is not its market "value" (with the idea usually be<strong>in</strong>g, though, that all<br />
the pieces and prices add up to market value <strong>of</strong> all the parts) but rather its market<br />
"price".<br />
At other times, a buyer may will<strong>in</strong>gly pay a premium price, above the generally accepted<br />
market value, if his subjective valuation <strong>of</strong> the property (its <strong>in</strong>vestment value for him)<br />
was higher than the market value. One specific example <strong>of</strong> this is an owner <strong>of</strong> a<br />
Page 190 <strong>of</strong> 289
neighbor<strong>in</strong>g property who, by comb<strong>in</strong><strong>in</strong>g his own property with the subject property,<br />
could obta<strong>in</strong> economies-<strong>of</strong>-scale. Similar situations sometimes happen <strong>in</strong> corporate<br />
f<strong>in</strong>ance. For example, this can occur when a merger or acquisition happens at a price<br />
which is higher than the value represented by the price <strong>of</strong> the underly<strong>in</strong>g stock. <strong>The</strong><br />
usual explanation for these types <strong>of</strong> mergers and acquisitions is that "the sum is greater<br />
than its parts", s<strong>in</strong>ce full ownership <strong>of</strong> a company provides full control <strong>of</strong> it. This is<br />
someth<strong>in</strong>g that purchasers will sometimes pay a high price for. This situation can<br />
happen <strong>in</strong> real estate purchases too.<br />
But the most common reason for value differ<strong>in</strong>g from price is that either the buyer or the<br />
seller is un<strong>in</strong>formed as to what a property's market value is but nevertheless agrees on<br />
a contract at a certa<strong>in</strong> price which is either too expensive or too cheap. This is<br />
unfortunate for one <strong>of</strong> the two parties. It is the obligation <strong>of</strong> a real property appraiser to<br />
estimate the true market value <strong>of</strong> a property and not its market price.<br />
Market Value Def<strong>in</strong>itions <strong>in</strong> <strong>The</strong> United States<br />
In the United States, appraisals are for a certa<strong>in</strong> type <strong>of</strong> value (e.g., foreclosure value,<br />
fair market value, distressed sale value, <strong>in</strong>vestment value). <strong>The</strong> most commonly used<br />
def<strong>in</strong>ition <strong>of</strong> value is Market Value. While Uniform Standards <strong>of</strong> Pr<strong>of</strong>essional Appraisal<br />
Practice (<strong>US</strong>PAP) does not def<strong>in</strong>e Market Value, it provides general guidance for how<br />
Market Value should be def<strong>in</strong>ed:<br />
A type <strong>of</strong> value, stated as an op<strong>in</strong>ion, that presumes the transfer <strong>of</strong> a property (i.e., a<br />
right <strong>of</strong> ownership or a bundle <strong>of</strong> such rights), as <strong>of</strong> a certa<strong>in</strong> date, under specific<br />
conditions set forth <strong>in</strong> the def<strong>in</strong>ition <strong>of</strong> the term identified by the appraiser as applicable<br />
<strong>in</strong> an appraisal.<br />
Thus, the def<strong>in</strong>ition <strong>of</strong> value used <strong>in</strong> an appraisal or Current Market Analysis (CMA)<br />
analysis and report is a set <strong>of</strong> assumptions about the market <strong>in</strong> which the subject<br />
property may transact. It affects the choice <strong>of</strong> comparable data for use <strong>in</strong> the analysis. It<br />
can also affect the method used to value the property. For example, tree value can<br />
contribute up to 27% <strong>of</strong> property value.<br />
Page 191 <strong>of</strong> 289
Three Approaches to Value<br />
<strong>The</strong>re are three traditional groups <strong>of</strong> methodologies for determ<strong>in</strong><strong>in</strong>g value. <strong>The</strong>se are<br />
usually referred to as the "three approaches to value" which are generally <strong>in</strong>dependent<br />
<strong>of</strong> each other:<br />
<br />
<br />
<br />
<strong>The</strong> cost approach (the buyer will not pay more for a property than it would cost<br />
to build an equivalent).<br />
<strong>The</strong> sales comparison approach (compar<strong>in</strong>g a property's characteristics with<br />
those <strong>of</strong> comparable properties that have recently sold <strong>in</strong> similar transactions).<br />
<strong>The</strong> <strong>in</strong>come approach (similar to the methods used for f<strong>in</strong>ancial valuation,<br />
securities analysis or bond pric<strong>in</strong>g).<br />
However, the recent trend <strong>of</strong> the bus<strong>in</strong>ess tends to be toward the use <strong>of</strong> a scientific<br />
methodology <strong>of</strong> appraisal which relies on the foundation <strong>of</strong> quantitative-data, risk, and<br />
geographical based approaches. Pagourtzi et al. have provided a review on the<br />
methods used <strong>in</strong> the <strong>in</strong>dustry by comparison between conventional approaches and<br />
advanced ones.<br />
As mentioned before, an appraiser can generally choose from three approaches to<br />
determ<strong>in</strong>e value. One or two <strong>of</strong> these approaches will usually be most applicable, with<br />
the other approach or approaches usually be<strong>in</strong>g less useful. <strong>The</strong> appraiser has to th<strong>in</strong>k<br />
about the "scope <strong>of</strong> work", the type <strong>of</strong> value, the property itself, and the quality and<br />
quantity <strong>of</strong> data available for each approach. No overarch<strong>in</strong>g statement can be made<br />
that one approach or another is always better than one <strong>of</strong> the other approaches.<br />
<strong>The</strong> appraiser has to th<strong>in</strong>k about the way that most buyers usually buy a given type <strong>of</strong><br />
property. What appraisal method do most buyers use for the type <strong>of</strong> property be<strong>in</strong>g<br />
valued? This generally guides the appraiser's th<strong>in</strong>k<strong>in</strong>g on the best valuation method, <strong>in</strong><br />
conjunction with the available data. For <strong>in</strong>stance, appraisals <strong>of</strong> properties that are<br />
typically purchased by <strong>in</strong>vestors (e.g., skyscrapers, <strong>of</strong>fice build<strong>in</strong>gs) may give greater<br />
weight to the Income Approach. Buyers <strong>in</strong>terested <strong>in</strong> purchas<strong>in</strong>g s<strong>in</strong>gle family residential<br />
property would rather compare price, <strong>in</strong> this case the Sales Comparison Approach<br />
(market analysis approach) would be more applicable. <strong>The</strong> third and f<strong>in</strong>al approach to<br />
value is the Cost Approach to value. <strong>The</strong> Cost Approach to value is most useful <strong>in</strong><br />
determ<strong>in</strong><strong>in</strong>g <strong>in</strong>surable value, and cost to construct a new structure or build<strong>in</strong>g.<br />
For example, s<strong>in</strong>gle apartment build<strong>in</strong>gs <strong>of</strong> a given quality tend to sell at a particular<br />
price per apartment. In many <strong>of</strong> those cases, the sales comparison approach may be<br />
more applicable. On the other hand, a multiple-build<strong>in</strong>g apartment complex would<br />
usually be valued by the <strong>in</strong>come approach, as that would follow how most buyers would<br />
value it. As another example, s<strong>in</strong>gle-family houses are most commonly valued with<br />
greatest weight<strong>in</strong>g to the sales comparison approach. However, if a s<strong>in</strong>gle-family<br />
dwell<strong>in</strong>g is <strong>in</strong> a neighborhood where all or most <strong>of</strong> the dwell<strong>in</strong>gs are rental units, then<br />
some variant <strong>of</strong> the <strong>in</strong>come approach may be more useful. So the choice <strong>of</strong> valuation<br />
Page 192 <strong>of</strong> 289
method can change depend<strong>in</strong>g upon the circumstances, even if the property be<strong>in</strong>g<br />
valued does not change much.<br />
<strong>The</strong> Cost Approach<br />
<strong>The</strong> Cost Approach was once called the summation approach. <strong>The</strong> theory is that the<br />
value <strong>of</strong> a property can be estimated by summ<strong>in</strong>g the land value and the depreciated<br />
value <strong>of</strong> any improvements. <strong>The</strong> value <strong>of</strong> the improvements is <strong>of</strong>ten referred to by the<br />
abbreviation RCNLD (for "reproduction/replacement cost new less depreciation").<br />
Reproduction refers to reproduc<strong>in</strong>g an exact replica; replacement cost refers to the cost<br />
<strong>of</strong> build<strong>in</strong>g a house or other improvement which has the same utility, but us<strong>in</strong>g modern<br />
design, workmanship and materials. In practice, appraisers almost always use<br />
replacement cost and then deduct a factor for any functional dis-utility associated with<br />
the age <strong>of</strong> the subject property. An exception to the general rule <strong>of</strong> us<strong>in</strong>g the<br />
replacement cost, is for some <strong>in</strong>surance value appraisals. In those cases, reproduction<br />
<strong>of</strong> the exact asset after a destructive event like a fire is the goal.<br />
In most <strong>in</strong>stances when the cost approach is <strong>in</strong>volved, the overall methodology is a<br />
hybrid <strong>of</strong> the cost and sales comparison approaches (represent<strong>in</strong>g both the suppliers'<br />
costs and the prices that customers are seek<strong>in</strong>g). For example, the replacement cost to<br />
construct a build<strong>in</strong>g can be determ<strong>in</strong>ed by add<strong>in</strong>g the labor, material, and other costs.<br />
On the other hand, land values and depreciation must be derived from an analysis <strong>of</strong><br />
comparable sales data.<br />
Page 193 <strong>of</strong> 289
<strong>The</strong> cost approach is considered most reliable when used on newer structures, but the<br />
method tends to become less reliable for older properties. <strong>The</strong> cost approach is <strong>of</strong>ten<br />
the only reliable approach when deal<strong>in</strong>g with special use properties (e.g., public<br />
assembly, mar<strong>in</strong>as).<br />
<strong>The</strong> Sales Comparison Approach<br />
<strong>The</strong> sales comparison approach is based primarily on the pr<strong>in</strong>ciple <strong>of</strong> substitution. This<br />
approach assumes a prudent (or rational) <strong>in</strong>dividual will pay no more for a property than<br />
it would cost to purchase a comparable substitute property. <strong>The</strong> approach recognizes<br />
that a typical buyer will compare ask<strong>in</strong>g prices and seek to purchase the property that<br />
meets his or her wants and needs for the lowest cost. In develop<strong>in</strong>g the sales<br />
comparison approach, the appraiser attempts to <strong>in</strong>terpret and measure the actions <strong>of</strong><br />
parties <strong>in</strong>volved <strong>in</strong> the marketplace, <strong>in</strong>clud<strong>in</strong>g buyers, sellers, and <strong>in</strong>vestors.<br />
Data Collection Methods and Valuation Process<br />
Data is collected on recent sales <strong>of</strong> properties similar to the subject be<strong>in</strong>g valued, called<br />
"comparables". Only SOLD properties may be used <strong>in</strong> an appraisal and determ<strong>in</strong>ation <strong>of</strong><br />
a property's value, as they represent amounts actually paid or agreed upon for<br />
properties. Sources <strong>of</strong> comparable data <strong>in</strong>clude real estate publications, public records,<br />
buyers, sellers, real estate brokers and/or agents, appraisers, and so on. Important<br />
details <strong>of</strong> each comparable sale are described <strong>in</strong> the appraisal report. S<strong>in</strong>ce comparable<br />
sales are not identical to the subject property, adjustments may be made for date <strong>of</strong><br />
sale, location, style, amenities, square footage, site size, etc. <strong>The</strong> ma<strong>in</strong> idea is to<br />
simulate the price that would have been paid if each comparable sale were identical to<br />
the subject property. If the comparable is superior to the subject <strong>in</strong> a factor or aspect,<br />
then a downward adjustment is needed for that factor. Likewise, if the comparable is<br />
<strong>in</strong>ferior to the subject <strong>in</strong> an aspect, then an upward adjustment for that aspect is<br />
needed. <strong>The</strong> adjustment is somewhat subjective and relies on the appraiser's tra<strong>in</strong><strong>in</strong>g<br />
and experience. From the analysis <strong>of</strong> the group <strong>of</strong> adjusted sales prices <strong>of</strong> the<br />
comparable sales, the appraiser selects an <strong>in</strong>dicator <strong>of</strong> value that is representative <strong>of</strong><br />
the subject property. It is possible for various appraisers to choose different <strong>in</strong>dicator <strong>of</strong><br />
value which ultimately will provide different property value.<br />
Steps <strong>in</strong> <strong>The</strong> Sales Comparison Approach<br />
<br />
<br />
<br />
<br />
Research the market to obta<strong>in</strong> <strong>in</strong>formation perta<strong>in</strong><strong>in</strong>g to sales, and pend<strong>in</strong>g sales<br />
that are similar to the subject property<br />
2. Investigate the market data to determ<strong>in</strong>e whether they are factually correct and<br />
accurate<br />
Determ<strong>in</strong>e relevant units <strong>of</strong> comparison (e.g., sales price per square foot), and<br />
develop a comparative analysis for each<br />
Compare the subject and comparable sales accord<strong>in</strong>g to the elements <strong>of</strong><br />
comparison and adjust as appropriate<br />
Page 194 <strong>of</strong> 289
Reconcile the multiple value <strong>in</strong>dications that result from the adjustment (upward<br />
or downward) <strong>of</strong> the comparable sales <strong>in</strong>to a s<strong>in</strong>gle value <strong>in</strong>dication<br />
<strong>The</strong> Income Capitalization Approach<br />
<strong>The</strong> <strong>in</strong>come capitalization approach (<strong>of</strong>ten referred to simply as the "<strong>in</strong>come<br />
approach") is used to value commercial and <strong>in</strong>vestment properties. Because it is<br />
<strong>in</strong>tended to directly reflect or model the expectations and behaviors <strong>of</strong> typical market<br />
participants, this approach is generally considered the most applicable valuation<br />
technique for <strong>in</strong>come-produc<strong>in</strong>g properties, where sufficient market data exists.<br />
In a<br />
commercial<br />
<strong>in</strong>comeproduc<strong>in</strong>g<br />
property this<br />
approach<br />
capitalizes an<br />
<strong>in</strong>come<br />
stream <strong>in</strong>to a<br />
value<br />
<strong>in</strong>dication.<br />
This can be<br />
done us<strong>in</strong>g<br />
revenue<br />
multipliers or<br />
capitalization<br />
rates applied<br />
to a Net<br />
Operat<strong>in</strong>g<br />
Income<br />
(NOI).<br />
Usually, an NOI has been stabilized so as not to place too much weight on a very recent<br />
event. An example <strong>of</strong> this is an unleased build<strong>in</strong>g which, technically, has no NOI. A<br />
stabilized NOI would assume that the build<strong>in</strong>g is leased at a normal rate, and to usual<br />
occupancy levels. <strong>The</strong> Net Operat<strong>in</strong>g Income (NOI) is gross potential <strong>in</strong>come (GPI), less<br />
vacancy and collection loss (= Effective Gross Income) less operat<strong>in</strong>g expenses (but<br />
exclud<strong>in</strong>g debt service, <strong>in</strong>come taxes, and/or depreciation charges applied by<br />
accountants).<br />
Alternatively, multiple years <strong>of</strong> net operat<strong>in</strong>g <strong>in</strong>come can be valued by a discounted<br />
cash flow analysis (DCF) model. <strong>The</strong> DCF model is widely used to value larger and<br />
more expensive <strong>in</strong>come-produc<strong>in</strong>g properties, such as large <strong>of</strong>fice towers or major<br />
shopp<strong>in</strong>g centers. This technique applies market-supported yields (or discount rates) to<br />
projected future cash flows (such as annual <strong>in</strong>come figures and typically a lump<br />
reversion from the eventual sale <strong>of</strong> the property) to arrive at a present value <strong>in</strong>dication.<br />
Page 195 <strong>of</strong> 289
UK Valuation Methods<br />
In the United K<strong>in</strong>gdom, valuation methodology has traditionally been classified <strong>in</strong>to five<br />
methods: [11]<br />
1. Comparative method. Used for most types <strong>of</strong> property where there is good evidence<br />
<strong>of</strong> previous sales. This is analogous to the sales comparison approach outl<strong>in</strong>ed above.<br />
2. Investment method. Used for most commercial (and residential) property that is<br />
produc<strong>in</strong>g future cash flows through the lett<strong>in</strong>g <strong>of</strong> the property. If the current estimated<br />
rental value (ERV) and the pass<strong>in</strong>g <strong>in</strong>come are known, as well as the marketdeterm<strong>in</strong>ed<br />
equivalent yield, then the property value can be determ<strong>in</strong>ed by means <strong>of</strong> a<br />
simple model. Note that this method is really a comparison method, s<strong>in</strong>ce the ma<strong>in</strong><br />
variables are determ<strong>in</strong>ed <strong>in</strong> the market. In standard U.S. practice, however, the closely<br />
related capitaliz<strong>in</strong>g <strong>of</strong> NOI is confounded with the DCF method under the general<br />
classification <strong>of</strong> the <strong>in</strong>come capitalization approach (see above).<br />
3. Residual method. Used for properties ripe for development or redevelopment or for<br />
bare land only.<br />
4. Pr<strong>of</strong>it method. Used for trad<strong>in</strong>g properties where evidence <strong>of</strong> rates is slight, such as<br />
hotels, restaurants and old-age homes. A three-year average <strong>of</strong> operat<strong>in</strong>g <strong>in</strong>come<br />
(derived from the pr<strong>of</strong>it and loss or <strong>in</strong>come statement) is capitalized us<strong>in</strong>g an<br />
appropriate yield. Note that s<strong>in</strong>ce the variables used are <strong>in</strong>herent to the property and<br />
are not market-derived, therefore unless appropriate adjustments are made, the<br />
result<strong>in</strong>g value will be value-<strong>in</strong>-use or <strong>in</strong>vestment value, not market value.<br />
5. Cost method. Used for land and build<strong>in</strong>gs <strong>of</strong> special character for which pr<strong>of</strong>it figures<br />
cannot be obta<strong>in</strong>ed or land and build<strong>in</strong>gs for which there is no market because <strong>of</strong> their<br />
public service or heritage characteristics. Both the residual method and the cost method<br />
would be grouped <strong>in</strong> the United States under the cost approach (see above).<br />
Under the current RICS Valuation Standards, the follow<strong>in</strong>g bases <strong>of</strong> value are<br />
recognized:<br />
Market value (see PS 3.2);<br />
Market rent (see PS 3.3);<br />
Worth (<strong>in</strong>vestment value) (see PS 3.4); and<br />
Fair value (see PS 3.5)<br />
Scope <strong>of</strong> Work<br />
Further Considerations<br />
While the Uniform Standards <strong>of</strong> Pr<strong>of</strong>essional Appraisal Practice (<strong>US</strong>PAP) has always<br />
required appraisers to identify the scope <strong>of</strong> work needed to produce credible results, it<br />
Page 196 <strong>of</strong> 289
ecame clear <strong>in</strong> recent years that appraisers did not fully understand the process for<br />
develop<strong>in</strong>g this adequately. In formulat<strong>in</strong>g the scope <strong>of</strong> work for a credible appraisal, the<br />
concept <strong>of</strong> a limited versus complete appraisal and the use <strong>of</strong> the Departure Rule<br />
caused confusion to clients, appraisers, and appraisal reviewers. In order to deal with<br />
this, <strong>US</strong>PAP was updated <strong>in</strong> 2006 with what came to be known as the Scope <strong>of</strong> Work<br />
Project. Follow<strong>in</strong>g this, <strong>US</strong>PAP elim<strong>in</strong>ated both the Departure Rule and the concept <strong>of</strong> a<br />
limited appraisal, and a new Scope <strong>of</strong> Work rule was created. In this, appraisers were to<br />
identify six key parts <strong>of</strong> the appraisal problem at the beg<strong>in</strong>n<strong>in</strong>g <strong>of</strong> each assignment:<br />
<br />
<br />
<br />
<br />
<br />
<br />
Client and other <strong>in</strong>tended users<br />
Intended use <strong>of</strong> the appraisal and appraisal report<br />
Def<strong>in</strong>ition <strong>of</strong> value (e.g., market, foreclosure, <strong>in</strong>vestment)<br />
Any hypothetical conditions or extraord<strong>in</strong>ary assumptions<br />
Effective date <strong>of</strong> the appraisal analysis<br />
Salient features <strong>of</strong> the subject property<br />
Based on these factors, the appraiser must identify the scope <strong>of</strong> work needed, <strong>in</strong>clud<strong>in</strong>g<br />
the methodologies to be used, the extent <strong>of</strong> <strong>in</strong>vestigation, and the applicable<br />
approaches to value. Currently, m<strong>in</strong>imum standards for scope <strong>of</strong> work are:<br />
<br />
<br />
Expectations <strong>of</strong> the client and other users<br />
<strong>The</strong> actions <strong>of</strong> the appraiser's peers who carry out similar assignments<br />
<strong>The</strong> scope <strong>of</strong> work is the first step <strong>in</strong> any appraisal process. Without a strictly def<strong>in</strong>ed<br />
scope <strong>of</strong> work, an appraisal's conclusions may not be viable. By def<strong>in</strong><strong>in</strong>g the scope <strong>of</strong><br />
work, an appraiser can properly develop a value for a given property for the <strong>in</strong>tended<br />
user, and for the <strong>in</strong>tended use <strong>of</strong> the appraisal. <strong>The</strong> whole idea <strong>of</strong> "scope <strong>of</strong> work" is to<br />
provide clear expectations and guidel<strong>in</strong>es for all parties as to what the appraisal report<br />
does, and does not, cover; and how much work has gone <strong>in</strong>to it.<br />
Page 197 <strong>of</strong> 289
Types <strong>of</strong> Ownership Interest<br />
<strong>The</strong> type <strong>of</strong> real estate "<strong>in</strong>terest" that is be<strong>in</strong>g valued, must also be known and stated <strong>in</strong><br />
the report. Usually, for most sales, or mortgage f<strong>in</strong>anc<strong>in</strong>gs, the fee simple <strong>in</strong>terest is<br />
be<strong>in</strong>g valued. <strong>The</strong> fee simple <strong>in</strong>terest is the most complete bundle <strong>of</strong> rights available.<br />
However, <strong>in</strong> many situations, and <strong>in</strong> many societies which do not follow English<br />
Common Law or the Napoleonic Code, some other <strong>in</strong>terest may be more common.<br />
While there are many different possible <strong>in</strong>terests <strong>in</strong> real estate, the three most common<br />
are:<br />
<br />
<br />
<br />
Fee Simple Value (known <strong>in</strong> the UK as freehold) – <strong>The</strong> most complete<br />
ownership <strong>in</strong> real estate, subject <strong>in</strong> common law countries to the powers<br />
reserved to the state (taxation, escheat, em<strong>in</strong>ent doma<strong>in</strong>, and police power)<br />
Leased Fee Value – This is simply the fee simple <strong>in</strong>terest encumbered by a<br />
lease. If the lease is at market rent, then the leased fee value and the fee simple<br />
value are equal. However, if the tenant pays more or less than market, the<br />
residual owned by the leased fee holder, plus the market value <strong>of</strong> the tenancy,<br />
may be more or less than the fee simple value.<br />
Leasehold Value – <strong>The</strong> <strong>in</strong>terest held by a tenant. If the tenant pays market rent,<br />
then the leasehold has no market value. However, if the tenant pays less than<br />
market, the difference between the present value <strong>of</strong> what is paid and the present<br />
value <strong>of</strong> market rents would be a positive leasehold value. For example, a major<br />
cha<strong>in</strong> retailer may be able to negotiate a below-market lease to serve as the<br />
anchor tenant for a shopp<strong>in</strong>g center. This leasehold value may be transferable to<br />
another anchor tenant, and if so the retail tenant has a positive <strong>in</strong>terest <strong>in</strong> the real<br />
estate.<br />
Home Inspection<br />
If a home <strong>in</strong>spection is performed prior to the appraisal and that report is provided to the<br />
appraiser, a more useful appraisal can result. This is because the appraiser, who is not<br />
expert home <strong>in</strong>spector, will be told if there are substantial construction defects or major<br />
repairs required. This <strong>in</strong>formation can cause the appraiser to arrive at a different,<br />
probably lower, op<strong>in</strong>ion <strong>of</strong> value. This <strong>in</strong>formation may be particularly helpful if one or<br />
both <strong>of</strong> the parties request<strong>in</strong>g the appraisal may end up <strong>in</strong> possession <strong>of</strong> the property.<br />
This is sometimes the case with property <strong>in</strong> a divorce settlement or a legal judgment.<br />
Real Estate Appraisal Data Entry<br />
Appraisers provide all the data needed to <strong>in</strong>put <strong>in</strong> appraisal reports. A data entry team<br />
does the rest; it searches, consolidates and types the data <strong>in</strong>to reports, such as subject<br />
data and comparable grid prior sales history. Most data entry organisations work 24<br />
hours a day, 7 days a week, 365 days a year. <strong>The</strong> appraiser sends empty reports, and<br />
Page 198 <strong>of</strong> 289
the data entry team works all day and night, even while the appraiser is sleep<strong>in</strong>g. This<br />
process <strong>in</strong>creases the appraiser's efficiency, and frees up his/her time.<br />
Mass Appraisal and Automated Valuation Models<br />
Automated valuation models (AVMs) are grow<strong>in</strong>g <strong>in</strong> acceptance. <strong>The</strong>se rely on<br />
statistical models such as multiple regression analysis or geographic <strong>in</strong>formation<br />
systems (GIS). While AVMs can be quite accurate, particularly when used <strong>in</strong> a very<br />
homogeneous area, there is also evidence that AVMs are not accurate <strong>in</strong> other<br />
<strong>in</strong>stances such as when they are used <strong>in</strong> rural areas, or when the appraised property<br />
does not conform well to the neighborhood.<br />
Govern<strong>in</strong>g<br />
Authorities and<br />
Pr<strong>of</strong>essional<br />
Organizations<br />
International<br />
<strong>The</strong> various U.S.<br />
appraisal groups and<br />
<strong>in</strong>ternational pr<strong>of</strong>essional<br />
appraisal organizations<br />
have started collaborat<strong>in</strong>g<br />
<strong>in</strong> recent years towards<br />
the development <strong>of</strong><br />
International Valuation<br />
Standards. This will facilitate global real estate appraisal standards, a much-needed<br />
adjunct to real estate <strong>in</strong>vestment portfolios which cross national boundaries. Some<br />
appraisal groups are already <strong>in</strong>ternational organizations and thus, to some extent,<br />
already <strong>in</strong>corporate some level <strong>of</strong> global standards.<br />
<strong>The</strong> International Valuation Standards Council (IVSC) is a non-governmental<br />
organization (NGO) member <strong>of</strong> the United Nations with membership that encompasses<br />
all the major national valuation standard-setters and pr<strong>of</strong>essional associations from 41<br />
different countries (<strong>in</strong>clud<strong>in</strong>g the Appraisal Institute, the American Society <strong>of</strong> Appraisers,<br />
the RICS, the [Practis<strong>in</strong>g Valuers Association <strong>of</strong> India] and the Appraisal Institute <strong>of</strong><br />
Canada). IVSC publishes the International Valuation Standards (IVS), now <strong>in</strong> its 8th<br />
edition.<br />
Germany<br />
In Germany, real estate appraisal is known as real estate valuation<br />
(Immobilienbewertung). Real estate appraisers (Immobilienbewerter or Gutachter) can<br />
qualify to become a Öffentlich bestellter und vereidigter Sachverständiger (<strong>of</strong>ficially<br />
Page 199 <strong>of</strong> 289
appo<strong>in</strong>ted and sworn expert). However, this formerly very important title has lost a lot <strong>of</strong><br />
its importance over the past years, but still is <strong>of</strong> some value <strong>in</strong> court procedures. <strong>The</strong><br />
title is not generally required for appraisals.<br />
Govern<strong>in</strong>g Authorities<br />
Real estate appraisal <strong>in</strong> Germany is partly codified by law. <strong>The</strong> federal Baugesetzbuch<br />
(abbr. BauGB, "German statutory code on build<strong>in</strong>g and construction'") conta<strong>in</strong>s<br />
guidel<strong>in</strong>es on govern<strong>in</strong>g authorities, def<strong>in</strong>es the term market value and refers to<br />
cont<strong>in</strong>uative rules (chapter 3, articles 192 ff.). Each municipality (city or adm<strong>in</strong>istrative<br />
district) must form a Gutachterausschuss (appraisal committee), consist<strong>in</strong>g <strong>of</strong> a<br />
chairman and honorary members. <strong>The</strong> committee gathers <strong>in</strong>formation on all real estate<br />
deals (it is mandatory to send a copy <strong>of</strong> each notarial purchase contract to the<br />
Gutachterausschuss) and <strong>in</strong>cludes it <strong>in</strong> the Kaufpreissammlung (purchase price<br />
database). Most committees publish an <strong>of</strong>ficial real estate market report every two<br />
years, <strong>in</strong> which besides other <strong>in</strong>formation on comparables the land value is determ<strong>in</strong>ed.<br />
<strong>The</strong> committees also perform appraisals on behalf <strong>of</strong> public authorities.<br />
Federal Regulations<br />
<strong>The</strong> BauGB def<strong>in</strong>es the Verkehrswert or Marktwert (market value, both terms with<br />
identical mean<strong>in</strong>g) as follows: "<strong>The</strong> market value is determ<strong>in</strong>ed by the price that can be<br />
realized at the date <strong>of</strong> valuation, <strong>in</strong> an arm's length transaction, with due regard to the<br />
legal situation and the effective characteristics, the nature and lay <strong>of</strong> the premises or<br />
any other subject <strong>of</strong> the valuation" (non-<strong>of</strong>ficial translation). <strong>The</strong> <strong>in</strong>tention, as <strong>in</strong> other<br />
countries, is to <strong>in</strong>clude all objective <strong>in</strong>fluences and to exclude all <strong>in</strong>fluences result<strong>in</strong>g<br />
from the subjective circumstances <strong>of</strong> the <strong>in</strong>volved parties.<br />
This federal law is supported by the Wertermittlungsverordnung (abbr. WertV,<br />
"regulation on the determ<strong>in</strong>ation <strong>of</strong> value"). <strong>The</strong> WertV def<strong>in</strong>es the codified valuation<br />
approaches and the general valuation technique. German codified valuation<br />
approaches (other approaches such as DCF or residual approach are also permitted,<br />
but not codified) are the:<br />
<br />
<br />
<br />
Vergleichswertverfahren (sales comparison approach) – used where good<br />
evidence <strong>of</strong> previous sales is available and for owner-occupied assets, especially<br />
condom<strong>in</strong>iums and s<strong>in</strong>gle-family houses;<br />
Ertragswertverfahren (German <strong>in</strong>come approach) – standard procedure for<br />
property that produces future cash flows from the lett<strong>in</strong>g <strong>of</strong> the property;<br />
Sachwertverfahren (German cost approach) – used for specialised property<br />
where none <strong>of</strong> the above approaches applies, e. g. public build<strong>in</strong>gs.<br />
WertV's general regulations are further supported by the Wertermittlungsrichtl<strong>in</strong>ie (abbr.<br />
WertR, "directive on the determ<strong>in</strong>ation <strong>of</strong> value"). <strong>The</strong> WertR provides templates for<br />
Page 200 <strong>of</strong> 289
calculations, tables (e.g., economic depreciation) and guidel<strong>in</strong>es for the consideration <strong>of</strong><br />
different <strong>in</strong>fluences. WertV and WertR are not b<strong>in</strong>d<strong>in</strong>g for appraisals for non<strong>of</strong>ficial use,<br />
nonetheless they should be regarded as best practice or Generally Accepted (German)<br />
Valuation Practice (GAVP).<br />
Comments on German GAVP<br />
In most regards Generally Accepted (German) Valuation Pr<strong>in</strong>ciples is consistent with<br />
<strong>in</strong>ternational practice. <strong>The</strong> <strong>in</strong>vestment market weighs the <strong>in</strong>come approach most<br />
heavily. However, there are some important differences:<br />
<br />
<br />
<br />
<br />
<br />
Land and improvements are treated separately. German GAVP assumes that the<br />
land can be used <strong>in</strong>def<strong>in</strong>itely, but the build<strong>in</strong>gs have a limited lifespan; This<br />
co<strong>in</strong>cides with the balanc<strong>in</strong>g <strong>of</strong> the assets. <strong>The</strong> value <strong>of</strong> the land is determ<strong>in</strong>ed by<br />
the sales comparison approach <strong>in</strong> both the <strong>in</strong>come and cost approaches, us<strong>in</strong>g<br />
the data accumulated by the Gutachterausschuss which is then added to the<br />
build<strong>in</strong>g value.<br />
In order to account for the usage <strong>of</strong> the land, the net operat<strong>in</strong>g <strong>in</strong>come is reduced<br />
by the Liegenschaftsz<strong>in</strong>s (<strong>in</strong>terest paid to the land-owner by the owner <strong>of</strong> the<br />
build<strong>in</strong>g, i.e., ground rent). <strong>The</strong> Liegenschaftsz<strong>in</strong>s is the product <strong>of</strong> the land value<br />
and the Liegenschaftsz<strong>in</strong>ssatz (<strong>in</strong>terest rate for land use). <strong>The</strong><br />
Liegenschaftsz<strong>in</strong>ssatz is the equivalent <strong>of</strong> the yield—with some important<br />
differences—and is also determ<strong>in</strong>ed by the Gutachterausschuss.<br />
Unlike the All Risks Yield (ARY) <strong>in</strong> UK practice, the Liegenschaftsz<strong>in</strong>ssatz (abbr.<br />
LZ) does not <strong>in</strong>clude an allowance for default (not to be confused with structural<br />
vacancy), therefore this needs to be subtracted from gross operat<strong>in</strong>g <strong>in</strong>come. As<br />
a result, the Liegenschaftsz<strong>in</strong>ssatz will usually be lower than the All Risks Yield.<br />
Based on the assumption that the economic life <strong>of</strong> the improvements is limited,<br />
the yield and rema<strong>in</strong><strong>in</strong>g economic life determ<strong>in</strong>e the build<strong>in</strong>g value from the net<br />
operat<strong>in</strong>g <strong>in</strong>come.<br />
Contracts <strong>in</strong> Germany generally prescribe that the landlord bears a higher portion<br />
<strong>of</strong> ma<strong>in</strong>tenance and operat<strong>in</strong>g costs than their counterparts <strong>in</strong> the United States<br />
and UK.<br />
Criticism<br />
Mathematically the dist<strong>in</strong>ction between land and improvements <strong>in</strong> the <strong>in</strong>come approach<br />
will have no impact on the overall value when the rema<strong>in</strong><strong>in</strong>g economic life is more than<br />
thirty years. For this reason it has become quite common to use the Vere<strong>in</strong>fachtes<br />
Ertragswertverfahren (simplified <strong>in</strong>come approach), omitt<strong>in</strong>g the land value and the<br />
Liegenschaftsz<strong>in</strong>s. However, the separate treatment <strong>of</strong> land and build<strong>in</strong>gs leads to more<br />
Page 201 <strong>of</strong> 289
precise results for older build<strong>in</strong>gs, especially for commercial build<strong>in</strong>gs, which typically<br />
have a shorter economic life than residential build<strong>in</strong>gs.<br />
An advantage <strong>of</strong> the comparatively high degree <strong>of</strong> standardization practiced by<br />
pr<strong>of</strong>essional appraisers, is the greater ability to check an appraisal for <strong>in</strong>consistency,<br />
accuracy and transparency.<br />
Pr<strong>of</strong>essional Organizations<br />
<strong>The</strong> Federal German Organisation <strong>of</strong> Appo<strong>in</strong>ted and Sworn Experts (Bundesverband<br />
Deutscher Sachverständiger und Fachgutachter, abbr. BDSF) is the ma<strong>in</strong> pr<strong>of</strong>essional<br />
organization encompass<strong>in</strong>g the majority <strong>of</strong> licensed appraisers <strong>in</strong> Germany. In recent<br />
years, with the move towards a more global outlook <strong>in</strong> the valuation pr<strong>of</strong>ession, the<br />
RICS has ga<strong>in</strong>ed a foothold <strong>in</strong> Germany, somewhat at the expense <strong>of</strong> the BDSF.<br />
Another German Organisation <strong>of</strong> Appo<strong>in</strong>ted and Sworn Experts ist the (Deutsche<br />
Sachverständigen Gesellschaft, abbr. DESAG) This organization also <strong>in</strong>cludes a large<br />
number <strong>of</strong> licensed appraisers <strong>in</strong> Germany.<br />
With special focus on hypothetical value, <strong>in</strong> 1996, German banks with real estate<br />
f<strong>in</strong>anc<strong>in</strong>g activities formed the HypZert GmbH, an association for the certification <strong>of</strong> real<br />
estate valuers. A HypZert qualification is regarded as mandatory by many German<br />
banks.<br />
Israel<br />
In Israel, the real estate appraisal pr<strong>of</strong>ession is regulated by the Council <strong>of</strong> Land<br />
Valuers, an organ <strong>of</strong> the M<strong>in</strong>istry <strong>of</strong> Justice; the largest pr<strong>of</strong>essional organization,<br />
encompass<strong>in</strong>g the majority <strong>of</strong> appraisers/land valuers is the Association <strong>of</strong> Land<br />
Valuers. Valuers must be registered with the Council, which is a statutory body set up<br />
by law, and which oversees the tra<strong>in</strong><strong>in</strong>g and adm<strong>in</strong>isters the national pr<strong>of</strong>essional<br />
exams that are a prerequisite for atta<strong>in</strong><strong>in</strong>g registration. In 2005 the Council set up a<br />
Valuation Standards Committee with the purpose <strong>of</strong> develop<strong>in</strong>g and promulgat<strong>in</strong>g<br />
standards that would reflect best practice; these have tended to follow a rules-based<br />
approach.<br />
Historically, most valuations <strong>in</strong> Israel were statutory valuations (such as valuations<br />
performed for purposes <strong>of</strong> Betterment Tax, a tax adm<strong>in</strong>istered on any ga<strong>in</strong>s accru<strong>in</strong>g to<br />
the property by way <strong>of</strong> changes to the local plann<strong>in</strong>g) as well as valuations performed<br />
for purposes <strong>of</strong> bank lend<strong>in</strong>g. S<strong>in</strong>ce Israel implemented the International F<strong>in</strong>ancial<br />
Report<strong>in</strong>g Standards (IFRS) <strong>in</strong> 2008, the pr<strong>of</strong>ession has been engaged <strong>in</strong> perform<strong>in</strong>g<br />
valuations for purposes <strong>of</strong> f<strong>in</strong>ancial report<strong>in</strong>g.<br />
United K<strong>in</strong>gdom<br />
In the UK, real estate appraisal is known as property valuation and a real estate<br />
appraiser is a land valuer or property valuer (usually a qualified chartered surveyor who<br />
Page 202 <strong>of</strong> 289
specializes <strong>in</strong> property valuation). Property valuation <strong>in</strong> the UK is regulated by the Royal<br />
Institution <strong>of</strong> Chartered Surveyors (RICS), a pr<strong>of</strong>essional body encompass<strong>in</strong>g all <strong>of</strong> the<br />
build<strong>in</strong>g and property-related pr<strong>of</strong>essions. <strong>The</strong> RICS pr<strong>of</strong>essional guidel<strong>in</strong>es for valuers<br />
are published <strong>in</strong> what is commonly known as the Red Book. <strong>The</strong> 2011 version was the<br />
RICS Valuation Standards 7th Edition (2 May 2011), supersed<strong>in</strong>g an edition published<br />
<strong>in</strong> 2007 with later amendments. <strong>The</strong> RICS Valuation Standards conta<strong>in</strong>s mandatory<br />
rules, best practice guidance and related commentary. Changes to the standards are<br />
approved by the RICS Valuation Pr<strong>of</strong>essional Group Board, and the Red Book is<br />
updated accord<strong>in</strong>gly on a regular basis. While based <strong>in</strong> the UK, RICS is a global<br />
organization and has become very active <strong>in</strong> the United States <strong>in</strong> recent years through its<br />
affiliation with the Counselors <strong>of</strong> Real Estate, a division <strong>of</strong> the National Association <strong>of</strong><br />
Realtors.<br />
United States<br />
Appraisal practice <strong>in</strong> the United States<br />
is regulated by state. <strong>The</strong> Appraisal<br />
Foundation (TAF) is the primary<br />
standards body; its Appraisal Standards<br />
Board (ASB) promulgates and updates<br />
best practices as codified <strong>in</strong> the Uniform<br />
Standards <strong>of</strong> Pr<strong>of</strong>essional Appraisal<br />
Practice (<strong>US</strong>PAP), while its Appraisal<br />
Qualifications Board (AQB) promulgates<br />
m<strong>in</strong>imum standards for appraiser<br />
certification and licens<strong>in</strong>g.<br />
<strong>The</strong> federal government regulates appraisers <strong>in</strong>directly because if the Appraisal<br />
Subcommittee (ASC) <strong>of</strong> the Federal F<strong>in</strong>ancial Institutions Exam<strong>in</strong>ation Council (FFIEC)<br />
f<strong>in</strong>ds that a particular state's appraiser regulation and certification program is<br />
<strong>in</strong>adequate, then under federal regulations all appraisers <strong>in</strong> that state would no longer<br />
be eligible to conduct appraisals for federally chartered banks. <strong>The</strong> ASC oversees the<br />
TAF. Banks make widespread use <strong>of</strong> mortgage loans and mortgage-backed securities,<br />
and would be unable to do so without appraisals.<br />
<strong>The</strong> F<strong>in</strong>ancial Institutions Reform, Recovery, and Enforcement Act <strong>of</strong> 1989 (FIRREA)<br />
demanded all the states to develop systems for licens<strong>in</strong>g and certify<strong>in</strong>g real estate<br />
appraisers. To accomplish this, the Appraisal Subcommittee (ASC) was formed with<strong>in</strong><br />
the Federal F<strong>in</strong>ancial Institutions Exam<strong>in</strong>ation Council (FFIEC), with representatives<br />
from the various Federal mortgage regulatory agencies. Thus, currently all the real<br />
estate appraisers must be state-licensed and certified. But prior to the 1990s, there<br />
were no commonly accepted standards either for appraisal quality or for appraiser<br />
licensure. In the 1980s, an ad-hoc committee represent<strong>in</strong>g various appraisal<br />
pr<strong>of</strong>essional organizations <strong>in</strong> the United States and Canada met to codify the best<br />
practices <strong>in</strong>to what became known as the Uniform Standards <strong>of</strong> Pr<strong>of</strong>essional Appraisal<br />
Practice (<strong>US</strong>PAP). <strong>The</strong> U.S. Sav<strong>in</strong>gs and Loan Crisis resulted <strong>in</strong> <strong>in</strong>creased federal<br />
Page 203 <strong>of</strong> 289
egulation via the F<strong>in</strong>ancial Institutions Reform, Recovery and Enforcement Act <strong>of</strong> 1989,<br />
which required federal lend<strong>in</strong>g regulators to adopt appraisal standards. A nonpr<strong>of</strong>it<br />
organization, <strong>The</strong> Appraisal Foundation (TAF), was formed by the same organizations<br />
that had developed <strong>US</strong>PAP, and the copyright for <strong>US</strong>PAP was signed over to TAF.<br />
Federal oversight <strong>of</strong> TAF is provided by the Appraisal Subcommittee, made up <strong>of</strong><br />
representatives <strong>of</strong> various federal lend<strong>in</strong>g regulators. TAF carries out its work through<br />
two boards: the Appraisal Standards Board promulgates and updates <strong>US</strong>PAP; the<br />
Appraisal Qualifications Board (AQB) promulgates m<strong>in</strong>imum recommended standards<br />
for appraiser certification and licensure. Dur<strong>in</strong>g the 1990s, all <strong>of</strong> the states adopted<br />
<strong>US</strong>PAP as the govern<strong>in</strong>g standards with<strong>in</strong> their states and developed licensure<br />
standards which met or exceeded the recommendations <strong>of</strong> TAF. Also, the various state<br />
and federal courts have adopted <strong>US</strong>PAP for real estate litigation and all <strong>of</strong> the federally<br />
lend<strong>in</strong>g regulators adopt <strong>US</strong>PAP for mortgage f<strong>in</strong>ance appraisal.<br />
Pr<strong>of</strong>essional Organizations<br />
In addition, there are pr<strong>of</strong>essional appraisal organizations, organized as private<br />
nonpr<strong>of</strong>it organizations that date to the Great Depression <strong>of</strong> the 1930s. One <strong>of</strong> the<br />
oldest <strong>in</strong> the United States is the American Society <strong>of</strong> Farm Managers and Rural<br />
Appraisers (ASFMRA), which was founded <strong>in</strong> 1929. Others were founded as needed<br />
and opportunity arose <strong>in</strong> specialized fields, such as the Appraisal Institute (AI) and the<br />
American Society <strong>of</strong> Appraisers (ASA) founded <strong>in</strong> the 1930s, the International Right <strong>of</strong><br />
Way Association and the National Association <strong>of</strong> Realtors which were founded after<br />
World War II. <strong>The</strong>se organizations all existed to establish and enforce standards, but<br />
their <strong>in</strong>fluence waned with <strong>in</strong>creas<strong>in</strong>g government regulation. In March 2007, three <strong>of</strong><br />
these organizations (ASFMRA, ASA, and AI) announced an agreement <strong>in</strong> pr<strong>in</strong>ciple to<br />
merge. NAIFA (National Association <strong>of</strong> Independent Fee Appraisers), a charter member<br />
<strong>of</strong> <strong>The</strong> Appraisal Foundation, helped to write Title XI, the Real Estate Appraisal Reform<br />
Amendments. It was founded <strong>in</strong> 1961.<br />
One <strong>of</strong> the most recognized pr<strong>of</strong>essional organizations <strong>of</strong> real estate appraisers <strong>in</strong><br />
America is the Appraisal Institute (AI). It was formed from the merger <strong>of</strong> the American<br />
Institute <strong>of</strong> Real Estate Appraisers and the Society <strong>of</strong> Real Estate Appraisers. Founded<br />
along with others <strong>in</strong> the 1930s, the two organizations merged <strong>in</strong> the 1990s to form the<br />
AI. This group awards two pr<strong>of</strong>essional designations: SRA, to residential appraisers,<br />
and MAI, to commercial appraisers. <strong>The</strong> Institute has enacted rigorous regulations<br />
regard<strong>in</strong>g the use and display <strong>of</strong> these designations. For example, contrary to popular<br />
belief, "MAI" does not stand for "Member, Appraisal Institute". Accord<strong>in</strong>g to the <strong>in</strong>stitute,<br />
the letters "do not represent specific words", and an MAI may not use the words<br />
"Member, Appraisal Institute" <strong>in</strong> lieu <strong>of</strong> the MAI mark. <strong>The</strong> primary motive for this rule is<br />
to prevent trademark dilution.<br />
<strong>The</strong> National Association <strong>of</strong> Appraisers (NAA) is the fastest grow<strong>in</strong>g appraiser<br />
organization <strong>in</strong> the United States and was formed with a purpose <strong>of</strong> unit<strong>in</strong>g ALL those<br />
engaged <strong>in</strong> the appraisal pr<strong>of</strong>ession for the purpose <strong>of</strong> exert<strong>in</strong>g a beneficial <strong>in</strong>fluence<br />
upon the pr<strong>of</strong>ession and to advocate appraiser <strong>in</strong>terests. <strong>The</strong> NAA has established an<br />
Page 204 <strong>of</strong> 289
advisory group consist<strong>in</strong>g <strong>of</strong> leadership at the state organizations and coalitions called<br />
the Board <strong>of</strong> Governors where those states can help guide the NAA <strong>in</strong> act<strong>in</strong>g <strong>in</strong> the best<br />
<strong>in</strong>terest <strong>of</strong> all appraisers. <strong>The</strong> NAA also has a designated membership, MNAA (Member<br />
<strong>of</strong> the National Association <strong>of</strong> Appraisers, who is an <strong>in</strong>dividual who holds an appraisal<br />
license, certification or similar appraisal credential issued by a governmental agency;<br />
and who accepts the membership requirements and objectives <strong>of</strong> the National<br />
Association <strong>of</strong> Appraisers.<br />
Other lead<strong>in</strong>g appraisal<br />
organizations <strong>in</strong>clude the<br />
National Association <strong>of</strong><br />
Independent Fee Appraisers<br />
and the National Association <strong>of</strong><br />
Master Appraisers, which were<br />
also found<strong>in</strong>g sponsormembers<br />
<strong>of</strong> the Appraisal<br />
Foundation.<br />
<strong>The</strong><br />
Massachusetts Board <strong>of</strong> Real<br />
Estate Appraisers (MBREA),<br />
founded <strong>in</strong> 1934, is the only<br />
state appraisal association that<br />
has been named a sponsor <strong>of</strong><br />
the Appraisal Foundation. In<br />
recent years, the Royal<br />
Institution <strong>of</strong> Chartered<br />
Surveyors (RICS) has become highly regarded <strong>in</strong> the United States, and has formed a<br />
collaboration with the Counselors <strong>of</strong> Real Estate, a division <strong>of</strong> the National Association<br />
<strong>of</strong> Realtors. RICS, which is headquartered <strong>in</strong> London, operates on a global scale and<br />
awards the designations MRICS and FRICS to Members and Fellows <strong>of</strong> RICS. <strong>The</strong><br />
Real Estate Counsel<strong>in</strong>g Group <strong>of</strong> America is a small group <strong>of</strong> top U.S. appraisers and<br />
real estate analysts who have collectively authored a disproportionately large body <strong>of</strong><br />
appraisal methodology and, the National Association <strong>of</strong> Real Estate Appraisers<br />
(NAREA), founded <strong>in</strong> 1966, with the goal to elevate the pr<strong>of</strong>essionalism and success <strong>of</strong><br />
the Appraisal Industry.<br />
<strong>The</strong> lead<strong>in</strong>g appraisal organization for personal property valuation is the American<br />
Society <strong>of</strong> Appraisers which is a sponsor member <strong>of</strong> the Appraisal Foundation and<br />
awards the ASA (Accredited Senior Appraiser) designation to candidates who complete<br />
five years <strong>of</strong> documented appraisal experience, pass a comprehensive exam along with<br />
required commercial and/or residential appraisal coursework, and submit two appraisal<br />
reports for review.<br />
Russia<br />
In Russia, on par with many other former Soviet Union economies, the pr<strong>of</strong>ession<br />
emerged <strong>in</strong> the first half <strong>of</strong> 1990, and represented a clean break with the former practice<br />
Page 205 <strong>of</strong> 289
<strong>of</strong> <strong>in</strong>dustry-specific pric<strong>in</strong>g specialists and with activities <strong>of</strong> statutory price-sett<strong>in</strong>g<br />
authorities <strong>in</strong> the Soviet Union. Currently, property valuation, as it is called, is a<br />
specialism with<strong>in</strong> general-purpose "valuation pr<strong>of</strong>ession", which functions <strong>in</strong> a selfregulatory<br />
mode overseen by "self-regulated pr<strong>of</strong>essional organizations" <strong>of</strong> valuers<br />
(SROs),i.e. public supervisory entities established under provisions <strong>of</strong> special legislation<br />
(which very loosely can be likened to trade unions). <strong>The</strong> pr<strong>in</strong>cipal among those is<br />
Russian Society <strong>of</strong> Appraisers, established <strong>in</strong> 1993 and presently exercis<strong>in</strong>g oversight<br />
over about half <strong>of</strong> the valuation pr<strong>of</strong>ession membership. Among its 6000+ members a<br />
sizeable majority are real property valuers, rubb<strong>in</strong>g shoulders with bus<strong>in</strong>ess and<br />
<strong>in</strong>tangible assets appraisers. <strong>The</strong> latter categories <strong>of</strong> valuers are also allowed to value<br />
property, though valuation pr<strong>of</strong>essionals tend to specialize. Valuers <strong>in</strong> Russia, <strong>in</strong>clud<strong>in</strong>g<br />
real property valuers, are <strong>in</strong>dividuals ma<strong>in</strong>ta<strong>in</strong><strong>in</strong>g their SRO membership and bear<strong>in</strong>g<br />
unlimited property liability for the result <strong>of</strong> their services, that is their pr<strong>of</strong>essional status<br />
is modeled on the organization <strong>of</strong> public notaries. Regardless <strong>of</strong> the fact, over 80% <strong>of</strong><br />
valuers tend to be employed by valuation or consult<strong>in</strong>g companies, and thus do not<br />
enter practice as stand-alone <strong>in</strong>dividual entrepreneurs. High-end appraisal services are<br />
pr<strong>in</strong>cipally represented by valuation arms <strong>of</strong> the International "Big-four" consultancies <strong>in</strong><br />
the country, but there also exist reputable national corporate valuation brands. Most <strong>of</strong><br />
valuations <strong>in</strong> the country tend to be performed for statutory purposes envisaged by the<br />
Federal Valuation Law (latest amendment <strong>in</strong> 2013) and other related laws, such as the<br />
Jo<strong>in</strong>t Stock Companies Law. Such pieces <strong>of</strong> legislation provide for more than 20 socalled<br />
"mandatory cases <strong>of</strong> valuation", <strong>in</strong>clud<strong>in</strong>g valuations for privatization purposes,<br />
lend<strong>in</strong>g purposes, bankruptcy and liquidation etc. Valuations for corporate accounts<br />
used to be much more prom<strong>in</strong>ent before 2000, when the national account<strong>in</strong>g regulator<br />
ceased to <strong>in</strong>centivize the account<strong>in</strong>g fair value option. At present, the mass appraisal <strong>of</strong><br />
property for taxation purposes is also start<strong>in</strong>g to be outsourced by the Government to<br />
the <strong>in</strong>stitution <strong>of</strong> pr<strong>of</strong>essional valuers. Adjudication <strong>of</strong> valuer-certified estimates <strong>of</strong> value<br />
<strong>in</strong> case <strong>of</strong> the onset <strong>of</strong> disputes is conducted through the Experts Councils <strong>of</strong> valuers'<br />
SROs. Official courts tend to concur with the resolutions <strong>of</strong> such Councils. In some rare<br />
<strong>in</strong>stances the imprimatur <strong>of</strong> SRO's Experts Councils is also required for a valuation<br />
done by a particular valuer to enter <strong>in</strong>to effect. <strong>The</strong> technical details <strong>of</strong> practice <strong>of</strong> real<br />
estate valuers <strong>in</strong> Russia are aligned with the <strong>in</strong>ternational pattern. Members <strong>of</strong> the<br />
Russian Society <strong>of</strong> Appraisers are bound by the observance <strong>of</strong> the International<br />
Valuation Standards. <strong>The</strong>re also exists a set <strong>of</strong> three general-purpose governmentdeveloped<br />
"Federal Valuation Standards" (FSO 1,2,3 adopted <strong>in</strong> 2007, with the latest<br />
standard <strong>in</strong> the set deal<strong>in</strong>g with valuation <strong>of</strong> real estate—FSO 7-- adopted <strong>in</strong> late 2014)<br />
which prescribe a required uniform structure for valuation reports.<br />
Hong Kong<br />
<strong>The</strong> Hong Kong Institute <strong>of</strong> Surveyors (HKIS) regulates property surveyors <strong>in</strong> Hong<br />
Kong. Established <strong>in</strong> 1984, Institute is the only pr<strong>of</strong>essional organization represent<strong>in</strong>g<br />
the survey<strong>in</strong>g pr<strong>of</strong>ession <strong>in</strong> Hong Kong. <strong>The</strong> HKIS was statutorily <strong>in</strong>corporated by virtue<br />
<strong>of</strong> the Hong Kong Institute <strong>of</strong> Surveyors Ord<strong>in</strong>ance <strong>in</strong> January 1990 (Cap. 1148). In July<br />
1991, the Surveyors Registration Ord<strong>in</strong>ance (Cap. 417) was passed to set up a<br />
Registration Board to adm<strong>in</strong>ister the registration <strong>of</strong> surveyors. In May 2006, the number<br />
Page 206 <strong>of</strong> 289
<strong>of</strong> members had reached 6,723. A general practice surveyor advises on the best use <strong>of</strong><br />
the land, assesses the feasibility and viability <strong>of</strong> the proposed development project as<br />
well as the valuation, market<strong>in</strong>g, sale, leas<strong>in</strong>g and management <strong>of</strong> completed<br />
developments. It also has a website to provide real-time propertys' value estimate<br />
across whole Hong Kong.<br />
Australia<br />
<strong>The</strong> Australian Property Institute (API) was formed <strong>in</strong> 1926 as the Commonwealth<br />
Institute <strong>of</strong> Valuers. <strong>The</strong> Institute has undergone several name changes over the last<br />
century as the array <strong>of</strong> services <strong>of</strong>fered by its members expanded. It serves to regulate<br />
the pr<strong>of</strong>ession <strong>of</strong> property valuers Sydney, Australia.<br />
Today the API represents the <strong>in</strong>terests <strong>of</strong> more than 8,600 property pr<strong>of</strong>essionals<br />
throughout Australia. API members <strong>in</strong>clude residential, commercial and plant and<br />
mach<strong>in</strong>ery valuers, property advisers, property analysts, property fund and asset<br />
managers, property facility managers, property lawyers and property researchers and<br />
academics. <strong>The</strong> Institute’s primary role is to set and ma<strong>in</strong>ta<strong>in</strong> the highest standards <strong>of</strong><br />
pr<strong>of</strong>essional practice, education, ethics and pr<strong>of</strong>essional conduct for its members and<br />
the broader property pr<strong>of</strong>ession.<br />
New Zealand<br />
Real estate valuation <strong>in</strong> New Zealand is regulated by the New Zealand Institute <strong>of</strong><br />
Valuers ('NZIV') and the Valuers Registration Board <strong>of</strong> New Zealand ('VRB'), both <strong>of</strong><br />
which are statutory bodies established under the Valuers Act 1948 (NZ). <strong>The</strong> NZIV<br />
rema<strong>in</strong>s the statutory pr<strong>of</strong>essional body for valuers <strong>in</strong> New Zealand, with perpetual<br />
succession under the Act (which is under review as at 2015). <strong>The</strong> NZIV can make Rules<br />
as lower level legislation and has a Code <strong>of</strong> Ethics. <strong>The</strong> NZIV Rules were last changed<br />
<strong>in</strong> 2012 and rema<strong>in</strong> current. <strong>The</strong> VRB has jurisdiction <strong>in</strong> relation to serious matters<br />
affect<strong>in</strong>g the registration <strong>of</strong> a valuer <strong>in</strong>clud<strong>in</strong>g discipl<strong>in</strong>e where a valuer has acted <strong>in</strong><br />
such a way as to meet the threshold. <strong>The</strong> Valuers Act 1948 sets the threshold under<br />
s31 as matters where a valuer could be struck <strong>of</strong>f the register <strong>of</strong> valuers. <strong>The</strong> NZIV has<br />
power for discipl<strong>in</strong>e for relatively more m<strong>in</strong>or matters. <strong>The</strong> NZIV governs NZIV members<br />
and has power to discipl<strong>in</strong>e members and f<strong>in</strong>e them up to $500, admonish members or<br />
term<strong>in</strong>ate their membership. <strong>The</strong> designations "Registered Valuer" and "Public Valuer"<br />
are legally protected under the legislation, be<strong>in</strong>g reserved for Valuers Registered under<br />
the Act. <strong>The</strong> NZIV, under the Act, can admit non-valuer members (such as non-valuer<br />
land economists).<br />
<strong>The</strong>re are also voluntary pr<strong>of</strong>essional bodies for real estate valuation such as the Royal<br />
Institute <strong>of</strong> Chartered Surveyors ('RICS') and the Property Institute <strong>of</strong> New Zealand<br />
('PINZ'). Both <strong>of</strong> these bodies have a wider membership, beyond real estate valuers.<br />
PINZ has over 2,500 members <strong>in</strong> New Zealand and overseas (such as ex-pats <strong>in</strong> the<br />
UK, Asia and Australia). PINZ has a service level agreement with the NZIV, whereby<br />
PINZ contracts to perform tasks for the statutory pr<strong>of</strong>essional body, NZIV. PINZ was<br />
Page 207 <strong>of</strong> 289
formed <strong>in</strong> <strong>in</strong> 2000 to act as the voice <strong>of</strong> the property pr<strong>of</strong>essions. <strong>The</strong>re have been<br />
'political divisions' with<strong>in</strong> the valuation pr<strong>of</strong>ession <strong>in</strong> New Zealand, expressed at AGMs<br />
and through 'proxy wars' over the last 20 years or so. Many valuers are supportive <strong>of</strong><br />
amalgamation <strong>of</strong> the NZIV functions under the multi-discipl<strong>in</strong>ary voluntary body PINZ,<br />
whilst many others wish to reta<strong>in</strong> a separate statutory pr<strong>of</strong>essional body for valuers (the<br />
NZIV). <strong>The</strong>re are various reasons <strong>in</strong> the debate and the govern<strong>in</strong>g legislation is under<br />
review and amendments or repeal is be<strong>in</strong>g considered. At present, the Act rema<strong>in</strong>s <strong>in</strong><br />
force and the NZIV is legally a dist<strong>in</strong>ct body with statutory functions, powers and duties.<br />
PINZ <strong>in</strong>corporated much <strong>of</strong> the membership <strong>of</strong> the NZIV, the Institute <strong>of</strong> Plant &<br />
Mach<strong>in</strong>ery Valuers (IPMV) and the Property & Land Economy Institute <strong>of</strong> New Zealand<br />
(PLEINZ). PINZ now represents the <strong>in</strong>terests <strong>of</strong> valuers, property and facilities<br />
managers, property advisors and plant and mach<strong>in</strong>ery valuers. PINZ has developed <strong>in</strong>to<br />
one <strong>of</strong> the largest pr<strong>of</strong>essional bodies for standards, qualifications and ethics across all<br />
facets <strong>of</strong> the property pr<strong>of</strong>ession with<strong>in</strong> New Zealand. It works with government, <strong>in</strong>dustry<br />
and other pr<strong>of</strong>essional associations, education stakeholders and the media to promote<br />
its standards and views.<br />
In New Zealand, the terms "valuation" and "valuer" usually relates to one who<br />
undertakes that pr<strong>of</strong>essional role <strong>in</strong> terms <strong>of</strong> the Valuer Act 1948 requirements or the<br />
unregulated or voluntarily self-regulated (if members <strong>of</strong> PINZ) plant and mach<strong>in</strong>ery,<br />
mar<strong>in</strong>e or art valuers. Whereas, the term "appraisal" is usually related to an estimate by<br />
a real estate sales person or licensed agent under the Real Estate Agents Act 2008.<br />
<strong>The</strong> Real Estate Institute <strong>of</strong> New Zealand <strong>in</strong>cludes many valuer members, but the<br />
govern<strong>in</strong>g legislation for sales and agency (disposal <strong>of</strong> <strong>in</strong>terests <strong>of</strong> land on behalf <strong>of</strong><br />
others) does not extend to <strong>in</strong>clude provision for that role by valuers regardless <strong>of</strong><br />
membership <strong>of</strong> NZIV, RICS or PINZ.<br />
<strong>The</strong>re is a key dist<strong>in</strong>ction between the role <strong>of</strong> a real estate agent and a valuer, as an<br />
agent may advocate for its pr<strong>in</strong>cipal's <strong>in</strong>terests, whereas a valuer must impartially and<br />
<strong>in</strong>dependently provide op<strong>in</strong>ion as to value. Lawyers, Conveyancers and Real Estate<br />
Agents are permitted to act <strong>in</strong> the sale <strong>of</strong> real estate under quite different legislation<br />
from that which governs valuers. <strong>The</strong> provision for the role <strong>in</strong> relation to Lawyers and<br />
Conveyancers is the Lawyers and Conveyancers 2006.<br />
In 2011 to 2015, the number <strong>of</strong> Registered Valuers <strong>in</strong> New Zealand has generally<br />
between only around 900 to 950 each year. This is an age<strong>in</strong>g 'top heavy' pr<strong>of</strong>essional<br />
with difficulty reta<strong>in</strong><strong>in</strong>g new and young members due to pay, work stress and the recent<br />
advent <strong>of</strong> 'clear<strong>in</strong>g houses' for banks to order valuations for mortgage purposes. <strong>The</strong><br />
clear<strong>in</strong>g houses have largely ended the long-stand<strong>in</strong>g local practice <strong>of</strong> members <strong>of</strong> the<br />
public seek<strong>in</strong>g advice directly from a valuer. <strong>The</strong> use <strong>of</strong> electronic estimates based on<br />
Rat<strong>in</strong>g Values (Local Government mass appraisal for levies) is also lead<strong>in</strong>g to a<br />
reduction <strong>in</strong> standard valuation work and is significantly affect<strong>in</strong>g the viability <strong>of</strong> small<br />
valuation bus<strong>in</strong>esses. <strong>The</strong> pr<strong>of</strong>ession is <strong>in</strong> the process <strong>of</strong> a wider corporate restructur<strong>in</strong>g<br />
<strong>of</strong> the valuation market due to these factors with various perceptions with<strong>in</strong><br />
pr<strong>of</strong>ession as to the merits <strong>of</strong> the events <strong>of</strong> the last five years.<br />
Page 208 <strong>of</strong> 289
2. Next We Determ<strong>in</strong>e the Income <strong>of</strong> Each Partner to the<br />
Transaction, Divide the Hous<strong>in</strong>g Cost, Further Divide the<br />
Number <strong>of</strong> Mortgage Term, and That’s What Determ<strong>in</strong>es<br />
the Initial Monthly Payment<br />
Mortgage Calculators are automated tools that enable users to determ<strong>in</strong>e the f<strong>in</strong>ancial<br />
implications <strong>of</strong> changes <strong>in</strong> one or more variables <strong>in</strong> a mortgage f<strong>in</strong>anc<strong>in</strong>g arrangement.<br />
Mortgage calculators are used by consumers to determ<strong>in</strong>e monthly repayments, and by<br />
mortgage providers to determ<strong>in</strong>e the f<strong>in</strong>ancial suitability <strong>of</strong> a home loan applicant.<br />
<strong>The</strong> major variables <strong>in</strong> a mortgage calculation <strong>in</strong>clude loan pr<strong>in</strong>cipal, balance, periodic<br />
compound <strong>in</strong>terest rate, number <strong>of</strong> payments per year, total number <strong>of</strong> payments and<br />
the regular payment amount. More complex calculators can take <strong>in</strong>to account other<br />
costs associated with a mortgage, such as local and state taxes, and <strong>in</strong>surance.<br />
Mortgage calculation capabilities can be found on f<strong>in</strong>ancial handheld calculators such<br />
as the HP-12C or Texas Instruments TI BA II Plus. <strong>The</strong>re are also multiple free onl<strong>in</strong>e<br />
free mortgage calculators, and s<strong>of</strong>tware programs <strong>of</strong>fer<strong>in</strong>g f<strong>in</strong>ancial and mortgage<br />
calculations.<br />
Uses<br />
When purchas<strong>in</strong>g a new home, most buyers choose to f<strong>in</strong>ance a portion <strong>of</strong> the purchase<br />
price via the use <strong>of</strong> a mortgage. Prior to the wide availability <strong>of</strong> mortgage calculators,<br />
those wish<strong>in</strong>g to understand the f<strong>in</strong>ancial implications <strong>of</strong> changes to the five ma<strong>in</strong><br />
variables <strong>in</strong> a mortgage transaction were forced to use compound <strong>in</strong>terest rate tables.<br />
<strong>The</strong>se tables generally required a work<strong>in</strong>g understand<strong>in</strong>g <strong>of</strong> compound <strong>in</strong>terest<br />
Page 209 <strong>of</strong> 289
mathematics for proper use. In contrast, mortgage calculators make answers to<br />
questions regard<strong>in</strong>g the impact <strong>of</strong> changes <strong>in</strong> mortgage variables available to everyone.<br />
Mortgage calculators can be used to answer such questions as:<br />
If one borrows $250,000 at a 7% annual <strong>in</strong>terest rate and pays the loan back over thirty<br />
years, with $3,000 annual property tax payment, $1,500 annual property <strong>in</strong>surance cost<br />
and 0.5% annual private mortgage <strong>in</strong>surance payment, what will the monthly payment<br />
be? <strong>The</strong> answer is $2,142.42.<br />
A potential borrower can use an onl<strong>in</strong>e mortgage calculator to see how much property<br />
he or she can afford. A lender will compare the person's total monthly <strong>in</strong>come and total<br />
monthly debt load. A mortgage calculator can help to add up all <strong>in</strong>come sources and<br />
compare this to all monthly debt payments. It can also factor <strong>in</strong> a potential mortgage<br />
payment and other associated hous<strong>in</strong>g costs (property taxes, homeownership dues,<br />
etc.). One can test different loan sizes and <strong>in</strong>terest rates. Generally speak<strong>in</strong>g, lenders<br />
do not like to see all <strong>of</strong> a borrower's debt payments (<strong>in</strong>clud<strong>in</strong>g property expenses)<br />
exceed around 40% <strong>of</strong> total monthly pretax <strong>in</strong>come. Some mortgage lenders are known<br />
to allow as high as 55%.<br />
Monthly Payment Formula<br />
<strong>The</strong> fixed monthly payment for a fixed rate mortgage is the amount paid by the borrower<br />
every month that ensures that the loan is paid <strong>of</strong>f <strong>in</strong> full with <strong>in</strong>terest at the end <strong>of</strong> its<br />
term. <strong>The</strong> monthly payment formula is based on the annuity formula. <strong>The</strong> monthly<br />
payment c depends upon:<br />
<br />
<br />
<br />
r - the monthly <strong>in</strong>terest rate, expressed as a decimal, not a percentage. S<strong>in</strong>ce the<br />
quoted yearly percentage rate is not a compounded rate, the monthly percentage<br />
rate is simply the yearly percentage rate divided by 12; divid<strong>in</strong>g the monthly<br />
percentage rate by 100 gives r, the monthly rate expressed as a decimal.<br />
N - the number <strong>of</strong> monthly payments, called the loan's term, and<br />
P - the amount borrowed, known as the loan's pr<strong>in</strong>cipal.<br />
In the standardized calculations used <strong>in</strong> the United States, c is given by the formula:<br />
For example, for a home loan <strong>of</strong> $200,000 with a fixed yearly <strong>in</strong>terest rate <strong>of</strong> 6.5% for 30<br />
years, the pr<strong>in</strong>cipal is , the monthly <strong>in</strong>terest rate is ,<br />
the number <strong>of</strong> monthly payments is<br />
, the fixed monthly payment<br />
equals $1,264.14. This formula is provided us<strong>in</strong>g the f<strong>in</strong>ancial function PMT <strong>in</strong> a<br />
spreadsheet such as Excel. In the example, the monthly payment is obta<strong>in</strong>ed by<br />
enter<strong>in</strong>g either <strong>of</strong> the these formulas:<br />
Page 210 <strong>of</strong> 289
= -PMT(6.5 / 100 / 12, 30 * 12, 200000)<br />
= ((6.5 / 100 / 12) * 200000) / (1 - ((1 + (6.5 / 100 / 12)) ^ (-30 * 12)))<br />
= 1264.14<br />
<strong>The</strong> follow<strong>in</strong>g derivation <strong>of</strong> this formula illustrates how fixed-rate mortgage loans work.<br />
<strong>The</strong> amount owed on the loan at the end <strong>of</strong> every month equals the amount owed from<br />
the previous month, plus the <strong>in</strong>terest on this amount, m<strong>in</strong>us the fixed amount paid every<br />
month. This fact results <strong>in</strong> the debt schedule:<br />
Amount owed at <strong>in</strong>itiation:<br />
Amount owed after 1 month:<br />
Amount owed after 2 months:<br />
Amount owed after 3 months:<br />
. . . . . . . . . . . . . . . . . . . . . . . . . . . . . . . . . . . . . . . . . . . . . . . . . .<br />
Amount owed after N months:<br />
<strong>The</strong> polynomial<br />
appear<strong>in</strong>g before the fixed<br />
monthly payment c (with<br />
) is called a cyclotomic polynomial; it has a simple<br />
closed-form expression obta<strong>in</strong>ed from observ<strong>in</strong>g that<br />
Page 211 <strong>of</strong> 289
ecause all but the first and last terms <strong>in</strong> this difference cancel each other out.<br />
<strong>The</strong>refore, solv<strong>in</strong>g for<br />
yields the much simpler closed-form expression<br />
Apply<strong>in</strong>g this fact about cyclotomic polynomials to the amount owed at the end <strong>of</strong> the<br />
Nth month gives (us<strong>in</strong>g to succ<strong>in</strong>ctly denote the function value at argument<br />
value x = (1+r )):<br />
Amount owed at end <strong>of</strong> month N<br />
<strong>The</strong> amount <strong>of</strong> the monthly payment at the end <strong>of</strong> month N that is applied to pr<strong>in</strong>cipal<br />
paydown equals the amount c <strong>of</strong> payment m<strong>in</strong>us the amount <strong>of</strong> <strong>in</strong>terest currently paid<br />
on the pre-exist<strong>in</strong>g unpaid pr<strong>in</strong>cipal. <strong>The</strong> latter amount, the <strong>in</strong>terest component <strong>of</strong> the<br />
current payment, is the <strong>in</strong>terest rate r times the amount unpaid at the end <strong>of</strong> month N–1.<br />
S<strong>in</strong>ce <strong>in</strong> the early years <strong>of</strong> the mortgage the unpaid pr<strong>in</strong>cipal is still large, so are the<br />
<strong>in</strong>terest payments on it; so the portion <strong>of</strong> the monthly payment go<strong>in</strong>g toward pay<strong>in</strong>g<br />
down the pr<strong>in</strong>cipal is very small and equity <strong>in</strong> the property accumulates very slowly (<strong>in</strong><br />
the absence <strong>of</strong> changes <strong>in</strong> the market value <strong>of</strong> the property). But <strong>in</strong> the later years <strong>of</strong> the<br />
mortgage, when the pr<strong>in</strong>cipal has already been substantially paid down and not much<br />
monthly <strong>in</strong>terest needs to be paid, most <strong>of</strong> the monthly payment goes toward repayment<br />
<strong>of</strong> the pr<strong>in</strong>cipal, and the rema<strong>in</strong><strong>in</strong>g pr<strong>in</strong>cipal decl<strong>in</strong>es rapidly.<br />
<strong>The</strong> borrower's equity <strong>in</strong> the property equals the current market value <strong>of</strong> the property<br />
m<strong>in</strong>us the amount owed accord<strong>in</strong>g to the above formula.<br />
With a fixed rate mortgage, the borrower agrees to pay <strong>of</strong>f the loan completely at the<br />
end <strong>of</strong> the loan's term, so the amount owed at month N must be zero. For this to<br />
happen, the monthly payment c can be obta<strong>in</strong>ed from the previous equation to obta<strong>in</strong>:<br />
Page 212 <strong>of</strong> 289
which is the formula orig<strong>in</strong>ally provided. This derivation illustrates three key components<br />
<strong>of</strong> fixed-rate loans: (1) the fixed monthly payment depends upon the amount borrowed,<br />
the <strong>in</strong>terest rate, and the length <strong>of</strong> time over which the loan is repaid; (2) the amount<br />
owed every month equals the amount owed from the previous month plus <strong>in</strong>terest on<br />
that amount, m<strong>in</strong>us the fixed monthly payment; (3) the fixed monthly payment is chosen<br />
so that the loan is paid <strong>of</strong>f <strong>in</strong> full with <strong>in</strong>terest at the end <strong>of</strong> its term and no more money<br />
is owed.<br />
Adjustable Interest Rates<br />
While adjustable rate mortgages have been around for decades, from 2002 through<br />
2005 adjustable-rate mortgages became more complicated as did the calculations<br />
<strong>in</strong>volved. Lend<strong>in</strong>g became much more creative which complicated the calculations.<br />
Subprime lend<strong>in</strong>g and creative loans such as the “pick a payment”, “pay option”, and<br />
“hybrid” loans brought on new era <strong>of</strong> mortgage calculations. <strong>The</strong> more creative<br />
adjustable mortgages meant some changes <strong>in</strong> the calculations to specifically handle<br />
these complicated loans. To calculate the annual percentage rates (APR) many more<br />
variables needed to be added, <strong>in</strong>clud<strong>in</strong>g: the start<strong>in</strong>g <strong>in</strong>terest rate; the length <strong>of</strong> time at<br />
that rate; the recast; the payment change; the <strong>in</strong>dex; the marg<strong>in</strong>s; the periodic <strong>in</strong>terest<br />
change cap; the payment cap; lifetime cap; the negative amortization cap; and others.<br />
Many lenders created their own s<strong>of</strong>tware programs, and World Sav<strong>in</strong>gs even had<br />
contracted special calculators to be made by Calculated Industries specifically for their<br />
“pick a payment” program. However, by the late 2000s the Great Recession brought an<br />
end to many <strong>of</strong> the creative “pick-a-payment” type <strong>of</strong> loans which left many borrowers<br />
with higher loan balances over time, and ow<strong>in</strong>g more than their houses were worth. This<br />
also helped reduce the more complicated calculations that went along with these<br />
mortgages.<br />
Mortgage Analyzer<br />
As a recent trend s<strong>in</strong>ce 2007, <strong>in</strong> the wake <strong>of</strong> a f<strong>in</strong>ancial crisis that was founded on many<br />
<strong>in</strong>dividuals' bad mortgage decision <strong>in</strong> residential borrow<strong>in</strong>g, a new generation <strong>of</strong><br />
mortgage calculation tools has emerged. <strong>The</strong>y are better equipped to estimate the longterm<br />
cost and f<strong>in</strong>ancial risk <strong>of</strong> various types <strong>of</strong> mortgages. Rather than "mortgage<br />
calculator", the new tools have become popularly known as "mortgage analyzers". <strong>The</strong>ir<br />
ma<strong>in</strong> advantage is <strong>in</strong> the analysis <strong>of</strong> adjustable rate mortgages where the potential cost<br />
and amount ow<strong>in</strong>g on the mortgage are estimated under thousands, sometimes<br />
millions, <strong>of</strong> possible future mortgage rate scenarios, and then aggregate figures for<br />
average cost and risk based on all scenarios are estimated. Conventional mortgage<br />
calculators are capable <strong>of</strong> handl<strong>in</strong>g just a handful <strong>of</strong> scenarios.<br />
Total Interest Paid Formula<br />
<strong>The</strong> total amount <strong>of</strong> <strong>in</strong>terest that will be paid over the lifetime <strong>of</strong> the loan is the<br />
difference <strong>of</strong> the total payment amount ( ) and the loan pr<strong>in</strong>cipal ( ):<br />
Page 213 <strong>of</strong> 289
where is the fixed monthly payment, is the number <strong>of</strong> payments that will be made,<br />
and is the <strong>in</strong>itial pr<strong>in</strong>cipal balance on the loan.<br />
Outside the U.S.<br />
In the United K<strong>in</strong>gdom, the FCA - F<strong>in</strong>ancial Conduct Authority (formerly the FSA -<br />
F<strong>in</strong>ancial Services Authority) regulates loans secured on residential property. It does not<br />
prescribe any specific calculation method, however it does prescribe that for<br />
comparative purposes lenders must display an Annual Percentage Rate (as prom<strong>in</strong>ently<br />
as other rates).<br />
In Spa<strong>in</strong>, the regulatory authority (Banco de España) has issued and enforced some<br />
good practices, such as clearly advertis<strong>in</strong>g the Annual Percentage Rate and stat<strong>in</strong>g how<br />
and when payments change <strong>in</strong> variable rate mortgages.<br />
Fixed Rate Mortgages<br />
A Fixed-Rate Mortgage (FRM), <strong>of</strong>ten referred to as a "vanilla wafer" mortgage loan, is<br />
a fully amortiz<strong>in</strong>g mortgage loan where the <strong>in</strong>terest rate on the note rema<strong>in</strong>s the same<br />
through the term <strong>of</strong> the loan, as opposed to loans where the <strong>in</strong>terest rate may adjust or<br />
Page 214 <strong>of</strong> 289
"float". As a result, payment amounts and the duration <strong>of</strong> the loan are fixed and the<br />
person who is responsible for pay<strong>in</strong>g back the loan benefits from a consistent, s<strong>in</strong>gle<br />
payment and the ability to plan a budget based on this fixed cost.<br />
Other forms <strong>of</strong> mortgage loans <strong>in</strong>clude <strong>in</strong>terest only mortgage, graduated payment<br />
mortgage, variable rate mortgage (<strong>in</strong>clud<strong>in</strong>g adjustable-rate mortgages and tracker<br />
mortgages), negative amortization mortgage, and balloon payment mortgage. Unlike<br />
many other loan types, FRM <strong>in</strong>terest payments and loan duration is fixed from<br />
beg<strong>in</strong>n<strong>in</strong>g to end.<br />
Fixed-rate mortgages are characterized by amount <strong>of</strong> loan, <strong>in</strong>terest rate, compound<strong>in</strong>g<br />
frequency, and duration. With these values, the monthly repayments can be calculated.<br />
Unlike adjustable-rate mortgages (ARM), fixed-rate mortgages are not tied to an <strong>in</strong>dex.<br />
Instead, the <strong>in</strong>terest rate is set (or "fixed") <strong>in</strong> advance to an advertised rate, usually <strong>in</strong><br />
<strong>in</strong>crements <strong>of</strong> 1/4 or 1/8 percent.<br />
<strong>The</strong> fixed monthly payment for a fixed-rate mortgage is the amount paid by the borrower<br />
every month that ensures that the loan is paid <strong>of</strong>f <strong>in</strong> full with <strong>in</strong>terest at the end <strong>of</strong> its<br />
term.<br />
Popularity<br />
<strong>The</strong> United States Federal Hous<strong>in</strong>g Adm<strong>in</strong>istration (FHA) helped develop and<br />
standardize the fixed rate mortgage as an alternative to the balloon payment mortgage<br />
by <strong>in</strong>sur<strong>in</strong>g them and by do<strong>in</strong>g so helped the mortgage design garner usage. Because<br />
<strong>of</strong> the large payment at the end <strong>of</strong> the older, balloon-payment loan, ref<strong>in</strong>anc<strong>in</strong>g risk<br />
resulted <strong>in</strong> widespread foreclosures. <strong>The</strong> fixed-rate mortgage was the first mortgage<br />
loan that was fully amortized (fully paid at the end <strong>of</strong> the loan) preclud<strong>in</strong>g successive<br />
loans, and had fixed <strong>in</strong>terest rates and payments.<br />
Fixed-rate mortgages are the most classic form <strong>of</strong> loan for home and product<br />
purchas<strong>in</strong>g <strong>in</strong> the United States. <strong>The</strong> most common terms are 15-year and 30-year<br />
mortgages, but shorter terms are available, and 40-year and 50-year mortgages are<br />
now available (common <strong>in</strong> areas with high priced hous<strong>in</strong>g, where even a 30-year term<br />
leaves the mortgage amount out <strong>of</strong> reach <strong>of</strong> the average family).<br />
Outside the United States, fixed-rate mortgages are less popular, and <strong>in</strong> some<br />
countries, true fixed-rate mortgages are not available except for shorter-term loans. For<br />
example, <strong>in</strong> Canada the longest term for which a mortgage rate can be fixed is typically<br />
no more than ten years, while mortgage maturities are commonly 25 years. <strong>The</strong><br />
mortgage <strong>in</strong>dustry <strong>of</strong> the United K<strong>in</strong>gdom has traditionally been dom<strong>in</strong>ated by build<strong>in</strong>g<br />
societies, whose raised funds must be at least 50% deposits, so lenders prefer variablerate<br />
mortgages to fixed-rate mortgages to reduce asset–liability mismatch due to<br />
<strong>in</strong>terest rate risk. Lenders, <strong>in</strong> turn, <strong>in</strong>fluence consumer decisions which already prefer<br />
lower <strong>in</strong>itial monthly payments.<br />
Page 215 <strong>of</strong> 289
Comparisons<br />
Fixed rate mortgages are usually more expensive than adjustable rate mortgages. Due<br />
to the <strong>in</strong>herent <strong>in</strong>terest rate risk, long-term fixed rate loans will tend to be at a higher<br />
<strong>in</strong>terest rate than short-term loans. <strong>The</strong> relationship between <strong>in</strong>terest rates for short and<br />
long-term loans is represented by the yield curve, which generally slopes upward<br />
(longer terms are more expensive). <strong>The</strong> opposite circumstance is known as an <strong>in</strong>verted<br />
yield curve and occurs less <strong>of</strong>ten.<br />
<strong>The</strong> fact that a fixed rate mortgage has a higher start<strong>in</strong>g <strong>in</strong>terest rate does not <strong>in</strong>dicate<br />
that this is a worse form <strong>of</strong> borrow<strong>in</strong>g compared to the adjustable rate mortgages. If<br />
<strong>in</strong>terest rates rise, the ARM cost will be higher while the FRM will rema<strong>in</strong> the same. In<br />
effect, the lender has agreed to take the <strong>in</strong>terest rate risk on a fixed-rate loan. Some<br />
studies [3] have shown that the majority <strong>of</strong> borrowers with adjustable rate mortgages<br />
save money <strong>in</strong> the long term, but that some borrowers pay more. <strong>The</strong> price <strong>of</strong> potentially<br />
sav<strong>in</strong>g money, <strong>in</strong> other words, is balanced by the risk <strong>of</strong> potentially higher costs. In each<br />
case, a choice would need to be made based upon the loan term, the current <strong>in</strong>terest<br />
rate, and the likelihood that the rate will <strong>in</strong>crease or decrease dur<strong>in</strong>g the life <strong>of</strong> the loan.<br />
Pric<strong>in</strong>g<br />
<br />
Note: Fixed-rate mortgage <strong>in</strong>terest may be compounded differently <strong>in</strong> other<br />
countries, such as <strong>in</strong> Canada, where it is compounded every 6 months.<br />
<strong>The</strong> fixed monthly payment for a fixed rate mortgage is the amount paid by the borrower<br />
every month that ensures that the loan is paid <strong>of</strong>f <strong>in</strong> full with <strong>in</strong>terest at the end <strong>of</strong> its<br />
term. This monthly payment depends upon the monthly <strong>in</strong>terest rate (expressed as a<br />
fraction, not a percentage, i.e., divide the quoted yearly nom<strong>in</strong>al percentage rate by 100<br />
and by 12 to obta<strong>in</strong> the monthly <strong>in</strong>terest rate), the number <strong>of</strong> monthly payments called<br />
the loan's term, and the amount borrowed known as the loan's pr<strong>in</strong>cipal; rearrang<strong>in</strong>g<br />
the formula for the present value <strong>of</strong> an ord<strong>in</strong>ary annuity we get the formula for :<br />
For example, for a home loan for $200,000 with a fixed yearly nom<strong>in</strong>al <strong>in</strong>terest rate <strong>of</strong><br />
6.5% for 30 years, the pr<strong>in</strong>cipal is , the monthly <strong>in</strong>terest rate is<br />
, the number <strong>of</strong> monthly payments is , the fixed<br />
monthly payment<br />
. This formula is provided us<strong>in</strong>g the f<strong>in</strong>ancial function<br />
PMT <strong>in</strong> a spreadsheet such as Excel. In the example, the monthly payment is obta<strong>in</strong>ed<br />
by enter<strong>in</strong>g either <strong>of</strong> the these formulas:<br />
=PMT(6.5/100/12,30*12,200000)<br />
=((6.5/100/12)/(1-(1+6.5/100/12)^(-30*12)))*200000<br />
Page 216 <strong>of</strong> 289
This monthly payment formula is easy to derive, and the derivation illustrates how fixedrate<br />
mortgage loans work. <strong>The</strong> amount owed on the loan at the end <strong>of</strong> every month<br />
equals the amount owed from the previous month, plus the <strong>in</strong>terest on this amount,<br />
m<strong>in</strong>us the fixed amount paid every month.<br />
Amount owed at month 0:<br />
Amount owed at month 1:<br />
( pr<strong>in</strong>cipal + <strong>in</strong>terest – payment)<br />
(equation 1)<br />
Amount owed at month 2:<br />
Us<strong>in</strong>g equation 1 for<br />
Amount owed at month 3:<br />
(equation 2)<br />
Us<strong>in</strong>g equation 2 for<br />
Amount owed at month N:<br />
Where<br />
progression)<br />
(equation 3)<br />
(equation 4) (see geometric<br />
(equation 5)<br />
With the exception <strong>of</strong> two terms the and series are the same so when<br />
you subtract all but two terms cancel:<br />
Us<strong>in</strong>g equation 4 and 5<br />
(equation 6)<br />
Putt<strong>in</strong>g equation 6 back <strong>in</strong>to 3:<br />
will be zero because we have paid the loan <strong>of</strong>f.<br />
Page 217 <strong>of</strong> 289
We want to know<br />
Divide top and bottom with<br />
This derivation illustrates three key components <strong>of</strong> fixed-rate loans: (1) the fixed monthly<br />
payment depends upon the amount borrowed, the <strong>in</strong>terest rate, and the length <strong>of</strong> time<br />
over which the loan is repaid; (2) the amount owed every month equals the amount<br />
owed from the previous month plus <strong>in</strong>terest on that amount, m<strong>in</strong>us the fixed monthly<br />
payment; (3) the fixed monthly payment is chosen so that the loan is paid <strong>of</strong>f <strong>in</strong> full with<br />
<strong>in</strong>terest at the end <strong>of</strong> its term and no more money is owed.<br />
FRM <strong>in</strong> S<strong>in</strong>gapore<br />
A fixed rate mortgage <strong>in</strong> the Republic only has the <strong>in</strong>terest rate fixed for the first three to<br />
five years <strong>of</strong> the loan, after which it will become variable.<br />
United K<strong>in</strong>gdom<br />
Nationwide Commercial recently issued a 30 year fixed rate mortgage as bridg<strong>in</strong>g<br />
f<strong>in</strong>ance.<br />
Adjustable Rate Mortgages<br />
A variable-rate mortgage, adjustable-rate mortgage (ARM), or tracker mortgage is<br />
a mortgage loan with the <strong>in</strong>terest rate on the note periodically adjusted based on an<br />
<strong>in</strong>dex which reflects the cost to the lender <strong>of</strong> borrow<strong>in</strong>g on the credit markets. <strong>The</strong> loan<br />
may be <strong>of</strong>fered at the lender's standard variable rate/base rate. <strong>The</strong>re may be a direct<br />
and legally def<strong>in</strong>ed l<strong>in</strong>k to the underly<strong>in</strong>g <strong>in</strong>dex, but where the lender <strong>of</strong>fers no specific<br />
l<strong>in</strong>k to the underly<strong>in</strong>g market or <strong>in</strong>dex the rate can be changed at the lender's discretion.<br />
<strong>The</strong> term "variable-rate mortgage" is most common outside the United States, whilst <strong>in</strong><br />
the United States, "adjustable-rate mortgage" is most common, and implies a mortgage<br />
regulated by the Federal government, with caps on charges. In many countries,<br />
adjustable rate mortgages are the norm, and <strong>in</strong> such places, may simply be referred to<br />
as mortgages.<br />
Among the most common <strong>in</strong>dices are the rates on 1-year constant-maturity Treasury<br />
(CMT) securities, the Cost <strong>of</strong> Funds Index (COFI), and the London Interbank Offered<br />
Rate (LIBOR). A few lenders use their own cost <strong>of</strong> funds as an <strong>in</strong>dex, rather than us<strong>in</strong>g<br />
other <strong>in</strong>dices. This is done to ensure a steady marg<strong>in</strong> for the lender, whose own cost <strong>of</strong><br />
Page 218 <strong>of</strong> 289
fund<strong>in</strong>g will usually be related to the <strong>in</strong>dex. Consequently, payments made by the<br />
borrower may change over time with the chang<strong>in</strong>g <strong>in</strong>terest rate (alternatively, the term <strong>of</strong><br />
the loan may change). This is dist<strong>in</strong>ct from the graduated payment mortgage, which<br />
<strong>of</strong>fers chang<strong>in</strong>g payment amounts but a fixed <strong>in</strong>terest rate. Other forms <strong>of</strong> mortgage<br />
loan <strong>in</strong>clude the <strong>in</strong>terest-only mortgage, the fixed-rate mortgage, the negative<br />
amortization mortgage, and the balloon payment mortgage.<br />
Adjustable rates transfer part <strong>of</strong> the <strong>in</strong>terest rate risk from the lender to the borrower.<br />
<strong>The</strong>y can be used where unpredictable <strong>in</strong>terest rates make fixed rate loans difficult to<br />
obta<strong>in</strong>. <strong>The</strong> borrower benefits if the <strong>in</strong>terest rate falls but loses if the <strong>in</strong>terest rate<br />
<strong>in</strong>creases. <strong>The</strong> borrower benefits from reduced marg<strong>in</strong>s to the underly<strong>in</strong>g cost <strong>of</strong><br />
borrow<strong>in</strong>g compared to fixed or capped rate mortgages.<br />
Index<br />
Characteristics<br />
<br />
<br />
<br />
<br />
<br />
<br />
11th District Cost <strong>of</strong> Funds Index (COFI)<br />
London Interbank Offered Rate (LIBOR)<br />
12-month Treasury Average Index (MTA)<br />
Constant Maturity Treasury (CMT)<br />
National Average Contract Mortgage Rate<br />
Bank Bill Swap Rate (BBSW)<br />
In some countries, banks may publish a prime lend<strong>in</strong>g rate which is used as the <strong>in</strong>dex.<br />
<strong>The</strong> <strong>in</strong>dex may be applied <strong>in</strong> one <strong>of</strong> three ways: directly, on a rate plus marg<strong>in</strong> basis, or<br />
based on <strong>in</strong>dex movement.<br />
A directly applied <strong>in</strong>dex means that the <strong>in</strong>terest rate changes exactly with the <strong>in</strong>dex. In<br />
other words, the <strong>in</strong>terest rate on the note exactly equals the <strong>in</strong>dex. Of the above <strong>in</strong>dices,<br />
only the contract rate <strong>in</strong>dex is applied directly.<br />
To apply an <strong>in</strong>dex on a rate plus marg<strong>in</strong> basis means that the <strong>in</strong>terest rate will equal the<br />
underly<strong>in</strong>g <strong>in</strong>dex plus a marg<strong>in</strong>. <strong>The</strong> marg<strong>in</strong> is specified <strong>in</strong> the note and rema<strong>in</strong>s fixed<br />
over the life <strong>of</strong> the loan. For example, a mortgage <strong>in</strong>terest rate may be specified <strong>in</strong> the<br />
note as be<strong>in</strong>g LIBOR plus 2%, 2% be<strong>in</strong>g the marg<strong>in</strong> and LIBOR be<strong>in</strong>g the <strong>in</strong>dex.<br />
<strong>The</strong> f<strong>in</strong>al way to apply an <strong>in</strong>dex is on a movement basis. In this scheme, the mortgage is<br />
orig<strong>in</strong>ated at an agreed upon rate, then adjusted based on the movement <strong>of</strong> the <strong>in</strong>dex.<br />
Unlike direct or <strong>in</strong>dex plus marg<strong>in</strong>, the <strong>in</strong>itial rate is not explicitly tied to any <strong>in</strong>dex; the<br />
adjustments are tied to an <strong>in</strong>dex.<br />
Basic Features <strong>of</strong> ARMs<br />
<strong>The</strong> most important basic features <strong>of</strong> ARMs are:<br />
Page 219 <strong>of</strong> 289
1. Initial Interest Rate. This is the beg<strong>in</strong>n<strong>in</strong>g <strong>in</strong>terest rate on an ARM.<br />
2. <strong>The</strong> Adjustment Period. This is the length <strong>of</strong> time that the <strong>in</strong>terest rate or loan<br />
period on an ARM is scheduled to rema<strong>in</strong> unchanged. <strong>The</strong> rate is reset at the<br />
end <strong>of</strong> this period, and the monthly loan payment is recalculated.<br />
3. <strong>The</strong> Index Rate. Most lenders tie ARM <strong>in</strong>terest rates changes to changes <strong>in</strong> an<br />
<strong>in</strong>dex rate. Lenders base ARM rates on a variety <strong>of</strong> <strong>in</strong>dices, the most common<br />
be<strong>in</strong>g rates on one-, three-, or five-year Treasury securities. Another common<br />
<strong>in</strong>dex is the national or regional average cost <strong>of</strong> funds to sav<strong>in</strong>gs and loan<br />
associations.<br />
4. <strong>The</strong> Marg<strong>in</strong>. This is the percentage po<strong>in</strong>ts that lenders add to the <strong>in</strong>dex rate to<br />
determ<strong>in</strong>e the ARM's <strong>in</strong>terest rate.<br />
5. Interest Rate Caps. <strong>The</strong>se are the limits on how much the <strong>in</strong>terest rate or the<br />
monthly payment can be changed at the end <strong>of</strong> each adjustment period or over<br />
the life <strong>of</strong> the loan.<br />
6. Initial Discounts. <strong>The</strong>se are <strong>in</strong>terest rate concessions, <strong>of</strong>ten used as<br />
promotional aids, <strong>of</strong>fered the first year or more <strong>of</strong> a loan. <strong>The</strong>y reduce the <strong>in</strong>terest<br />
rate below the prevail<strong>in</strong>g rate (the <strong>in</strong>dex plus the marg<strong>in</strong>).<br />
7. Negative Amortization. This means the mortgage balance is <strong>in</strong>creas<strong>in</strong>g. This<br />
occurs whenever the monthly mortgage payments are not large enough to pay all<br />
the <strong>in</strong>terest due on the mortgage. This may be caused when the payment cap<br />
conta<strong>in</strong>ed <strong>in</strong> the ARM is low enough such that the pr<strong>in</strong>cipal plus <strong>in</strong>terest payment<br />
is greater than the payment cap.<br />
8. Conversion. <strong>The</strong> agreement with the lender may have a clause that allows the<br />
buyer to convert the ARM to a fixed-rate mortgage at designated times.<br />
9. Prepayment. Some agreements may require the buyer to pay special fees or<br />
penalties if the ARM is paid <strong>of</strong>f early. Prepayment terms are sometimes<br />
negotiable.<br />
<strong>The</strong> choice <strong>of</strong> a home mortgage loan is complicated and time consum<strong>in</strong>g. As a help to<br />
the buyer, the Federal Reserve Board and the Federal Home Loan Bank Board have<br />
prepared a mortgage checklist.<br />
Caps<br />
Any mortgage where payments made by the borrower may <strong>in</strong>crease over time br<strong>in</strong>gs<br />
with it the risk <strong>of</strong> f<strong>in</strong>ancial hardship to the borrower. To limit this risk, limitations on<br />
charges—known as caps <strong>in</strong> the <strong>in</strong>dustry—are a common feature <strong>of</strong> adjustable rate<br />
mortgages. Caps typically apply to three characteristics <strong>of</strong> the mortgage:<br />
Page 220 <strong>of</strong> 289
frequency <strong>of</strong> the <strong>in</strong>terest rate change<br />
periodic change <strong>in</strong> <strong>in</strong>terest rate<br />
total change <strong>in</strong> <strong>in</strong>terest rate over the life <strong>of</strong> the loan, sometimes called life cap<br />
For example, a given ARM might have the follow<strong>in</strong>g types <strong>of</strong> <strong>in</strong>terest rate adjustment<br />
caps:<br />
<strong>in</strong>terest adjustments made every six months, typically 1% per adjustment, 2%<br />
total per year<br />
<strong>in</strong>terest adjustments made only once a year, typically 2% maximum<br />
<strong>in</strong>terest rate may adjust no more than 1% <strong>in</strong> a year<br />
Mortgage payment adjustment caps:<br />
<br />
maximum mortgage payment adjustments, usually 7.5% annually on payoption/negative<br />
amortization loans<br />
Life <strong>of</strong> loan <strong>in</strong>terest rate adjustment caps:<br />
<br />
total <strong>in</strong>terest rate adjustment limited to 5% or 6% for the life <strong>of</strong> the loan.<br />
Caps on the periodic change <strong>in</strong> <strong>in</strong>terest rate may be broken up <strong>in</strong>to one limit on the first<br />
periodic change and a separate limit on subsequent periodic change, for example 5%<br />
on the <strong>in</strong>itial adjustment and 2% on subsequent adjustments.<br />
Although uncommon, a cap may limit the maximum monthly payment <strong>in</strong> absolute terms<br />
(for example, $1000 a month), rather than <strong>in</strong> relative terms.<br />
ARMs that allow negative amortization will typically have payment adjustments that<br />
occur less frequently than the <strong>in</strong>terest rate adjustment. For example, the <strong>in</strong>terest rate<br />
may be adjusted every month, but the payment amount only once every 12 months.<br />
Cap structure is sometimes expressed as <strong>in</strong>itial adjustment cap / subsequent<br />
adjustment cap / life cap, for example 2/2/5 for a loan with a 2% cap on the <strong>in</strong>itial<br />
adjustment, a 2% cap on subsequent adjustments, and a 5% cap on total <strong>in</strong>terest rate<br />
adjustments. When only two values are given, this <strong>in</strong>dicates that the <strong>in</strong>itial change cap<br />
and periodic cap are the same. For example, a 2/2/5 cap structure may sometimes be<br />
written simply 2/5.<br />
Reasons for ARMs<br />
ARMs generally permit borrowers to lower their <strong>in</strong>itial payments if they are will<strong>in</strong>g to<br />
assume the risk <strong>of</strong> <strong>in</strong>terest rate changes. <strong>The</strong>re is evidence that consumers tend to<br />
prefer contracts with the lowest <strong>in</strong>itial rates, such as <strong>in</strong> the UK where consumers tend to<br />
focus on immediate monthly mortgage costs. Decisions <strong>of</strong> consumers may also be<br />
Page 221 <strong>of</strong> 289
affected by the advice they get, and much <strong>of</strong> the advice is provided by lenders who may<br />
prefer ARMs because <strong>of</strong> f<strong>in</strong>ancial market structures.<br />
In many countries, banks or similar f<strong>in</strong>ancial <strong>in</strong>stitutions are the primary orig<strong>in</strong>ators <strong>of</strong><br />
mortgages. For banks that are funded from customer deposits, the customer deposits<br />
will typically have much shorter terms than residential mortgages. If a bank were to <strong>of</strong>fer<br />
large volumes <strong>of</strong> mortgages at fixed rates but to derive most <strong>of</strong> its fund<strong>in</strong>g from deposits<br />
(or other short-term sources <strong>of</strong> funds), the bank would have an asset–liability mismatch<br />
due to <strong>in</strong>terest rate risk: <strong>in</strong> this case, it would be runn<strong>in</strong>g the risk that the <strong>in</strong>terest <strong>in</strong>come<br />
from its mortgage portfolio would be less than it needed to pay its depositors. In the<br />
United States, some argue that the sav<strong>in</strong>gs and loan crisis was <strong>in</strong> part caused by this<br />
problem, that the sav<strong>in</strong>gs and loans companies had short-term deposits and long-term,<br />
fixed rate mortgages, and were caught when Paul Volcker raised <strong>in</strong>terest rates <strong>in</strong> the<br />
early 1980s. <strong>The</strong>refore, banks and other f<strong>in</strong>ancial <strong>in</strong>stitutions <strong>of</strong>fer adjustable rate<br />
mortgages because it reduces risk and matches their sources <strong>of</strong> fund<strong>in</strong>g.<br />
Bank<strong>in</strong>g regulators pay close attention to asset-liability mismatches to avoid such<br />
problems, and place tight restrictions on the amount <strong>of</strong> long-term fixed-rate mortgages<br />
that banks may hold (<strong>in</strong> relation to their other assets). To reduce this risk, many<br />
mortgage orig<strong>in</strong>ators will sell many <strong>of</strong> their mortgages, particularly the mortgages with<br />
fixed rates.<br />
For the borrower, adjustable rate mortgages may be less expensive, but at the price <strong>of</strong><br />
bear<strong>in</strong>g higher risk. Many ARMs have "teaser periods", which are relatively short <strong>in</strong>itial<br />
fixed-rate periods (typically one month to one year) when the ARM bears an <strong>in</strong>terest<br />
rate that is substantially below the "fully <strong>in</strong>dexed" rate. <strong>The</strong> teaser period may <strong>in</strong>duce<br />
some borrowers to view an ARM as more <strong>of</strong> a barga<strong>in</strong> than it really represents. A low<br />
teaser rate predisposes an ARM to susta<strong>in</strong> above-average payment <strong>in</strong>creases.<br />
Hybrid ARMs<br />
ARM Variants<br />
A hybrid ARM features an <strong>in</strong>terest rate that is fixed for an <strong>in</strong>itial period <strong>of</strong> time, then<br />
floats thereafter. <strong>The</strong> "hybrid" refers to the ARM's blend <strong>of</strong> fixed-rate and adjustable-rate<br />
characteristics. Hybrid ARMs are referred to by their <strong>in</strong>itial fixed-rate and adjustable-rate<br />
periods, for example, 3/1, is for an ARM with a 3-year fixed <strong>in</strong>terest-rate period and<br />
subsequent 1-year <strong>in</strong>terest-rate adjustment periods. <strong>The</strong> date that a hybrid ARM shifts<br />
from a fixed-rate payment schedule to an adjust<strong>in</strong>g payment schedule is known as the<br />
reset date. After the reset date, a hybrid ARM floats at a marg<strong>in</strong> over a specified <strong>in</strong>dex<br />
just like any ord<strong>in</strong>ary ARM.<br />
<strong>The</strong> popularity <strong>of</strong> hybrid ARMs has significantly <strong>in</strong>creased <strong>in</strong> recent years. In 1998, the<br />
percentage <strong>of</strong> hybrids relative to 30-year fixed-rate mortgages was less than 2%; with<strong>in</strong><br />
six years, this <strong>in</strong>creased to 27.5%.<br />
Page 222 <strong>of</strong> 289
Like other ARMs, hybrid ARMs transfer some <strong>in</strong>terest-rate risk from the lender to the<br />
borrower, thus allow<strong>in</strong>g the lender to <strong>of</strong>fer a lower note rate <strong>in</strong> many <strong>in</strong>terest-rate<br />
environments.<br />
Option ARMs<br />
An "option ARM" is typically a 30-year ARM that <strong>in</strong>itially <strong>of</strong>fers the borrower four monthly<br />
payment options: a specified m<strong>in</strong>imum payment, an <strong>in</strong>terest-only payment, a 15-year<br />
fully amortiz<strong>in</strong>g payment, and a 30-year fully amortiz<strong>in</strong>g payment.<br />
<strong>The</strong>se types <strong>of</strong> loans are also called "pick-a-payment" or "pay-option" ARMs.<br />
When a borrower makes a Pay-Option ARM payment that is less than the accru<strong>in</strong>g<br />
<strong>in</strong>terest, there is "negative amortization", which means that the unpaid portion <strong>of</strong> the<br />
accru<strong>in</strong>g <strong>in</strong>terest is added to the outstand<strong>in</strong>g pr<strong>in</strong>cipal balance. For example, if the<br />
borrower makes a m<strong>in</strong>imum payment <strong>of</strong> $1,000 and the ARM has accrued monthly<br />
<strong>in</strong>terest <strong>in</strong> arrears <strong>of</strong> $1,500, $500 will be added to the borrower's loan balance.<br />
Moreover, the next month's <strong>in</strong>terest-only payment will be calculated us<strong>in</strong>g the new,<br />
higher pr<strong>in</strong>cipal balance.<br />
Option ARMs are <strong>of</strong>ten <strong>of</strong>fered with a very low teaser rate (<strong>of</strong>ten as low as 1%) which<br />
translates <strong>in</strong>to very low m<strong>in</strong>imum payments for the first year <strong>of</strong> the ARM. Dur<strong>in</strong>g boom<br />
times, lenders <strong>of</strong>ten underwrite borrowers based on mortgage payments that are below<br />
the fully amortiz<strong>in</strong>g payment level. This enables borrowers to qualify for a much larger<br />
Page 223 <strong>of</strong> 289
loan (i.e., take on more debt) than would otherwise be possible. When evaluat<strong>in</strong>g an<br />
Option ARM, prudent borrowers will not focus on the teaser rate or <strong>in</strong>itial payment level,<br />
but will consider the characteristics <strong>of</strong> the <strong>in</strong>dex, the size <strong>of</strong> the "mortgage marg<strong>in</strong>" that<br />
is added to the <strong>in</strong>dex value, and the other terms <strong>of</strong> the ARM. Specifically, they need to<br />
consider the possibilities that (1) long-term <strong>in</strong>terest rates go up; (2) their home may not<br />
appreciate or may even lose value or even (3) that both risks may materialize.<br />
Option ARMs are best suited to sophisticated borrowers with grow<strong>in</strong>g <strong>in</strong>comes,<br />
particularly if their <strong>in</strong>comes fluctuate seasonally and they need the payment flexibility<br />
that such an ARM may provide. Sophisticated borrowers will carefully manage the level<br />
<strong>of</strong> negative amortization that they allow to accrue.<br />
In this way, a borrower can control the ma<strong>in</strong> risk <strong>of</strong> an Option ARM, which is "payment<br />
shock", when the negative amortization and other features <strong>of</strong> this product can trigger<br />
substantial payment <strong>in</strong>creases <strong>in</strong> short periods <strong>of</strong> time.<br />
<strong>The</strong> m<strong>in</strong>imum payment on an Option ARM can jump dramatically if its unpaid pr<strong>in</strong>cipal<br />
balance hits the maximum limit on negative amortization (typically 110% to 125% <strong>of</strong> the<br />
orig<strong>in</strong>al loan amount). If that happens, the next m<strong>in</strong>imum monthly payment will be at a<br />
level that would fully amortize the ARM over its rema<strong>in</strong><strong>in</strong>g term. In addition, Option<br />
ARMs typically have automatic "recast" dates (<strong>of</strong>ten every fifth year) when the payment<br />
is adjusted to get the ARM back on pace to amortize the ARM <strong>in</strong> full over its rema<strong>in</strong><strong>in</strong>g<br />
term.<br />
For example, a $200,000 ARM with a 110% "neg am" cap will typically adjust to a fully<br />
amortiz<strong>in</strong>g payment, based on the current fully <strong>in</strong>dexed <strong>in</strong>terest rate and the rema<strong>in</strong><strong>in</strong>g<br />
term <strong>of</strong> the loan, if negative amortization causes the loan balance to exceed $220,000.<br />
For a 125% recast, this will happen if the loan balance reaches $250,000.<br />
Any loan that is allowed to generate negative amortization means that the borrower is<br />
reduc<strong>in</strong>g his equity <strong>in</strong> his home, which <strong>in</strong>creases the chance that he won't be able to sell<br />
it for enough to repay the loan. Decl<strong>in</strong><strong>in</strong>g property values would exacerbate this risk.<br />
Option ARMs may also be available as "hybrids," with longer fixed-rate periods. <strong>The</strong>se<br />
products would not be likely to have low teaser rates. As a result, such ARMs mitigate<br />
the possibility <strong>of</strong> negative amortization, and would likely not appeal to borrowers<br />
seek<strong>in</strong>g an "affordability" product.<br />
Cash Flow ARMs<br />
A cash flow ARM is a m<strong>in</strong>imum payment option mortgage loan. This type <strong>of</strong> loan allows<br />
a borrower to choose their monthly payment from several options. <strong>The</strong>se payment<br />
options usually <strong>in</strong>clude the option to pay at the 30-year level, 15-year level, <strong>in</strong>terest only<br />
level, and a m<strong>in</strong>imum payment level. <strong>The</strong> m<strong>in</strong>imum payment level is usually lower than<br />
the <strong>in</strong>terest only payment. This type <strong>of</strong> loan can result <strong>in</strong> negative amortization. <strong>The</strong><br />
Page 224 <strong>of</strong> 289
option to make a m<strong>in</strong>imum payment is usually available only for the first several years <strong>of</strong><br />
the loan.<br />
Cash flow ARM mortgages are synonymous with option ARM or payment option ARM<br />
mortgages, however it should be noted that not all loans with cash flow options are<br />
adjustable. In fact, fixed rate cash flow option loans reta<strong>in</strong> the same cash flow options<br />
as cash flow ARMs and option ARMs, but rema<strong>in</strong> fixed for up to 30 years.<br />
Term<strong>in</strong>ology<br />
Term<br />
Def<strong>in</strong>ition<br />
Hybrid ARMs are <strong>of</strong>ten referred to <strong>in</strong> this format, where X is the number <strong>of</strong><br />
years dur<strong>in</strong>g which the <strong>in</strong>itial <strong>in</strong>terest rate applies prior to first adjustment<br />
(common terms are 3, 5, 7, and 10 years), and Y is the <strong>in</strong>terval between<br />
adjustments (common terms are 1 for one year and 6 for six months). As an<br />
X/Y<br />
example, a 5/1 ARM means that the <strong>in</strong>itial <strong>in</strong>terest rate applies for five years<br />
(or 60 months, <strong>in</strong> terms <strong>of</strong> payments), after which the <strong>in</strong>terest rate is<br />
adjusted annually. (Adjustments for escrow accounts, however, do not<br />
follow the 5/1 schedule; these are done annually.)<br />
<strong>The</strong> price <strong>of</strong> the ARM is calculated by add<strong>in</strong>g Index + Marg<strong>in</strong> = Fully<br />
Indexed Rate. This is the <strong>in</strong>terest rate your loan would be at without a Start<br />
Fully<br />
Rate (the <strong>in</strong>troductory special rate for the <strong>in</strong>itial fixed period). This means<br />
Indexed<br />
the loan would be higher if adjust<strong>in</strong>g, typically, 1–3% higher than the fixed<br />
Rate<br />
rate. Calculat<strong>in</strong>g this is important for ARM buyers, s<strong>in</strong>ce it helps predict the<br />
future <strong>in</strong>terest rate <strong>of</strong> the loan.<br />
For ARMs where the <strong>in</strong>dex is applied to the <strong>in</strong>terest rate <strong>of</strong> the note on an<br />
"<strong>in</strong>dex plus marg<strong>in</strong>" basis, the marg<strong>in</strong> is the difference between the note rate<br />
and the <strong>in</strong>dex on which the note rate is based expressed <strong>in</strong> percentage<br />
Marg<strong>in</strong><br />
terms. [1] This is not to be confused with pr<strong>of</strong>it marg<strong>in</strong>. <strong>The</strong> lower the marg<strong>in</strong><br />
the better the loan is to the borrower as the maximum rate will <strong>in</strong>crease less<br />
at each adjustment. Marg<strong>in</strong>s will vary between 2% and 7%.<br />
A published f<strong>in</strong>ancial <strong>in</strong>dex such as LIBOR used to periodically adjust the<br />
Index<br />
<strong>in</strong>terest rate <strong>of</strong> the ARM.<br />
<strong>The</strong> <strong>in</strong>troductory rate provided to purchasers <strong>of</strong> ARM loans for the <strong>in</strong>itial<br />
Start Rate<br />
fixed <strong>in</strong>terest period.<br />
<strong>The</strong> length <strong>of</strong> time between <strong>in</strong>terest rate adjustments. In times <strong>of</strong> fall<strong>in</strong>g<br />
Period <strong>in</strong>terest rates, a shorter period benefits the borrower. On the other hand, <strong>in</strong><br />
times <strong>of</strong> ris<strong>in</strong>g <strong>in</strong>terest rates, a shorter period benefits the lender.<br />
A clause that sets the m<strong>in</strong>imum rate for the <strong>in</strong>terest rate <strong>of</strong> an ARM loan.<br />
Loans may come with a Start Rate = Floor feature, but this is primarily for<br />
Floor Non-Conform<strong>in</strong>g (aka Sub-Prime or Program Lend<strong>in</strong>g) loan products. This<br />
prevents an ARM loan from ever adjust<strong>in</strong>g lower than the Start Rate. An "A<br />
Paper" loan typically has either no Floor or 2% below start.<br />
Payment Industry term to describe the severe (unexpected or planned for by<br />
Page 225 <strong>of</strong> 289
Shock<br />
Cap<br />
borrower) upward movement <strong>of</strong> mortgage loan <strong>in</strong>terest rates and its effect<br />
on borrowers. This is the major risk <strong>of</strong> an ARM, as this can lead to severe<br />
f<strong>in</strong>ancial hardship for the borrower.<br />
Any clause that sets a limitation on the amount or frequency <strong>of</strong> rate<br />
changes.<br />
Loan Caps<br />
Loan caps provide payment protection aga<strong>in</strong>st payment shock, and allow a measure <strong>of</strong><br />
<strong>in</strong>terest rate certa<strong>in</strong>ty to those who gamble with <strong>in</strong>itial fixed rates on ARM loans. <strong>The</strong>re<br />
are three types <strong>of</strong> Caps on a typical First Lien Adjustable Rate Mortgage or First Lien<br />
Hybrid Adjustable Rate Mortgage.<br />
Initial Adjustment Rate Cap: <strong>The</strong> majority <strong>of</strong> loans have a higher cap for <strong>in</strong>itial<br />
adjustments that's <strong>in</strong>dexed to the <strong>in</strong>itial fixed period. In other words, the longer the <strong>in</strong>itial<br />
fixed term, the more the bank would like to potentially adjust your loan. Typically, this<br />
cap is 2–3% above the Start Rate on a loan with an <strong>in</strong>itial fixed rate term <strong>of</strong> three years<br />
or lower and 5–6% above the Start Rate on a loan with an <strong>in</strong>itial fixed rate term <strong>of</strong> five<br />
years or greater.<br />
Rate Adjustment Cap: This is the maximum amount by which an Adjustable Rate<br />
Mortgage may <strong>in</strong>crease on each successive adjustment. Similar to the <strong>in</strong>itial cap, this<br />
cap is usually 1% above the Start Rate for loans with an <strong>in</strong>itial fixed term <strong>of</strong> three years<br />
or greater and usually 2% above the Start Rate for loans that have an <strong>in</strong>itial fixed term<br />
<strong>of</strong> five years or greater.<br />
Lifetime Cap: Most First Mortgage loans have a 5% or 6% Life Cap above the Start<br />
Rate (this ultimately varies by the lender and credit grade).<br />
<br />
Industry Shorthand for ARM Caps<br />
Inside the bus<strong>in</strong>ess caps are expressed most <strong>of</strong>ten by simply the three numbers<br />
<strong>in</strong>volved that signify each cap. For example, a 5/1 Hybrid ARM may have a cap<br />
structure <strong>of</strong> 5/2/5 (5% <strong>in</strong>itial cap, 2% adjustment cap and 5% lifetime cap) and <strong>in</strong>siders<br />
would call this a 5-2-5 cap. Alternatively, a 1-year ARM might have a 1/1/6 cap (1%<br />
<strong>in</strong>itial cap, 1% adjustment cap and 6% lifetime cap) known as a 1-1-6, or alternatively<br />
expressed as a 1/6 cap (leav<strong>in</strong>g out one digit signifies that the <strong>in</strong>itial and adjustment<br />
caps are identical).<br />
<br />
Negative amortization ARM caps<br />
See the complete article for the type <strong>of</strong> ARM that Negative amortization loans are by<br />
nature. Higher risk products, such as First Lien Monthly Adjustable loans with Negative<br />
amortization and Home equity l<strong>in</strong>es <strong>of</strong> credit (HELOCs) have different ways <strong>of</strong><br />
structur<strong>in</strong>g the Cap than a typical First Lien Mortgage. <strong>The</strong> typical First Lien Monthly<br />
Adjustable loans with Negative amortization loan has a life cap for the underly<strong>in</strong>g rate<br />
Page 226 <strong>of</strong> 289
(aka "Fully Indexed Rate") between 9.95% and 12% (maximum assessed <strong>in</strong>terest rate).<br />
Some <strong>of</strong> these loans can have much higher rate ceil<strong>in</strong>gs. <strong>The</strong> fully <strong>in</strong>dexed rate is<br />
always listed on the statement, but borrowers are shielded from the full effect <strong>of</strong> rate<br />
<strong>in</strong>creases by the m<strong>in</strong>imum payment, until the loan is recast, which is when pr<strong>in</strong>cipal and<br />
<strong>in</strong>terest payments are due that will fully amortize the loan at the fully <strong>in</strong>dexed rate.<br />
<br />
Home equity l<strong>in</strong>es <strong>of</strong> credit (HELOCs)<br />
S<strong>in</strong>ce HELOCs are <strong>in</strong>tended by banks to primarily sit <strong>in</strong> second lien position, they<br />
normally are only capped by the maximum <strong>in</strong>terest rate allowed by law <strong>in</strong> the state<br />
where<strong>in</strong> they are issued. For example, Florida currently has an 18% cap on <strong>in</strong>terest rate<br />
charges. <strong>The</strong>y are risky to the borrower <strong>in</strong> the sense that they are mostly <strong>in</strong>dexed to the<br />
Wall Street Journal prime rate, which is considered a Spot Index, or a f<strong>in</strong>ancial <strong>in</strong>dicator<br />
that is subject to immediate change (as are the loans based upon the Prime Rate). <strong>The</strong><br />
risk to borrower be<strong>in</strong>g that a f<strong>in</strong>ancial situation caus<strong>in</strong>g the Federal Reserve to raise<br />
rates dramatically (see 1980, 2006) would effect an immediate rise <strong>in</strong> obligation to the<br />
borrower, up to the capped rate.<br />
Popularity<br />
Variable rate mortgages are the most common form <strong>of</strong> loan for house purchase <strong>in</strong> the<br />
United K<strong>in</strong>gdom, Ireland and Canada but are unpopular <strong>in</strong> some other countries such as<br />
Germany. Variable rate mortgages are very common <strong>in</strong> Australia and New Zealand. In<br />
some countries, true fixed-rate mortgages are not available except for shorter-term<br />
loans; <strong>in</strong> Canada, the longest term for which a mortgage rate can be fixed is typically no<br />
more than ten years, while mortgage maturities are commonly 25 years.<br />
In many countries, it is not feasible for banks to lend at fixed rates for very long terms; <strong>in</strong><br />
these cases, the only feasible type <strong>of</strong> mortgage for banks to <strong>of</strong>fer may be adjustable<br />
rate mortgages (barr<strong>in</strong>g some form <strong>of</strong> government <strong>in</strong>tervention). For example, the<br />
mortgage <strong>in</strong>dustry <strong>of</strong> the United K<strong>in</strong>gdom has traditionally been dom<strong>in</strong>ated by build<strong>in</strong>g<br />
Page 227 <strong>of</strong> 289
societies. S<strong>in</strong>ce funds raised by UK build<strong>in</strong>g societies must be at least 50% deposits,<br />
lenders prefer variable-rate mortgages to fixed-rate mortgages to reduce potential<br />
<strong>in</strong>terest rate risks between what they charg<strong>in</strong>g <strong>in</strong> mortgage <strong>in</strong>terest and what they are<br />
pay<strong>in</strong>g <strong>in</strong> <strong>in</strong>terest for deposits and other fund<strong>in</strong>g sources.<br />
Countries where fixed rate loans are the common form <strong>of</strong> loan for a house purchase<br />
usually need to have a specific legal framework <strong>in</strong> place to make this possible. For<br />
example, <strong>in</strong> Germany and Austria the popular Bausparkassen, a type <strong>of</strong> mutual build<strong>in</strong>g<br />
societies, <strong>of</strong>fer long-term fixed rate loans. <strong>The</strong>y are legally separate from banks and<br />
require borrowers to save up a considerable amount, at a rather low fixed <strong>in</strong>terest rate,<br />
before they get their loan; this is done by requir<strong>in</strong>g the future borrower to beg<strong>in</strong> pay<strong>in</strong>g<br />
<strong>in</strong> his fixed monthly payments well before actually gett<strong>in</strong>g the loan. It is generally not<br />
possible to pay this <strong>in</strong> as a lump sum and get the loan right away; it has to be done <strong>in</strong><br />
monthly <strong>in</strong>stallments <strong>of</strong> the same size as what will be paid dur<strong>in</strong>g the payback phase <strong>of</strong><br />
the mortgage. Depend<strong>in</strong>g on whether there are enough savers <strong>in</strong> the system at any<br />
given time, payout <strong>of</strong> a loan may be delayed for some time even when the sav<strong>in</strong>gs<br />
quota has already been met by the would-be borrower. <strong>The</strong> advantage for the borrower<br />
is that the monthly payment is guaranteed never to be <strong>in</strong>creased, and the lifetime <strong>of</strong> the<br />
loan is also fixed <strong>in</strong> advance. <strong>The</strong> disadvantage is that this model, <strong>in</strong> which you have to<br />
start mak<strong>in</strong>g payments several years before actually gett<strong>in</strong>g the loan, is mostly aimed at<br />
once-<strong>in</strong>-a-lifetime home buyers who are able to plan ahead for a long time. That has<br />
become a problem with the generally higher mobility that is demanded <strong>of</strong> workers<br />
nowadays.<br />
For those who plan to move with<strong>in</strong> a relatively short period <strong>of</strong> time (three to seven<br />
years), variable rate mortgages may still be attractive because they <strong>of</strong>ten <strong>in</strong>clude a<br />
lower, fixed rate <strong>of</strong> <strong>in</strong>terest for the first three, five, or seven years <strong>of</strong> the loan, after which<br />
the <strong>in</strong>terest rate fluctuates.<br />
Pric<strong>in</strong>g<br />
Adjustable rate mortgages are typically, but not always, less expensive than fixed-rate<br />
mortgages. Due to the <strong>in</strong>herent <strong>in</strong>terest rate risk, long-term fixed rates will tend to be<br />
higher than short-term rates (which are the basis for variable-rate loans and<br />
mortgages). <strong>The</strong> difference <strong>in</strong> <strong>in</strong>terest rates between short and long-term loans is known<br />
as the yield curve, which generally slopes upward (longer terms are more expensive).<br />
<strong>The</strong> opposite circumstance is known as an <strong>in</strong>verted yield curve and is relatively<br />
<strong>in</strong>frequent.<br />
<strong>The</strong> fact that an adjustable rate mortgage has a lower start<strong>in</strong>g <strong>in</strong>terest rate does not<br />
<strong>in</strong>dicate what the future cost <strong>of</strong> borrow<strong>in</strong>g will be (when rates change). If rates rise, the<br />
cost will be higher; if rates go down, cost will be lower. In effect, the borrower has<br />
agreed to take the <strong>in</strong>terest rate risk.<br />
<strong>The</strong> actual pric<strong>in</strong>g and rate analysis <strong>of</strong> adjustable rate mortgage <strong>in</strong> the f<strong>in</strong>ance <strong>in</strong>dustry<br />
is done through various computer simulation methodologies like Monte Carlo method or<br />
Page 228 <strong>of</strong> 289
Sobol sequences. In these techniques, by us<strong>in</strong>g an assumed probability distribution <strong>of</strong><br />
future <strong>in</strong>terest rates, numerous (10,000–100,000 or even 1,000,000) possible <strong>in</strong>terest<br />
rate scenarios are explored, mortgage cash flows calculated under each, and aggregate<br />
parameters like fair value and effective <strong>in</strong>terest rate over the life <strong>of</strong> the mortgage are<br />
estimated.<br />
Hav<strong>in</strong>g these at hand, lend<strong>in</strong>g analysts determ<strong>in</strong>e whether <strong>of</strong>fer<strong>in</strong>g a particular<br />
mortgage would be pr<strong>of</strong>itable, and if it would represent tolerable risk to the bank.<br />
Prepayment<br />
Adjustable rate mortgages, like other types <strong>of</strong> mortgage, usually allow the borrower to<br />
prepay pr<strong>in</strong>cipal (or capital) early without penalty. Early payments <strong>of</strong> part <strong>of</strong> the pr<strong>in</strong>cipal<br />
will reduce the total cost <strong>of</strong> the loan (total <strong>in</strong>terest paid), but will not shorten the amount<br />
<strong>of</strong> time needed to pay <strong>of</strong>f the loan like other loan types.<br />
Upon each recast<strong>in</strong>g, the new fully <strong>in</strong>dexed <strong>in</strong>terest rate is applied to the rema<strong>in</strong><strong>in</strong>g<br />
pr<strong>in</strong>cipal to end with<strong>in</strong> the rema<strong>in</strong><strong>in</strong>g term schedule.<br />
If a mortgage is ref<strong>in</strong>anced, the borrower simultaneously takes out a new mortgage and<br />
pays <strong>of</strong>f the old mortgage; the latter counts as a prepayment.<br />
Some ARMs charge prepayment penalties <strong>of</strong> several thousand dollars if the borrower<br />
ref<strong>in</strong>ances the loan or pays it <strong>of</strong>f early, especially with<strong>in</strong> the first three or five years <strong>of</strong><br />
the loan.<br />
Page 229 <strong>of</strong> 289
Criticism<br />
Predatory lend<strong>in</strong>g<br />
Adjustable rate mortgages are sometimes sold to consumers who are unlikely to repay<br />
the loan should <strong>in</strong>terest rates rise. In the United States, extreme cases are<br />
characterized by the Consumer Federation <strong>of</strong> America as predatory loans. Protections<br />
aga<strong>in</strong>st <strong>in</strong>terest rate rises <strong>in</strong>clude (a) a possible <strong>in</strong>itial period with a fixed rate (which<br />
gives the borrower a chance to <strong>in</strong>crease his/her annual earn<strong>in</strong>gs before payments rise);<br />
(b) a maximum (cap) that <strong>in</strong>terest rates can rise <strong>in</strong> any year (if there is a cap, it must be<br />
specified <strong>in</strong> the loan document); and (c) a maximum (cap) that <strong>in</strong>terest rates can rise<br />
over the life <strong>of</strong> the mortgage (this also must be specified <strong>in</strong> the loan document).<br />
Interest Rate Errors and Overcharges<br />
In September 1991, the Government Accountability Office (GAO) released a study <strong>of</strong><br />
Adjustable Rate Mortgages <strong>in</strong> the United States which found between 20% and 25% <strong>of</strong><br />
the ARM loans out <strong>of</strong> the estimated 12 million at the time conta<strong>in</strong>ed Interest Rate Errors.<br />
A former federal mortgage bank<strong>in</strong>g auditor estimated these mistakes created at least<br />
<strong>US</strong>$10 billion <strong>in</strong> net overcharges to American home-owners. Such errors occurred when<br />
the related mortgage servicer selected the <strong>in</strong>correct <strong>in</strong>dex date, used an <strong>in</strong>correct<br />
marg<strong>in</strong>, or ignored <strong>in</strong>terest rate change caps.<br />
In July 1994, Consumer Loan Advocates, a non-pr<strong>of</strong>it mortgage audit<strong>in</strong>g firm<br />
announced that as many as 18% <strong>of</strong> Adjustable Rate Mortgages have errors cost<strong>in</strong>g the<br />
borrower more than $5,000 <strong>in</strong> <strong>in</strong>terest overcharges.<br />
In December 1995, a government study concluded that 50–60% <strong>of</strong> all Adjustable Rate<br />
Mortgages <strong>in</strong> the United States conta<strong>in</strong> an error regard<strong>in</strong>g the variable <strong>in</strong>terest rate<br />
charged to the homeowner. [11] <strong>The</strong> study estimated the total amount <strong>of</strong> <strong>in</strong>terest<br />
overcharged to borrowers was <strong>in</strong> excess <strong>of</strong> $8 billion. Inadequate computer programs,<br />
<strong>in</strong>correct completion <strong>of</strong> documents and calculation errors were cited as the major<br />
causes <strong>of</strong> <strong>in</strong>terest rate overcharges. No other government studies have been conducted<br />
<strong>in</strong>to ARM <strong>in</strong>terest overcharges.<br />
History<br />
TITLE VIII, ALTERNATIVE MORTGAGE TRANSACTIONS, Garn–St. Germa<strong>in</strong><br />
Depository Institutions Act <strong>of</strong> 1982 allowed Adjustable rate mortgages.<br />
ARM <strong>in</strong> S<strong>in</strong>gapore<br />
In S<strong>in</strong>gapore, ARM is commonly known as float<strong>in</strong>g rate or variable rate mortgage.<br />
Unlike fixed-rate mortgage <strong>in</strong> the country, a float<strong>in</strong>g rate mortgage has its <strong>in</strong>terest rate<br />
vary<strong>in</strong>g dur<strong>in</strong>g the entire duration <strong>of</strong> the loan. <strong>The</strong>se loans can be pegged to the<br />
Page 230 <strong>of</strong> 289
ank board rate,<br />
SIBOR, or<br />
SOR<br />
Typically the structure <strong>of</strong> the <strong>in</strong>terest rate <strong>of</strong> the mortgage is as follow<br />
First Year<br />
Period<br />
Second Year<br />
Interest Rate (p.a.)<br />
0.75% + 1-Month SIBOR<br />
0.75% + 1-Month SIBOR<br />
Third Year<br />
1.00% + 1-Month SIBOR<br />
Fourth Year Onwards 1.25% + 1-Month SIBOR<br />
<strong>The</strong> loan can be pegged to SIBOR or SOR <strong>of</strong> any duration, and a spread (marg<strong>in</strong>) is<br />
tacked to the X-month SIBOR/SOR. <strong>The</strong> spread is usually adjusted upwards after the<br />
first few years.<br />
Between SIBOR, SOR and the board rate, SIBOR-pegged ARMs are the most popular.<br />
However, recently, ANZ <strong>in</strong>troduced an ARM that is pegged to the average <strong>of</strong> SIBOR<br />
and SOR. Till date, it is the only bank <strong>in</strong> S<strong>in</strong>gapore to <strong>of</strong>fer such a mortgage.<br />
Mortgage Loan<br />
F<strong>in</strong>ancial literacy<br />
Interest<br />
rate type<br />
Repayment<br />
type<br />
<br />
<br />
<br />
<br />
<br />
<br />
<br />
fixed-rate mortgage<br />
adjustable-rate mortgage / variable-rate / float<strong>in</strong>g rate<br />
Cont<strong>in</strong>uous: Repayment mortgage / self-amortized<br />
Repayment at term: <strong>in</strong>terest-only mortgage (endowment mortgage)<br />
No repayment: reverse mortgage<br />
Hybrid: balloon payment mortgage<br />
equity release (shared appreciation mortgage)<br />
Variable<br />
payment<br />
Other<br />
variations<br />
<br />
<br />
<br />
<br />
<br />
<br />
flexible mortgage (<strong>of</strong>fset mortgage, mortgage accelerator)<br />
graduated payment mortgage loan<br />
buy to let mortgage<br />
foreign currency mortgage<br />
foreign national mortgage<br />
wraparound mortgage<br />
Key Annual percentage rate (APR)<br />
Page 231 <strong>of</strong> 289
concepts Foreclosure / Repossession<br />
<br />
<br />
<br />
<br />
<br />
Introductory rate<br />
Teaser rate<br />
VA loan<br />
United States hous<strong>in</strong>g bubble<br />
<strong>US</strong> mortgage term<strong>in</strong>ology<br />
______<br />
Mortgage Calculator<br />
How to Calculate Mortgage Loan Payments, Amortization Schedules<br />
(Tables) by Hand or Computer Programm<strong>in</strong>g<br />
First you must def<strong>in</strong>e some variables to make it easier to set up:<br />
P = pr<strong>in</strong>cipal, the <strong>in</strong>itial amount <strong>of</strong> the loan<br />
I = the annual <strong>in</strong>terest rate (from 1 to 100 percent)<br />
L = length, the length (<strong>in</strong> years) <strong>of</strong> the loan, or at least the length over which the loan<br />
is amortized.<br />
<strong>The</strong> follow<strong>in</strong>g assumes a typical conventional loan where the <strong>in</strong>terest is compounded<br />
monthly.<br />
First I will def<strong>in</strong>e two more variables to make the calculations easier:<br />
J = monthly <strong>in</strong>terest <strong>in</strong> decimal form = I / (12 x 100)<br />
N = number <strong>of</strong> months over which loan is amortized = L x 12<br />
Okay now for the big monthly payment (M) formula, it is:<br />
J<br />
M = P x ------------------------<br />
1 - ( 1 + J ) ^ -N<br />
where 1 is the number one<br />
(it does not appear too clearly on some browsers)<br />
So to calculate it, you would first calculate 1 + J then take that to the -N (m<strong>in</strong>us N)<br />
power, subtract that from the number 1. Now take the <strong>in</strong>verse <strong>of</strong> that (if you have a 1/X<br />
button on your calculator push that). <strong>The</strong>n multiply the result times J and then times P.<br />
Sorry, for the long way <strong>of</strong> expla<strong>in</strong><strong>in</strong>g it, but I just wanted to be clear for everybody.<br />
Page 232 <strong>of</strong> 289
<strong>The</strong> one-l<strong>in</strong>er for a program would be (adjust for your favorite language):<br />
M = P * (J/(1-(1+J) ** -N))<br />
So now you should be able to calculate the monthly payment, M. To calculate the<br />
amortization table you need to do some iteration (i.e. a simple loop). I will tell you the<br />
simple steps :<br />
Step 1: Calculate H = P x J, this is your current monthly <strong>in</strong>terest<br />
Step 2: Calculate C = M - H, this is your monthly payment m<strong>in</strong>us your monthly <strong>in</strong>terest,<br />
so it is the amount <strong>of</strong> pr<strong>in</strong>cipal you pay for that month<br />
Step 3: Calculate Q = P - C, this is the new balance <strong>of</strong> your pr<strong>in</strong>cipal <strong>of</strong> your loan.<br />
Step 4: Set P equal to Q and go back to Step 1: You thusly loop around until the value<br />
Q (and hence P)<br />
goes to zero.<br />
Programmers will see how this makes a trivial little loop to code, but I have found that<br />
many people now surf<strong>in</strong>g on the Internet are NOT programmers and still want to<br />
calculate their mortgages! So this page was dedicated more to the latter. If you have<br />
any further questions you can contact me for more <strong>in</strong>fo.<br />
F<strong>in</strong>d<strong>in</strong>g the Number <strong>of</strong> Periods given a Payment, Interest and Loan<br />
Amount<br />
This formula previously was not explicit enough!! <strong>The</strong> 1/q factor <strong>in</strong> there was to<br />
convert the number <strong>of</strong> periods <strong>in</strong>to years. For number <strong>of</strong> payments this must<br />
actually be left out.<br />
Many people have asked me how to f<strong>in</strong>d N (number <strong>of</strong> payments) given the payment,<br />
<strong>in</strong>terest and loan amount. I didn't know the answer and <strong>in</strong> my calculators I f<strong>in</strong>d it by<br />
do<strong>in</strong>g a b<strong>in</strong>ary search over the payment formula above. However, Gary R. Walo (<br />
nenonen5@southeast.net) found the answer to the actual formula <strong>in</strong> the book: <strong>The</strong> Vest<br />
Pocket Real Estate Advisor by Mart<strong>in</strong> Miles (Prentice Hall).<br />
Here is the corrected formula:<br />
n = - (LN(1-(B/m)*(r/q)))/LN(1+(r/q))<br />
# years = - 1/q * (LN(1-(B/m)*(r/q)))/LN(1+(r/q))<br />
Where:<br />
<br />
<br />
<br />
q = amount <strong>of</strong> annual payment periods<br />
r = <strong>in</strong>terest rate<br />
B = pr<strong>in</strong>cipal<br />
Page 233 <strong>of</strong> 289
m = payment amount<br />
n = amount payment periods<br />
LN = natural logarithm<br />
For F<strong>in</strong>d<strong>in</strong>g Rema<strong>in</strong><strong>in</strong>g Pr<strong>in</strong>cipal Balance<br />
<strong>The</strong> follow<strong>in</strong>g formula will calculate your rema<strong>in</strong><strong>in</strong>g balance if you have made t <strong>of</strong> N<br />
fixed payments <strong>in</strong> a timely basis (i.e. by the due date) so that no additional <strong>in</strong>terest has<br />
accrued.<br />
where:<br />
P = P*(1 -((1 + J)**t - 1)/((1 + J)**N - 1))<br />
P = pr<strong>in</strong>cipal, the <strong>in</strong>itial amount <strong>of</strong> the loan<br />
I = the annual <strong>in</strong>terest rate (from 1 to 100 percent)<br />
L = length, the length (<strong>in</strong> years) <strong>of</strong> the loan, or at least the length over which the<br />
loan is amortized.<br />
J = monthly <strong>in</strong>terest <strong>in</strong> decimal form = I / (12 x 100)<br />
N = number <strong>of</strong> months over which loan is amortized = L x 12<br />
t=number <strong>of</strong> paid monthly loan payments<br />
This is from Mortgage Backed Securities by William W Barlett and was sent to me by<br />
Victor Kheyfets.<br />
If you would like to calculate an outstand<strong>in</strong>g loan balance but have not made regular<br />
fixed payments by the due date, you will have to fill out an accurate payment schedule<br />
with<strong>in</strong> a spreadsheet, or similar application where you can account for miss<strong>in</strong>g and<br />
different payments.<br />
F<strong>in</strong>d<strong>in</strong>g the Interest Rate Given Loan Amount, Payment and Number<br />
<strong>of</strong> Periods<br />
Many folks have asked me for a simple formula to calculate the <strong>in</strong>terest rate give the<br />
other three terms (loan amount, payment and # <strong>of</strong> periods). I can calculate the number<br />
easily enough, but I have no idea if there is a simple formula to do it or not. I do it the<br />
good old fashioned way -- plug and chug! Luckily, a computer program makes "plug and<br />
chug" trivial and speedy with a simple b<strong>in</strong>ary search:<br />
m<strong>in</strong>_rate = 0; max_rate = 100; # Set Maximum and m<strong>in</strong>imum rate<br />
while (m<strong>in</strong>_rate < max_rate - 0.0001)<br />
{<br />
mid_rate = (m<strong>in</strong>_rate + max_rate) / 2; # Divide by 2<br />
J = mid_rate / 1200; # Convert to monthly decimal<br />
# calculate payment from <strong>in</strong>terest, term and loan_amt<br />
guessed_pmt = loan_amt * ( J / (1 - (1 + J) ** -N ));<br />
Page 234 <strong>of</strong> 289
if (guessed_pmt > actual_payment)<br />
{<br />
max_rate = mid_rate; # current rate is new maximum<br />
}<br />
else<br />
{<br />
m<strong>in</strong>_rate = mid_rate; # current rate is new m<strong>in</strong>imum<br />
}<br />
}<br />
pr<strong>in</strong>t " <strong>The</strong> Rate is ", mid_rate;<br />
On any modern computer this runs pretty much <strong>in</strong>stantaneously.<br />
Canadian Formula<br />
Canadian mortgages are compounded semi-annually <strong>in</strong>stead <strong>of</strong> monthly like<br />
<strong>US</strong> mortgages.<br />
Monthly Pmt =<br />
(P*(((1+i/200)^(1/6)-1))/(1-(((1+i/200)^(1/6)))^-(n*12)))<br />
Where:<br />
P = pr<strong>in</strong>cipal outstand<strong>in</strong>g<br />
i = annual <strong>in</strong>terest rate percentage<br />
n = number <strong>of</strong> years<br />
Here is a easier to read representation:<br />
i 1/6<br />
( 1 + --- ) - 1<br />
200<br />
Pmt = Pr<strong>in</strong>cipal x ------------------------<br />
i 1/6 -12 x n<br />
1 - [ (1 + --- ) ]<br />
200<br />
Or to convert canadian <strong>in</strong>terest rates to <strong>US</strong> <strong>in</strong>terest rates:<br />
Can. Rate 1/6<br />
<strong>US</strong> Rate = 1200 x [ ( 1 + --------- ) - 1 ]<br />
200<br />
or as a formula, <strong>US</strong> Rate = 1200 * ((1 + Can.Rate/200)^(1/6) - 1)<br />
You'll note if you plug this <strong>in</strong>to the <strong>US</strong> formula you get the above formula for payment.<br />
Page 235 <strong>of</strong> 289
3. Creditworth<strong>in</strong>ess Is <strong>of</strong> No Consequence<br />
- Def<strong>in</strong>ed<br />
An assessment <strong>of</strong> the likelihood that a borrower will default on his or her debt<br />
obligations. It is based upon factors, such as his/her history <strong>of</strong> repayment and credit<br />
score. Lend<strong>in</strong>g <strong>in</strong>stitutions also consider the availability <strong>of</strong> assets and extent <strong>of</strong> liabilities<br />
to determ<strong>in</strong>e the probability <strong>of</strong> default.<br />
- Investopedia<br />
______<br />
A credit rat<strong>in</strong>g is an evaluation <strong>of</strong> the credit worth<strong>in</strong>ess <strong>of</strong> a debtor, especially a<br />
bus<strong>in</strong>ess (company) or a government, but not <strong>in</strong>dividual consumers. <strong>The</strong> evaluation is<br />
made by a credit rat<strong>in</strong>g agency <strong>of</strong> the debtor's ability to pay back the debt and the<br />
likelihood <strong>of</strong> default. Evaluations <strong>of</strong> <strong>in</strong>dividuals' credit worth<strong>in</strong>ess are known as credit<br />
report<strong>in</strong>g and done by credit bureaus, or consumer credit report<strong>in</strong>g agencies, which<br />
issue credit scores.<br />
Page 236 <strong>of</strong> 289
Credit rat<strong>in</strong>gs are determ<strong>in</strong>ed by credit rat<strong>in</strong>gs agencies. <strong>The</strong> credit rat<strong>in</strong>g represents<br />
the credit rat<strong>in</strong>g agency's evaluation <strong>of</strong> qualitative and quantitative <strong>in</strong>formation for a<br />
company or government; <strong>in</strong>clud<strong>in</strong>g non-public <strong>in</strong>formation obta<strong>in</strong>ed by the credit rat<strong>in</strong>g<br />
agencies' analysts.<br />
<strong>The</strong> credit rat<strong>in</strong>g is used by <strong>in</strong>dividuals and entities that purchase the bonds issued by<br />
companies and governments to determ<strong>in</strong>e the likelihood that the government will pay its<br />
bond obligations.<br />
A poor credit rat<strong>in</strong>g <strong>in</strong>dicates a credit rat<strong>in</strong>g agency's op<strong>in</strong>ion that the company or<br />
government has a high risk <strong>of</strong> default<strong>in</strong>g, based on the agency's analysis <strong>of</strong> the entity's<br />
history and analysis <strong>of</strong> long term economic prospects.<br />
Sovereign credit rat<strong>in</strong>gs<br />
A sovereign credit rat<strong>in</strong>g is the credit rat<strong>in</strong>g <strong>of</strong> a sovereign entity, i.e., a national<br />
government. <strong>The</strong> sovereign credit rat<strong>in</strong>g <strong>in</strong>dicates the risk level <strong>of</strong> the <strong>in</strong>vest<strong>in</strong>g<br />
environment <strong>of</strong> a country and is used by <strong>in</strong>vestors look<strong>in</strong>g to <strong>in</strong>vest abroad. It takes<br />
political risk <strong>in</strong>to account.<br />
Source: Euromoney Country Risk<br />
Country Risk Rank<strong>in</strong>gs (January 2013)<br />
Least risky countries, Score out <strong>of</strong> 100 Previous Country Overall score<br />
Rank<br />
1 1 Norway 89.87<br />
2 3 Luxembourg 87.29<br />
3 4 S<strong>in</strong>gapore 86.81<br />
4 5 Sweden 86.81<br />
5 2 Switzerland 86.78<br />
6 6 F<strong>in</strong>land 84.54<br />
7 7 Denmark 82.64<br />
8 9 Hong Kong 82.43<br />
9 8 Netherlands 81.82<br />
10 8 Canada 81.82<br />
<strong>The</strong> "country risk rank<strong>in</strong>gs" table shows the ten least-risky countries for <strong>in</strong>vestment as <strong>of</strong><br />
January 2013. Rat<strong>in</strong>gs are further broken down <strong>in</strong>to components <strong>in</strong>clud<strong>in</strong>g political risk,<br />
economic risk. Euromoney's bi-annual country risk <strong>in</strong>dex monitors the political and<br />
economic stability <strong>of</strong> 185 sovereign countries. Results focus foremost on economics,<br />
specifically sovereign default risk and/or payment default risk for exporters (a.k.a. "trade<br />
credit" risk).<br />
Page 237 <strong>of</strong> 289
A. M. Best def<strong>in</strong>es "country risk" as the risk that country-specific factors could adversely<br />
affect an <strong>in</strong>surer's ability to meet its f<strong>in</strong>ancial obligations.<br />
Short-Term Rat<strong>in</strong>g<br />
A short-term rat<strong>in</strong>g is a probability factor <strong>of</strong> an <strong>in</strong>dividual go<strong>in</strong>g <strong>in</strong>to default with<strong>in</strong> a year.<br />
This is <strong>in</strong> contrast to long-term rat<strong>in</strong>g which is evaluated over a long timeframe. In the<br />
past <strong>in</strong>stitutional <strong>in</strong>vestors preferred to consider long-term rat<strong>in</strong>gs. Nowadays, shortterm<br />
rat<strong>in</strong>gs are commonly used.<br />
First, the Basel II agreement requires banks to report their one-year rose if they applied<br />
<strong>in</strong>ternal-rat<strong>in</strong>gs-based approach for capital requirements. Second, many <strong>in</strong>stitutional<br />
<strong>in</strong>vestors can easily manage their credit/bond portfolios with derivatives on monthly or<br />
quarterly basis. <strong>The</strong>refore, some rat<strong>in</strong>g agencies simply report short-term rat<strong>in</strong>gs.<br />
Corporate credit rat<strong>in</strong>gs<br />
Credit rat<strong>in</strong>gs that concern corporations are usually <strong>of</strong> a corporation's f<strong>in</strong>ancial<br />
<strong>in</strong>struments i.e. debt security such as a bond, but corporations themselves are also<br />
sometimes rated. Rat<strong>in</strong>gs are assigned by credit rat<strong>in</strong>g agencies, the largest <strong>of</strong> which<br />
are Standard & Poor's, Moody's and Fitch Rat<strong>in</strong>gs. <strong>The</strong>y use letter designations such as<br />
A, B, C. Higher grades are <strong>in</strong>tended to represent a lower probability <strong>of</strong> default.<br />
Agencies do not attach a hard number <strong>of</strong> probability <strong>of</strong> default to each grade, preferr<strong>in</strong>g<br />
descriptive def<strong>in</strong>itions such as: "the obligor's capacity to meet its f<strong>in</strong>ancial commitment<br />
on the obligation is extremely strong," or "less vulnerable to non-payment than other<br />
speculative issues ..." (Standard and Poors' def<strong>in</strong>ition <strong>of</strong> a AAA rated and a BB rated<br />
bond respectively). However, some studies have estimated the average risk and reward<br />
<strong>of</strong> bonds by rat<strong>in</strong>g. One study by a rat<strong>in</strong>g service (Moody's) claimed that over a "5-year<br />
time horizon" bonds it gave its highest rat<strong>in</strong>g (Aaa) to had a "cumulative default rate" <strong>of</strong><br />
just 0.18%, the next highest (Aa2) 0.28%, the next (Baa2) 2.11%, 8.82% for the next<br />
(Ba2), and 31.24% for the lowest it studied (B2). (See "Default rate" <strong>in</strong> "Estimated<br />
spreads and default rates by rat<strong>in</strong>g grade" table to right.) Over a longer time horizon it<br />
stated "the order is by and large, but not exactly, preserved".<br />
Estimated Spreads And<br />
Default Rates by Rat<strong>in</strong>g Grade<br />
Rat<strong>in</strong>g<br />
Basis<br />
Po<strong>in</strong>t<br />
Spread<br />
Default<br />
Rate<br />
AAA/Aaa 43 0.18%<br />
AA/Aa2 73 0.28%<br />
A 99 n/a<br />
BBB/Baa2 166 2.11%<br />
Page 238 <strong>of</strong> 289
BB/Ba2 299 8.82%<br />
B/B2 404 31.24%<br />
CCC 724 n/a<br />
Sources: Basis spread from<br />
Federal Reserve Bank <strong>of</strong><br />
New York Quarterly Review,<br />
Summer-Fall 1994";<br />
Default rate from study<br />
by Moody's <strong>in</strong>vestment service<br />
Another study <strong>in</strong> Journal <strong>of</strong> F<strong>in</strong>ance calculated the additional <strong>in</strong>terest rate or "spread"<br />
corporate bonds pay over that <strong>of</strong> "riskless" <strong>US</strong> Treasury bonds, accord<strong>in</strong>g to the bonds<br />
rat<strong>in</strong>g. (See "Basis po<strong>in</strong>t spread" <strong>in</strong> table to right.) Look<strong>in</strong>g at rated bonds from 1973–<br />
89, the authors found a AAA rated bond paid only 43 "basis po<strong>in</strong>ts" (or 43/100th <strong>of</strong> a<br />
percentage po<strong>in</strong>t) over a Treasury bond (so that it would yield 3.43% if the Treasury<br />
yielded 3.00%). A CCC-rated "junk" (or speculative) bond on the other hand, paid over<br />
4% (404 basis po<strong>in</strong>ts) more than a Treasury on average over that period.<br />
Different rat<strong>in</strong>g agencies may use variations <strong>of</strong> an alphabetical comb<strong>in</strong>ation <strong>of</strong> lower and<br />
upper case letters, with either plus or m<strong>in</strong>us signs or numbers added to further f<strong>in</strong>e tune<br />
the rat<strong>in</strong>g (see colored chart). <strong>The</strong> Standard & Poor's rat<strong>in</strong>g scale uses upper case<br />
letters and pluses and m<strong>in</strong>uses. <strong>The</strong> Moody's rat<strong>in</strong>g system uses numbers and lower<br />
case letters as well as upper case.<br />
While Moody's, S&P and Fitch Rat<strong>in</strong>gs control approximately 95% <strong>of</strong> the credit rat<strong>in</strong>gs<br />
bus<strong>in</strong>ess, they are not the only rat<strong>in</strong>g agencies. DBRS's long-term rat<strong>in</strong>gs scale is<br />
somewhat similar to Standard & Poor's and Fitch Rat<strong>in</strong>gs with the words high and low<br />
replac<strong>in</strong>g the + and −. It goes as follows, from excellent to poor: AAA, AA(high), AA,<br />
AA(low), A(high), A, A(low), BBB(high), BBB, BBB(low), BB(high), BB, BB(low), B(high),<br />
B, B(low), CCC(high), CCC, CCC(low), CC(high), CC, CC(low), C(high), C, C(low) and<br />
D. <strong>The</strong> short-term rat<strong>in</strong>gs <strong>of</strong>ten maps to long-term rat<strong>in</strong>gs though there is room for<br />
exceptions at the high or low side <strong>of</strong> each equivalent.<br />
S&P, Moody's, Fitch and DBRS are the only four rat<strong>in</strong>gs agencies that are recognized<br />
by the European Central Bank for the purposes <strong>of</strong> determ<strong>in</strong><strong>in</strong>g collateral requirements<br />
for banks to borrow from the central bank. <strong>The</strong> ECB uses a first, best rule among the<br />
four agencies that have the designated ECAI status. That means that it takes the<br />
highest rat<strong>in</strong>g among the four - S&P, Moody's, Fitch and DBRS - to determ<strong>in</strong>e haircuts<br />
and collateral requirements for borrow<strong>in</strong>g. Rat<strong>in</strong>gs <strong>in</strong> Europe have been under close<br />
scrut<strong>in</strong>y, particularly the highest rat<strong>in</strong>gs given to countries like Spa<strong>in</strong>, Ireland and Italy<br />
because it affects how much banks can borrow aga<strong>in</strong>st sovereign debt they hold.<br />
A. M. Best rates from excellent to poor <strong>in</strong> the follow<strong>in</strong>g manner: A++, A+, A, A−, B++,<br />
B+, B, B−, C++, C+, C, C−, D, E, F, and S. <strong>The</strong> CTRISKS rat<strong>in</strong>g system is as follows:<br />
CT3A, CT2A, CT1A, CT3B, CT2B, CT1B, CT3C, CT2C and CT1C. All these CTRISKS<br />
grades are mapped to one-year probability <strong>of</strong> default.<br />
Page 239 <strong>of</strong> 289
Moody's S&P Fitch<br />
Longterm<br />
Shortterm<br />
Longterm<br />
Shortterm<br />
Longterm<br />
Shortterm<br />
rat<strong>in</strong>g description<br />
Aaa<br />
AAA<br />
AAA<br />
Prime<br />
Aa1 AA+ AA+<br />
A-1+<br />
F1+<br />
Aa2 AA AA<br />
P-1<br />
Aa3 AA− AA−<br />
High grade<br />
A1 A+<br />
A+<br />
A-1<br />
F1 Upper medium<br />
A2 A A<br />
grade<br />
A3<br />
A−<br />
A−<br />
P-2<br />
F2<br />
Baa1 BBB+ A-2 BBB+<br />
Lower medium<br />
Baa2<br />
BBB<br />
BBB<br />
P-3<br />
F3<br />
grade<br />
Baa3 BBB− A-3 BBB−<br />
Ba1<br />
BB+<br />
BB+<br />
Non-<strong>in</strong>vestment<br />
Ba2 BB BB<br />
grade<br />
Ba3 BB− BB−<br />
speculative<br />
B<br />
B<br />
B1 B+ B+<br />
B2 B B<br />
Highly speculative<br />
B3 B− B−<br />
Caa1<br />
CCC+<br />
CCC+<br />
Caa2 Not Prime CCC CCC<br />
Substantial risks<br />
Caa3 CCC− CCC−<br />
C<br />
C<br />
Extremely<br />
CC<br />
CC<br />
Ca<br />
speculative<br />
C C Default imm<strong>in</strong>ent<br />
C<br />
RD<br />
DDD<br />
/ SD D DD D In default<br />
/ D D<br />
Credit Rat<strong>in</strong>g Agencies<br />
In addition to "the Big Three" <strong>of</strong> Moody's, Standard & Poor's, and Fitch Rat<strong>in</strong>gs, other<br />
agencies and rat<strong>in</strong>g companies <strong>in</strong>clude (<strong>in</strong> alphabetical order):<br />
Agusto & Co. (Nigeria), A. M. Best (U.S.), Ch<strong>in</strong>a Chengx<strong>in</strong> Credit Rat<strong>in</strong>g Group (Ch<strong>in</strong>a),<br />
Shanghai Brilliance Credit Rat<strong>in</strong>g & Investors Service Co.,Ltd (Ch<strong>in</strong>a), Credit Rat<strong>in</strong>g<br />
Agency Ltd (Zambia), Credit Rat<strong>in</strong>g Information and Services Limited (Bangladesh),<br />
CTRISKS (Hong Kong), Dagong Europe Credit Rat<strong>in</strong>g (Italy), DBRS (Canada), Dun &<br />
Bradstreet (U.S.), Egan-Jones Rat<strong>in</strong>g Company (U.S.), Global Credit Rat<strong>in</strong>gs Co.<br />
(South Africa), HR Rat<strong>in</strong>gs (Mexico), PACRA Limited (Pakistan) ICRA Limited (India),<br />
Page 240 <strong>of</strong> 289
Japan Credit Rat<strong>in</strong>g Agency (Japan), Lev<strong>in</strong> and Goldste<strong>in</strong> (Zambia), Morn<strong>in</strong>gstar, Inc.<br />
(U.S.), Muros Rat<strong>in</strong>gs (Russia, alternative rat<strong>in</strong>g company), Public Sector Credit<br />
Solutions (U.S., not-for pr<strong>of</strong>it rat<strong>in</strong>g provider), Rapid Rat<strong>in</strong>gs International [26] (U.S.),<br />
RusRat<strong>in</strong>g (Russia), Universal Credit Rat<strong>in</strong>g Group (Hong Kong), Veda (Australia,<br />
previously known as Baycorp Advantage), Wikirat<strong>in</strong>g (Switzerland, alternative rat<strong>in</strong>g<br />
organization), Humphreys Ltd (Chile, previously known as Moody´s Partner <strong>in</strong> Chile),<br />
Credit Research Initiative (S<strong>in</strong>gapore, non-pr<strong>of</strong>it rat<strong>in</strong>g provider).<br />
4. Next We Review Each Partner’s Percentage <strong>of</strong> Income,<br />
and, as Determ<strong>in</strong>ed by National/ International Averages,<br />
We Determ<strong>in</strong>es the Percentage <strong>of</strong> Payment for Each<br />
Partner<br />
<strong>The</strong> Twenty-Eight Percent (28 %) Threshold<br />
<strong>The</strong>refore, the bank th<strong>in</strong>ks you can devote up to 28 percent <strong>of</strong> your household <strong>in</strong>come<br />
to your mortgage payment and expenses (<strong>in</strong>clud<strong>in</strong>g taxes, <strong>in</strong>surance and association<br />
dues). Banks will also typically allow a total debt-to-<strong>in</strong>come ratio <strong>of</strong> up to around 36<br />
percent.<br />
______<br />
Mortgages: How Much Can You Afford?<br />
By James E. McWh<strong>in</strong>ney<br />
Regardless <strong>of</strong> where you live, how much you earn or what type <strong>of</strong> house you are<br />
shopp<strong>in</strong>g for, as soon as you f<strong>in</strong>d out how much the seller is ask<strong>in</strong>g, your first reaction<br />
might be someth<strong>in</strong>g like, "Wow! That's expensive!" Your <strong>in</strong>itial assessment is correct.<br />
With prices ris<strong>in</strong>g quickly, particularly <strong>in</strong> areas like New York and Boston, even starter<br />
homes can carry hefty six-figure price tags. Your next reaction is likely to be, "Can I<br />
afford that?"<br />
Generally speak<strong>in</strong>g, most prospective homeowners can afford to mortgage a property<br />
that costs between 2 and 2.5 times their gross <strong>in</strong>come. Under this formula, a person<br />
earn<strong>in</strong>g $100,000 per year can afford to mortgage between $200,000 and $250,000.<br />
But this calculation is only a general guidel<strong>in</strong>e.<br />
Ultimately, when decid<strong>in</strong>g on a property, you need to consider a few more factors. First,<br />
it's a good idea to have an understand<strong>in</strong>g <strong>of</strong> what your lender th<strong>in</strong>ks you can afford – to<br />
ga<strong>in</strong> a precise idea <strong>of</strong> what size <strong>of</strong> mortgage their clients can handle, lenders use<br />
formulas that are much more complex and thorough. Secondly, you need to determ<strong>in</strong>e<br />
some personal criteria by evaluat<strong>in</strong>g not only your f<strong>in</strong>ances but also your preferences.<br />
Page 241 <strong>of</strong> 289
Lender's Criteria: Debt-to-Income Ratios<br />
From a lender's perspective, your ability to purchase a home depends largely on the<br />
follow<strong>in</strong>g factors:<br />
Front-End Ratio. <strong>The</strong> front-end ratio is the percentage <strong>of</strong> your yearly gross <strong>in</strong>come<br />
dedicated toward pay<strong>in</strong>g your mortgage each month. Your mortgage payment consists<br />
<strong>of</strong> four components: pr<strong>in</strong>cipal, <strong>in</strong>terest, taxes and <strong>in</strong>surance (<strong>of</strong>ten collectively referred<br />
to as PITI) (see Understand<strong>in</strong>g <strong>The</strong> Mortgage Payment Structure). A good rule <strong>of</strong> thumb<br />
is that PITI should not exceed 28% <strong>of</strong> your gross <strong>in</strong>come. However, many lenders let<br />
borrowers exceed 30%, and some even let borrowers exceed 40%.<br />
Back-End Ratio. <strong>The</strong> back-end ratio, also known as the debt-to-<strong>in</strong>come ratio (DTI),<br />
calculates the percentage <strong>of</strong> your gross <strong>in</strong>come required to cover your debts. Debts<br />
<strong>in</strong>clude your mortgage, credit card payments, child support and other loan payments.<br />
Most lenders recommend that your DTI does not exceed 36% <strong>of</strong> your gross <strong>in</strong>come. To<br />
calculate your<br />
maximum<br />
monthly debt<br />
based on this<br />
ratio, multiply<br />
your gross<br />
<strong>in</strong>come by<br />
0.36 and<br />
divide by 12.<br />
For example,<br />
if you earn<br />
$100,000 per<br />
year, your<br />
maximum<br />
monthly debt<br />
expenses<br />
should not<br />
exceed<br />
$3,000.<br />
Down<br />
Payment. A<br />
down payment <strong>of</strong> at least 20% <strong>of</strong> the purchase price <strong>of</strong> the home m<strong>in</strong>imizes <strong>in</strong>surance<br />
requirements, but many lenders let buyers purchase a home with significantly smaller<br />
down payments. <strong>The</strong> down payment has a direct impact on your mortgage payment,<br />
and, therefore, also on both the front-end and back-end ratios. Larger down payments<br />
enable buyers to purchase more expensive homes.<br />
Page 242 <strong>of</strong> 289
Be<strong>in</strong>g House Poor: a Personal Decision<br />
To be 'house poor' means that the costs <strong>of</strong> pay<strong>in</strong>g for, and ma<strong>in</strong>ta<strong>in</strong><strong>in</strong>g, your home take<br />
up such a large percentage <strong>of</strong> your <strong>in</strong>come that you don't have enough money left to<br />
cover other expenses. As grim as that sounds, many people choose to be 'house poor'<br />
because they believe that it's wise to purchase the most expensive home that they can<br />
afford, regardless <strong>of</strong> how far they have to stretch. <strong>The</strong>ir theory is that, over time, their<br />
<strong>in</strong>come will <strong>in</strong>crease as a result <strong>of</strong> raises and promotions, mak<strong>in</strong>g that expensive<br />
mortgage a smaller and smaller percentage <strong>of</strong> their monthly expenses.<br />
Clearly, those who choose to be 'house poor' have their own set personal criteria<br />
determ<strong>in</strong><strong>in</strong>g what k<strong>in</strong>d <strong>of</strong> home they can afford. (To learn more about the home costs,<br />
Personal Criteria<br />
<strong>The</strong> decision <strong>of</strong> whether or not to be 'house poor' is largely a matter <strong>of</strong> personal choice<br />
– s<strong>in</strong>ce gett<strong>in</strong>g approved for a mortgage doesn't mean that you can actually afford the<br />
payments. So, <strong>in</strong> addition to the lender's criteria, consider the follow<strong>in</strong>g issues and set<br />
some decisive factors <strong>of</strong> your own:<br />
Income. When contemplat<strong>in</strong>g your ability to pay a mortgage, ask yourself the follow<strong>in</strong>g<br />
questions: Are you rely<strong>in</strong>g on two <strong>in</strong>comes just to pay the bills? Is your job stable? Can<br />
you easily f<strong>in</strong>d another job that pays the same, or better, wages if you should lose your<br />
current job?Expenses <strong>The</strong> calculation <strong>of</strong> your back-end-ratio will <strong>in</strong>clude most <strong>of</strong> your<br />
current debt expenses, but what about other expenses that you haven't generated yet?<br />
Will you have kids <strong>in</strong> college someday? Do you have plans to buy a new car, truck or<br />
boat? Does your family enjoy a yearly vacation?<br />
Lifestyle. Are you will<strong>in</strong>g to change your lifestyle to get the house you want? If fewer<br />
trips to the mall and a little tighten<strong>in</strong>g <strong>of</strong> the budget doesn't bother you, apply<strong>in</strong>g a higher<br />
back-end-ratio might work out f<strong>in</strong>e. If you can't live without that double mocha<br />
cappucc<strong>in</strong>o every morn<strong>in</strong>g, you might want to play it safe, and take a more conservative<br />
approach to that mortgage payment.<br />
Personality. No two people have the same personality, regardless <strong>of</strong> their <strong>in</strong>come.<br />
Some people can sleep soundly at night know<strong>in</strong>g that they owe $5,000 per month for<br />
the next 30 years, while others fret over a payment half that size. <strong>The</strong> prospect <strong>of</strong><br />
ref<strong>in</strong>anc<strong>in</strong>g the house <strong>in</strong> order to afford payments on a new car would drive some<br />
people crazy while not worry<strong>in</strong>g others at all. If you keep your personality <strong>in</strong> m<strong>in</strong>d when<br />
shopp<strong>in</strong>g for a new house, you are likely to be pleased with your purchase.<br />
Beyond the Mortgage<br />
Buy<strong>in</strong>g a new home is an excit<strong>in</strong>g adventure. But many prospective homeowners,<br />
caught up <strong>in</strong> the thrill <strong>of</strong> search<strong>in</strong>g for their dream house, forget to pause and consider<br />
Page 243 <strong>of</strong> 289
the f<strong>in</strong>ancial responsibilities <strong>of</strong> homeownership. While the mortgage is certa<strong>in</strong>ly the<br />
largest and most visible cost associated with a home, there are a host <strong>of</strong> additional<br />
expenses, some <strong>of</strong> which don't go away even after the mortgage is paid <strong>of</strong>f. Smart<br />
shoppers would do well to keep the follow<strong>in</strong>g items <strong>in</strong> m<strong>in</strong>d:<br />
Ma<strong>in</strong>tenance. Even if you build a new home, it won't stay new forever, nor will those<br />
expensive major appliances, such as stoves, dishwashers and refrigerators. <strong>The</strong> same<br />
applies to the ro<strong>of</strong>, furnace, driveway, carpet and even the pa<strong>in</strong>t on the walls. If you are<br />
'house poor' when you take on that first mortgage payment, you could f<strong>in</strong>d yourself <strong>in</strong> a<br />
difficult situation if your f<strong>in</strong>ances haven't improved by the time your home is <strong>in</strong> need <strong>of</strong><br />
major repairs.<br />
Utilities. Heat, light, water, sewage, trash removal, cable television and telephone<br />
services all cost money. <strong>The</strong>se expenses are not <strong>in</strong>cluded <strong>in</strong> the front-end ratio, nor are<br />
they calculated <strong>in</strong> the back-end ratio. But these expenses are unavoidable for most<br />
homeowners.<br />
Association Fees. Many homes <strong>in</strong> planned communities assess monthly or yearly<br />
association fees. Sometimes these fees are less than $100 per year, other times they<br />
are several hundred dollars per month. Ask about association fees prior to mak<strong>in</strong>g a<br />
purchase. F<strong>in</strong>d out about what the fee covers. In some communities, it <strong>in</strong>cludes lawn<br />
ma<strong>in</strong>tenance, snow removal, a community pool and other services. In other<br />
communities, the association fee covers little more than the adm<strong>in</strong>istrative costs <strong>of</strong><br />
Page 244 <strong>of</strong> 289
hir<strong>in</strong>g an attorney to encourage everyone <strong>in</strong> the neighborhood to ma<strong>in</strong>ta<strong>in</strong> the exterior<br />
appearance <strong>of</strong> their homes. While an <strong>in</strong>creas<strong>in</strong>g number <strong>of</strong> lenders <strong>in</strong>clude association<br />
fees <strong>in</strong> the front-end ratio, it pays to remember that these fees are likely to <strong>in</strong>crease over<br />
time.<br />
Furniture and Décor. Drive through almost any community <strong>of</strong> new homes after the sun<br />
goes down, and you're likely to notice some <strong>in</strong>terior lights illum<strong>in</strong>at<strong>in</strong>g big, empty rooms,<br />
which you can see only because those big, beautiful houses don't have any w<strong>in</strong>dow<br />
cover<strong>in</strong>gs. This isn't the latest decorat<strong>in</strong>g trend. It's the result <strong>of</strong> a family that spent all<br />
their money on the house, and now can't afford curta<strong>in</strong>s or furniture. Before you buy a<br />
new house, take a good look around the number <strong>of</strong> rooms that will need to be furnished<br />
and the number <strong>of</strong> w<strong>in</strong>dows that will need to be covered.<br />
Th<strong>in</strong>k Before You Buy<br />
<strong>The</strong> cost <strong>of</strong> a home is the s<strong>in</strong>gle largest personal expense most people will ever face.<br />
Prior to tak<strong>in</strong>g on such an enormous debt, take the time to do the math. After you run<br />
the numbers, consider your personal situation, and th<strong>in</strong>k about your present and future<br />
lifestyle <strong>in</strong>to the next three decades. Make an <strong>in</strong>formed decision, and be sure to<br />
purchase a home that you can afford without compromis<strong>in</strong>g your future.<br />
______<br />
What Percentage <strong>of</strong> Income Should Be Spent on a Mortgage?<br />
by M<strong>in</strong>dy Sitton-Halleck<br />
A general rule <strong>in</strong> qualify<strong>in</strong>g for a home mortgage is that your debt-to-<strong>in</strong>come ratio be no<br />
higher than 28/36 percent on conventional loans and 31/43 percent on Federal Hous<strong>in</strong>g<br />
Authority (FHA) loans. Ratios above this may mean that you will be denied credit or<br />
subjected to a higher mortgage <strong>in</strong>terest rate.<br />
Percentage <strong>of</strong> Income<br />
<strong>The</strong>se typical qualify<strong>in</strong>g ratios are <strong>in</strong>fluenced by factors such as type <strong>of</strong> mortgage<br />
product (30-year fixed, adjustable, etc.), borrower’s credit, downpayment and <strong>of</strong>ten the<br />
collateral. This means no more than 28 percent (front-end ratio) <strong>of</strong> a borrower’s gross<br />
monthly <strong>in</strong>come should be used to pay the PITI payment (pr<strong>in</strong>cipal, <strong>in</strong>terest, property<br />
taxes and <strong>in</strong>surance). Your total debt-to-<strong>in</strong>come ratio (back-end ratio) is your hous<strong>in</strong>g<br />
payment--mortgage, property taxes, homeowners <strong>in</strong>surance--and your exist<strong>in</strong>g debts.<br />
Types <strong>of</strong> Debt<br />
Additional debt items that appear on your credit report <strong>in</strong>clude car and student loans,<br />
monthly credit card payments and child support. Doctor and phone bills, and so forth<br />
Page 245 <strong>of</strong> 289
are not <strong>in</strong>cluded. Ideally, no more than 36 percent (conventional) or 43 percent (FHA) <strong>of</strong><br />
your monthly <strong>in</strong>come is to be used to pay these total comb<strong>in</strong>ed PITI and monthly debts.<br />
Calculat<strong>in</strong>g Ratios<br />
For example, if you earn $6,000 monthly, and you have a car payment <strong>of</strong> $497 and<br />
credit card charges <strong>of</strong> $198 a month, the highest total hous<strong>in</strong>g payment you would<br />
qualify for, given a 20 percent downpayment (conventional loan) would be<br />
approximately $2,100. On FHA, the upper limit (us<strong>in</strong>g a 3.5 percent downpayment)<br />
would be roughly $2,590.<br />
Expert Insight<br />
Normally, FHA will require your mortgage payment (PITI) to not exceed 31 percent <strong>of</strong><br />
your gross monthly <strong>in</strong>come. Additionally, your total monthly debt obligations (mortgage,<br />
credit cards, car and student loans, child support, etc.) should not surpass 43 percent <strong>of</strong><br />
your monthly earn<strong>in</strong>gs. <strong>The</strong>se ratios are more generous than what can be found with<br />
conventional loans. Higher ratios are obta<strong>in</strong>able if you’re acquir<strong>in</strong>g an energy-efficient<br />
home. What is called the "stretch" ratio is a liberal 33/45 percent.<br />
Considerations<br />
When consider<strong>in</strong>g purchas<strong>in</strong>g a home with less than 20 percent downpayment, you will<br />
most likely be required to purchase mortgage <strong>in</strong>surance that will add to your PITI. On an<br />
FHA loan, the <strong>in</strong>surance is called Mortgage Insurance Premium (MIP). On less than 20<br />
percent down on conventional loans it is called Private Mortgage Insurance (PMI). VA<br />
loans have an additional Fund<strong>in</strong>g Fee. All <strong>of</strong> these add to your cost and detract from the<br />
amount <strong>of</strong> mortgage for which you qualify.<br />
Prevention/Solution<br />
To learn what your <strong>in</strong>come to debt ratios may be, contact a mortgage pr<strong>of</strong>essional and<br />
ask to be preapproved. Prequalified is not the same as preapproved--which means your<br />
file has gone through some underwrit<strong>in</strong>g and you’ll know exactly what amount <strong>of</strong> your<br />
<strong>in</strong>come should be used for a mortgage. Consider also that you can contact the<br />
Department <strong>of</strong> Hous<strong>in</strong>g and Urban Development (HUD) to f<strong>in</strong>d a hous<strong>in</strong>g counselor who<br />
can guide you, at no cost, as you go through the mortgage process.<br />
Benefits<br />
For first-time home buyers, CalHFA (California's Consumer Home Mortgage<br />
Organization) <strong>of</strong>fers lower than market <strong>in</strong>terest rate programs and downpayment<br />
assistance programs to qualify<strong>in</strong>g home buyers.<br />
Page 246 <strong>of</strong> 289
Calculat<strong>in</strong>g the Percentage <strong>of</strong> Each Partner’s<br />
Contribution to the Mortgage<br />
by John C Johnson III<br />
Now, hav<strong>in</strong>g said all that, the question becomes how much <strong>of</strong> each partners’ <strong>in</strong>come<br />
should go toward the twenty-five to thirty-six percent (25% - 36%) mortgage.<br />
<strong>The</strong> simplest way to calculate this would be to determ<strong>in</strong>e what percentage <strong>of</strong> each<br />
partner’s <strong>in</strong>come makes up the total household <strong>in</strong>come. For example, when I was <strong>in</strong><br />
pr<strong>of</strong>essional school,<br />
I was blessed to br<strong>in</strong>g-<strong>in</strong> around 75% <strong>of</strong> our household earn<strong>in</strong>gs. <strong>The</strong>refore, we<br />
reasoned, that I should bear around 75% <strong>of</strong> the household debts, <strong>in</strong>clud<strong>in</strong>g rent. Us<strong>in</strong>g<br />
this formula, we were able to live quite comfortably and, for the most part anyway, I was<br />
able to pay cash for my pr<strong>of</strong>essional education, leav<strong>in</strong>g absolutely no student loan debt<br />
at the end <strong>of</strong> my school<strong>in</strong>g.<br />
And I was able, therefore, to pursue my pr<strong>of</strong>essional passions without the anxieties <strong>of</strong><br />
hav<strong>in</strong>g to consider the f<strong>in</strong>ancial dra<strong>in</strong> most people <strong>in</strong> my position had, after graduation.<br />
Talk about a major bless<strong>in</strong>g!!!<br />
5. F<strong>in</strong>ally, Flexibility Dictates that Job Adjustments Will<br />
Trigger Re-Alignment <strong>of</strong> the Formula and Either Increase<br />
or Decrease the Mortgage Term and the Monthly<br />
Payments<br />
Traditional Mortgage Modification and Debt Restructur<strong>in</strong>g<br />
Mortgage modification is a process where the terms <strong>of</strong> a mortgage are modified<br />
outside the orig<strong>in</strong>al terms <strong>of</strong> the contract agreed to by the lender and borrower (i.e.<br />
mortgagee and mortgagor). In general, any loan can be modified, and the general<br />
process is referred to as loan modification or debt reschedul<strong>in</strong>g.<br />
In the normal progression <strong>of</strong> a mortgage, payments <strong>of</strong> <strong>in</strong>terest and pr<strong>in</strong>cipal are made<br />
until the mortgage is paid <strong>in</strong> full (or paid <strong>of</strong>f). Typically, until the mortgage is paid, the<br />
lender holds a lien on the property and if the borrower sells the property before the<br />
mortgage is paid-<strong>of</strong>f, the unpaid balance <strong>of</strong> the mortgage is remitted to the lender to<br />
release the lien. Generally speak<strong>in</strong>g, any change to the mortgage terms is a<br />
modification, but as the term is used it refers to a change <strong>in</strong> terms based upon either the<br />
specific <strong>in</strong>ability <strong>of</strong> the borrower to rema<strong>in</strong> current on payments as stated <strong>in</strong> the<br />
mortgage, or more generally government mandate to lenders. A loan modification will<br />
Page 247 <strong>of</strong> 289
typically result <strong>in</strong> the change to the loan's monthly payment, <strong>in</strong>terest rate, term or<br />
outstand<strong>in</strong>g pr<strong>in</strong>cipal.<br />
Types <strong>of</strong> modification<br />
Mortgages are modified to the benefit <strong>of</strong> the borrower <strong>in</strong> one or more <strong>of</strong> the follow<strong>in</strong>g<br />
ways:<br />
<br />
<br />
<br />
<br />
<br />
<br />
<br />
Reduction <strong>in</strong> <strong>in</strong>terest rate, or a change from a float<strong>in</strong>g to a fixed rate, or <strong>in</strong> how<br />
the float<strong>in</strong>g rate is computed<br />
Reduction <strong>in</strong> pr<strong>in</strong>cipal<br />
Reduction <strong>in</strong> the monthly payment<br />
Reduction <strong>in</strong> late fees or other penalties<br />
Lengthen<strong>in</strong>g <strong>of</strong> the loan term<br />
Capp<strong>in</strong>g the monthly payment to a percentage <strong>of</strong> household <strong>in</strong>come<br />
Mortgage forbearance program<br />
<strong>The</strong> borrower can be current, late, <strong>in</strong> default, <strong>in</strong> bankruptcy, or <strong>in</strong> foreclosure at the time<br />
the application for modification is made. <strong>The</strong> programs available will vary accord<strong>in</strong>gly.<br />
<strong>The</strong>re may be modifications made at the discretion <strong>of</strong> the lender. <strong>The</strong> lender is<br />
motivated to <strong>of</strong>fer better terms to the borrower because <strong>of</strong> the expectation that the<br />
borrower might be able to afford a lower payment, and that a perform<strong>in</strong>g loan (i.e. one <strong>in</strong><br />
which payments are current) will be more valuable ultimately than the proceeds<br />
obta<strong>in</strong>ed from a foreclosure sale.<br />
<strong>The</strong> state and federal government may structure a mortgage modification program as<br />
voluntary on the part <strong>of</strong> the lender, but may provide <strong>in</strong>centives for the lender to<br />
participate. A mandatory mortgage modification program requires the lender to modify<br />
mortgages meet<strong>in</strong>g the criteria with respect to the borrower, the property, and the loan<br />
payment history.<br />
Federal Home Affordable Modification Program (HAMP)<br />
Program Formed<br />
February 18, 2009<br />
Program purpose<br />
Home Affordable Modification Program, also known as HAMP, is set out to help up<br />
from 7 to 8 million struggl<strong>in</strong>g homeowners at risk <strong>of</strong> foreclosure by work<strong>in</strong>g with their<br />
lenders to lower monthly mortgage payments. <strong>The</strong> Program is part <strong>of</strong> the Mak<strong>in</strong>g Home<br />
Affordable Program which was created by the F<strong>in</strong>ancial Stability Act <strong>of</strong> 2009. <strong>The</strong><br />
program was built as collaboration with banks, services, credit unions, the FHA, the VA,<br />
Page 248 <strong>of</strong> 289
the <strong>US</strong>DA and the Federal Hous<strong>in</strong>g F<strong>in</strong>ance Agency, to create standard loan<br />
modification guidel<strong>in</strong>es for lenders to take <strong>in</strong>to consideration when evaluat<strong>in</strong>g a<br />
borrower for a potential loan modification. Over 110 major lenders have already signed<br />
onto the program. <strong>The</strong> Program is now looked upon as the <strong>in</strong>dustry standard practice<br />
for lenders to analyze potential modification applicants.<br />
Eligibility Requirements<br />
<strong>The</strong> program abides by the follow<strong>in</strong>g eligibility and verification criteria:<br />
Loans orig<strong>in</strong>ated on or before January 1, 2009<br />
First-lien loans on owner-occupied properties with unpaid pr<strong>in</strong>cipal balance up to<br />
$729,750<br />
<br />
<br />
<br />
Higher limits allowed for owner-occupied properties with 2-4 units<br />
All borrowers must fully document <strong>in</strong>come, <strong>in</strong>clud<strong>in</strong>g signed IRS 4506-T, pro<strong>of</strong> <strong>of</strong><br />
<strong>in</strong>come (i.e. paystubs or tax returns), and must sign an affidavit <strong>of</strong> f<strong>in</strong>ancial<br />
hardship<br />
Property owner occupancy status will be verified through borrower credit report<br />
and other documentation; no <strong>in</strong>vestor-owned, vacant, or condemned properties<br />
Page 249 <strong>of</strong> 289
Incentives to lenders and servicers to modify at risk borrowers who have not yet<br />
missed payments when the servicer determ<strong>in</strong>es that the borrower is at imm<strong>in</strong>ent<br />
risk <strong>of</strong> default<br />
Modifications can start from now until December 31, 2012; loans can be modified<br />
only once under the program<br />
Terms and Procedures<br />
<br />
<br />
<br />
<br />
<br />
<br />
<br />
Participat<strong>in</strong>g servicers are required to service all eligible loans under the rules <strong>of</strong><br />
the program unless explicitly prohibited by contract; servicers are required to use<br />
reasonable efforts to obta<strong>in</strong> waivers <strong>of</strong> limits on participation.<br />
Participat<strong>in</strong>g loan servicers will be required to use a net present value (NPV) test<br />
on each loan that is at risk <strong>of</strong> imm<strong>in</strong>ent default or at least 60 days del<strong>in</strong>quent. <strong>The</strong><br />
NPV test will compare the net present value <strong>of</strong> cash flows with modification and<br />
without modification. If the test is positive: mean<strong>in</strong>g that the net present value <strong>of</strong><br />
expected cash flow is greater <strong>in</strong> the modification scenario: the servicer must<br />
modify absent fraud or a contract prohibition.<br />
Parameters <strong>of</strong> the NPV test are spelled out <strong>in</strong> the guidel<strong>in</strong>es, <strong>in</strong>clud<strong>in</strong>g<br />
acceptable discount rates, property valuation methodologies, home price<br />
appreciation assumptions, foreclosure costs and timel<strong>in</strong>es, and borrower cure<br />
and redefault rate assumptions.<br />
Servicers will follow a specified sequence <strong>of</strong> steps <strong>in</strong> order to reduce the monthly<br />
payment to no more than 31% <strong>of</strong> gross monthly <strong>in</strong>come (DTI).<br />
<strong>The</strong> modification sequence requires first reduc<strong>in</strong>g the <strong>in</strong>terest rate (subject to a<br />
rate floor <strong>of</strong> 2%), then if necessary extend<strong>in</strong>g the term or amortization <strong>of</strong> the loan<br />
up to a maximum <strong>of</strong> 40 years, and then if necessary forbear<strong>in</strong>g pr<strong>in</strong>cipal.<br />
Pr<strong>in</strong>cipal forgiveness or a Hope for Homeowners ref<strong>in</strong>anc<strong>in</strong>g are acceptable<br />
alternatives.<br />
<strong>The</strong> monthly payment <strong>in</strong>cludes pr<strong>in</strong>cipal, <strong>in</strong>terest, taxes, <strong>in</strong>surance, flood<br />
<strong>in</strong>surance, homeowner’s association and/or condom<strong>in</strong>ium fees. Monthly <strong>in</strong>come<br />
<strong>in</strong>cludes wages, salary, overtime, fees, commissions, tips, social security,<br />
pensions, and all other <strong>in</strong>come.<br />
Servicers must enter <strong>in</strong>to the program agreements with Treasury's f<strong>in</strong>ancial agent<br />
on or before December 31, 2009.<br />
Payments<br />
<br />
<br />
<br />
<strong>The</strong> program will share with the lender/<strong>in</strong>vestor the cost <strong>of</strong> reductions <strong>in</strong> monthly<br />
payments from 38% DTI to 31% DTI.<br />
Servicers that modify loans accord<strong>in</strong>g to the guidel<strong>in</strong>es will receive an up-front<br />
fee <strong>of</strong> $1,000 for each modification, plus “pay for success” fees on stillperform<strong>in</strong>g<br />
loans <strong>of</strong> $1,000 per year.<br />
Homeowners who make their payments on time are eligible for up to $1,000 <strong>of</strong><br />
pr<strong>in</strong>cipal reduction payments each year for up to five years.<br />
Page 250 <strong>of</strong> 289
<strong>The</strong> program will provide one-time bonus <strong>in</strong>centive payments <strong>of</strong> $1,500 to<br />
lender/<strong>in</strong>vestors and $500 to servicers for modifications made while a borrower is<br />
still current on mortgage payments.<br />
<strong>The</strong> program will <strong>in</strong>clude <strong>in</strong>centives for ext<strong>in</strong>guish<strong>in</strong>g second liens on loans<br />
modified under this program.<br />
No payments will be made under the program to the lender/<strong>in</strong>vestor, servicer, or<br />
borrower unless and until the servicer has first entered <strong>in</strong>to the program<br />
agreements with Treasury’s f<strong>in</strong>ancial agent.<br />
Similar <strong>in</strong>centives will be paid for Hope for Homeowner ref<strong>in</strong>ances.<br />
Warn<strong>in</strong>gs<br />
<strong>of</strong> the program.<br />
<br />
<br />
<br />
Transparency and Accountability<br />
Measures to prevent and detect fraud, such as<br />
documentation and audit requirements, will be<br />
central to the program.<br />
Servicers will be required to collect, ma<strong>in</strong>ta<strong>in</strong> and<br />
transmit records for verification and compliance<br />
review, <strong>in</strong>clud<strong>in</strong>g borrower eligibility,<br />
underwrit<strong>in</strong>g, <strong>in</strong>centive payments, property<br />
verification, and other documentation.<br />
Freddie Mac is appo<strong>in</strong>ted the compliance <strong>of</strong>ficer<br />
Foreclosure rescue and mortgage modification scams are a grow<strong>in</strong>g problem.<br />
Homeowners must protect themselves so they do not lose money or their home.<br />
Scammers make promises that they cannot keep, such as guarantees to “save” your<br />
home or lower your mortgage, <strong>of</strong>ten for a fee. Scammers may pretend that they have<br />
direct contact with your mortgage servicer when they do not.<br />
Scams<br />
After the beg<strong>in</strong>n<strong>in</strong>g <strong>of</strong> the subprime mortgage crisis, unscrupulous mortgage<br />
pr<strong>of</strong>essionals began sett<strong>in</strong>g up "Foreclosure rescue" companies promis<strong>in</strong>g for a large<br />
fee to persuade lenders to modify desperate homeowners' mortgages. Nonpr<strong>of</strong>it<br />
hous<strong>in</strong>g counselors approved by the Department <strong>of</strong> Hous<strong>in</strong>g and Urban Development<br />
will help borrowers for free; additionally, many states are enact<strong>in</strong>g legislation which<br />
forces loan modification companies to become licensed and bonded to legally rema<strong>in</strong> <strong>in</strong><br />
bus<strong>in</strong>ess, elim<strong>in</strong>at<strong>in</strong>g many fraudulent operations that charge fees.<br />
Resources<br />
<strong>The</strong>re are free resources available for potential applicants.<br />
Page 251 <strong>of</strong> 289
<strong>The</strong> Federal government provides free resources to get you the help you need.<br />
Homeowners can call the Homeowner’s HOPE Hotl<strong>in</strong>e at 1-888-995-HOPE<br />
(4673) for <strong>in</strong>formation about the Mak<strong>in</strong>g Home Affordable Program and to speak<br />
with a HUD approved hous<strong>in</strong>g counselor. Assistance is available <strong>in</strong> English and<br />
Spanish, and other languages by appo<strong>in</strong>tment.<br />
HUD.org is another free website where you may go to f<strong>in</strong>d a local counselor <strong>in</strong><br />
your region. HUD.gov<br />
Mak<strong>in</strong>gHomeAffordable.gov also has many resources for you to check onl<strong>in</strong>e. It<br />
allows you to compute estimated payments as well as has other resources.<br />
Mak<strong>in</strong>g Home Affordable<br />
Fannie Mae has a tool available where you can check to see if your loan is<br />
owned by Fannie Mae and thus potentially eligible for the program Fannie Mae<br />
Loan Look Up<br />
Freddie Mac has a tool available where you can check to see if your loan is<br />
owned by Freddie Mac and thus potentially eligible for the program Freddie Mac<br />
Loan Look Up<br />
Hardest Hit Funds<br />
<strong>The</strong> hous<strong>in</strong>g crisis that began <strong>in</strong> 2007 led to unprecedented home price decl<strong>in</strong>es and<br />
susta<strong>in</strong>ed and higher unemployment <strong>in</strong> certa<strong>in</strong> parts <strong>of</strong> the country. Families <strong>in</strong> these<br />
areas have been particularly hard hit by this crisis as they have struggled to make their<br />
monthly mortgage payments and grappled with deeply underwater mortgages.<br />
First announced <strong>in</strong> February 2010, the Hardest Hit Fund provides $7.6 billion to the 18<br />
hardest hit states, plus the District <strong>of</strong> Columbia, to develop locally-tailored programs to<br />
assist struggl<strong>in</strong>g homeowners <strong>in</strong> their communities.<br />
HHF programs are designed and adm<strong>in</strong>istered by each state’s Hous<strong>in</strong>g F<strong>in</strong>ance Agency<br />
(HFA). Most <strong>of</strong> these programs are aimed at help<strong>in</strong>g unemployed homeowners rema<strong>in</strong><br />
<strong>in</strong> their homes while they search for new employment and those who owe more on their<br />
mortgage than their home is worth. State HFAs have until the end <strong>of</strong> 2017 to utilize<br />
funds allocated under HHF.<br />
Loan Modifications<br />
Those struggl<strong>in</strong>g with mortgage payments are able to request modifications from the<br />
mortgage providers. While requirements will vary depend<strong>in</strong>g on who the mortgage<br />
providers are, some criteria are common. Applicants request<strong>in</strong>g modifications must be:<br />
<br />
<br />
<br />
<br />
experienc<strong>in</strong>g a documented f<strong>in</strong>ancial hardship. This can <strong>in</strong>clude be<strong>in</strong>g laid <strong>of</strong>f.<br />
miss<strong>in</strong>g several payments already.<br />
the owner <strong>of</strong> the residence, and the mortgage must be for a primary residence.<br />
still f<strong>in</strong>ancial secure, so as not to have filed for bankruptcy yet.<br />
Page 252 <strong>of</strong> 289
Our Program, however, is different.<br />
Put simply, life-adjustments will necessarily trigger re-alignment <strong>of</strong> the new mortgage<br />
<strong>in</strong>itiative. Let’s say, for example, that Partner B experiences a job-adjustment (such as<br />
a lay<strong>of</strong>f or pay reduction).<br />
In such an event, Partner B would not be able to contribute as much to the Home<br />
Mortgage as s/he did prior to the adjustment. Partner B’s contribution should rema<strong>in</strong> the<br />
same percentage-wise however, <strong>in</strong> order for her/him to rema<strong>in</strong> comfortable <strong>in</strong> the level<br />
<strong>of</strong> contribution.<br />
Partner A, on the other hand, should not be required to change her/his level <strong>of</strong><br />
contribution, percentage-wise, so, therefore, the only factor that can be adjusted is the<br />
overall amount <strong>of</strong> the Home Mortgage payment, which can be adjusted by extend<strong>in</strong>g the<br />
Mortgage Term to meet the new split-percentage <strong>of</strong> overall <strong>in</strong>come threshold.<br />
1. <strong>The</strong> Interest Rate for This New Home-Mortgage Initiative<br />
Is Limited to Fluctuations <strong>in</strong> <strong>The</strong> GDP<br />
<strong>The</strong> only <strong>in</strong>terest factored <strong>in</strong>to this new Home-Mortgage Initiative is limited to Market<br />
conditions, <strong>in</strong> order to keep-pace with the base monetary valuation. In the United<br />
States, for example, a dollar value <strong>in</strong>crease will trigger a Home-Mortgage Rate<br />
decrease, and vice-versa.<br />
A dollar value<br />
decrease will<br />
trigger a Home-<br />
Mortgage Rate<br />
<strong>in</strong>crease. Each<br />
decrease or<br />
<strong>in</strong>crease shall be<br />
commensurate<br />
with<br />
the<br />
percentage<br />
decrease or<br />
<strong>in</strong>crease<br />
experienced by<br />
the market rate.<br />
Everyone w<strong>in</strong>s <strong>in</strong><br />
this scenario.<br />
<strong>The</strong> homeowners reta<strong>in</strong> their home, as well as the ability to provide for their families at<br />
rates and payments they can truly afford, regardless <strong>of</strong> changes <strong>in</strong> their circumstances.<br />
Page 253 <strong>of</strong> 289
<strong>The</strong> Mortgagor cont<strong>in</strong>ues to receive regular payment, adjusted for cont<strong>in</strong>gencies and<br />
market fluctuations through to the full-term <strong>of</strong> the mortgage.<br />
Page 254 <strong>of</strong> 289
XI. References<br />
1. https://www.huff<strong>in</strong>gtonpost.com/bill-quigley/ten-facts-about-homelessn_b_5977946.html<br />
2. https://projecthome.org/about/facts-homelessness<br />
3. https://list25.com/25-hard-to-swallow-facts-about-homelessness/<br />
4. http://www.nationalhomeless.org/factsheets/employment.html<br />
5. https://www.huff<strong>in</strong>gtonpost.com.au/2017/04/04/homeless-youth-unemployment-is-n<strong>in</strong>etimes-the-national-average_a_22026299/<br />
6. https://www.apnews.com/d480434bbacd4b028ff13cd1e7cea155<br />
7. https://en.wikipedia.org/wiki/Work<strong>in</strong>g_poor<br />
8. https://politics<strong>of</strong>poverty.oxfamamerica.org/2016/09/5-myths-about-the-work<strong>in</strong>g-poor-<strong>in</strong>america/<br />
9. https://www.huff<strong>in</strong>gtonpost.com/2014/05/19/work<strong>in</strong>g-poor-stories_n_5297694.html<br />
10. https://www.bls.gov/opub/reports/work<strong>in</strong>g-poor/2015/home.htm<br />
11. http://homelesshub.ca/about-homelessness/topics/mental-health<br />
12. http://www.latimes.com/local/la-me-mentally-ill-homeless-20170807-htmlstory.html<br />
13. https://www.healthyplace.com/other-<strong>in</strong>fo/mental-illness-overview/mental-illness-andhomelessness<br />
14. https://www.hcs.harvard.edu/~hcht/blog/homelessness-and-mental-health-facts<br />
15. http://www.newsweek.com/affordable-hous<strong>in</strong>g-crisis-forces-us-homeless-numbers-firsttime-great-739333<br />
16. https://www.usich.gov/solutions/hous<strong>in</strong>g/affordable-hous<strong>in</strong>g<br />
17. http://www.bus<strong>in</strong>ess<strong>in</strong>sider.com/affordable-hous<strong>in</strong>g-crisis-homelessness-us-2018-3<br />
18. https://www.apha.org/policies-and-advocacy/public-health-policy-statements/policydatabase/2018/01/18/hous<strong>in</strong>g-and-homelessness-as-a-public-health-issue<br />
19. https://www.huduser.gov/portal/pdredge/pdr_edge_research_022414.html<br />
20. http://www.needhelppay<strong>in</strong>gbills.com/html/pennsylvania_homeless_assistan.html<br />
21. http://nationalhomeless.org/references/directory/region/AZ/<br />
Page 255 <strong>of</strong> 289
22. https://www.voa.org/homeless-people<br />
23. https://en.wikipedia.org/wiki/Homeless_shelter<br />
24. https://en.wikipedia.org/wiki/Hous<strong>in</strong>g_First<br />
25. http://nationalhomeless.org/issues/civil-rights/<br />
26. https://www.nlchp.org/crim<strong>in</strong>alization<br />
27. http://nlihc.org/article/crim<strong>in</strong>alization-homelessness-<strong>in</strong>creases-us-cities<br />
28. https://theappeal.org/the-crim<strong>in</strong>alization-<strong>of</strong>-homelessness-an-expla<strong>in</strong>er-aa074d25688d/<br />
29. https://endhomelessness.org/homelessness-<strong>in</strong>-america/what-causeshomelessness/hous<strong>in</strong>g/<br />
30. https://en.wikipedia.org/wiki/Hous<strong>in</strong>g_First<br />
31. http://home.uchicago.edu/kczerniak/<strong>Economic</strong>s%20<strong>of</strong>%20<strong>Homelessness</strong>.pdf<br />
32. http://www.oppaga.state.fl.us/reports/pdf/0501rpt.pdf<br />
33. https://www.strategiestoendhomelessness.org/wpcontent/themes/steh<strong>The</strong>me/docs/Data%20Page/<strong>Economic</strong>s%20<strong>of</strong>%20<strong>Homelessness</strong>%202016.<br />
pdf<br />
Page 256 <strong>of</strong> 289
Notes<br />
_____________________________________________________________________________________<br />
_____________________________________________________________________________________<br />
_____________________________________________________________________________________<br />
_____________________________________________________________________________________<br />
_____________________________________________________________________________________<br />
_____________________________________________________________________________________<br />
_____________________________________________________________________________________<br />
_____________________________________________________________________________________<br />
_____________________________________________________________________________________<br />
_____________________________________________________________________________________<br />
_____________________________________________________________________________________<br />
_____________________________________________________________________________________<br />
_____________________________________________________________________________________<br />
_____________________________________________________________________________________<br />
_____________________________________________________________________________________<br />
_____________________________________________________________________________________<br />
_____________________________________________________________________________________<br />
_____________________________________________________________________________________<br />
_____________________________________________________________________________________<br />
_____________________________________________________________________________________<br />
_____________________________________________________________________________________<br />
_____________________________________________________________________________________<br />
_____________________________________________________________________________________<br />
_____________________________________________________________________________________<br />
_____________________________________________________________________________________<br />
_____________________________________________________________________________________<br />
_____________________________________________________________________________________<br />
_____________________________________________________________________________________<br />
_____________________________________________________________________________________<br />
_____________________________________________________________________________________<br />
_____________________________________________________________________________________<br />
_____________________________________________________________________________________<br />
_____________________________________________________________________________________<br />
_____________________________________________________________________________________<br />
_____________________________________________________________________________________<br />
_____________________________________________________________________________________<br />
_____________________________________________________________________________________<br />
_____________________________________________________________________________________<br />
Page 257 <strong>of</strong> 289
Notes<br />
_____________________________________________________________________________________<br />
_____________________________________________________________________________________<br />
_____________________________________________________________________________________<br />
_____________________________________________________________________________________<br />
_____________________________________________________________________________________<br />
_____________________________________________________________________________________<br />
_____________________________________________________________________________________<br />
_____________________________________________________________________________________<br />
_____________________________________________________________________________________<br />
_____________________________________________________________________________________<br />
_____________________________________________________________________________________<br />
_____________________________________________________________________________________<br />
_____________________________________________________________________________________<br />
_____________________________________________________________________________________<br />
_____________________________________________________________________________________<br />
_____________________________________________________________________________________<br />
_____________________________________________________________________________________<br />
_____________________________________________________________________________________<br />
_____________________________________________________________________________________<br />
_____________________________________________________________________________________<br />
_____________________________________________________________________________________<br />
_____________________________________________________________________________________<br />
_____________________________________________________________________________________<br />
_____________________________________________________________________________________<br />
_____________________________________________________________________________________<br />
_____________________________________________________________________________________<br />
_____________________________________________________________________________________<br />
_____________________________________________________________________________________<br />
_____________________________________________________________________________________<br />
_____________________________________________________________________________________<br />
_____________________________________________________________________________________<br />
_____________________________________________________________________________________<br />
_____________________________________________________________________________________<br />
_____________________________________________________________________________________<br />
_____________________________________________________________________________________<br />
_____________________________________________________________________________________<br />
_____________________________________________________________________________________<br />
_____________________________________________________________________________________<br />
Page 258 <strong>of</strong> 289
Page 259 <strong>of</strong> 289
Attachment A<br />
Homeless Assessment Report to<br />
Congress 2017<br />
Page 260 <strong>of</strong> 289
<strong>The</strong> U.S. Department <strong>of</strong><br />
Hous<strong>in</strong>g and Urban Development<br />
OFFICE OF COMMUNITY PLANNING AND DEVELOPMENT<br />
PART 1:<br />
Po<strong>in</strong>t-<strong>in</strong>-Time Estimates <strong>of</strong> <strong>Homelessness</strong><br />
<strong>The</strong> 2017 Annual Homeless<br />
Assessment Report (AHAR)<br />
to Congress<br />
DECEMBER 2017
DRAFT<br />
Acknowledgements<br />
AUTHORS:<br />
Meghan Henry, Rian Watt, Lily Rosenthal, and Azim Shivji, Abt Associates<br />
PRINCIPAL INVESTIGATORS:<br />
Dr. Jill Khadduri, Abt Associates, and Dr. Dennis Culhane, National Center on <strong>Homelessness</strong> among Veterans,<br />
University <strong>of</strong> Pennsylvania<br />
DATA COLLECTION MANAGERS:<br />
Azim Shivji and Rian Watt, Abt Associates<br />
DATA COLLECTORS AND REVIEWERS:<br />
Korr<strong>in</strong> Bishop, Molly Brune, Tanya de Sousa, Marissa Hashizume, Tyler Morrill, Arturo Nava,<br />
Jillian Ouellette, Lily Rosenthal, Azim Shivji, Aubrey Sitler, Djaniele Taylor, and Rian Watt, Abt Associates, and<br />
Dan Treglia and Kalen Flynn, University <strong>of</strong> Pennsylvania<br />
PROGRAMMERS/ANALYSTS:<br />
Azim Shivji and Tyler Morrill, Abt Associates, and Jon-Paul Oliva, GIS and Data Quality Consultant<br />
REVIEWERS:<br />
Dr. Larry Buron, Abt Associates<br />
Dr. Alvaro Cortes, Abt Associates<br />
Karen DeBlasio and William Snow, U.S. Department <strong>of</strong> Hous<strong>in</strong>g and Urban Development<br />
DESIGN AND PRODUCTION:<br />
Malcolm Jones, Abt Associates
Contents<br />
Key F<strong>in</strong>d<strong>in</strong>gs.................................... 1<br />
Def<strong>in</strong>ition <strong>of</strong> Terms .............................. 2<br />
Progress on the Prevent<strong>in</strong>g and<br />
End<strong>in</strong>g <strong>Homelessness</strong>............................ 4<br />
About this Report............................... 6<br />
SECTION 1<br />
<strong>Homelessness</strong> <strong>in</strong> the United States................. 7<br />
National Estimates ......................................... 8<br />
State Estimates ........................................... 12<br />
Estimates by CoC ......................................... 16<br />
SECTION 2<br />
Homeless Individuals............................ 20<br />
National Estimates ........................................20<br />
State Estimates ........................................... 24<br />
Estimates by CoC ......................................... 28<br />
SECTION 3<br />
Homeless Families with Children.................. 32<br />
National Estimates ........................................32<br />
State Estimates ...........................................36<br />
Estimates by CoC .........................................40<br />
SECTION 4<br />
Unaccompanied Homeless Youth ................. 44<br />
National Estimates ........................................44<br />
State Estimates ...........................................46<br />
Estimates by CoC .........................................48<br />
SECTION 5<br />
Homeless Veterans............................. 52<br />
National Estimates ........................................ 52<br />
State Estimates ...........................................54<br />
Estimates by CoC .........................................58<br />
SECTION 6<br />
Chronically Homeless Individuals.................. 62<br />
National Estimates ........................................62<br />
State Estimates ...........................................64<br />
Estimates by CoC .........................................68<br />
SECTION 7<br />
National Inventory <strong>of</strong> Beds....................... 72<br />
Appendix..................................... 78
Key F<strong>in</strong>d<strong>in</strong>gs<br />
On a s<strong>in</strong>gle night <strong>in</strong> 2017, 553,742 people were<br />
experienc<strong>in</strong>g homelessness <strong>in</strong> the United States.<br />
For every 10,000 people <strong>in</strong> the country, 17 were<br />
experienc<strong>in</strong>g homelessness. Approximately twothirds<br />
(65%) were stay<strong>in</strong>g <strong>in</strong> emergency shelters<br />
or transitional hous<strong>in</strong>g programs, and about onethird<br />
(35%) were <strong>in</strong> unsheltered locations.<br />
<strong>Homelessness</strong> <strong>in</strong>creased for the first time <strong>in</strong><br />
seven years. <strong>The</strong> number <strong>of</strong> people experienc<strong>in</strong>g<br />
homelessness <strong>in</strong>creased by a little less than one<br />
percent between 2016 and 2017. This <strong>in</strong>crease<br />
reflected a n<strong>in</strong>e percent <strong>in</strong>crease <strong>in</strong> the number <strong>of</strong><br />
people experienc<strong>in</strong>g homelessness <strong>in</strong> unsheltered<br />
locations, which was partially <strong>of</strong>fset by a<br />
three percent decl<strong>in</strong>e <strong>in</strong> the number <strong>of</strong> people<br />
experienc<strong>in</strong>g homelessness <strong>in</strong> sheltered locations.<br />
Recent <strong>in</strong>creases <strong>in</strong> homelessness were driven<br />
mostly by specific changes happen<strong>in</strong>g with<strong>in</strong><br />
cities. Increases <strong>in</strong> the numbers <strong>of</strong> unsheltered<br />
<strong>in</strong>dividuals <strong>in</strong> the 50 largest cities accounted for<br />
nearly all <strong>of</strong> the national <strong>in</strong>crease.<br />
<strong>The</strong> number <strong>of</strong> people experienc<strong>in</strong>g<br />
homelessness <strong>in</strong> families with children decl<strong>in</strong>ed<br />
by five percent between 2016 and 2017—<br />
10,055 fewer people and 3,294 fewer family<br />
households. As <strong>of</strong> 2017, 184,661 people <strong>in</strong> families<br />
with children were experienc<strong>in</strong>g homelessness,<br />
33 percent <strong>of</strong> the homeless population.<br />
In 2017, 40,799 people were experienc<strong>in</strong>g<br />
homelessness as unaccompanied youth—that<br />
is, people under the age <strong>of</strong> 25 experienc<strong>in</strong>g<br />
homelessness on their own. Most unaccompanied<br />
youth (88%) were between the ages <strong>of</strong> 18 and<br />
24. Unaccompanied youth were more likely<br />
to be unsheltered (55%) than both all people<br />
experienc<strong>in</strong>g homelessness (35%) and all people<br />
experienc<strong>in</strong>g homelessness as <strong>in</strong>dividuals (48%).<br />
Between 2016 and 2017, the number <strong>of</strong> veterans<br />
experienc<strong>in</strong>g homelessness <strong>in</strong>creased for the<br />
first time s<strong>in</strong>ce 2010. Nonetheless, homelessness<br />
among veterans dropped 45 percent s<strong>in</strong>ce 2009.<br />
<strong>The</strong> two percent <strong>in</strong>crease dur<strong>in</strong>g the past year<br />
was almost entirely accounted for by <strong>in</strong>creases<br />
among unsheltered veterans <strong>in</strong> major cities.<br />
<strong>The</strong>re were 12 percent more <strong>in</strong>dividuals with<br />
chronic patterns <strong>of</strong> homelessness <strong>in</strong> 2017 than<br />
<strong>in</strong> 2016, but has decl<strong>in</strong>ed by 27 percent s<strong>in</strong>ce<br />
2007. Unlike other <strong>in</strong>creases <strong>in</strong> the last year, the<br />
<strong>in</strong>crease <strong>in</strong> chronic homelessness <strong>in</strong>cluded both<br />
sheltered populations (8% <strong>in</strong>crease) and unsheltered<br />
populations (14% <strong>in</strong>crease).<br />
Percent <strong>of</strong> Homeless People<br />
By Household Type and Sheltered Status, 2017<br />
People <strong>in</strong><br />
Families,<br />
Unsheltered<br />
People <strong>in</strong><br />
Families,<br />
Sheltered<br />
3%<br />
35% Unsheltered<br />
30%<br />
32%<br />
35%<br />
Individuals,<br />
Sheltered<br />
65% Sheltered<br />
Individuals,<br />
Unsheltered<br />
2017 PIT<br />
Estimate:<br />
Change from<br />
2016<br />
All People<br />
Individuals<br />
Families with<br />
Children<br />
Unaccompanied<br />
Homeless Youth<br />
Veterans<br />
Individuals<br />
with Chronic<br />
Patterns <strong>of</strong><br />
<strong>Homelessness</strong><br />
553,742 369,081 184,661 40,799 40,056 86,962<br />
+1% +4% -5% +2% +12% <br />
1
Def<strong>in</strong>ition <strong>of</strong> Terms<br />
Please note: Key terms are used for AHAR report<strong>in</strong>g purposes and accurately reflect the data used <strong>in</strong> this<br />
report. Def<strong>in</strong>itions <strong>of</strong> these terms may differ <strong>in</strong> some ways from the def<strong>in</strong>itions found <strong>in</strong> the Homeless<br />
Emergency Assistance and Rapid Transition to Hous<strong>in</strong>g (HEARTH) Act and <strong>in</strong> HUD regulations.<br />
Chronically Homeless Individual refers to<br />
an <strong>in</strong>dividual with a disability who has been<br />
cont<strong>in</strong>uously homeless for one year or more<br />
or has experienced at least four episodes <strong>of</strong><br />
homelessness <strong>in</strong> the last three years where<br />
the comb<strong>in</strong>ed length <strong>of</strong> time homeless <strong>in</strong> those<br />
occasions is at least 12 months.<br />
Chronically Homeless People <strong>in</strong> Families<br />
refers to people <strong>in</strong> families <strong>in</strong> which the head<br />
<strong>of</strong> household has a disability and has either<br />
been cont<strong>in</strong>uously homeless for one year or<br />
more or has experienced at least four episodes<br />
<strong>of</strong> homelessness <strong>in</strong> the last three years where<br />
the comb<strong>in</strong>ed length <strong>of</strong> time homeless <strong>in</strong> those<br />
occasions is at least 12 months.<br />
Cont<strong>in</strong>uums <strong>of</strong> Care (CoC) are local plann<strong>in</strong>g<br />
bodies responsible for coord<strong>in</strong>at<strong>in</strong>g the full range<br />
<strong>of</strong> homelessness services <strong>in</strong> a geographic area,<br />
which may cover a city, county, metropolitan area,<br />
or an entire state.<br />
Emergency Shelter is a facility with the primary<br />
purpose <strong>of</strong> provid<strong>in</strong>g temporary shelter for<br />
homeless people.<br />
Homeless describes a person who lacks a fixed,<br />
regular, and adequate nighttime residence.<br />
Hous<strong>in</strong>g Inventory Count (HIC) is produced<br />
by each CoC and provides an annual <strong>in</strong>ventory<br />
<strong>of</strong> beds that assist people <strong>in</strong> the CoC who<br />
are experienc<strong>in</strong>g homelessness or leav<strong>in</strong>g<br />
homelessness.<br />
Individual refers to a person who is not part<br />
<strong>of</strong> a family with children dur<strong>in</strong>g an episode <strong>of</strong><br />
homelessness. Individuals may be homeless<br />
as s<strong>in</strong>gle adults, unaccompanied youth, or <strong>in</strong><br />
multiple-adult or multiple-child households.<br />
Other Permanent Hous<strong>in</strong>g is hous<strong>in</strong>g with or<br />
without services that is specifically for formerly<br />
homeless people but that does not require people<br />
to have a disability.<br />
Parent<strong>in</strong>g Youth are people under age 25 who<br />
are the parents or legal guardians <strong>of</strong> one or more<br />
children (under age 18) who are present with or<br />
sleep<strong>in</strong>g <strong>in</strong> the same place as that youth parent,<br />
where there is no person over age 24 <strong>in</strong> the<br />
household.<br />
Parent<strong>in</strong>g Youth Household is a household<br />
with at least one parent<strong>in</strong>g youth and the child<br />
or children for whom the parent<strong>in</strong>g youth is the<br />
parent or legal guardian.<br />
People <strong>in</strong> Families with children are people<br />
who are homeless as part <strong>of</strong> a household that has<br />
at least one adult (age 18 and older) and one child<br />
(under age 18).<br />
Permanent Supportive Hous<strong>in</strong>g (PSH) is a<br />
hous<strong>in</strong>g model designed to provide hous<strong>in</strong>g<br />
assistance (project- and tenant-based) and<br />
supportive services on a long-term basis to<br />
formerly homeless people. HUD’s Cont<strong>in</strong>uum <strong>of</strong><br />
Care program, authorized by the McK<strong>in</strong>ney-Vento<br />
Act, funds PSH and requires that the client have a<br />
disability for eligibility.<br />
Po<strong>in</strong>t-<strong>in</strong>-Time Counts are unduplicated 1-night<br />
estimates <strong>of</strong> both sheltered and unsheltered<br />
homeless populations. <strong>The</strong> 1-night counts are<br />
conducted by CoCs nationwide and occur dur<strong>in</strong>g<br />
the last week <strong>in</strong> January <strong>of</strong> each year.<br />
Rapid Rehous<strong>in</strong>g is a hous<strong>in</strong>g model designed<br />
to provide temporary hous<strong>in</strong>g assistance to<br />
people experienc<strong>in</strong>g homelessness, mov<strong>in</strong>g them<br />
quickly out <strong>of</strong> homelessness and <strong>in</strong>to permanent<br />
hous<strong>in</strong>g.<br />
Safe Havens provide temporary shelter and<br />
services to hard-to-serve <strong>in</strong>dividuals.<br />
Sheltered <strong>Homelessness</strong> refers to people who<br />
are stay<strong>in</strong>g <strong>in</strong> emergency shelters, transitional<br />
hous<strong>in</strong>g programs, or safe havens.<br />
Transitional Hous<strong>in</strong>g Programs provide<br />
people experienc<strong>in</strong>g homelessness a place to stay<br />
comb<strong>in</strong>ed with supportive services for up to 24<br />
months.<br />
2
Unaccompanied Homeless Youth (under 18) are<br />
people <strong>in</strong> households with only children who are<br />
not part <strong>of</strong> a family with children or accompanied<br />
by their parent or guardian dur<strong>in</strong>g their episode <strong>of</strong><br />
homelessness, and who are under the age <strong>of</strong> 18.<br />
Unaccompanied Homeless Youth (18-24) are<br />
people <strong>in</strong> households without children who are<br />
not part <strong>of</strong> a family with children or accompanied<br />
by their parent or guardian dur<strong>in</strong>g their episode<br />
<strong>of</strong> homelessness, and who are between the ages<br />
<strong>of</strong> 18 and 24.<br />
Unsheltered <strong>Homelessness</strong> refers to people<br />
whose primary nighttime location is a public or<br />
private place not designated for, or ord<strong>in</strong>arily used<br />
as, a regular sleep<strong>in</strong>g accommodation for people<br />
(for example, the streets, vehicles, or parks).<br />
Veteran refers to any person who served on<br />
active duty <strong>in</strong> the armed forces <strong>of</strong> the United<br />
States. This <strong>in</strong>cludes Reserves and National Guard<br />
members who were called up to active duty.<br />
3
Progress on Prevent<strong>in</strong>g and End<strong>in</strong>g<br />
<strong>Homelessness</strong><br />
<strong>The</strong> U.S. Department <strong>of</strong> Hous<strong>in</strong>g and Urban<br />
Development and other federal agencies<br />
collaborate with state and local partners to<br />
prevent and end homelessness across the country.<br />
This coord<strong>in</strong>ated effort to end homelessness<br />
cont<strong>in</strong>ues to be a key to mak<strong>in</strong>g progress to<br />
prevent<strong>in</strong>g and end<strong>in</strong>g homelessness.<br />
GOAL<br />
Prevent and end chronic<br />
homelessness<br />
• <strong>The</strong> number <strong>of</strong> <strong>in</strong>dividuals experienc<strong>in</strong>g<br />
chronic homelessness decl<strong>in</strong>ed by 18 percent,<br />
or over 19,000 people, between 2010 and 2017.<br />
• Just under 87,000 <strong>in</strong>dividuals experienc<strong>in</strong>g<br />
homelessness on a particular night <strong>in</strong><br />
January 2017 had chronic patterns <strong>of</strong><br />
homelessness. Nearly seven <strong>in</strong> ten<br />
<strong>in</strong>dividuals experienc<strong>in</strong>g chronic<br />
homelessness were stay<strong>in</strong>g outdoors, <strong>in</strong><br />
abandoned build<strong>in</strong>gs, or other locations<br />
not suitable for human habitation rather than<br />
stay<strong>in</strong>g <strong>in</strong> shelters, reflect<strong>in</strong>g the high<br />
degree <strong>of</strong> vulnerability <strong>of</strong> this population.<br />
• In 2017, there were nearly 94,000 more<br />
permanent supportive hous<strong>in</strong>g (PSH) beds<br />
dedicated to people with chronic patterns <strong>of</strong><br />
homelessness than there were <strong>in</strong> 2010.<br />
GOAL<br />
Prevent and end homelessness<br />
among Veterans<br />
• Between 2010 and 2017, the number <strong>of</strong><br />
veterans experienc<strong>in</strong>g homelessness was cut<br />
nearly <strong>in</strong> half. Veteran homelessness has<br />
dropped by 46 percent, or by more than 34,000<br />
people s<strong>in</strong>ce 2010.<br />
• On a s<strong>in</strong>gle night <strong>in</strong> January 2017, just more<br />
than 40,000 veterans were experienc<strong>in</strong>g<br />
homelessness. A majority (62%) were stay<strong>in</strong>g<br />
<strong>in</strong> emergency shelters or transitional hous<strong>in</strong>g<br />
programs.<br />
GOAL<br />
Prevent and end homelessness for<br />
families, youth, and children<br />
• In January 2017, about 185,000 people <strong>in</strong><br />
families with children experienced<br />
homelessness, about 57,000 fewer people than<br />
<strong>in</strong> 2010, a 24 percent decl<strong>in</strong>e.<br />
• Just fewer than 22,000 people were <strong>in</strong> families<br />
with children <strong>in</strong> which the head <strong>of</strong> household<br />
was under the age <strong>of</strong> 25<br />
• More than 40,000 people under the age <strong>of</strong> 25<br />
were unaccompanied youth—that is, homeless<br />
on their own rather than as part <strong>of</strong> a family.<br />
About 36,000 youth between the ages<br />
<strong>of</strong> 18 and 24 were homeless by themselves, as<br />
were about 4,800 youth under the age <strong>of</strong> 18.<br />
GOAL<br />
Set a path to end<strong>in</strong>g all types <strong>of</strong><br />
homelessness<br />
• In January 2017, almost 554,000 people were<br />
homeless on a s<strong>in</strong>gle night, with nearly<br />
two-thirds (65%) found <strong>in</strong> emergency shelters<br />
or transitional hous<strong>in</strong>g programs.<br />
• While the number <strong>of</strong> people experienc<strong>in</strong>g<br />
homelessness <strong>in</strong>creased by just under one<br />
percent between 2016 and 2017, homelessness<br />
has decl<strong>in</strong>ed by more than 83,000 people s<strong>in</strong>ce<br />
2010, a 13 percent reduction. <strong>The</strong> recent<br />
<strong>in</strong>crease <strong>in</strong> homelessness is attributable to an<br />
<strong>in</strong>crease <strong>in</strong> the number <strong>of</strong> <strong>in</strong>dividuals stay<strong>in</strong>g<br />
<strong>in</strong> unsheltered locations <strong>in</strong> major cities.<br />
4
5
About This Report<br />
<strong>The</strong> Department <strong>of</strong> Hous<strong>in</strong>g and Urban<br />
Development (HUD) releases the Annual<br />
Homeless Assessment Report to Congress<br />
(AHAR) <strong>in</strong> two parts. Part 1 provides Po<strong>in</strong>t-<strong>in</strong>-<br />
Time (PIT) estimates, <strong>of</strong>fer<strong>in</strong>g a snapshot <strong>of</strong><br />
homelessness—both sheltered and unsheltered—<br />
on a s<strong>in</strong>gle night. <strong>The</strong> one-night counts are<br />
conducted dur<strong>in</strong>g the last 10 days <strong>of</strong> January each<br />
year. <strong>The</strong> PIT counts also provide an estimate <strong>of</strong><br />
the number <strong>of</strong> people experienc<strong>in</strong>g homelessness<br />
with<strong>in</strong> particular homeless populations, such as<br />
people with chronic patterns <strong>of</strong> homelessness and<br />
veterans experienc<strong>in</strong>g homelessness.<br />
This year serves as the basel<strong>in</strong>e year for<br />
estimates <strong>of</strong> unaccompanied youth, that is,<br />
people under the age <strong>of</strong> 25 who are experienc<strong>in</strong>g<br />
homelessness on their own, not <strong>in</strong> the company<br />
<strong>of</strong> their parent or guardian, and who are not part<br />
<strong>of</strong> a family. Also for the first time this year, Part<br />
1 <strong>of</strong> the AHAR <strong>in</strong>cludes some exam<strong>in</strong>ation <strong>of</strong> the<br />
changes <strong>in</strong> demographic characteristics <strong>of</strong> people<br />
experienc<strong>in</strong>g homelessness.<br />
To understand our nation’s capacity to serve<br />
people who are currently or formerly experienc<strong>in</strong>g<br />
homelessness, this report also provides counts <strong>of</strong><br />
beds <strong>in</strong> emergency shelters, transitional hous<strong>in</strong>g<br />
programs, safe havens, rapid rehous<strong>in</strong>g programs,<br />
permanent supportive hous<strong>in</strong>g programs, and<br />
other permanent hous<strong>in</strong>g.<br />
In 2017, the PIT estimates <strong>of</strong> people experienc<strong>in</strong>g<br />
homelessness <strong>in</strong> sheltered and unsheltered<br />
locations, as well as the number <strong>of</strong> beds available<br />
to serve them, were reported by 399 Cont<strong>in</strong>uums<br />
<strong>of</strong> Care (CoC) nationwide. <strong>The</strong>se 399 CoCs<br />
covered virtually the entire United States. <strong>The</strong><br />
Northern Mariana Islands are the newest CoC<br />
and reported PIT and HIC data for the first time<br />
<strong>in</strong> 2017.<br />
HUD has methodological standards for conduct<strong>in</strong>g<br />
the PIT counts, and CoCs use a variety <strong>of</strong><br />
approved methods to produce the counts. <strong>The</strong><br />
guide for PIT methodologies can be found here:<br />
https://www.hudexchange.<strong>in</strong>fo/resource/4036/<br />
po<strong>in</strong>t-<strong>in</strong>-time-count-methodology-guide. HUD<br />
reviews the data for accuracy and quality prior to<br />
creat<strong>in</strong>g the estimates for this report.<br />
6
Estimates <strong>of</strong> <strong>Homelessness</strong><br />
IN THE UNITED STATES<br />
7
1National Estimates<br />
<strong>Homelessness</strong> <strong>in</strong> the United States<br />
Data source: PIT 2007–2017<br />
EXHIBIT 1.1: PIT Estimates <strong>of</strong> People<br />
Experienc<strong>in</strong>g <strong>Homelessness</strong><br />
By Sheltered Status, 2007–2017<br />
647,258 639,784 630,227 637,077 623,788 621,553<br />
590,364 576,450 564,708 549,928 553,742<br />
391,401 386,361 403,308 403,543 392,316 390,155 394,698 401,051 391,440 373,571 360,867<br />
255,857 253,423<br />
226,919 233,534 231,472 231,398<br />
195,666<br />
175,399 173,268 176,357 192,875<br />
2007 2008 2009 2010 2011 2012 2013 2014 2015 2016 2017<br />
All Homeless People<br />
Sheltered People<br />
Unsheltered People<br />
On a S<strong>in</strong>gle Night <strong>in</strong> January 2017<br />
• 553,742 people were experienc<strong>in</strong>g<br />
homelessness <strong>in</strong> the United States.<br />
• Most (65% or 360,867 people) were stay<strong>in</strong>g<br />
<strong>in</strong> emergency shelters or transitional hous<strong>in</strong>g<br />
programs, while 35 percent (192,875 people)<br />
were stay<strong>in</strong>g <strong>in</strong> unsheltered locations.<br />
• Two <strong>in</strong> three people experienc<strong>in</strong>g<br />
homelessness (67%) were adults <strong>in</strong> households<br />
without children. <strong>The</strong> rema<strong>in</strong><strong>in</strong>g 33 percent <strong>of</strong><br />
people experienc<strong>in</strong>g homelessness did so as<br />
part <strong>of</strong> a family.<br />
• For every 10,000 people <strong>in</strong> the United States, 17<br />
were experienc<strong>in</strong>g homelessness.<br />
Demographic Characteristics<br />
• In 2017, over one-fifth <strong>of</strong> people experienc<strong>in</strong>g<br />
homelessness were children (21% or 114,829),<br />
70 percent were over the age <strong>of</strong> 24, and ten<br />
percent were between the ages <strong>of</strong> 18 and 24.<br />
• Children rarely were unsheltered. N<strong>in</strong>e <strong>in</strong> ten<br />
children experienc<strong>in</strong>g homelessness were<br />
stay<strong>in</strong>g <strong>in</strong> emergency shelters or transitional<br />
hous<strong>in</strong>g programs.<br />
• Just under 61 percent <strong>of</strong> people experienc<strong>in</strong>g<br />
homelessness (335,038 people) were men, and<br />
39 percent (215,709 people) were women. Fewer<br />
than one percent were either transgender<br />
(2,092) or did not identify as male, female, or<br />
transgender (903).<br />
• Gender varied by sheltered status. People<br />
stay<strong>in</strong>g <strong>in</strong> unsheltered locations were more<br />
likely to be men (71%), while people stay<strong>in</strong>g<br />
<strong>in</strong> emergency shelters or transitional hous<strong>in</strong>g<br />
programs were somewhat more likely to be<br />
women (55%).<br />
• Nearly half <strong>of</strong> all people experienc<strong>in</strong>g<br />
homelessness identified their race as white<br />
(47% or 260,979 people). Most other people<br />
experienc<strong>in</strong>g homelessness identified as<br />
African American (41% or 224,937 people).<br />
Seven percent (35,745 people) <strong>of</strong> people<br />
experienc<strong>in</strong>g homelessness identified<br />
themselves as multiracial. One <strong>in</strong> five people<br />
experienc<strong>in</strong>g homelessness (22% or 119,419<br />
people) was Hispanic or Lat<strong>in</strong>o.<br />
• Demographic characteristics varied by<br />
sheltered status. For example, people<br />
experienc<strong>in</strong>g homelessness <strong>in</strong> unsheltered<br />
locations were more likely to be white (55%)<br />
than people <strong>in</strong> sheltered locations (43%). By<br />
comparison, people <strong>in</strong> sheltered locations were<br />
more likely to be African American (46%) than<br />
people <strong>in</strong> unsheltered locations (30%).<br />
EXHIBIT 1.2: <strong>Homelessness</strong><br />
By Household Type and Sheltered Status, 2017<br />
People <strong>in</strong><br />
Families,<br />
Unsheltered<br />
People <strong>in</strong><br />
Families,<br />
Sheltered<br />
3%<br />
35% Unsheltered<br />
30%<br />
32%<br />
35%<br />
Individuals,<br />
Sheltered<br />
65% Sheltered<br />
Individuals,<br />
Unsheltered<br />
8
<strong>The</strong> 2017 Annual Homeless Assessment Report to Congress: Part 1<br />
EXHIBIT 1.3: Demographic Characteristics <strong>of</strong> People Experienc<strong>in</strong>g <strong>Homelessness</strong><br />
2017<br />
All Homeless People Sheltered People Unsheltered People<br />
# % # % # %<br />
Total 553,742 100 360,867 100 192,875 100<br />
Age<br />
Under 18 114,829 20.7 103,289 28.6 11,540 6.0<br />
18 to 24 53,438 9.7 31,742 8.8 21,696 11.2<br />
Over 24 385,475 69.6 225,836 62.6 159,639 82.8<br />
Gender<br />
Female 215,709 39.0 160,606 44.5 55,103 28.6<br />
Male 335,038 60.5 198,935 55.1 136,103 70.6<br />
Transgender 2,092 0.4 1,100 0.3 992 0.5<br />
Does not identify<br />
as male, female or<br />
transgender<br />
Ethnicity<br />
903 0.2 226 0.1 677 0.4<br />
Non-Hispanic 434,323 78.4 285,867 79.2 148,456 77.0<br />
Hispanic 119,419 21.6 75,000 20.8 44,419 23.0<br />
Race<br />
White 260,979 47.1 154,489 42.8 106,490 55.2<br />
African American 224,937 40.6 167,489 46.4 57,448 29.8<br />
Asian 6,760 1.2 3,703 1.0 3,057 1.6<br />
Native American 16,796 3.0 8,724 2.4 8,072 4.2<br />
Pacific Islander 8,525 1.5 4,485 1.2 4,040 2.1<br />
Multiple Races 35,745 6.5 21,977 6.1 13,768 7.1<br />
EXHIBIT 1.4: Change <strong>in</strong> Number <strong>of</strong> People Experienc<strong>in</strong>g <strong>Homelessness</strong><br />
2007–2017<br />
Change 2016–2017 Change 2010–2017 Change 2007–2017<br />
# % # % # %<br />
Total 3,814 0.7 -83,335 -13.1 -93,516 -14.4<br />
Sheltered People -12,704 -3.4 -42,676 -10.6 -30,534 -7.8<br />
Unsheltered People 16,518 9.4 -40,659 -17.4 -62,982 -24.6<br />
9
1National Estimates<br />
<strong>Homelessness</strong> <strong>in</strong> the United States<br />
Data source: PIT 2007–2017<br />
EXHIBIT 1.5: Change <strong>in</strong> <strong>Homelessness</strong><br />
By Age and Sheltered Status, 2016–2017<br />
All Homeless<br />
People<br />
Sheltered<br />
People<br />
Unsheltered<br />
People<br />
# % # % # %<br />
Total 3,814 0.7% -12,704 -3.4% 16,518 9.4%<br />
Under 18 -5,990 -5.0% -5,577 -5.1% -413 -3.5%<br />
18 to 24 3,437 6.9% -1,539 -4.6% 4,976 29.8%<br />
Over 24 6,367 1.7% -5,588 -2.4% 11,955 8.1%<br />
S<strong>in</strong>ce 2016<br />
• <strong>Homelessness</strong> <strong>in</strong>creased by one percent (or<br />
3,814 people) overall between 2016 and 2017.<br />
• An <strong>in</strong>crease <strong>in</strong> people stay<strong>in</strong>g <strong>in</strong> unsheltered<br />
locations accounts for the entire overall<br />
<strong>in</strong>crease. Although the number <strong>of</strong> people<br />
stay<strong>in</strong>g <strong>in</strong> emergency shelters or transitional<br />
hous<strong>in</strong>g programs decreased for the third<br />
straight year (by 12,704 people, or 3%<br />
between 2016 and 2017), the number <strong>of</strong> people<br />
experienc<strong>in</strong>g homelessness <strong>in</strong> unsheltered<br />
locations <strong>in</strong>creased for a second straight year<br />
(by 16,518 people, or 9% between 2016 and<br />
2017).<br />
• <strong>Homelessness</strong> decl<strong>in</strong>ed among children but<br />
<strong>in</strong>creased among adults, especially younger<br />
adults. <strong>The</strong> number <strong>of</strong> children experienc<strong>in</strong>g<br />
homelessness decl<strong>in</strong>ed by five percent (5,990<br />
people), but homelessness <strong>in</strong>creased by seven<br />
percent (3,437) among those ages 18 to 24 and<br />
by two percent (6,367) among those ages 24<br />
and older.<br />
An <strong>in</strong>crease <strong>in</strong> people stay<strong>in</strong>g <strong>in</strong><br />
unsheltered locations accounted<br />
for the entire <strong>in</strong>crease <strong>in</strong> people<br />
experienc<strong>in</strong>g homelessness<br />
between 2016 and 2017.<br />
• <strong>Homelessness</strong> decl<strong>in</strong>ed among women but<br />
<strong>in</strong>creased among both men and people<br />
identify<strong>in</strong>g as transgender. <strong>The</strong> number <strong>of</strong><br />
women experienc<strong>in</strong>g homelessness decl<strong>in</strong>ed<br />
by one percent (1,559 people), while the<br />
number <strong>of</strong> men <strong>in</strong>creased by one percent (4,148<br />
people) and the number <strong>of</strong> transgender people<br />
experienc<strong>in</strong>g homelessness <strong>in</strong>creased by 18<br />
percent (or 322 people).<br />
• <strong>The</strong> number <strong>of</strong> people experienc<strong>in</strong>g<br />
homelessness who identified as Hispanic or<br />
Lat<strong>in</strong>o decl<strong>in</strong>ed between 2016 and 2017, by<br />
two percent overall (or 1,880 people) and by<br />
14 percent for sheltered people (or 12,141).<br />
However, the number <strong>of</strong> people who were<br />
Hispanic and stay<strong>in</strong>g <strong>in</strong> unsheltered locations<br />
<strong>in</strong>creased by 30 percent (or 10,261 people)<br />
between 2016 and 2017.<br />
• <strong>The</strong> number <strong>of</strong> people experienc<strong>in</strong>g<br />
homelessness <strong>in</strong>creased overall among people<br />
who identified as African American (by 5%),<br />
and decl<strong>in</strong>ed slightly among people who<br />
identified as white (by 2%).<br />
• <strong>The</strong> number <strong>of</strong> people experienc<strong>in</strong>g<br />
homelessness <strong>in</strong> unsheltered locations <strong>in</strong>creased<br />
for all racial groups except for those who identify<br />
as Pacific Islander or multi-racial. <strong>The</strong> largest<br />
<strong>in</strong>creases were among people who identified as<br />
Asian (44%) and African American (23%).<br />
S<strong>in</strong>ce 2007<br />
• <strong>Homelessness</strong> decl<strong>in</strong>ed by 14 percent (93,516<br />
people) overall between 2007 and 2017.<br />
• Despite the <strong>in</strong>crease <strong>in</strong> people experienc<strong>in</strong>g<br />
homelessness <strong>in</strong> unsheltered locations between<br />
2016 and 2017, the decl<strong>in</strong>e <strong>in</strong> homelessness<br />
over the longer period, 2007-2017, reflected<br />
the large decreases among people stay<strong>in</strong>g<br />
<strong>in</strong> unsheltered locations. <strong>The</strong> number <strong>of</strong><br />
unsheltered people decl<strong>in</strong>ed by 25 percent<br />
(62,982 people) over the ten-year period, while<br />
the number stay<strong>in</strong>g <strong>in</strong> emergency shelters or<br />
transitional hous<strong>in</strong>g programs decl<strong>in</strong>ed by<br />
eight percent (30,534 people).<br />
10
<strong>The</strong> 2017 Annual Homeless Assessment Report to Congress: Part 1<br />
11
1State Estimates<br />
<strong>Homelessness</strong> <strong>in</strong> the United States<br />
Data source: PIT 2007–2017; Excludes Puerto Rico and U.S. territories<br />
On a S<strong>in</strong>gle Night <strong>in</strong> January 2017<br />
• Half <strong>of</strong> all people experienc<strong>in</strong>g homelessness<br />
did so <strong>in</strong> one <strong>of</strong> five states: California (25%<br />
or 134,278 people); New York (16% or 89,503<br />
people); Florida (6% or 32,190 people); Texas<br />
(4% or 23,548 people); or Wash<strong>in</strong>gton (4% or<br />
21,112 people).<br />
• California and New York, the states with<br />
the largest numbers <strong>of</strong> people experienc<strong>in</strong>g<br />
homelessness, also had high rates <strong>of</strong><br />
homelessness, 34 and 45 people per 10,000,<br />
compared to the national average <strong>of</strong> 17 people<br />
per 10,000. Wash<strong>in</strong>gton and Massachusetts<br />
also had high rates (29 and 26 people per<br />
10,000). While Florida and Texas had among<br />
the highest numbers <strong>of</strong> people experienc<strong>in</strong>g<br />
homelessness, they had rates lower than the<br />
national average.<br />
• California accounted for nearly half <strong>of</strong> all<br />
unsheltered people <strong>in</strong> the country <strong>in</strong> 2017<br />
(49% or 91,642 people). Florida had the second<br />
highest share <strong>of</strong> the unsheltered homeless<br />
population <strong>in</strong> the U.S., with eight percent<br />
(15,079 people).<br />
• In four states, more than half <strong>of</strong> all people<br />
experienc<strong>in</strong>g homelessness lived <strong>in</strong><br />
unsheltered locations: California (68%), Nevada<br />
(58%), Oregon (57%), and Hawaii (53%).<br />
• In two states, fewer than five percent <strong>of</strong> all<br />
people experienc<strong>in</strong>g homelessness did so<br />
without shelter. In Iowa, just four percent<br />
<strong>of</strong> people experienc<strong>in</strong>g homelessness were<br />
unsheltered (104 people), while <strong>in</strong> Nebraska,<br />
just under five percent <strong>of</strong> people experienc<strong>in</strong>g<br />
homelessness were unsheltered (120 people).<br />
EXHIBIT 1.6: Estimates <strong>of</strong> Homeless People<br />
By State, 2017<br />
WA<br />
21,112<br />
MT<br />
1,529<br />
OR<br />
13,953 ID<br />
2,037<br />
WY<br />
873<br />
NV<br />
7,833 UT<br />
2,852 CO<br />
10,940<br />
CA<br />
134,278<br />
AZ NM<br />
8,947 2,482<br />
AK<br />
1,845<br />
ME, 2,280<br />
ND<br />
VT, 1,225<br />
1,089 MN<br />
NH, 1,456<br />
7,668<br />
NY MA, 17,565<br />
SD<br />
WI<br />
943<br />
5,027 MI<br />
89,503 RI, 1,180<br />
9,051<br />
CT, 3,388<br />
IA<br />
PA<br />
NE 2,756 IL OH 14,138 NJ, 8,536<br />
2,501<br />
10,798 IN 10,095<br />
DE, 994<br />
5,438 WV MD, 7,247<br />
VA<br />
KS MO<br />
KY 1,309 6,067<br />
DC, 7,473<br />
2,287 6,037 4,025<br />
NC, 8,962<br />
Share <strong>of</strong> Homeless Population<br />
OK<br />
TN, 8,309<br />
AR<br />
4,199<br />
SC<br />
Less than 1%<br />
2,467<br />
3,916<br />
MS AL<br />
1%–2.9%<br />
GA<br />
1,472 3,793<br />
TX<br />
10,174<br />
3%–6%<br />
23,548 LA<br />
Greater than 6%<br />
3,305<br />
FL 32,190<br />
HI<br />
7,220<br />
12
<strong>The</strong> 2017 Annual Homeless Assessment Report to Congress: Part 1<br />
EXHIBIT 1.7: States with the Highest and Lowest Rates <strong>of</strong> Unsheltered People<br />
Experienc<strong>in</strong>g <strong>Homelessness</strong><br />
2017<br />
Highest Rates<br />
CALIFORNIA<br />
NEVADA<br />
OREGON<br />
HAWAII<br />
MISSISSIPPI<br />
68.2%<br />
58.4%<br />
57.1%<br />
52.6%<br />
48.8%<br />
134,278 Homeless<br />
91,642 Unsheltered<br />
7,883 Homeless<br />
4,578 Unsheltered<br />
13,953 Homeless<br />
7,967 Unsheltered<br />
7,220 Homeless<br />
3,800 Unsheltered<br />
1,472 Homeless<br />
719 Unsheltered<br />
Lowest Rates<br />
IOWA<br />
NEBRASKA<br />
NEW YORK<br />
MASSACH<strong>US</strong>ETTS<br />
RHODE ISLAND<br />
3.8%<br />
4.8%<br />
5.1%<br />
5.6%<br />
5.8%<br />
2,756 Homeless<br />
104 Unsheltered<br />
2,501 Homeless<br />
120 Unsheltered<br />
89,503 Homeless<br />
4,555 Unsheltered<br />
17,565 Homeless<br />
991 Unsheltered<br />
1,180 Homeless<br />
69 Unsheltered<br />
EXHIBIT 1.8: Largest Changes <strong>in</strong> <strong>Homelessness</strong> by State<br />
By State, 2007–2017<br />
2016–2017 2007–2017<br />
Largest Increases<br />
CALIFORNIA 16,136 / 13.7% NEW YORK 26,902 / 43.0%<br />
NEW YORK 3,151 / 3.6% MASSACH<strong>US</strong>ETTS 2,438 / 16.1%<br />
OREGON 715 / 5.4% DISTRICT OF COLUMBIA 2,153 / 40.5%<br />
NEVADA 435 / 5.9% HAWAII 1,150 / 18.9%<br />
TEXAS 426 / 1.8% MONTANA 379 / 33.0%<br />
Largest Decreases<br />
GEORGIA -2,735 / -21.2% TEXAS -16,240 / -40.8%<br />
MASSACH<strong>US</strong>ETTS -2,043 / -10.4% FLORIDA -15,879 / -33.0%<br />
FLORIDA -1,369 / -4.1% GEORGIA -9,465 / -48.2%<br />
PENNSYLVANIA -1,201 / -7.8% NEW JERSEY -8,778 / -50.7%<br />
SOUTH CAROLINA -1,135 / -22.5% ARIZONA -5,699 / -38.9%<br />
a<br />
Due to methodological changes, Colorado, North Dakota, South Dakota, Michigan, and Wyom<strong>in</strong>g were excluded from the list <strong>of</strong> largest<br />
decreases from 2007-2017.<br />
13
1State Estimates<br />
<strong>Homelessness</strong> <strong>in</strong> the United States<br />
Changes Over Time<br />
• <strong>The</strong> number <strong>of</strong> people experienc<strong>in</strong>g<br />
homelessness decl<strong>in</strong>ed <strong>in</strong> 30 states and<br />
the District <strong>of</strong> Columbia between 2016 and<br />
2017. <strong>The</strong> largest absolute decreases were <strong>in</strong><br />
Georgia (2,735 fewer people), Massachusetts<br />
(2,043 fewer people), and Florida (1,369 fewer<br />
people). <strong>The</strong> largest percentage decreases were<br />
<strong>in</strong> South Carol<strong>in</strong>a (23%), Georgia (21%), and<br />
Louisiana (17%).<br />
• <strong>The</strong> number <strong>of</strong> people experienc<strong>in</strong>g<br />
homelessness <strong>in</strong>creased <strong>in</strong> 20 states between<br />
2016 and 2017. <strong>The</strong> largest absolute <strong>in</strong>creases<br />
were <strong>in</strong> California (16,136 people), New York<br />
(3,151 people), and Oregon (715 people). <strong>The</strong><br />
largest percentage <strong>in</strong>creases were <strong>in</strong> North<br />
Dakota (18%), California (14%), New Mexico<br />
(10%), and Vermont (10%).<br />
• <strong>The</strong> number <strong>of</strong> people experienc<strong>in</strong>g<br />
homelessness decl<strong>in</strong>ed <strong>in</strong> 36 states between<br />
2007 and 2017. <strong>The</strong> largest decreases were<br />
<strong>in</strong> Texas (16,240 fewer people or 41%), Florida<br />
(15,879 people or 33%), and Georgia (9,465<br />
people or 48%).<br />
• <strong>The</strong> number <strong>of</strong> people experienc<strong>in</strong>g<br />
homelessness <strong>in</strong>creased <strong>in</strong> 14 states, plus<br />
the District <strong>of</strong> Columbia, between 2007 and<br />
2017. <strong>The</strong> largest absolute <strong>in</strong>creases were<br />
<strong>in</strong> New York (26,902 more people or 43%),<br />
Massachusetts (2,438 people or 16%), and the<br />
District <strong>of</strong> Columbia (2,153 people or 41%).<br />
Despite a national <strong>in</strong>crease<br />
between 2016 and 2017, the<br />
number <strong>of</strong> people experienc<strong>in</strong>g<br />
homelessness decl<strong>in</strong>ed <strong>in</strong> 30 states<br />
and the District <strong>of</strong> Columbia dur<strong>in</strong>g<br />
that time period.<br />
14
<strong>The</strong> 2017 Annual Homeless Assessment Report to Congress: Part 1<br />
15
1Estimates by CoC<br />
<strong>Homelessness</strong> <strong>in</strong> the United States<br />
Data source: PIT 2007–2017; Excludes Puerto Rico and U.S. territories<br />
Cont<strong>in</strong>uums <strong>of</strong> Care (CoC) Were Divided<br />
<strong>in</strong>to Three Geographic Categories 1<br />
Major city CoCs (n=48) cover the 50 largest<br />
cities <strong>in</strong> the United States. In two cases (Phoenix<br />
and Mesa, AZ, and Arl<strong>in</strong>gton and Fort Worth, TX),<br />
two large cities were located <strong>in</strong> the same CoC.<br />
Smaller city, county, and regional CoCs (n=306)<br />
are jurisdictions that are neither one <strong>of</strong> the 50<br />
largest cities <strong>in</strong> the United States nor Balance <strong>of</strong><br />
State or Statewide CoCs.<br />
Balance <strong>of</strong> State (BoS) or statewide CoCs<br />
(n=40) are typically composed <strong>of</strong> multiple rural<br />
counties or represent an entire state.<br />
On a S<strong>in</strong>gle Night <strong>in</strong> January 2017<br />
• Nearly one <strong>of</strong> every four people experienc<strong>in</strong>g<br />
homelessness did so <strong>in</strong> New York City or<br />
Los Angeles. Nearly all people experienc<strong>in</strong>g<br />
homelessness <strong>in</strong> New York City were sheltered<br />
(95%). By comparison, only 25 percent <strong>of</strong> those<br />
experienc<strong>in</strong>g homelessness <strong>in</strong> Los Angeles<br />
were sheltered <strong>in</strong> 2017.<br />
• Some <strong>of</strong> the most populous major cities were<br />
not among those with the largest homeless<br />
populations. Chicago, Houston, and Phoenix<br />
were among the five largest cities <strong>in</strong> the<br />
country but were not among the cities with<br />
the largest numbers <strong>of</strong> people experienc<strong>in</strong>g<br />
homelessness. In contrast, Seattle was the 18th<br />
largest city <strong>in</strong> the country but had the third<br />
largest homeless population. <strong>The</strong> District <strong>of</strong><br />
Columbia was 21st <strong>in</strong> total population and had<br />
the fifth largest homeless population.<br />
• In two major city CoCs, fewer than five percent<br />
<strong>of</strong> all people experienc<strong>in</strong>g homelessness did<br />
so without shelter. Those CoCs were: Omaha/<br />
Council Bluffs (4% or 57 people) and Boston<br />
(3% or 186 people). In three major city CoCs, all<br />
<strong>in</strong> California, more than 70 percent <strong>of</strong> people<br />
experienc<strong>in</strong>g homelessness were unsheltered.<br />
Those were: Fresno/Madera County (76%), Los<br />
Angeles (75%), and San Jose/Santa Clara (74%).<br />
1 5 CoCs located <strong>in</strong> Puerto Rico, Virg<strong>in</strong> Islands, Guam, and<br />
Northern Mariana Islands were excluded from CoC-level analysis.<br />
EXHIBIT 1.9: Percent <strong>of</strong> People Experienc<strong>in</strong>g<br />
<strong>Homelessness</strong><br />
By CoC Category and Sheltered Status, 2017<br />
Total Homeless<br />
Population<br />
Sheltered<br />
Population<br />
Unsheltered<br />
Population<br />
0% 100%<br />
Major Cities<br />
51.5<br />
50.8<br />
52.9 34.2<br />
Smaller City, County, and Regional CoCs<br />
Balance <strong>of</strong> State and Statewide CoCs<br />
34.9 13.6<br />
35.2<br />
14.0<br />
12.9<br />
Changes Over Time<br />
• <strong>The</strong> number <strong>of</strong> all people experienc<strong>in</strong>g<br />
homelessness <strong>in</strong>creased <strong>in</strong> major cities and<br />
decreased elsewhere between 2016 and<br />
2017. <strong>The</strong> number <strong>of</strong> people experienc<strong>in</strong>g<br />
homelessness <strong>in</strong> major cities <strong>in</strong>creased by just<br />
over five percent (13,922 people) between 2016<br />
and 2017, driv<strong>in</strong>g the <strong>in</strong>crease <strong>in</strong> homelessness<br />
nationwide. More specifically, <strong>in</strong>creases <strong>in</strong><br />
unsheltered homelessness <strong>in</strong> major cities<br />
drove the national <strong>in</strong>crease, with 17,139 more<br />
unsheltered people <strong>in</strong> those CoCs (an <strong>in</strong>crease<br />
<strong>of</strong> 21%).<br />
• <strong>The</strong> number <strong>of</strong> people who experienced<br />
homelessness decreased by three percent<br />
(6,386 fewer people) <strong>in</strong> smaller cities, counties,<br />
and regional CoCs, and by four percent (3,308<br />
fewer people) <strong>in</strong> balance <strong>of</strong> state (BoS) and<br />
statewide CoCs.<br />
• In addition to <strong>in</strong>creas<strong>in</strong>g <strong>in</strong> major cities, the<br />
number <strong>of</strong> people experienc<strong>in</strong>g homelessness<br />
without shelter also <strong>in</strong>creased <strong>in</strong> smaller cities,<br />
counties, and regional CoCs between 2016 and<br />
2017, but the number <strong>of</strong> unsheltered homeless<br />
people decl<strong>in</strong>ed <strong>in</strong> BoS and statewide CoCs.<br />
• <strong>The</strong> number <strong>of</strong> people experienc<strong>in</strong>g<br />
homelessness who stayed <strong>in</strong> emergency<br />
shelters or transitional hous<strong>in</strong>g decreased<br />
across all three categories <strong>of</strong> CoCs between<br />
16
<strong>The</strong> 2017 Annual Homeless Assessment Report to Congress: Part 1<br />
2016 and 2017. <strong>The</strong> number <strong>of</strong> people<br />
experienc<strong>in</strong>g homelessness who stayed <strong>in</strong><br />
emergency shelters or transitional hous<strong>in</strong>g<br />
programs dropped by two percent (3,217 fewer<br />
people) <strong>in</strong> major cities, by three percent (1,624<br />
people) <strong>in</strong> BoS and statewide CoCs, and by<br />
six percent (7,539 people) <strong>in</strong> smaller cities,<br />
counties, and regional CoCs.<br />
• Across the longer time period, 2007-2017,<br />
homelessness decl<strong>in</strong>ed across all comb<strong>in</strong>ations<br />
<strong>of</strong> CoC categories and shelter status, except<br />
for sheltered homelessness <strong>in</strong> major cities,<br />
which <strong>in</strong>creased by four percent. Unsheltered<br />
homelessness <strong>in</strong> major cities decl<strong>in</strong>ed by n<strong>in</strong>e<br />
percent over the same period.<br />
• Unsheltered homelessness <strong>in</strong> smaller cities,<br />
counties, and regional CoCs decl<strong>in</strong>ed by 38<br />
percent between 2007 and 2017.<br />
EXHIBIT 1.10: CoCs with the Largest Numbers <strong>of</strong> People Experienc<strong>in</strong>g <strong>Homelessness</strong><br />
By CoC Category, 2017<br />
CoC<br />
Major City CoCs<br />
Total<br />
Homeless<br />
CoC<br />
Smaller City, County,<br />
and Regional CoCs<br />
Total<br />
Homeless<br />
CoC<br />
Balance <strong>of</strong> State<br />
and Statewide CoCs<br />
Total<br />
Homeless<br />
New York City, NY 76,501 Honolulu, HI 4,959 Texas Balance <strong>of</strong> State 7,153<br />
Los Angeles City & County, CA 55,188<br />
Seattle/K<strong>in</strong>g County, WA 11,643<br />
San Diego City & County, CA 9,160<br />
District <strong>of</strong> Columbia 7,473<br />
San Jose/Santa Clara City &<br />
County, CA<br />
7,394<br />
Santa Ana/Anaheim/Orange<br />
County, CA<br />
Nassau, Suffolk Counties/<br />
Babylon/Islip/ Hunt<strong>in</strong>gton, NY<br />
Sal<strong>in</strong>as/Monterey, San Benito<br />
Counties, CA<br />
Santa Rosa/Petaluma/Sonoma<br />
County, CA<br />
St. Petersburg/Clearwater/<br />
Largo/P<strong>in</strong>ellas County, FL<br />
4,792 Oregon Balance <strong>of</strong> State 5,795<br />
3,937 Wash<strong>in</strong>gton Balance <strong>of</strong> State 4,671<br />
3,364 Colorado Balance <strong>of</strong> State 4,019<br />
2,835 Georgia Balance <strong>of</strong> State 3,716<br />
2,831 Indiana Balance <strong>of</strong> State 3,655<br />
San Francisco, CA 6,858 Pasco County, FL 2,593 Wiscons<strong>in</strong> Balance <strong>of</strong> State 3,348<br />
Las Vegas/Clark County, NV 6,490<br />
Ft Lauderdale/Broward<br />
County, FL<br />
Boston, MA 6,135 Riverside City & County, CA 2,406<br />
2,450 Ohio Balance <strong>of</strong> State 3,309<br />
North Carol<strong>in</strong>a Balance <strong>of</strong><br />
State<br />
Philadelphia, PA 5,693 Spr<strong>in</strong>gfield, MA 2,311 Connecticut Balance <strong>of</strong> State 2,610<br />
3,054<br />
17
1Estimates National by Estimates CoC<br />
<strong>Homelessness</strong> <strong>in</strong> <strong>in</strong> the the United States<br />
Data source: PIT 2007–2017; Excludes Puerto Rico and U.S. territories<br />
EXHIBIT 1.11: CoCs with the Highest and Lowest Rates <strong>of</strong> Unsheltered People<br />
Experienc<strong>in</strong>g <strong>Homelessness</strong><br />
By CoC Category, 2017<br />
Major City CoCs<br />
Smaller City, County,<br />
and Regional CoCs<br />
Balance <strong>of</strong> State<br />
and Statewide CoCs<br />
CoC<br />
Total<br />
Homeless<br />
%<br />
Unsheltered CoC Total<br />
Homeless<br />
%<br />
Unsheltered CoC Total<br />
Homeless<br />
%<br />
Unsheltered<br />
Highest Rates<br />
Fresno/<br />
Madera<br />
County, CA<br />
2,016 75.8<br />
Inyo, Mono,<br />
Alp<strong>in</strong>e<br />
Counties, CA<br />
121 95.9<br />
Oklahoma<br />
Balance <strong>of</strong><br />
State<br />
432 67.8<br />
Los Angeles<br />
City &<br />
County, CA<br />
55,188 74.7 Pasco<br />
County, FL<br />
2,593 93.1<br />
Hawaii<br />
Balance <strong>of</strong><br />
State<br />
2,261 65.3<br />
San Jose/<br />
Santa Clara<br />
City &<br />
County, CA<br />
7,394 73.7<br />
Lake County,<br />
CA<br />
401 93.0<br />
Oregon<br />
Balance <strong>of</strong><br />
State<br />
5,795 65.0<br />
Oakland/<br />
Alameda<br />
County, CA<br />
Las Vegas/<br />
Clark<br />
County, NV<br />
5,629 68.6<br />
Fort Pierce/<br />
St. Lucie,<br />
Indian River,<br />
Mart<strong>in</strong><br />
Counties , FL<br />
6,490 67.1 Imperial<br />
County, CA<br />
1,732 89.4<br />
1,154 88.9<br />
Colorado<br />
Balance <strong>of</strong><br />
State<br />
Nevada<br />
Balance <strong>of</strong><br />
State<br />
4,019 62.4<br />
237 61.2<br />
Boston, MA 6,135 3.0 Lenawee<br />
County, MI<br />
128 0.0<br />
Nebraska<br />
Balance <strong>of</strong><br />
State<br />
506 2.8<br />
Omaha/<br />
Council<br />
Bluffs, NE<br />
1,389 4.1<br />
Sioux City/<br />
Dakota,<br />
Woodbury<br />
Counties, IA<br />
288 0.7<br />
Iowa Balance<br />
<strong>of</strong> State<br />
1,792 2.8<br />
New York<br />
City, NY<br />
76,501 5.1 Cl<strong>in</strong>ton<br />
County, NY<br />
126 0.8<br />
Wiscons<strong>in</strong><br />
Balance <strong>of</strong><br />
State<br />
3,348 4.1<br />
Memphis/<br />
Shelby<br />
County, TN<br />
Indianapolis,<br />
IN<br />
1,426 5.5<br />
Northwest<br />
M<strong>in</strong>nesota,<br />
MN<br />
1,783 7.1 Sullivan<br />
County, NY<br />
288 1.0 Delaware<br />
Statewide<br />
167 1.2<br />
Rhode Island<br />
Statewide<br />
994 5.8<br />
1,180 5.8<br />
18
<strong>The</strong> 2017 Annual Homeless Assessment Report to Congress: Part 1<br />
EXHIBIT 1.12: People Experienc<strong>in</strong>g <strong>Homelessness</strong><br />
By CoC Category and Sheltered Status, 2007–2017<br />
200000<br />
175,911<br />
183,873<br />
177,768<br />
184,089<br />
190,151<br />
182,759<br />
Major Cities, Sheltered<br />
150000<br />
155,291 155,569 155,291<br />
150,647<br />
143,781<br />
Major Cities, Unsheltered<br />
126,634<br />
Smaller Cities, Counties, and<br />
Regional CoCs, Sheltered<br />
100000<br />
50000<br />
110,024<br />
103,329<br />
58,656<br />
38,454<br />
102,589<br />
99,952<br />
77,970 80,837<br />
62,283<br />
57,865<br />
46,898<br />
42,314<br />
84,007<br />
75,310<br />
58,313<br />
32,117<br />
99,732<br />
77,563<br />
65,728 64,525<br />
50,276<br />
55,915<br />
25,435 24,386<br />
Smaller Cities, Counties, and<br />
Regional CoCs, Unsheltered<br />
Balance <strong>of</strong> State and<br />
Statewide CoCs, Sheltered<br />
Balance <strong>of</strong> State and<br />
Statewide CoCs, Unsheltered<br />
0<br />
2007 2009 2011 2013 2015 2017<br />
EXHIBIT 1.13: Change <strong>in</strong> Numbers <strong>of</strong> People Experienc<strong>in</strong>g <strong>Homelessness</strong><br />
By Sheltered Status and CoC Category, 2016–2017<br />
Total Change Sheltered Change Unsheltered Change<br />
# % # % # %<br />
Major Cities 13,922 5.2 -3,217 -1.7 17,139 20.8<br />
Smaller Cities, Counties, and<br />
Regional CoCs<br />
-6,386 -3.2 -7,539 -5.6 1,153 1.8<br />
Balance <strong>of</strong> State and Statewide CoCs -3,308 -4.2 -1,624 -3.1 -1,684 -6.5<br />
19
2National 1National Estimates<br />
Homeless Individuals<br />
<strong>Homelessness</strong> <strong>in</strong> the United States<br />
Data source: PIT 2007–2017<br />
EXHIBIT 2.1: PIT Estimates <strong>of</strong><br />
Homeless Individuals<br />
By Sheltered Status, 2007–2017<br />
647,258<br />
639,784 630,227 637,077 623,788 621,553<br />
590,364<br />
576,450<br />
564,708<br />
549,928 533,742<br />
412,700 404,525 392,131 395,140 387,613 382,156 368,174 360,189 358,422 355,212 369,081<br />
213,073 204,855 215,995 212,218 205,834 199,159 203,127 209,148 205,616 198,008 193,144<br />
199,627 199,670<br />
176,136 182,922 181,779 182,997<br />
165,047<br />
151,041 152,806 157,204<br />
175,937<br />
2007 2008 2009 2010 2011 2012 2013 2014 2015 2016 2017<br />
All Homeless People<br />
Total Individuals<br />
Sheltered Individuals<br />
Unsheltered Individuals<br />
On a S<strong>in</strong>gle Night <strong>in</strong> January 2017<br />
• <strong>The</strong>re were 369,081 people experienc<strong>in</strong>g<br />
homelessness <strong>in</strong> households without children,<br />
represent<strong>in</strong>g 67 percent <strong>of</strong> the total homeless<br />
population.<br />
• Almost half <strong>of</strong> all people experienc<strong>in</strong>g<br />
homelessness as <strong>in</strong>dividuals were stay<strong>in</strong>g <strong>in</strong><br />
unsheltered locations, 48 percent or 175,937<br />
people.<br />
• Women made up a somewhat greater share <strong>of</strong><br />
sheltered <strong>in</strong>dividuals (30%) than <strong>of</strong> unsheltered<br />
<strong>in</strong>dividuals (26%).<br />
• Across both sheltered and unsheltered people<br />
experienc<strong>in</strong>g homelessness as <strong>in</strong>dividuals,<br />
19 percent identified themselves as Hispanic<br />
or Lat<strong>in</strong>o. <strong>The</strong>y were much more likely to<br />
be stay<strong>in</strong>g <strong>in</strong> unsheltered locations than<br />
<strong>in</strong> shelters. Almost a quarter unsheltered<br />
<strong>in</strong>dividuals were Hispanic (23%) compared<br />
to just 15 percent <strong>of</strong> sheltered <strong>in</strong>dividuals<br />
identify<strong>in</strong>g as Hispanic.<br />
• Just over half <strong>of</strong> people experienc<strong>in</strong>g<br />
homelessness as <strong>in</strong>dividuals were white (52%<br />
or 192,671 people). An even higher percentage<br />
<strong>of</strong> unsheltered homeless <strong>in</strong>dividuals were<br />
white (55% or 96,448 people, while African<br />
Americans accounted for 36 percent <strong>of</strong> all<br />
homeless <strong>in</strong>dividuals (or 132,399 people) but<br />
only 31 percent <strong>of</strong> unsheltered <strong>in</strong>dividuals (or<br />
53,844 people).<br />
Demographic Characteristics<br />
• Most <strong>in</strong>dividuals experienc<strong>in</strong>g homelessness<br />
(88 percent) were over the age <strong>of</strong> 24. People<br />
between 18 and 24 years old made up just 10<br />
percent <strong>of</strong> homeless <strong>in</strong>dividuals, and only one<br />
percent <strong>of</strong> homeless <strong>in</strong>dividuals were under 18<br />
years old.<br />
• More than seven <strong>in</strong> ten people homeless as<br />
<strong>in</strong>dividuals were men, 71 percent or 262,011<br />
men. <strong>The</strong> rema<strong>in</strong><strong>in</strong>g 29 percent were women<br />
(just over 28 percent or 104,315 women),<br />
transgender, or people who did not identify as<br />
male, female or transgender.<br />
20
<strong>The</strong> 2017 Annual Homeless Assessment Report to Congress: Part 1<br />
EXHIBIT 2.2: Demographic Characteristics <strong>of</strong> Homeless Individuals<br />
2017<br />
Characteristic<br />
All Homeless Individuals Sheltered Individuals Unsheltered Individuals<br />
# % # % # %<br />
Total homeless 369,081 100 193,144 100 175,937 100<br />
Age<br />
Under 18 5,110 1.4 2,329 1.2 2,781 1.6<br />
18 to 24 38,030 10.3 17,891 9.3 20,139 11.4<br />
Over 24 325,941 88.3 172,924 89.5 153,017 87.0<br />
Gender<br />
Female 104,315 28.3 58,017 30.0 46,298 26.3<br />
Male 262,011 71.0 133,964 69.4 128,047 72.8<br />
Transgender 2,007 0.5 1,030 0.5 977 0.6<br />
Other Gender 748 0.2 133 0.1 615 0.3<br />
Ethnicity<br />
Non-Hispanic 299,960 81.3 164,692 85.3 135,268 76.9<br />
Hispanic 69,121 18.7 28,452 14.7 40,669 23.1<br />
Race<br />
White 192,671 52.2 96,223 49.8 96,448 54.8<br />
African American 132,399 35.9 78,555 40.7 53,844 30.6<br />
Asian 4,841 1.3 2,008 1.0 2,833 1.6<br />
Native American 12,248 3.3 4,785 2.5 7,463 4.2<br />
Pacific Islander 4,223 1.1 1,531 0.8 2,692 1.5<br />
Multiple Races 22,699 6.2 10,042 5.2 12,657 7.2<br />
EXHIBIT 2.3: Change <strong>in</strong> Numbers <strong>of</strong> Homeless Individuals<br />
By Sheltered Status, 2007–2017<br />
Change 2016–2017 Change 2010–2017 Change 2007–2017<br />
# % # % # %<br />
Total Homeless Individuals 13,869 3.9 -26,059 -6.6 -43,619 -10.6<br />
Sheltered Individuals -4,864 -2.5 -19,074 -9.0 -19,929 -9.4<br />
Unsheltered Individuals 18,733 11.9 -6,985 -3.8 -23,690 -11.9<br />
EXHIBIT 2.4: Change <strong>in</strong> Numbers <strong>of</strong> Homeless Individuals<br />
By Age and Sheltered Status, 2016-2017<br />
Total Change Sheltered Change Unsheltered Change<br />
# % # % # %<br />
Under 18 997 24.2 -126 -5.1 1,123 67.7<br />
18 to 24 4,179 12.3 -480 -2.6 4,659 30.1<br />
Over 24 8,693 2.7 -4,258 -2.4 12,951 9.2<br />
21
2National 1National Estimates<br />
Homeless Individuals<br />
<strong>Homelessness</strong> <strong>in</strong> the United States<br />
Data source: PIT 2007–2017<br />
S<strong>in</strong>ce 2016<br />
• <strong>The</strong> number <strong>of</strong> people experienc<strong>in</strong>g<br />
homelessness as <strong>in</strong>dividuals—that is, <strong>in</strong><br />
households without children--<strong>in</strong>creased<br />
by four percent (13,869 more <strong>in</strong>dividuals)<br />
between 2016 and 2017. This <strong>in</strong>crease was<br />
driven entirely by an <strong>in</strong>crease <strong>in</strong> the number <strong>of</strong><br />
unsheltered <strong>in</strong>dividuals (a 12% rise). Sheltered<br />
homelessness among <strong>in</strong>dividuals decreased by<br />
4,864 people (or 3%).<br />
• <strong>Homelessness</strong> among <strong>in</strong>dividuals <strong>in</strong>creased<br />
across all age groups. <strong>The</strong> number <strong>of</strong> children<br />
(people under 18) experienc<strong>in</strong>g homelessness<br />
as <strong>in</strong>dividuals <strong>in</strong>creased by 997, the number<br />
<strong>of</strong> people between the ages <strong>of</strong> 18 and 24<br />
<strong>in</strong>creased by 4,179, and the number <strong>of</strong> people<br />
homeless as <strong>in</strong>dividuals over the age <strong>of</strong> 24<br />
<strong>in</strong>creased by 8,693.<br />
• For each age group, <strong>in</strong>creases were driven<br />
entirely by <strong>in</strong>creases <strong>in</strong> the number <strong>of</strong> people<br />
experienc<strong>in</strong>g homelessness <strong>in</strong> unsheltered<br />
locations, while the number <strong>of</strong> sheltered<br />
<strong>in</strong>dividuals decl<strong>in</strong>ed across all age groups.<br />
• For people over the age <strong>of</strong> 24 experienc<strong>in</strong>g<br />
homelessness as <strong>in</strong>dividuals, the unsheltered<br />
number <strong>in</strong>creased by n<strong>in</strong>e percent (12,951<br />
people), while the number <strong>of</strong> those sheltered<br />
decreased by two percent (or 4,258 fewer<br />
people),<br />
<strong>The</strong> <strong>in</strong>crease <strong>in</strong> the number <strong>of</strong><br />
people experienc<strong>in</strong>g homelessness<br />
as <strong>in</strong>dividuals was driven entirely<br />
by an <strong>in</strong>crease <strong>in</strong> the number <strong>of</strong><br />
unsheltered <strong>in</strong>dividuals (a 12% rise).<br />
• <strong>The</strong>re were five percent more women<br />
experienc<strong>in</strong>g homelessness as <strong>in</strong>dividuals <strong>in</strong><br />
2017 than <strong>in</strong> 2016, driven by a 14 percent rise <strong>in</strong><br />
unsheltered women. <strong>The</strong>re were three percent<br />
more men and 11 percent more unsheltered<br />
men. <strong>The</strong> only group for whom the rise <strong>in</strong> the<br />
sheltered number drove an overall <strong>in</strong>crease<br />
was people who identified as transgender (310<br />
more transgender <strong>in</strong>dividuals <strong>in</strong> shelter <strong>in</strong> 2017<br />
than <strong>in</strong> 2016).<br />
• <strong>The</strong> number <strong>of</strong> people experienc<strong>in</strong>g<br />
homelessness as <strong>in</strong>dividuals who identified<br />
as Hispanic or Lat<strong>in</strong>o <strong>in</strong>creased by 14 percent<br />
overall, compared to two percent for non-<br />
Hispanic or Lat<strong>in</strong>o <strong>in</strong>dividuals. Unsheltered<br />
homelessness among Hispanic <strong>in</strong>dividuals<br />
<strong>in</strong>creased at a greater rate than among non-<br />
Hispanic <strong>in</strong>dividuals (by 35% compared<br />
to 6%). At the same time, the Hispanic<br />
population experienced decl<strong>in</strong>es <strong>in</strong> sheltered<br />
homelessness at a greater rate than non-<br />
Hispanic <strong>in</strong>dividuals (a 7% decl<strong>in</strong>e compared to<br />
a 2% decl<strong>in</strong>e).<br />
• <strong>Homelessness</strong> among African American<br />
<strong>in</strong>dividuals <strong>in</strong>creased by six percent overall<br />
(or 7,299 people) and by 27 percent among<br />
the unsheltered population (or 11,399 people).<br />
<strong>Homelessness</strong> among white <strong>in</strong>dividuals<br />
<strong>in</strong>creased by two percent overall (or 2,856<br />
people) and by seven percent among the<br />
unsheltered population (or 5,944 people).<br />
S<strong>in</strong>ce 2007<br />
• Over a longer time period, 2007-2017, <strong>in</strong>dividual<br />
homelessness decl<strong>in</strong>ed by 11 percent (43,619<br />
fewer people). This decl<strong>in</strong>e was comprised<br />
<strong>of</strong> both a decl<strong>in</strong>e <strong>in</strong> the number <strong>of</strong> homeless<br />
<strong>in</strong>dividuals <strong>in</strong> unsheltered locations – which<br />
dropped by 12 percent (23,690 fewer people) –<br />
and <strong>in</strong> sheltered locations, which dropped by<br />
n<strong>in</strong>e percent (or 19,929 people).<br />
22
<strong>The</strong> 2017 Annual Homeless Assessment Report to Congress: Part 1<br />
23
2State 1National Estimates<br />
Homeless Individuals<br />
<strong>Homelessness</strong> <strong>in</strong> the United States<br />
Data source: PIT 2007–2017; Excludes Puerto Rico and U.S. territories<br />
EXHIBIT 2.5: Estimates <strong>of</strong> Homeless Individuals<br />
By State, 2017<br />
AK<br />
1,354<br />
WA<br />
14,781<br />
OR<br />
10,434 ID<br />
1,309<br />
NV<br />
7,281 UT<br />
1,882<br />
CA<br />
112,756<br />
AZ<br />
6,488<br />
MT<br />
987<br />
WY<br />
622<br />
CO<br />
7,571<br />
NM<br />
1,865<br />
ME, 1,352<br />
ND<br />
VT, 697<br />
832 MN<br />
NH, 776<br />
3,899<br />
NY MA, 6,267<br />
SD<br />
WI<br />
611<br />
2,645 MI<br />
37,390 RI, 802<br />
5,628<br />
CT, 2,208<br />
IA<br />
PA<br />
NE 1,500 IL OH 8,271 NJ, 5,433<br />
1,698<br />
6,894 IN 6,688<br />
DE, 615<br />
3,623 WV MD, 5,077<br />
1,032<br />
VA<br />
KS MO<br />
KY 4,028<br />
DC, 3,583<br />
1,423 3,768 3,032<br />
NC, 6,044<br />
Share <strong>of</strong> Homeless Individuals<br />
OK<br />
TN, 6,137<br />
AR<br />
2,824<br />
SC<br />
Less than 1%<br />
2,068 AL 2,896<br />
1%–2.9%<br />
2,985 GA<br />
MS 7,422<br />
3%–6%<br />
TX<br />
1,100<br />
16,708<br />
LA<br />
Greater than 6%<br />
2,559<br />
FL 22,768<br />
HI<br />
4,535<br />
On a S<strong>in</strong>gle Night <strong>in</strong> January 2017<br />
• California accounted for 31 percent <strong>of</strong> all people<br />
experienc<strong>in</strong>g homelessness as <strong>in</strong>dividuals<br />
<strong>in</strong> the United States and 51 percent <strong>of</strong> all<br />
unsheltered <strong>in</strong>dividuals.<br />
• More than half <strong>of</strong> all the nation’s homeless<br />
<strong>in</strong>dividuals were <strong>in</strong> four states: California (31%<br />
or 112,756 people), New York (10% or 37,390<br />
people), Florida (6% or 22,768 people), and<br />
Texas (5% or 16,708).<br />
• In eight states, more than half <strong>of</strong> <strong>in</strong>dividuals<br />
experienc<strong>in</strong>g homelessness were stay<strong>in</strong>g <strong>in</strong><br />
unsheltered locations: California (78%), Hawaii<br />
(72%), Nevada (63%), Oregon (59%), Mississippi,<br />
(59%), Arkansas (55%), Wash<strong>in</strong>gton (54%), and<br />
Florida (52%).<br />
Changes Over Time<br />
• Between 2016 and 2017, the number <strong>of</strong><br />
<strong>in</strong>dividuals experienc<strong>in</strong>g homelessness<br />
<strong>in</strong>creased <strong>in</strong> 22 states. <strong>The</strong> largest absolute<br />
<strong>in</strong>creases were <strong>in</strong> California (15,096 people),<br />
New York (2,075 people), and Colorado (1,121<br />
people). <strong>The</strong> states with the largest percentage<br />
<strong>in</strong>creases were North Dakota (26%), Wyom<strong>in</strong>g<br />
(20%), and New Mexico (20%).<br />
• <strong>The</strong> number <strong>of</strong> homeless <strong>in</strong>dividuals decl<strong>in</strong>ed<br />
between 2016 and 2017 <strong>in</strong> 28 states and the<br />
District <strong>of</strong> Columbia. <strong>The</strong> largest absolute<br />
decl<strong>in</strong>es occurred <strong>in</strong> Georgia (1,843 fewer<br />
people), Florida (1,433 fewer people), and<br />
South Carol<strong>in</strong>a (862 fewer people). <strong>The</strong> largest<br />
percentage decl<strong>in</strong>es were <strong>in</strong> South Carol<strong>in</strong>a<br />
(23%), Georgia (20%), and Louisiana (19%).<br />
• In 23 states, the number <strong>of</strong> <strong>in</strong>dividuals<br />
experienc<strong>in</strong>g homelessness <strong>in</strong>creased between<br />
2007 and 2017. <strong>The</strong> largest <strong>in</strong>crease was <strong>in</strong><br />
New York (9,334 more people), a 33 percent<br />
rise. California and Wash<strong>in</strong>gton also had large<br />
<strong>in</strong>creases (1,804 and 1,492 more people).<br />
• Dur<strong>in</strong>g the same ten-year period, 27 states and<br />
the District <strong>of</strong> Columbia experienced a decl<strong>in</strong>e<br />
<strong>in</strong> the number <strong>of</strong> homeless <strong>in</strong>dividuals. <strong>The</strong><br />
largest decl<strong>in</strong>es were experienced <strong>in</strong> Florida<br />
(10,272), Texas (9,598), and Georgia (5,099).<br />
24
<strong>The</strong> 2017 Annual Homeless Assessment Report to Congress: Part 1<br />
EXHIBIT 2.6: States with the Highest and Lowest Rates <strong>of</strong> Unsheltered Homeless Individuals,<br />
By State, 2017<br />
Highest Rates<br />
CALIFORNIA<br />
HAWAII<br />
NEVADA<br />
OREGON<br />
MISSISSIPPI<br />
77.8%<br />
72.3%<br />
62.6%<br />
58.9%<br />
58.9%<br />
112,756 Homeless<br />
87,743 Unsheltered<br />
4,535 Homeless<br />
3,277 Unsheltered<br />
7,281 Homeless<br />
4,560 Unsheltered<br />
10,434 Homeless<br />
6,141 Unsheltered<br />
1,100 Homeless<br />
648 Unsheltered<br />
Lowest Rates<br />
IOWA<br />
NEBRASKA<br />
MAINE<br />
DELAWARE<br />
RHODE ISLAND<br />
6.9%<br />
7.1%<br />
8.0%<br />
8.5%<br />
8.6%<br />
1,500 Homeless<br />
104 Unsheltered<br />
1,698 Homeless<br />
120 Unsheltered<br />
1,352 Homeless<br />
108 Unsheltered<br />
615 Homeless<br />
52 Unsheltered<br />
802 Homeless<br />
69 Unsheltered<br />
25
2State 1National Estimates<br />
Homeless Individuals<br />
<strong>Homelessness</strong> <strong>in</strong> the United States<br />
Data source: PIT 2007–2017; Excludes Puerto Rico and U.S. territories<br />
EXHIBIT 2.7: Largest Changes <strong>in</strong> Homeless Individuals<br />
By State, 2007–2017<br />
Largest Increases<br />
2016–2017 2007–2017<br />
CALIFORNIA 15,096 / 15.5% NEW YORK 9,334 / 33.3%<br />
NEW YORK 2,075 / 5.9% CALIFORNIA 1,804 / 1.6%<br />
COLORADO 1,121 / 17.4% WASHINGTON 1,492 / 11.2%<br />
OREGON 1,055 / 11.2% HAWAII 1,200 / 36.0%<br />
WASHINGTON 881 / 6.3% NEVADA 804 / 12.4%<br />
Largest Decreases a<br />
GEORGIA -1,843 / -19.9% FLORIDA -10,272 / -31.1%<br />
FLORIDA -1,433 / -5.9% TEXAS -9,598 / -36.5%<br />
SOUTH CAROLINA -862 / -22.9% GEORGIA -5,099 / -40.7%<br />
LOUISIANA -617 / -19.4% NEW JERSEY -3,539 / -39.4%<br />
TENNESSEE -515 / -7.7% ARIZONA -3,532 / -35.2%<br />
a<br />
Due to methodological changes, Michigan was excluded from the list <strong>of</strong> largest decreases from 2007-2016.<br />
26
<strong>The</strong> 2017 Annual Homeless Assessment Report to Congress: Part 1<br />
27
2Estimates 1National Estimates by CoC<br />
Homeless Individuals<br />
<strong>Homelessness</strong> <strong>in</strong> the United States<br />
Data source: PIT 2007–2017; Excludes Puerto Rico and U.S. territories<br />
On a S<strong>in</strong>gle Night <strong>in</strong> January 2017<br />
• Major cities accounted for more than half<br />
<strong>of</strong> all people experienc<strong>in</strong>g homelessness as<br />
<strong>in</strong>dividuals (52% or 282,491 people). Smaller<br />
cities, counties, and regional CoCs accounted<br />
for 35 percent (or 190,077 people), and BoS or<br />
statewide CoCs had 13 percent (46,254 people).<br />
• Three <strong>of</strong> the ten major cities with the<br />
largest numbers <strong>of</strong> <strong>in</strong>dividuals experienc<strong>in</strong>g<br />
homelessness were not also among the cities<br />
with the largest homeless populations overall.<br />
Oakland, Denver, and Phoenix replaced Boston,<br />
Philadelphia, and the District <strong>of</strong> Columbia as<br />
the major cities with the largest numbers <strong>of</strong><br />
homeless <strong>in</strong>dividuals.<br />
• Major cities accounted for a larger share <strong>of</strong> the<br />
national total <strong>of</strong> unsheltered <strong>in</strong>dividuals than <strong>of</strong><br />
sheltered <strong>in</strong>dividuals (56% compared to 48%).<br />
• Three major cities reported that more than<br />
80 percent <strong>of</strong> homeless <strong>in</strong>dividuals were<br />
unsheltered. All three were <strong>in</strong> California:<br />
Fresno (88%), Los Angeles (84%), and San Jose<br />
(82%).<br />
• Of smaller cities, counties, and regional CoCs,<br />
n<strong>in</strong>e reported <strong>in</strong>dividual unsheltered rates<br />
exceed<strong>in</strong>g 90 percent. Two <strong>of</strong> the highest rates<br />
were <strong>in</strong> the CoC abutt<strong>in</strong>g Lake Okeechobee<br />
(Hendry, Hardee, Highlands counties) <strong>in</strong><br />
Florida (98%) and <strong>in</strong> the Inyo, Mono, and Alp<strong>in</strong>e<br />
counties <strong>in</strong> California, which border Nevada<br />
(97%).<br />
• <strong>The</strong> lowest rates <strong>of</strong> unsheltered homeless<br />
<strong>in</strong>dividuals <strong>in</strong> smaller cities, counties, and<br />
regional CoCs were <strong>in</strong> Sioux City/Dakota<br />
Woodbury Counties, IA at one percent and<br />
Sullivan County, NY at two percent.<br />
• <strong>The</strong> Nebraska BoS had the lowest rates <strong>of</strong><br />
unsheltered <strong>in</strong>dividuals, at five percent. Iowa<br />
BoS also reported low rates, at six percent.<br />
EXHIBIT 2.8: Homeless Individuals<br />
By CoC Category and Sheltered Status, 2017<br />
All Homeless<br />
Individuals<br />
Sheltered<br />
Individuals<br />
Unsheltered<br />
Individuals<br />
0% 100%<br />
Major Cities<br />
52.1<br />
48.4<br />
37.6<br />
56.1 32.7<br />
Smaller City, County, and Regional CoCs<br />
Balance <strong>of</strong> State and Statewide CoCs<br />
35.3 12.7<br />
14.1<br />
11.1<br />
Cont<strong>in</strong>uums <strong>of</strong> Care (CoC) Were<br />
Divided <strong>in</strong>to Three Geographic<br />
Categories<br />
Major city CoCs (n=48) cover the 50 largest<br />
cities <strong>in</strong> the United States. In two cases<br />
(Phoenix and Mesa, AZ, and Arl<strong>in</strong>gton and<br />
Fort Worth, TX), two large cities were located<br />
<strong>in</strong> the same CoC.<br />
Smaller city, county, and regional CoCs<br />
(n=306) are jurisdictions that are neither one<br />
<strong>of</strong> the 50 largest cities <strong>in</strong> the United States nor<br />
Balance <strong>of</strong> State and Statewide CoCs.<br />
Balance <strong>of</strong> State (BoS) and statewide CoCs<br />
(n=40) are typically composed <strong>of</strong> multiple<br />
rural counties or represent an entire state.<br />
28
<strong>The</strong> 2017 Annual Homeless Assessment Report to Congress: Part 1<br />
EXHIBIT 2.9: CoCs with the Largest Numbers <strong>of</strong> Homeless Individuals<br />
By CoC Category, 2017<br />
CoC<br />
Major City CoCs<br />
Los Angeles City & County, CA<br />
Total<br />
Individuals<br />
47,082<br />
CoC<br />
Smaller City, County,<br />
and Regional CoCs<br />
Santa Ana/Anaheim/Orange<br />
County, CA<br />
Total<br />
Individuals<br />
CoC<br />
Balance <strong>of</strong> State<br />
and Statewide CoCs<br />
Total<br />
Individuals<br />
3,527 Texas Balance <strong>of</strong> State 4,808<br />
New York City, NY 31,124 Honolulu, HI 3,112 Oregon Balance <strong>of</strong> State 3,902<br />
Seattle/K<strong>in</strong>g County, WA<br />
San Diego City and County, CA<br />
San Jose/Santa Clara City &<br />
County, CA<br />
EXHIBIT 2.10: CoCs with the Highest and Lowest Rates <strong>of</strong> Unsheltered Homeless Individuals<br />
By CoC Category, 2017<br />
CoC<br />
Highest Rates<br />
Fresno/Madera<br />
County, CA<br />
Los Angeles City &<br />
County, CA<br />
San Jose/Santa Clara<br />
City & County, CA<br />
Oakland/Alameda<br />
County, CA<br />
San Diego City &<br />
County, CA<br />
Lowest Rates<br />
Omaha/Council<br />
Bluffs, NE<br />
Major City CoCs<br />
Total<br />
Individuals<br />
8,810<br />
7,571<br />
6,319<br />
Smaller City, County,<br />
and Regional CoCs a<br />
%<br />
Unsheltered CoC Total<br />
Individuals<br />
1,742 87.8<br />
Hendry, Hardee,<br />
Highlands Counties,<br />
FL<br />
Inyo, Mono, Alp<strong>in</strong>e<br />
Counties, CA<br />
Balance <strong>of</strong> State<br />
and Statewide CoCs<br />
%<br />
Unsheltered CoC Total<br />
Individuals<br />
377 97.6<br />
Hawaii Balance<br />
<strong>of</strong> State<br />
47,082 84.3 102<br />
Georgia Balance<br />
97.1<br />
<strong>of</strong> State<br />
6,319 81.5 Lake County, CA 294<br />
Nevada Balance<br />
96.6<br />
<strong>of</strong> State<br />
4,918 78.0<br />
Ft. Walton Beach/<br />
Okaloosa, Walton<br />
Counties, FL<br />
247 94.3 Oklahoma<br />
Balance <strong>of</strong> State<br />
7,571 70.4 Imperial County, CA 1,034 94.2<br />
1,037 5.5<br />
Sioux City/<br />
Dakota, Woodbury<br />
Counties, IA<br />
Oregon Balance<br />
<strong>of</strong> State<br />
159 1.3 Nebraska<br />
Balance <strong>of</strong> State<br />
Boston, MA 2,492 7.5 Sullivan County, NY 114<br />
Iowa Balance <strong>of</strong><br />
1.8<br />
State<br />
Memphis/Shelby<br />
County, TN<br />
915 8.6<br />
Monroe City &<br />
County, MI<br />
122<br />
Ma<strong>in</strong>e Balance<br />
2.5<br />
<strong>of</strong> State<br />
Indianapolis, IN 1,283 9.8 Bergen County, NJ 182 2.7 Delaware<br />
Statewide<br />
New York, NY 31,124 12.6<br />
Somerset County,<br />
NJ<br />
176<br />
Rhode Island<br />
2.8<br />
Statewide<br />
Excludes CoCs with less than 100 total homeless people.<br />
Sal<strong>in</strong>as/Monterey, San Benito<br />
Counties, CA<br />
Santa Rosa/Petaluma/Sonoma<br />
County, CA<br />
St. Petersburg/Clearwater/<br />
Largo/P<strong>in</strong>ellas County, FL<br />
2,719 Wash<strong>in</strong>gton Balance <strong>of</strong> State 2,875<br />
2,509 Colorado Balance <strong>of</strong> State 2,568<br />
2,466 Indiana Balance <strong>of</strong> State 2,340<br />
San Francisco, CA 6,257 Riverside City & County, CA 2,172 Georgia Balance <strong>of</strong> State 2,219<br />
Las Vegas/Clark County, NV<br />
Oakland/Alameda County, CA<br />
Denver, CO<br />
Phoenix/Mesa/Maricopa<br />
County, AZ<br />
Ft. Lauderdale/Broward<br />
6,190<br />
County, FL<br />
Watsonville/Santa Cruz City &<br />
4,918<br />
County, CA<br />
San Bernard<strong>in</strong>o City & County,<br />
4,031<br />
CA<br />
Santa Maria/Santa Barbara<br />
3,805<br />
County, CA<br />
2,037 North Carol<strong>in</strong>a Balance <strong>of</strong> State 1,911<br />
1,846 Ohio Balance <strong>of</strong> State 1,779<br />
1,432 Connecticut Balance <strong>of</strong> State 1,778<br />
1,422 Wiscons<strong>in</strong> Balance <strong>of</strong> State 1,499<br />
%<br />
Unsheltered<br />
1,423 82.8<br />
2,219 76.8<br />
180 75.0<br />
151 72.2<br />
3,902 65.5<br />
276 5.1<br />
807 6.2<br />
1,352 8.0<br />
615 8.5<br />
802 8.6<br />
29
2<br />
Data<br />
1National Estimates Estimates by CoC<br />
Homeless Individuals<br />
<strong>Homelessness</strong> <strong>in</strong> the United States<br />
source: PIT 2007–2017; Excludes Puerto Rico and U.S. territories<br />
Changes Over Time<br />
• Between 2016 and 2017 <strong>in</strong>dividual homelessness<br />
<strong>in</strong>creased by n<strong>in</strong>e percent (15,540 people) <strong>in</strong> the<br />
nation’s major cities. This <strong>in</strong>crease was driven by<br />
a 22 percent <strong>in</strong>crease <strong>in</strong> unsheltered <strong>in</strong>dividuals<br />
(17,663 more people). Los Angeles accounted for<br />
half (8,758) <strong>of</strong> the entire <strong>in</strong>crease <strong>in</strong> unsheltered<br />
<strong>in</strong>dividuals.<br />
• After Los Angeles, New York reported the<br />
second largest <strong>in</strong>crease, with 2,159 more<br />
<strong>in</strong>dividuals experienc<strong>in</strong>g homelessness. This<br />
<strong>in</strong>crease was evenly split between people<br />
stay<strong>in</strong>g <strong>in</strong> sheltered and unsheltered locations.<br />
• Smaller cities, counties, and regional CoCs<br />
saw a slight decl<strong>in</strong>e <strong>in</strong> the number <strong>of</strong> people<br />
experienc<strong>in</strong>g homelessness as <strong>in</strong>dividuals (1%<br />
or 1,253 fewer people) s<strong>in</strong>ce 2016. <strong>The</strong>re was a<br />
three percent decl<strong>in</strong>e <strong>in</strong> the number <strong>of</strong> sheltered<br />
<strong>in</strong>dividuals (2,499 fewer people), which <strong>of</strong>fset a<br />
two percent <strong>in</strong>crease (1,246 more people) <strong>in</strong> the<br />
number <strong>of</strong> unsheltered <strong>in</strong>dividuals.<br />
• In BoS and statewide CoCs, <strong>in</strong>dividual<br />
homelessness from 2016 to 2017 rema<strong>in</strong>ed flat.<br />
• From 2007 to 2017, smaller cities, counties, and<br />
regional CoCs experienced the largest decl<strong>in</strong>es<br />
<strong>in</strong> the number <strong>of</strong> homeless <strong>in</strong>dividuals, with<br />
34,203 fewer people (or 21%). <strong>The</strong> number <strong>of</strong><br />
unsheltered <strong>in</strong>dividuals <strong>in</strong> this CoC category<br />
decl<strong>in</strong>ed by 27 percent (or 21,334) dur<strong>in</strong>g the<br />
same time period.<br />
• BoS and statewide CoCs experienced decl<strong>in</strong>es<br />
<strong>in</strong> homeless <strong>in</strong>dividuals between 2007 and 2017,<br />
with 13 percent fewer homeless <strong>in</strong>dividuals,<br />
n<strong>in</strong>e percent fewer sheltered <strong>in</strong>dividuals, and 17<br />
percent fewer unsheltered <strong>in</strong>dividuals <strong>in</strong> 2017<br />
than <strong>in</strong> 2007.<br />
• <strong>The</strong> number <strong>of</strong> homeless <strong>in</strong>dividuals <strong>in</strong> major<br />
cities <strong>in</strong> 2017 was slightly lower than the number<br />
<strong>of</strong> homeless <strong>in</strong>dividuals <strong>in</strong> 2007 (1% fewer<br />
people). However, <strong>in</strong> recent years the number <strong>of</strong><br />
homeless <strong>in</strong>dividuals, unsheltered <strong>in</strong>dividuals<br />
<strong>in</strong> particular, <strong>in</strong> major cities has risen sharply.<br />
In 2017 there were only two percent more<br />
unsheltered <strong>in</strong>dividuals <strong>in</strong> major cities than there<br />
were <strong>in</strong> 2007 but 47 percent more than there<br />
were <strong>in</strong> 2014, the year after which the number<br />
began to rise.<br />
Between 2016 and 2017, <strong>in</strong>dividual<br />
homelessness <strong>in</strong>creased by n<strong>in</strong>e<br />
percent (15,540 people) <strong>in</strong> the<br />
nation’s major cities. Los Angeles<br />
accounted for 60% <strong>of</strong> this <strong>in</strong>crease.<br />
30
<strong>The</strong> 2017 Annual Homeless Assessment Report to Congress: Part 1<br />
EXHIBIT 2.11: Individuals Experienc<strong>in</strong>g <strong>Homelessness</strong><br />
By CoC Category and Sheltered Status, 2007–2017<br />
120000<br />
Major Cities,<br />
Sheltered<br />
100000<br />
80000<br />
60000<br />
101,432<br />
96,989<br />
92,943 92,602<br />
95,148<br />
85,071 83,568 83,583<br />
80,524<br />
77,091<br />
74,522<br />
77,949<br />
70,731<br />
75,413<br />
73,696<br />
66,338<br />
97,118<br />
78,848<br />
73,420<br />
56,927<br />
97,038<br />
93,039<br />
72,202<br />
56,615<br />
Major Cities,<br />
Unsheltered<br />
Smaller Cities, Counties,<br />
and Regional CoCs,<br />
Sheltered<br />
Smaller Cities, Counties,<br />
and Regional CoCs,<br />
Unsheltered<br />
40000<br />
20000<br />
29,760<br />
23,078<br />
29,775<br />
24,587<br />
28,404<br />
27,104<br />
28,828 28,542<br />
27,013<br />
24,941<br />
19,024 19,241<br />
Balance <strong>of</strong> State and<br />
Statewide CoCs,<br />
Sheltered<br />
Balance <strong>of</strong> State and<br />
Statewide CoCs,<br />
Unsheltered<br />
0<br />
2007 2008 2009 2010 2011 2012 2013 2014 2015 2016 2017<br />
EXHIBIT 2.12: Change <strong>in</strong> Numbers <strong>of</strong> Homeless Individuals<br />
By Sheltered Status and CoC Category, 2016–2017<br />
Total Change Sheltered Change Unsheltered Change<br />
# % # % # %<br />
Major Cities 15,540 8.9 -2,123 -2.2 17,663 22.3<br />
Smaller City, County, and Regional<br />
CoCs<br />
-1,253 -1.0 -2,499 -3.3 1,246 2.3<br />
Balance <strong>of</strong> State and Statewide CoCs -17 0.0 -159 -0.6 142 0.7<br />
31
3National 1National Estimates<br />
<strong>Homelessness</strong> Families <strong>in</strong> the with United Children States<br />
Data source: PIT 2007–2017<br />
EXHIBIT 3.1: PIT Estimates <strong>of</strong> Homeless<br />
People <strong>in</strong> Families with Children<br />
By Sheltered Status, 2007–2017<br />
234,558<br />
238,096 236,175<br />
222,190<br />
241,937<br />
235,259<br />
239,397<br />
206,286<br />
191,325 190,996 216,261 194,716<br />
184,661<br />
181,506<br />
191,571 191,903<br />
178,328<br />
187,313<br />
186,482<br />
185,824175,563167,723<br />
78,535 75,750<br />
78,514 79,442 77,184 77,155<br />
70,957 67,613 64,197 61,265 57,971<br />
56,230 53,753 50,783 50,612 49,693 48,401<br />
30,619<br />
20,462 19,153 16,938<br />
24,358<br />
2007 2008 2009 2010 2011 2012 2013 2014 2015 2016 2017<br />
Total Persons <strong>in</strong> Families<br />
Family Households<br />
Sheltered Persons <strong>in</strong> Families<br />
Unsheltered Persons <strong>in</strong> Families<br />
On a S<strong>in</strong>gle Night <strong>in</strong> January 2017<br />
• 184,661 people were homeless <strong>in</strong> 57,971<br />
families with children, represent<strong>in</strong>g one-third<br />
250000<br />
(33%) <strong>of</strong> the total homeless population <strong>in</strong> 2017.<br />
• More than 90 percent <strong>of</strong> homeless people <strong>in</strong><br />
200000<br />
families with children were sheltered (167,723<br />
people). <strong>The</strong>re were 16,938 people <strong>in</strong> families<br />
150000 with children who were counted <strong>in</strong> unsheltered<br />
locations.<br />
100000 • On average, a homeless family household<br />
consisted <strong>of</strong> three people.<br />
50000<br />
Demographic Characteristics<br />
• Children under the age <strong>of</strong> 18 made up 59<br />
percent <strong>of</strong> people experienc<strong>in</strong>g homelessness<br />
<strong>in</strong> families. Most <strong>of</strong> the adults were 25 years <strong>of</strong><br />
age or older.<br />
• Children were especially likely to be sheltered<br />
rather than unsheltered, with only eight<br />
percent <strong>of</strong> children found <strong>in</strong> unsheltered<br />
locations.<br />
• <strong>The</strong> racial composition <strong>of</strong> people <strong>in</strong> families<br />
with children varied by whether they were<br />
sheltered or unsheltered. More than half <strong>of</strong><br />
sheltered people <strong>in</strong> families with children<br />
were African American (53%), while African<br />
Americans represented just 21 percent <strong>of</strong> the<br />
unsheltered population. About a third (35%)<br />
<strong>of</strong> sheltered people <strong>in</strong> families with children<br />
were white, while people identify<strong>in</strong>g as white<br />
accounted for 59 percent <strong>of</strong> the unsheltered<br />
population.<br />
• More than 25 percent <strong>of</strong> people experienc<strong>in</strong>g<br />
homelessness <strong>in</strong> families with children were<br />
Hispanic or Lat<strong>in</strong>o (27%), and this was higher<br />
than the Hispanic share <strong>of</strong> people experienc<strong>in</strong>g<br />
homelessness as <strong>in</strong>dividuals (18%). Hispanics<br />
comprised a slightly larger share <strong>of</strong> sheltered<br />
people <strong>in</strong> families (28%) and a smaller share <strong>of</strong><br />
those <strong>in</strong> unsheltered locations (22%).<br />
0<br />
EXHIBIT 3.2: Parent<strong>in</strong>g Youth<br />
By Sheltered Status, 2017<br />
People <strong>in</strong> Parent<strong>in</strong>g Youth<br />
Families<br />
Sheltered People <strong>in</strong><br />
Parent<strong>in</strong>g Youth Families<br />
Unsheltered People <strong>in</strong><br />
Parent<strong>in</strong>g Youth Families<br />
# % # % # %<br />
Total Parents under 25 9,436 100 8,859 100 577 100<br />
Parent<strong>in</strong>g Youth (Under 18) 96 1.0 83 0.9 13 2.3<br />
Parent<strong>in</strong>g Youth Age (18 to 24) 9,340 99.0 8,776 99.1 564 97.7<br />
Children <strong>of</strong> Parent<strong>in</strong>g Youth 12,152 11,433 719<br />
32
<strong>The</strong> 2017 Annual Homeless Assessment Report to Congress: Part 1<br />
EXHIBIT 3.3: Demographic Characteristics <strong>of</strong> Homeless People <strong>in</strong> Families with Children<br />
2017<br />
Characteristic<br />
People <strong>in</strong> Families with<br />
Children<br />
Age<br />
All Homeless People <strong>in</strong> Families Sheltered People <strong>in</strong> Families Unsheltered People <strong>in</strong> Families<br />
# % # % # %<br />
184,661 100 167,723 100 16,938 100<br />
Under 18 109,719 59.4 100,960 60.2 8,759 51.7<br />
18 – 24 15,408 8.3 13,851 8.3 1,557 9.2<br />
Over 24 59,534 32.2 52,912 31.5 6,622 39.1<br />
Gender<br />
Female 111,394 60.3 102,589 61.2 8,805 52.0<br />
Male 73,027 39.5 64,971 38.7 8,056 47.6<br />
Transgender 85 0.0 70 0.0 15 0.1<br />
Don’t identify as male,<br />
female, or transgender<br />
Ethnicity<br />
155 0.1 93 0.1 62 0.4<br />
Non-Hispanic 134,363 72.8 121,175 72.2 13,188 77.9<br />
Hispanic 50,298 27.2 46,548 27.8 3,750 22.1<br />
Race<br />
White 68,308 37.0 58,266 34.7 10,042 59.3<br />
African American 92,538 50.1 88,934 53.0 3,604 21.3<br />
Asian 1,919 1.0 1,695 1.0 224 1.3<br />
Native American 4,548 2.5 3,939 2.3 609 3.6<br />
Pacific Islander 4,302 2.3 2,954 1.8 1,348 8.0<br />
Multiple Races 13,046 7.1 11,935 7.1 1,111 6.6<br />
EXHIBIT 3.4: Change <strong>in</strong> Number <strong>of</strong> Homeless People <strong>in</strong> Families with Children<br />
By Sheltered Status, 2007-2017<br />
Change 2016-2017 Change 2010-2017 Change 2007-2017<br />
# % # % # %<br />
Persons <strong>in</strong> families -10,055 -5.2 -57,276 -23.7 -49,897 -21.3<br />
Sheltered -7,840 -4.5 -23,602 -12.3 -10,605 -5.9<br />
Unsheltered -2,215 -11.6 -33,674 -66.5 -39,292 -69.9<br />
Family households -3,294 -5.4 -21,471 -27.0 -20,564 -26.2<br />
EXHIBIT 3.5: Change <strong>in</strong> Numbers <strong>of</strong> Homeless People <strong>in</strong> Families with Children<br />
By Age and Sheltered Status, 2016–2017<br />
Total Change Sheltered Change Unsheltered Change<br />
# % # % # %<br />
Under 18 -6,987 -6.0 -5,451 -5.1 -1,536 -14.9<br />
18 to 24 -742 -4.6 -1,059 -7.1 317 25.6<br />
Over 24 -2,326 -3.8 -1,330 -2.5 -996 -13.1<br />
33
3National 1National Estimates<br />
<strong>Homelessness</strong> Families <strong>in</strong> the with United Children States<br />
Data source: PIT 2007–2017<br />
Additional Characteristics<br />
• Only five percent <strong>of</strong> homeless people <strong>in</strong> families<br />
with children were <strong>in</strong> households with chronic<br />
patterns <strong>of</strong> homelessness (8,457 people). Those<br />
with chronic patterns <strong>of</strong> homelessness were<br />
more likely to be unsheltered than people <strong>in</strong><br />
homeless families overall, with three <strong>in</strong> ten<br />
(29% or 2,477 people) currently stay<strong>in</strong>g <strong>in</strong><br />
unsheltered locations.<br />
• Approximately 17 percent <strong>of</strong> people <strong>in</strong> families<br />
who were under the age <strong>of</strong> 25 were people <strong>in</strong><br />
parent<strong>in</strong>g youth households. Nearly all <strong>of</strong> these<br />
parents (99%) were between 18 and 24 years <strong>of</strong><br />
age. 2<br />
• Only six percent <strong>of</strong> people <strong>in</strong> families with a<br />
parent under 25 were found <strong>in</strong> unsheltered<br />
locations.<br />
S<strong>in</strong>ce 2016<br />
• <strong>The</strong> number <strong>of</strong> homeless people <strong>in</strong> families with<br />
children counted on a s<strong>in</strong>gle night decl<strong>in</strong>ed by<br />
five percent (or 10,055 people) between 2016<br />
and 2017, as did the number <strong>of</strong> homeless family<br />
households (3,294 households).<br />
• Decl<strong>in</strong>es occurred among both sheltered people<br />
<strong>in</strong> families with children (by 5% or 7,840 people)<br />
and unsheltered people <strong>in</strong> families with children<br />
(by 12% or 2,215 people).<br />
• Between 2016 and 2017, family homelessness<br />
decl<strong>in</strong>ed across all age groups, and the number<br />
<strong>of</strong> family members found <strong>in</strong> unsheltered<br />
locations decl<strong>in</strong>ed for most, but not all, age<br />
groups. <strong>The</strong> number <strong>of</strong> children experienc<strong>in</strong>g<br />
unsheltered homelessness with their parents<br />
decl<strong>in</strong>ed by 15 percent. <strong>The</strong> only age group<br />
to experience an <strong>in</strong>crease <strong>in</strong> unsheltered<br />
homelessness was people between the ages 18<br />
and 24, an <strong>in</strong>crease <strong>of</strong> 317 people or 26 percent.<br />
People <strong>in</strong> this age group may be the parent <strong>of</strong><br />
the family, or they may be young adults <strong>in</strong> a<br />
household that has both another adult and at<br />
least one child under 18.<br />
• Between 2016 and 2017, the number <strong>of</strong><br />
people <strong>in</strong> families with children experienc<strong>in</strong>g<br />
homelessness who identified as Hispanic or<br />
Lat<strong>in</strong>o decl<strong>in</strong>ed by 17 percent, or 10,469 fewer<br />
people, <strong>in</strong>clud<strong>in</strong>g an eight percent decl<strong>in</strong>e <strong>in</strong><br />
unsheltered homelessness. While sheltered<br />
homelessness among Hispanics dropped, it<br />
<strong>in</strong>creased for non-Hispanic or Lat<strong>in</strong>o people <strong>in</strong><br />
families over the same time period (by 2% or<br />
2,300 people).<br />
• <strong>Homelessness</strong> <strong>in</strong>creased among people <strong>in</strong><br />
families who identified as African American (by<br />
3%), while decl<strong>in</strong><strong>in</strong>g among people <strong>in</strong> families<br />
with children who identified as white (by 10%).<br />
S<strong>in</strong>ce 2007<br />
• Over the last 10 years, the number <strong>of</strong> homeless<br />
people <strong>in</strong> families dropped by 21 percent (49,897<br />
fewer people), and the number <strong>of</strong> homeless<br />
family households dropped by 26 percent<br />
(20,564 family households).<br />
• This decl<strong>in</strong>e was driven by a substantial drop<br />
<strong>in</strong> the number <strong>of</strong> people counted <strong>in</strong> families<br />
with children stay<strong>in</strong>g <strong>in</strong> unsheltered locations.<br />
Between 2007 and 2017, the number <strong>of</strong><br />
unsheltered people <strong>in</strong> families with children<br />
decl<strong>in</strong>ed by 70 percent (or 39,292 people). <strong>The</strong><br />
number <strong>of</strong> people <strong>in</strong> families with children<br />
stay<strong>in</strong>g <strong>in</strong> sheltered locations also decl<strong>in</strong>ed,<br />
though by a more modest marg<strong>in</strong> (by 6% or<br />
10,605 people).<br />
2 96 people under the age <strong>of</strong> 18 and their children are <strong>in</strong>cluded <strong>in</strong><br />
this estimate. People under the age <strong>of</strong> 18 who are experienc<strong>in</strong>g<br />
homelessness with their children are reported under “childonly”<br />
households, and are also <strong>in</strong>cluded <strong>in</strong> the <strong>in</strong>dividuals<br />
section <strong>of</strong> this report. <strong>The</strong>y are not <strong>in</strong>cluded <strong>in</strong> the total number<br />
<strong>of</strong> people experienc<strong>in</strong>g homelessness <strong>in</strong> families.<br />
34
<strong>The</strong> 2017 Annual Homeless Assessment Report to Congress: Part 1<br />
35
3National 1National Estimates<br />
<strong>Homelessness</strong> Families <strong>in</strong> the with United Children States<br />
Data source: PIT 2007–2017; Excludes Puerto Rico and U.S. territories<br />
EXHIBIT 3.6: Estimates <strong>of</strong> Family <strong>Homelessness</strong><br />
By State, 2017<br />
WA<br />
6,331<br />
OR<br />
3,519<br />
NV<br />
552<br />
CA<br />
21,522<br />
AK<br />
491<br />
ID<br />
728<br />
UT<br />
970<br />
AZ<br />
2,459<br />
MT<br />
542<br />
WY<br />
251<br />
CO<br />
3,369<br />
NM<br />
617<br />
ME, 928<br />
ND<br />
VT, 528<br />
257 MN<br />
NH, 680<br />
3,769<br />
NY MA, 11,298<br />
SD<br />
WI<br />
332<br />
2,382 MI<br />
52,113 RI, 378<br />
3,423<br />
CT, 1,180<br />
IA<br />
PA<br />
NE<br />
5,867 NJ, 3,103<br />
1,256 IL OH<br />
803<br />
3,904 IN 3,407<br />
DE, 379<br />
1,815 WV MD, 2,170<br />
277<br />
VA<br />
KS MO<br />
KY 2,039<br />
DC, 3,890<br />
864 2,269 993<br />
Share <strong>of</strong> Homeless<br />
NC, 2,918<br />
People <strong>in</strong> Families<br />
OK<br />
TN, 2,172<br />
1,375<br />
AR<br />
SC<br />
Less than 1%<br />
399 AL 1,020<br />
1%–2.9%<br />
MS 808 GA<br />
TX<br />
372 2,752<br />
3%–6%<br />
LA<br />
Greater than 6%<br />
6,840<br />
746<br />
FL<br />
9,422<br />
HI<br />
2,685<br />
On a S<strong>in</strong>gle Night <strong>in</strong> 2017<br />
• Nearly 30 percent <strong>of</strong> all people <strong>in</strong> families with<br />
children experienc<strong>in</strong>g homelessness were <strong>in</strong><br />
New York, or 52,113 people. All but 55 people<br />
(or 0.1%) were stay<strong>in</strong>g <strong>in</strong> sheltered locations.<br />
• More than half <strong>of</strong> all homeless people <strong>in</strong><br />
families with children were <strong>in</strong> four states: New<br />
York (29% or 52,113 people), California (12% or<br />
21,522 people), Massachusetts (6% or 11,298<br />
people), and Florida (5% or 9,422 people).<br />
• California, Florida, Oregon, and Colorado<br />
together accounted for nearly two-thirds <strong>of</strong> all<br />
unsheltered people <strong>in</strong> families with children<br />
(63%).<br />
• In five states, more than one third <strong>of</strong> people<br />
experienc<strong>in</strong>g homelessness <strong>in</strong> families with<br />
children were unsheltered: North Dakota<br />
(58%), Oregon (52%), Wyom<strong>in</strong>g (49%), Montana<br />
(35%), and Florida (34%). <strong>The</strong>se rates were<br />
considerably higher than the national rate <strong>of</strong><br />
just under 10 percent.<br />
Changes Over Time<br />
• Between 2016 and 2017, 13 states had<br />
<strong>in</strong>creases <strong>in</strong> the number <strong>of</strong> people <strong>in</strong> families<br />
with children experienc<strong>in</strong>g homelessness.<br />
<strong>The</strong> largest <strong>in</strong>creases were <strong>in</strong> New York and<br />
California, each which had more than 1,000<br />
more homeless people <strong>in</strong> families <strong>in</strong> 2017 than<br />
<strong>in</strong> 2016.<br />
• Thirty-seven states and the District <strong>of</strong><br />
Columbia experienced decl<strong>in</strong>es between 2016<br />
and 2017. Massachusetts experienced the<br />
largest decl<strong>in</strong>e <strong>in</strong> homeless people <strong>in</strong> families,<br />
with 1,876 fewer people <strong>in</strong> 2017, a 14 percent<br />
decl<strong>in</strong>e. Other states with large decl<strong>in</strong>es <strong>in</strong><br />
homeless people <strong>in</strong> families with children<br />
were Georgia (892 fewer people or 25%),<br />
Pennsylvania (873 fewer people or 13%), and<br />
the District <strong>of</strong> Columbia (777 fewer people or<br />
17%).<br />
• Over a longer period, 2007-2017, the number <strong>of</strong><br />
people experienc<strong>in</strong>g homelessness <strong>in</strong> families<br />
with children <strong>in</strong>creased <strong>in</strong> 13 states. New York<br />
experienced the largest <strong>in</strong>crease, with 17,568<br />
36
<strong>The</strong> 2017 Annual Homeless Assessment Report to Congress: Part 1<br />
more homeless people <strong>in</strong> families, a 51 percent<br />
rise. Though Massachusetts and the District<br />
<strong>of</strong> Columbia experienced decl<strong>in</strong>es <strong>in</strong> the last<br />
year, the number <strong>of</strong> homeless people <strong>in</strong> families<br />
<strong>in</strong> both states were considerably higher <strong>in</strong><br />
2017 than <strong>in</strong> 2007 (by 4,463 people or 65% <strong>in</strong><br />
Massachusetts and 2,287 people or 143% <strong>in</strong> the<br />
District <strong>of</strong> Columbia).<br />
• In the last 10 years, the number <strong>of</strong> homeless<br />
people <strong>in</strong> families with children decl<strong>in</strong>ed <strong>in</strong><br />
38 states. Though California experienced an<br />
<strong>in</strong>crease between 2016 and 2017, the number<br />
<strong>of</strong> people <strong>in</strong> families with children was<br />
considerably lower <strong>in</strong> 2017 than it was <strong>in</strong> 2007<br />
(by 6,512 people or 23%). Other states with<br />
large decl<strong>in</strong>es over the last decade <strong>in</strong>clude<br />
Texas (6,642 or 49%), Florida (5,607 or 37%),<br />
and New Jersey (5,239 or 63%).<br />
EXHIBIT 3.7: Highest and Lowest Rates <strong>of</strong> Unsheltered People <strong>in</strong> Families with Children<br />
By State, 2017<br />
Highest Rates<br />
NORTH DAKOTA<br />
OREGON<br />
WYOMING<br />
MONTANA<br />
FLORIDA<br />
58.0%<br />
51.9%<br />
49.4%<br />
35.1%<br />
34.4%<br />
257 Homeless<br />
149 Unsheltered<br />
3,519 Homeless<br />
1,826 Unsheltered<br />
251 Homeless<br />
124 Unsheltered<br />
542 Homeless<br />
190 Unsheltered<br />
9,422 Homeless<br />
3,242 Unsheltered<br />
Lowest Rates<br />
DISTRICT OF<br />
COLUMBIA<br />
0.0%<br />
IOWA<br />
0.0%<br />
UTAH<br />
0.0%<br />
NEBRASKA<br />
0.0%<br />
ALASKA<br />
0.0%<br />
3,090 Homeless<br />
0 Unsheltered<br />
1,256 Homeless<br />
0 Unsheltered<br />
970 Homeless<br />
0 Unsheltered<br />
803 Homeless<br />
0 Unsheltered<br />
491 Homeless<br />
0 Unsheltered<br />
Note: Excludes Puerto Rico and U.S. territories.<br />
37
3State 1National Estimates<br />
<strong>Homelessness</strong> Families <strong>in</strong> the with United Children States<br />
Data source: PIT 2007–2017; Excludes Puerto Rico and U.S. territories<br />
EXHIBIT 3.8: Largest Changes <strong>in</strong> Homeless People <strong>in</strong> Families with Children<br />
By State, 2007–2017<br />
Largest Increases<br />
2016–2017 2007–2017<br />
NEW YORK 1,076 / 2.1% NEW YORK 17,568 / 50.9%<br />
CALIFORNIA 1,040 / 5.1% MASSACH<strong>US</strong>ETTS 4,463 / 65.3%<br />
OKLAHOMA 265 / 23.9% DISTRICT OF COLUMBIA 2,287 / 142.7%<br />
NEW HAMPSHIRE 141 / 26.2% OKLAHOMA 136 / 11.0%<br />
MINNESOTA 97 / 2.6% MISSISSIPPI 110 / 42.0%<br />
Largest Decreases*<br />
MASSACH<strong>US</strong>ETTS -1,876 / -14.2% TEXAS -6,642 / -49.3%<br />
GEORGIA -892 / -24.5% CALIFORNIA -6,512 / -23.2%<br />
PENNSYLVANIA -873 / -13.0% FLORIDA -5,607 / -37.3%<br />
DISTRICT OF COLUMBIA -777 / -16.6% NEW JERSEY -5,239 / -62.8%<br />
COLORADO -731 / -17.8% GEORGIA -4,366 / -61.3%<br />
a<br />
Due to methodological changes, Michigan was excluded from the list <strong>of</strong> largest decreases from 2007-2017.<br />
Approximately 17 percent <strong>of</strong> people<br />
<strong>in</strong> families who were under the age<br />
<strong>of</strong> 25 were people <strong>in</strong> parent<strong>in</strong>g<br />
youth households<br />
38
<strong>The</strong> 2017 Annual Homeless Assessment Report to Congress: Part 1<br />
39
3Estimates 1National Estimates by CoC<br />
<strong>Homelessness</strong> Families <strong>in</strong> the with United Children States<br />
f All Homeless People <strong>in</strong> Families with Children<br />
re <strong>of</strong> Sheltered People <strong>in</strong> Families with Children<br />
<strong>of</strong> Unsheltered People <strong>in</strong> Families with Children<br />
EXHIBIT 3.9: Homeless People <strong>in</strong> Families<br />
with Children<br />
By CoC Category and Sheltered Status, 2017<br />
0 100<br />
All Homeless People <strong>in</strong><br />
Families with Children<br />
Sheltered People <strong>in</strong><br />
Families with Children<br />
Unsheltered People <strong>in</strong><br />
Families with Children<br />
0% 100%<br />
50.5<br />
53.6<br />
17.1 50.2<br />
Major Cities<br />
Smaller City, County, and Regional CoCs<br />
Balance <strong>of</strong> State and Statewide CoCs<br />
34.0 15.5<br />
32.5<br />
13.9<br />
32.7<br />
On a S<strong>in</strong>gle Night <strong>in</strong> January 2017<br />
• More than half <strong>of</strong> all people experienc<strong>in</strong>g<br />
homelessness <strong>in</strong> families with children were<br />
<strong>in</strong> the 50 largest cities (92,414 people). Smaller<br />
cities, counties and regional CoCs had 34<br />
percent <strong>of</strong> the total, and the rema<strong>in</strong><strong>in</strong>g 16<br />
percent were <strong>in</strong> BoS and statewide CoCs.<br />
• New York City accounted for one quarter all<br />
family homelessness <strong>in</strong> the U.S., or 45,377<br />
people experienc<strong>in</strong>g homelessness <strong>in</strong> families<br />
with children. While this is not surpris<strong>in</strong>g<br />
given the size <strong>of</strong> New York City, some large<br />
cities have relatively low numbers <strong>of</strong> people<br />
<strong>in</strong> homeless families compared to the size <strong>of</strong><br />
the city. For example, Houston has the fourth<br />
largest population <strong>in</strong> the country but is not<br />
among the ten cities with the largest numbers<br />
<strong>of</strong> people experienc<strong>in</strong>g homelessness <strong>in</strong><br />
families with children.<br />
• Six <strong>of</strong> the ten major cities with the largest<br />
numbers <strong>of</strong> homeless people <strong>in</strong> families are not<br />
among those with largest numbers <strong>of</strong> homeless<br />
<strong>in</strong>dividuals. Chicago and Phoenix, the third<br />
and fifth largest cities, were <strong>in</strong> the ten places<br />
with the largest numbers <strong>of</strong> homeless families<br />
though they did not appear among the largest<br />
total homeless populations.<br />
• In major cities, almost all homeless people<br />
<strong>in</strong> families with children were sheltered, 97<br />
Data source: PIT 2007–2017; Excludes Puerto Rico and U.S. territories<br />
Balance <strong>of</strong> State and Statewide CoCs<br />
Smaller Cities, Counties, and Regional CoCs<br />
Major Cities<br />
percent. By comparison, only 87 percent <strong>of</strong><br />
people <strong>in</strong> homeless families were sheltered <strong>in</strong><br />
smaller cities, counties, and regional CoCs and<br />
82 percent <strong>in</strong> BoS and statewide CoCs.<br />
• Smaller cities, counties, and regional CoCs<br />
<strong>in</strong>clude eight CoCs where over 80 percent<br />
<strong>of</strong> homeless people <strong>in</strong> families with children<br />
were unsheltered. <strong>The</strong> highest unsheltered<br />
rate was found <strong>in</strong> Pasco County on the west<br />
coast <strong>of</strong> Florida, where 96 percent <strong>of</strong> homeless<br />
people with families were liv<strong>in</strong>g <strong>in</strong> unsheltered<br />
locations.<br />
• BoS or Statewide CoCs accounted for 16<br />
percent <strong>of</strong> all people <strong>in</strong> families with children<br />
experienc<strong>in</strong>g homelessness (or 28,408 people)<br />
and for 33 percent <strong>of</strong> all unsheltered people <strong>in</strong><br />
families (5,145 people).<br />
• <strong>The</strong> communities with the highest rates <strong>of</strong><br />
unsheltered homelessness among families<br />
<strong>in</strong> major cities and smaller cities, counties,<br />
and regional CoCs were, for the most part, <strong>in</strong><br />
warmer climates like California and Florida.<br />
However, the highest rates <strong>of</strong> unsheltered<br />
family homelessness for BoS or statewide<br />
CoCs were found <strong>in</strong> colder climates, with the<br />
exception <strong>of</strong> Oklahoma Balance <strong>of</strong> State.<br />
Cont<strong>in</strong>uums <strong>of</strong> Care (CoC) Were<br />
Divided <strong>in</strong>to Three Geographic<br />
Categories<br />
Major city CoCs (n=48) cover the 50 largest<br />
cities <strong>in</strong> the United States. In two cases<br />
(Phoenix and Mesa, AZ, and Arl<strong>in</strong>gton and<br />
Fort Worth, TX), two large cities were located<br />
<strong>in</strong> the same CoC.<br />
Smaller city, county, and regional CoCs<br />
(n=306) are jurisdictions that are neither one<br />
<strong>of</strong> the 50 largest cities <strong>in</strong> the United States nor<br />
Balance <strong>of</strong> State and Statewide CoCs.<br />
Balance <strong>of</strong> State (BoS) and statewide CoCs<br />
(n=40) are typically composed <strong>of</strong> multiple<br />
rural counties or represent an entire state.<br />
40
<strong>The</strong> 2017 Annual Homeless Assessment Report to Congress: Part 1<br />
EXHIBIT 3.10: CoCs with the Largest Numbers <strong>of</strong> Homeless People <strong>in</strong> Families with Children<br />
By CoC Category, 2017<br />
CoC<br />
Major City CoCs Smaller City, County, and Regional CoCs Balance <strong>of</strong> State and Statewide CoCs<br />
# <strong>of</strong> People<br />
<strong>in</strong> Families<br />
New York City, NY 45,377<br />
Los Angeles City & County,<br />
CA<br />
CoC<br />
Nassau, Suffolk Counties/<br />
Babylon/Islip/ Hunt<strong>in</strong>gton, NY<br />
# <strong>of</strong> People<br />
<strong>in</strong> Families<br />
CoC<br />
2,943 Texas Balance <strong>of</strong> State<br />
8,106 Spr<strong>in</strong>gfield, MA 1,941 Oregon Balance <strong>of</strong> State<br />
# <strong>of</strong> People<br />
<strong>in</strong> Families<br />
District <strong>of</strong> Columbia 3,890 Honolulu, HI 1,847 Wiscons<strong>in</strong> Balance <strong>of</strong> State 1,849<br />
Boston, MA 3,643 Pasco County, FL 1,755 Wash<strong>in</strong>gton Balance <strong>of</strong> State 1,796<br />
Seattle/K<strong>in</strong>g County, WA 2,833<br />
Philadelphia, PA 2,352<br />
Chicago, IL 1,933<br />
Phoenix/Mesa/Maricopa<br />
County Regional, AZ<br />
M<strong>in</strong>neapolis/Hennep<strong>in</strong><br />
County, MN<br />
San Diego City and County,<br />
CA<br />
Santa Ana/Anaheim/Orange<br />
County, CA<br />
Yonkers/Mount Vernon/New<br />
Rochelle/Westchester, NY<br />
Fort Pierce/St. Lucie, Indian<br />
River, Mart<strong>in</strong> Counties, FL<br />
1,265<br />
Massachusetts Balance <strong>of</strong><br />
State<br />
1,163 Ohio Balance <strong>of</strong> State<br />
982 Georgia Balance <strong>of</strong> State<br />
1,800 Eastern Pennsylvania 961 Colorado Balance <strong>of</strong> State<br />
1,662 Worcester City & County, MA 923 Indiana Balance <strong>of</strong> State<br />
1,589 Newark/Essex County, NJ 795<br />
North Carol<strong>in</strong>a Balance <strong>of</strong><br />
State<br />
2,345<br />
1,893<br />
1,564<br />
1,530<br />
1,497<br />
1,451<br />
1,315<br />
1,143<br />
Nearly 30 percent <strong>of</strong> all people <strong>in</strong><br />
families with children experienc<strong>in</strong>g<br />
homelessness were <strong>in</strong> New York.<br />
41
3Estimates 1National Estimates by CoC<br />
<strong>Homelessness</strong> Families <strong>in</strong> the with United Children States<br />
Data source: PIT 2007–2017; Excludes Puerto Rico and U.S. territories<br />
EXHIBIT 3.11: CoCs with the Highest and Lowest<br />
Rates <strong>of</strong> Unsheltered Homeless People <strong>in</strong> Families with Children<br />
By CoC Category, 2017<br />
CoC<br />
Highest Rates<br />
San Jose/Santa<br />
Clara City &<br />
County, CA<br />
Major City CoCs<br />
Total<br />
Homeless<br />
People <strong>in</strong><br />
Families<br />
Smaller City, County,<br />
and Regional CoCs<br />
Total<br />
%<br />
Unsheltered CoC Homeless<br />
People <strong>in</strong><br />
Families<br />
Balance <strong>of</strong> State<br />
and Statewide CoCs<br />
Total<br />
%<br />
Unsheltered CoC Homeless<br />
People <strong>in</strong><br />
Families<br />
1,075 27.5% Pasco County, FL 1,755 96.3% Oklahoma<br />
Balance <strong>of</strong> State<br />
Long Beach, CA 217 26.3% El Dorado County,<br />
CA<br />
Los Angeles City &<br />
County, CA<br />
San Diego City and<br />
County, CA<br />
Portland-Gresham-<br />
Multnomah<br />
County, OR<br />
Lowest Rates<br />
8,106 18.6% Fort Pierce/St. Lucie,<br />
Indian River, Mart<strong>in</strong><br />
Counties, FL<br />
1,589 18.4% Northwest North<br />
Carol<strong>in</strong>a<br />
156 88.5% Oregon Balance<br />
<strong>of</strong> State<br />
982 88.0% Colorado<br />
Balance <strong>of</strong> State<br />
267 85.4% North Dakota<br />
Statewide<br />
657 11.7% Central Oregon 284 83.8% Wyom<strong>in</strong>g<br />
Statewide<br />
New York City CoC 45,377 0.0% Nassau, Suffolk<br />
Counties/Babylon/<br />
Islip/ Hunt<strong>in</strong>gton, NY<br />
District <strong>of</strong><br />
Columbia CoC<br />
2,943 0.0% Massachusetts<br />
Balance <strong>of</strong> State<br />
3,890 0.0% Spr<strong>in</strong>gfield, MA 1,941 0.0% Iowa Balance <strong>of</strong><br />
State<br />
Boston CoC, MA 3,643 0.0% Yonkers/<br />
Mount Vernon/<br />
New Rochelle/<br />
Westchester, NY<br />
Miami/Dade<br />
County CoC, FL<br />
Memphis/Shelby<br />
County CoC, TN<br />
1,175 0.0% Qu<strong>in</strong>cy/Brockton/<br />
Weymouth/Plymouth<br />
City and County, MA<br />
511 0.0% Salt Lake City &<br />
County, UT<br />
Note: Excludes CoCs with fewer than 100 total homeless people.<br />
1,163 0.0% Kansas Balance<br />
<strong>of</strong> State<br />
750 0.0% Rhode Island<br />
Statewide<br />
699 0.0% Nebraska<br />
Balance <strong>of</strong> State<br />
%<br />
Unsheltered<br />
281 65.5%<br />
1,893 64.1%<br />
1,451 62.6%<br />
257 58.0%<br />
251 49.4%<br />
1,564 0.0%<br />
985 0.0%<br />
429 0.0%<br />
378 0.0%<br />
230 0.0%<br />
Changes over Time<br />
• Between 2016 and 2017, the number <strong>of</strong><br />
homeless people <strong>in</strong> families with children<br />
decl<strong>in</strong>ed <strong>in</strong> all three types <strong>of</strong> CoCs. <strong>The</strong><br />
largest percentage change occurred <strong>in</strong> BoS or<br />
statewide CoCs (by 3,291 or 10%), followed by<br />
smaller cities, counties, and regional CoCs (by<br />
5,133 people or 8%), with more modest decl<strong>in</strong>es<br />
<strong>in</strong> major cities (1,618 or 2%).<br />
• New York City and Los Angeles have<br />
experienced considerable fluctuations <strong>in</strong><br />
the number <strong>of</strong> homeless people <strong>in</strong> families<br />
<strong>in</strong> recent years. <strong>The</strong>se two communities<br />
experienced the largest <strong>in</strong>creases between<br />
2014 and 2015, the largest decl<strong>in</strong>es <strong>in</strong> people<br />
experienc<strong>in</strong>g homelessness <strong>in</strong> families with<br />
children between 2015 and 2016, and between<br />
2016 and 2017 represented two <strong>of</strong> the top<br />
three <strong>in</strong>creases. Los Angeles had the largest<br />
42
<strong>The</strong> 2017 Annual Homeless Assessment Report to Congress: Part 1<br />
<strong>in</strong>crease between 2016 and 2017, with 1,978<br />
more people (or 32%). In New York, there were<br />
819 more people <strong>in</strong> families experienc<strong>in</strong>g<br />
homelessness, a two percent <strong>in</strong>crease.<br />
• Over a longer time period, 2007-2017, sheltered<br />
homelessness among people <strong>in</strong> families <strong>in</strong><br />
major cities <strong>in</strong>creased by 14 percent (10,798<br />
people). Sheltered homelessness decl<strong>in</strong>ed <strong>in</strong><br />
smaller cities, counties, and regional CoCs (by<br />
23%) and <strong>in</strong> BoS and statewide CoCs (by 20%)<br />
dur<strong>in</strong>g the same time period.<br />
• Over the last decade, unsheltered<br />
homelessness decl<strong>in</strong>ed dramatically across<br />
CoC categories. <strong>Homelessness</strong> among people<br />
<strong>in</strong> families <strong>in</strong> major cities decl<strong>in</strong>ed by 82<br />
percent (12,182 fewer people), 69 percent <strong>in</strong><br />
smaller cities, counties, and regional CoCs (or<br />
17,470 people), and by 67 percent <strong>in</strong> BoS and<br />
statewides (or 10,231 people).<br />
EXHIBIT 3.12: People <strong>in</strong> Families with Children Experienc<strong>in</strong>g <strong>Homelessness</strong><br />
By CoC Category and Sheltered Status, 2007–2017<br />
100000<br />
80000<br />
60000<br />
40000<br />
20000<br />
0<br />
91,487<br />
93,033<br />
89,720<br />
84,825<br />
82,441<br />
78,922<br />
70,220<br />
72,001 71,708<br />
70,123<br />
64,933<br />
54,432<br />
32,508<br />
28,896<br />
29,461 29,485<br />
27,373<br />
23,263<br />
28,067 22,861<br />
25,380<br />
17,669<br />
15,376<br />
19,794<br />
17,727<br />
14,876<br />
8,801<br />
7,176<br />
7,910<br />
6,411<br />
5,145<br />
4,274 5,424 4,579 4,143 2,694<br />
2007 2008 2009 2010 2011 2012 2013 2014 2015 2016 2017<br />
Major Cities,<br />
Sheltered<br />
Major Cities,<br />
Unsheltered<br />
Smaller Cities, Counties,<br />
and Regional CoCs,<br />
Sheltered<br />
Smaller Cities, Counties,<br />
and Regional CoCs,<br />
Unsheltered<br />
Balance <strong>of</strong> State<br />
and Statewide CoCs,<br />
Sheltered<br />
Balance <strong>of</strong> State<br />
and Statewide CoCs,<br />
Unsheltered<br />
EXHIBIT 3.13: Change <strong>in</strong> Numbers <strong>of</strong> Homeless People <strong>in</strong> Families with Children<br />
By Sheltered Status and CoC Category, 2016-2017<br />
Total Change Sheltered Change Unsheltered Change<br />
# % # % # %<br />
100000<br />
Major Cities -1,618 -1.7 -1,094 -1.2 -524 -16.3<br />
Smaller Cities, Counties, and Regional CoCs -5,133 -7.6 -5,040 -8.5 -93 -1.2<br />
Balance <strong>of</strong> State and Statewide CoCs -3,291 -10.4 -1,465 -5.9 -1,826 -26.2<br />
80000<br />
60000<br />
43
4National 1National Estimates<br />
<strong>Homelessness</strong> Unaccompanied <strong>in</strong> the Homeless United Youth States<br />
Data source: PIT 2017<br />
In recent years, HUD has expanded Po<strong>in</strong>t-<strong>in</strong>-Time<br />
(PIT) count data collection to <strong>in</strong>clude <strong>in</strong>formation<br />
on the number <strong>of</strong> young adults and children<br />
who are experienc<strong>in</strong>g homelessness without<br />
a parent or guardian present. Unaccompanied<br />
youth are people under the age <strong>of</strong> 25 who are not<br />
accompanied by a parent or guardian and are<br />
not a parent present<strong>in</strong>g with or sleep<strong>in</strong>g <strong>in</strong> the<br />
same place as his or her children. <strong>The</strong>se estimates<br />
<strong>in</strong>clude both unaccompanied homeless youth<br />
who are under the age <strong>of</strong> 18, and are a part <strong>of</strong> the<br />
households with only children population and<br />
unaccompanied homeless youth between the ages<br />
<strong>of</strong> 18 and 24, who are a part <strong>of</strong> the households<br />
without children population. HUD and its federal<br />
partners selected the PIT counts from January 2017<br />
as the basel<strong>in</strong>e measure <strong>of</strong> homelessness among<br />
unaccompanied youth. <strong>The</strong> basel<strong>in</strong>e measure will<br />
be used to assess future trends <strong>in</strong> the number <strong>of</strong><br />
unaccompanied youth experienc<strong>in</strong>g homelessness<br />
<strong>in</strong> the United States.<br />
EXHIBIT 4.1: Estimates <strong>of</strong> Unaccompanied<br />
Homeless Youth<br />
By Age and Sheltered Status, 2017<br />
Total<br />
Sheltered Unsheltered<br />
All Homeless People<br />
Unaccompanied Unaccompanied Unaccompanied<br />
Unsheltered<br />
Homeless Youth Youth<br />
Youth<br />
Sheltered<br />
# % # % # %<br />
All Homeless Individuals<br />
All Unaccompanied 40,799 100.0% 18,542 100.0% 22,257 100.0%<br />
Unaccompanied Youth Homeless (18-24) Youth<br />
(under 25)<br />
naccompanied Youth (under Unaccompanied<br />
18)<br />
4,789 11.7% 2,122 11.4% 2,667 12.0%<br />
Homeless Youth<br />
(under 18) 0 100<br />
Unaccompanied<br />
Homeless Youth<br />
(18-24)<br />
36,010 88.3% 16,420 88.6% 19,590 88.0%<br />
EXHIBIT 4.2: Sheltered and Unsheltered<br />
Unaccompanied Homeless Youth<br />
By Sheltered Status, 2017<br />
All Homeless<br />
People<br />
All Homeless<br />
Individuals<br />
Unaccompanied<br />
Youth (18-24)<br />
Unaccompanied<br />
Youth (under 18)<br />
0% 100%<br />
52.3<br />
65.2<br />
34.8<br />
47.7<br />
45.6 54.4<br />
44.3 55.7<br />
On a S<strong>in</strong>gle Night <strong>in</strong> January<br />
• <strong>The</strong>re were 40,799 unaccompanied homeless<br />
youth under the age <strong>of</strong> 25. This represents<br />
just over seven percent <strong>of</strong> the total homeless<br />
population and eleven percent <strong>of</strong> people<br />
experienc<strong>in</strong>g homelessness as <strong>in</strong>dividuals.<br />
• In addition, there were 9,436 parents and<br />
12,152 children <strong>in</strong> families <strong>in</strong> which the parent<br />
was a youth. <strong>The</strong>y are not <strong>in</strong>cluded <strong>in</strong> this<br />
chapter, but are described <strong>in</strong> the Families<br />
chapter <strong>of</strong> this report.<br />
• People between the ages <strong>of</strong> 18 and 24<br />
account for most <strong>of</strong> the unaccompanied<br />
homeless youth population (88% or 36,010<br />
people). <strong>The</strong> rema<strong>in</strong><strong>in</strong>g 12 percent (or 4,789<br />
people) were under the age <strong>of</strong> 18.<br />
• Unaccompanied homeless youth are much more<br />
likely to be unsheltered (55%) than all people<br />
experienc<strong>in</strong>g homelessness (35%) or people<br />
experienc<strong>in</strong>g homelessness as <strong>in</strong>dividuals<br />
(48%). <strong>The</strong> younger unaccompanied homeless<br />
youth—people under age 18—are a slightly<br />
more likely to be unsheltered (56%) than<br />
unaccompanied homeless youth<br />
age 18 to 24 (54%).<br />
Demographic Characteristics <strong>of</strong><br />
Unaccompanied Youth<br />
• <strong>The</strong> majority <strong>of</strong> unaccompanied<br />
homeless youth experienc<strong>in</strong>g<br />
homelessness were men or boys<br />
(62% or 25,131 people). <strong>The</strong> size <strong>of</strong> the<br />
majority varied by sheltered status.<br />
More than two thirds <strong>of</strong> unsheltered<br />
unaccompanied homeless youth were<br />
male (67% or 14,929 people) compared to<br />
55 percent <strong>of</strong> sheltered unaccompanied<br />
homeless youth.<br />
• Transgender youth accounted for<br />
approximately two percent <strong>of</strong> the<br />
unaccompanied homeless youth population,<br />
regardless <strong>of</strong> sheltered status. While<br />
account<strong>in</strong>g for an extremely small share <strong>of</strong><br />
44<br />
Sheltered<br />
Unsheltered
<strong>The</strong> 2017 Annual Homeless Assessment Report to Congress: Part 1<br />
the overall unaccompanied homeless youth<br />
population, people who did not identify as<br />
male, female, or transgender comprised a<br />
higher share <strong>of</strong> the unsheltered population<br />
than the sheltered population (0.5% compared<br />
to 0.2%).<br />
• More than one-third (37%) <strong>of</strong> unaccompanied<br />
homeless youth are women or girls, which<br />
is a larger share than those experienc<strong>in</strong>g<br />
homelessness as <strong>in</strong>dividuals (28%).<br />
• One-quarter <strong>of</strong> unaccompanied homeless<br />
youth were Hispanic or Lat<strong>in</strong>o (or 10,296<br />
people). <strong>The</strong> rate is higher among unsheltered<br />
unaccompanied homeless youth (31% or 6,785<br />
people). Unaccompanied homeless youth<br />
were more likely to be Hispanic or Lat<strong>in</strong>o<br />
than all homeless <strong>in</strong>dividuals (25% <strong>of</strong> youth<br />
were Hispanic or Lat<strong>in</strong>o compared to 19%),<br />
demonstrat<strong>in</strong>g that younger <strong>in</strong>dividuals were<br />
more likely Hispanic than older <strong>in</strong>dividuals.<br />
• Nearly half <strong>of</strong> unaccompanied homeless youth<br />
were white (49%), and about one-third (34%)<br />
were African American. Multiracial youth<br />
accounted for 10 percent. Native American<br />
youth represented four percent <strong>of</strong> the homeless<br />
youth population, and Asian and Pacific<br />
Islander youth together accounted for the<br />
rema<strong>in</strong><strong>in</strong>g three percent.<br />
• Compared to all homeless <strong>in</strong>dividuals<br />
(<strong>in</strong>clud<strong>in</strong>g people over the age <strong>of</strong> 24),<br />
unaccompanied homeless youth were more<br />
likely to identify as a race other than white or<br />
African American (18% versus 12%).<br />
EXHIBIT 4.3: Demographic Characteristics <strong>of</strong> Unaccompanied Youth Experienc<strong>in</strong>g<br />
<strong>Homelessness</strong><br />
2017<br />
All Unaccompanied Youth<br />
Sheltered Unaccompanied<br />
Youth<br />
Unsheltered Unaccompanied<br />
Youth<br />
# % # % # %<br />
Total 40,799 100 18,542 100 22,257 100<br />
Age<br />
Under 18 4,789 11.7 2,122 11.4 2,667 12.0<br />
18 – 24 36,010 88.3 16,420 88.6 19,590 88.0<br />
Gender<br />
Female 14,930 36.6 8,036 43.3 6,894 31.0<br />
Male 25,131 61.6 10,202 55.0 14,929 67.1<br />
Transgender 597 1.5 270 1.5 327 1.5<br />
Does Not Identify as Male,<br />
Female, or Transgender<br />
Ethnicity<br />
141 0.3 34 0.2 107 0.5<br />
Non-Hispanic 30,503 74.8 15,031 81.1 15,472 69.5<br />
Hispanic 10,296 25.2 3,511 18.9 6,785 30.5<br />
Race<br />
White 19,842 48.6 8,629 46.5 11,213 50.4<br />
African American 13,817 33.9 7,830 42.2 5,987 26.9<br />
Asian 770 1.9 193 1.0 577 2.6<br />
Native American 1,724 4.2 621 3.3 1,103 5.0<br />
Pacific Islander 579 1.4 135 0.7 444 2.0<br />
Multiple Races 4,067 10.0 1,134 6.1 2,933 13.2<br />
45
4State 1National Estimates<br />
<strong>Homelessness</strong> Unaccompanied <strong>in</strong> the Homeless United Youth States<br />
Data source: PIT 2017; Excludes PR and U.S. territories<br />
EXHIBIT 4.4: Estimates <strong>of</strong> Unaccompanied Homeless Youth<br />
By State, 2017<br />
WA<br />
2,135<br />
OR<br />
1,462<br />
NV<br />
2,166<br />
CA<br />
15,458<br />
AK<br />
162<br />
ID<br />
113<br />
UT<br />
180<br />
AZ<br />
578<br />
MT<br />
106<br />
WY<br />
62<br />
CO<br />
763<br />
NM<br />
181<br />
ND<br />
80<br />
SD<br />
66<br />
NE<br />
164<br />
KS<br />
103<br />
TX<br />
1,318<br />
OK<br />
363<br />
ME, 178<br />
VT, 94<br />
MN<br />
NH, 76<br />
889<br />
WI<br />
NY MA, 469<br />
276 MI<br />
2,829 RI, 49<br />
608<br />
CT, 170<br />
IA<br />
PA<br />
NJ,<br />
140 IL OH 756 492<br />
IN<br />
DE, 45<br />
730<br />
294 695 WV MD, 272<br />
VA<br />
MO<br />
KY 79<br />
303<br />
DC, 228<br />
548<br />
253<br />
NC, 434<br />
TN, 457<br />
AR<br />
SC<br />
208<br />
173<br />
Share <strong>of</strong> Unaccompanied<br />
MS AL GA<br />
Homeless Youth<br />
59 294 526<br />
Less than 1%<br />
LA<br />
236<br />
1%–2.9%<br />
3%–6%<br />
FL 2,019<br />
Greater than 6%<br />
HI<br />
319<br />
On a S<strong>in</strong>gle Night <strong>in</strong> January 2017<br />
• California reported the largest numbers<br />
<strong>of</strong> unaccompanied homeless youth (15,458<br />
people), which represents 38 percent <strong>of</strong> the<br />
national total. Other states with large numbers<br />
<strong>of</strong> unaccompanied homeless youth were:<br />
New York (2,829), Nevada (1,931), Wash<strong>in</strong>gton<br />
(2,135), and Florida (2,019).<br />
Unaccompanied homeless youth are<br />
much more likely to be unsheltered<br />
(55%) than all people experienc<strong>in</strong>g<br />
homelessness (35%) or people<br />
experienc<strong>in</strong>g homelessness as<br />
<strong>in</strong>dividuals (48%).<br />
• California accounted for 58 percent <strong>of</strong> all<br />
unsheltered unaccompanied youth (12,749<br />
people). <strong>The</strong> state with the next largest<br />
number was Nevada, with 90 percent <strong>of</strong><br />
unaccompanied homeless people under 25 <strong>in</strong><br />
unsheltered situations, or 1,931 people.<br />
• Nevada had the highest rate <strong>of</strong> unsheltered<br />
unaccompanied youth, with 89 percent (or<br />
1,931 people) stay<strong>in</strong>g <strong>in</strong> places not meant<br />
for human habitation. California and Hawaii<br />
followed, with 82 percent <strong>of</strong> unaccompanied<br />
youth <strong>in</strong> those states stay<strong>in</strong>g <strong>in</strong> unsheltered<br />
locations.<br />
• Iowa had the lowest rate <strong>of</strong> unsheltered<br />
unaccompanied youth, with only four <strong>of</strong> the 140<br />
youth stay<strong>in</strong>g <strong>in</strong> unsheltered locations (3%).<br />
46
<strong>The</strong> 2017 Annual Homeless Assessment Report to Congress: Part 1<br />
EXHIBIT 4.5: States with the Highest and Lowest Rates <strong>of</strong> Unsheltered<br />
Unaccompanied Homeless Youth<br />
By State, 2017<br />
Highest Rates<br />
NEVADA<br />
CALIFORNIA<br />
HAWAII<br />
WASHINGTON<br />
OREGON<br />
89.2%<br />
82.5%<br />
82.4%<br />
65.7%<br />
65.3%<br />
2,166 Homeless<br />
1,931 Unsheltered<br />
15,458 Homeless<br />
12,749 Unsheltered<br />
319 Homeless<br />
263 Unsheltered<br />
2,135 Homeless<br />
1,402 Unsheltered<br />
1,462 Homeless<br />
955 Unsheltered<br />
Lowest Rates<br />
IOWA<br />
DELAWARE<br />
NEBRASKA<br />
NEW YORK<br />
MICHIGAN<br />
2.9%<br />
4.4%<br />
7.9%<br />
10.4%<br />
11.3%<br />
140 Homeless<br />
4 Unsheltered<br />
45 Homeless<br />
2 Unsheltered<br />
164 Homeless<br />
13 Unsheltered<br />
2,829 Homeless<br />
294 Unsheltered<br />
608 Homeless<br />
69 Unsheltered<br />
47
4Estimates 1National Estimates by CoC<br />
<strong>Homelessness</strong> Unaccompanied <strong>in</strong> the Homeless United Youth States<br />
Balance <strong>of</strong> State and Statewide CoCs<br />
Smaller Cities, Counties, and Regional CoCs<br />
Major Cities<br />
Data source: PIT 2017; Excludes Puerto Rico and U.S. territories<br />
0 100<br />
EXHIBIT 4.6: Unaccompanied Youth<br />
Experienc<strong>in</strong>g <strong>Homelessness</strong><br />
By CoC Category and Sheltered Status, 2017<br />
All Unaccompanied<br />
Homeless Youth<br />
Sheltered<br />
Unaccompanied<br />
Youth<br />
Unsheltered<br />
Unaccompanied<br />
Youth<br />
0% 100%<br />
Major Cities<br />
43.4<br />
54.9<br />
33.0 12.1<br />
41.3<br />
64.4 26.1<br />
Smaller City, County, and Regional CoCs<br />
Balance <strong>of</strong> State and Statewide CoCs<br />
15.3<br />
On a S<strong>in</strong>gle Night <strong>in</strong> January 2017<br />
• More than half (55%) <strong>of</strong> all unaccompanied<br />
homeless youth were counted <strong>in</strong> the nation’s<br />
major cities. Major cities accounted for a much<br />
larger share <strong>of</strong> the unsheltered population<br />
(64%) than the sheltered population (43%).<br />
• Smaller cities, counties, and regional CoCs<br />
had one-third <strong>of</strong> all unaccompanied homeless<br />
youth. <strong>The</strong>se CoCs accounted for a smaller<br />
share <strong>of</strong> unsheltered youth (26%) than <strong>of</strong><br />
sheltered youth (41%).<br />
• BoS and statewide CoCs account for 12<br />
percent <strong>of</strong> all unaccompanied homeless youth,<br />
n<strong>in</strong>e percent <strong>of</strong> unsheltered youth and 15<br />
percent <strong>of</strong> sheltered youth.<br />
• Five major cities (Los Angeles, San Jose, Las<br />
Vegas, New York City, and Seattle) accounted<br />
for one-third <strong>of</strong> all unaccompanied homeless<br />
youth <strong>in</strong> the country. Los Angeles had the<br />
largest number (5,163 or 13%), followed by San<br />
Jose (2,530 or 6%).<br />
• Los Angeles had the largest number <strong>of</strong><br />
unaccompanied homeless youth, more than<br />
double the number <strong>in</strong> the next largest city, San<br />
Jose. When Los Angeles is removed from the<br />
major cities category, major cities account for<br />
only 27 percent <strong>of</strong> sheltered unaccompanied<br />
youth, and smaller cities, counties and regional<br />
9.4<br />
CoCs account for 53 percent. Remov<strong>in</strong>g<br />
Los Angeles has only a slight effect on the<br />
percentage <strong>of</strong> unsheltered unaccompanied<br />
youth located <strong>in</strong> major cities (64% with Los<br />
Angeles, 62% without Los Angeles).<br />
• Major cities account for a higher percentage <strong>of</strong><br />
unsheltered unaccompanied youth than they<br />
do all unsheltered <strong>in</strong>dividuals (64% compared<br />
to 56%) and a lower percentage <strong>of</strong> sheltered<br />
unaccompanied youth compared to sheltered<br />
<strong>in</strong>dividuals (43% compared to 48%).<br />
• In four major cities, more than 80 percent <strong>of</strong><br />
unaccompanied youth were unsheltered. <strong>The</strong><br />
highest rate was <strong>in</strong> San Jose, where 96 percent<br />
<strong>of</strong> unaccompanied youth were unsheltered. In<br />
Las Vegas, 93 percent <strong>of</strong> unaccompanied youth<br />
were unsheltered, <strong>in</strong> San Francisco, 88 percent,<br />
and <strong>in</strong> Los Angeles, 80 percent were stay<strong>in</strong>g <strong>in</strong><br />
unsheltered locations.<br />
Cont<strong>in</strong>uums <strong>of</strong> Care (CoC) Were<br />
Divided <strong>in</strong>to Three Geographic<br />
Categories<br />
Major city CoCs (n=48) cover the 50 largest<br />
cities <strong>in</strong> the United States. In two cases<br />
(Phoenix and Mesa, AZ, and Arl<strong>in</strong>gton and<br />
Fort Worth, TX), two large cities were located<br />
<strong>in</strong> the same CoC.<br />
Smaller city, county, and regional CoCs<br />
(n=306) are jurisdictions that are neither one<br />
<strong>of</strong> the 50 largest cities <strong>in</strong> the United States nor<br />
Balance <strong>of</strong> State and Statewide CoCs.<br />
Balance <strong>of</strong> State (BoS) and statewide CoCs<br />
(n=40) are typically composed <strong>of</strong> multiple<br />
rural counties or represent an entire state.<br />
48
<strong>The</strong> 2017 Annual Homeless Assessment Report to Congress: Part 1<br />
• Among smaller cities, counties, and regional<br />
CoCs, seven <strong>of</strong> the ten CoCs with the largest<br />
numbers <strong>of</strong> unaccompanied homeless youth<br />
experienc<strong>in</strong>g homelessness were located <strong>in</strong><br />
California. <strong>The</strong> CoC cover<strong>in</strong>g Monterey and<br />
San Benito Counties had the largest number<br />
(627).<br />
• Eleven smaller cities, counties, and regional<br />
CoCs had rates <strong>of</strong> unsheltered unaccompanied<br />
youth above 90 percent. <strong>The</strong> highest rates<br />
were found <strong>in</strong> Santa Cruz, where 98 percent <strong>of</strong><br />
unaccompanied homeless youth were stay<strong>in</strong>g<br />
<strong>in</strong> places not meant for human habitation,<br />
and Pasco County, Florida, which had an<br />
unsheltered rate <strong>of</strong> 96 percent.<br />
• Of BoS and statewide CoCs, Hawaii BoS had<br />
the highest rate <strong>of</strong> unsheltered unaccompanied<br />
youth (95%), followed by Oregon BoS (77%).<br />
EXHIBIT 4.7: CoCs with the Largest Numbers <strong>of</strong><br />
Unaccompanied Homeless Youth<br />
By CoC Category, 2017<br />
Major City CoCs<br />
Smaller City, County,<br />
and Regional CoCs<br />
Balance <strong>of</strong> State<br />
or Statewide CoCs<br />
CoC<br />
Total<br />
Unaccompanied<br />
Homeless Youth<br />
CoC<br />
Total<br />
Unaccompanied<br />
Homeless Youth<br />
CoC<br />
Total<br />
Unaccompanied<br />
Homeless Youth<br />
Los Angeles City &<br />
County, CA<br />
San Jose/Santa Clara City<br />
& County, CA<br />
Las Vegas/Clark County,<br />
NV<br />
5,163 Sal<strong>in</strong>as/Monterey, San<br />
Benito Counties, CA<br />
2,530 Watsonville/Santa Cruz<br />
City & County, CA<br />
2,052 Santa Rosa/Petaluma/<br />
Sonoma County, CA<br />
627 Oregon Balance <strong>of</strong> State 847<br />
586 Texas Balance <strong>of</strong> State 417<br />
532 Wash<strong>in</strong>gton Balance <strong>of</strong><br />
State<br />
New York City, NY 2,003 Pasco County, FL 329 Colorado Balance <strong>of</strong> State 240<br />
Seattle/K<strong>in</strong>g County, WA 1,498 Riverside City & County,<br />
CA<br />
314<br />
257 Indiana Balance <strong>of</strong> State 221<br />
San Francisco, CA 1,274 Vallejo/Solano County, CA 210 Ohio Balance <strong>of</strong> State 201<br />
San Diego City and<br />
County, CA<br />
Oakland/Alameda County,<br />
CA<br />
Metropolitan Denver<br />
Homeless Initiative, CO<br />
Phoenix/Mesa/Maricopa<br />
County Regional, AZ<br />
1,160 Honolulu, HI 210 Ma<strong>in</strong>e Balance <strong>of</strong> State 178<br />
991 San Luis Obispo County,<br />
CA<br />
436 San Bernard<strong>in</strong>o City &<br />
County, CA<br />
196 Georgia Balance <strong>of</strong> State 177<br />
166 Wiscons<strong>in</strong> Balance <strong>of</strong><br />
State<br />
320 St. Louis County, MO 155 Kentucky Balance <strong>of</strong> State 135<br />
142<br />
49
4Estimates 1National Estimates by CoC<br />
<strong>Homelessness</strong> Unaccompanied <strong>in</strong> the Homeless United Youth States<br />
Data source: PIT 2017; Excludes Puerto Rico and U.S. territories<br />
EXHIBIT 4.8: CoCs with the Highest and Lowest Rates <strong>of</strong> Unaccompanied Homeless Youth<br />
Who are Unsheltered<br />
By CoC Category, 2017<br />
Major City CoCs<br />
Smaller City, County,<br />
and Regional CoCs<br />
Balance <strong>of</strong> State<br />
and Statewide CoCs<br />
CoC<br />
Total<br />
Unaccompanied<br />
Homeless Youth<br />
Total<br />
%<br />
Unsheltered CoC Unaccompanied<br />
Homeless Youth<br />
Total<br />
%<br />
Unsheltered CoC Unaccompanied<br />
Homeless Youth<br />
%<br />
Unsheltered<br />
Highest Rates<br />
San Jose/Santa<br />
Clara City &<br />
County, CA<br />
Las Vegas/Clark<br />
County, NV<br />
2,530 96.3<br />
San Francisco, CA 1,274 88.2<br />
Los Angeles City &<br />
County, CA<br />
Seattle/K<strong>in</strong>g<br />
County, WA<br />
Lowest Rates<br />
Watsonville/<br />
Santa Cruz City &<br />
County, CA<br />
586 97.8<br />
2,052 92.6 Pasco County, FL 329 96.4<br />
5,163 80.4<br />
1,498 76.2<br />
Detroit, MI 134 3.0<br />
Boston, MA 190 3.7<br />
Kansas City,<br />
Independence,<br />
Lee’s Summit/<br />
Jackson,<br />
Wyandotte<br />
Counties, MO<br />
& KS<br />
M<strong>in</strong>neapolis/<br />
Hennep<strong>in</strong> County,<br />
MN<br />
Atlanta Cont<strong>in</strong>uum<br />
<strong>of</strong> Care, GA<br />
124 6.5<br />
243 8.6<br />
Excludes CoCs with fewer than 100 unaccompanied youth.<br />
San Luis Obispo<br />
County, CA<br />
Sal<strong>in</strong>as/Monterey,<br />
San Benito<br />
Counties, CA<br />
Santa Rosa/<br />
Petaluma/<br />
Sonoma County,<br />
CA<br />
Nassau, Suffolk<br />
Counties/<br />
Babylon/Islip/<br />
Hunt<strong>in</strong>gton, NY<br />
Rochester/<br />
Southeast<br />
M<strong>in</strong>nesota, MN<br />
Rochester/<br />
Irondequoit/<br />
Greece/Monroe<br />
County, NY<br />
St. Louis County,<br />
MO<br />
196 95.4<br />
627 93.9<br />
532 90.8<br />
118 2.5<br />
133 5.3<br />
112 6.3<br />
155 7.7<br />
199 9.0 Anchorage, AK 115 12.2<br />
Hawaii<br />
Balance <strong>of</strong><br />
State<br />
Oregon<br />
Balance <strong>of</strong><br />
State<br />
Colorado<br />
Balance <strong>of</strong><br />
State<br />
Georgia<br />
Balance <strong>of</strong><br />
State<br />
Texas<br />
Balance <strong>of</strong><br />
State<br />
Wiscons<strong>in</strong><br />
Balance <strong>of</strong><br />
State<br />
Indiana<br />
Balance <strong>of</strong><br />
State<br />
Ma<strong>in</strong>e<br />
Balance <strong>of</strong><br />
State<br />
Michigan<br />
Balance <strong>of</strong><br />
State<br />
Ohio<br />
Balance <strong>of</strong><br />
State<br />
109 94.5<br />
847 76.5<br />
240 68.8<br />
177 59.3<br />
417 58.8<br />
142 3.5<br />
221 14.5<br />
178 19.7<br />
135 21.5<br />
201 21.9<br />
50
<strong>The</strong> 2017 Annual Homeless Assessment Report to Congress: Part 1<br />
51
5National 1National Estimates<br />
Homeless Veterans<br />
<strong>Homelessness</strong> <strong>in</strong> the United States<br />
Data source: PIT 2009–2017<br />
EXHIBIT 5.1: PIT Estimates <strong>of</strong><br />
Homeless Veterans<br />
By Sheltered Status, 2009–2017<br />
73,367 74,087<br />
43,409 43,437<br />
65,455<br />
40,033<br />
60,579<br />
55,619<br />
49,689<br />
29,958 30,650<br />
25,422 25,436<br />
35,143 34,909<br />
32,119<br />
47,725<br />
39,471<br />
40,056<br />
households without children who were white<br />
(52%). One-third <strong>of</strong> veterans experienc<strong>in</strong>g<br />
homelessness were African American, and five<br />
percent were multiracial.<br />
• Veterans experienc<strong>in</strong>g homelessness were<br />
nearly half as likely to be Hispanic as<br />
<strong>in</strong>dividuals experienc<strong>in</strong>g homelessness (10%<br />
compared to 19%) and less than half as likely<br />
as all people experienc<strong>in</strong>g homelessness (10%<br />
compared to 22%).<br />
20,710<br />
17,570<br />
31,505<br />
16,220<br />
26,404<br />
13,067<br />
24,690<br />
15,366<br />
2009 2010 2011 2012 2013 2014 2015 2016 2017<br />
Homeless Veterans<br />
Sheltered Veterans<br />
Unsheltered Veterans<br />
On a S<strong>in</strong>gle Night <strong>in</strong> January 2017<br />
• 40,056 veterans were experienc<strong>in</strong>g<br />
homelessness <strong>in</strong> the U.S., just over n<strong>in</strong>e percent<br />
80000<br />
<strong>of</strong> all homeless adults.<br />
70000 • Three <strong>in</strong> five homeless veterans (62% or 24,690<br />
veterans) were stay<strong>in</strong>g <strong>in</strong> emergency shelters<br />
60000 or transitional hous<strong>in</strong>g programs, while two<br />
50000 <strong>in</strong> five (38% or 15,366 veterans) were found <strong>in</strong><br />
places not suitable for human habitation.<br />
40000 • Almost all veterans were experienc<strong>in</strong>g<br />
30000<br />
homelessness <strong>in</strong> households without children<br />
(98% or 39,101 veterans). About two percent<br />
20000 (955) were veterans who were homeless as<br />
part <strong>of</strong> a family.<br />
10000<br />
Demographic Characteristics<br />
• N<strong>in</strong>e <strong>in</strong> ten veterans experienc<strong>in</strong>g<br />
homelessness were men (91% or 36,302<br />
veterans).<br />
• Nearly six <strong>in</strong> ten veterans experienc<strong>in</strong>g<br />
homelessness (57%) were white, higher<br />
than the percent <strong>of</strong> all people experienc<strong>in</strong>g<br />
homelessness who were white (47%), and<br />
slightly higher than the percentage <strong>of</strong> people <strong>in</strong><br />
S<strong>in</strong>ce 2016<br />
• <strong>The</strong> number <strong>of</strong> homeless veterans <strong>in</strong>creased by<br />
585 people between 2016 and 2017.<br />
• This 2016-2017 <strong>in</strong>crease was driven entirely<br />
by an 18 percent <strong>in</strong>crease <strong>in</strong> the number<br />
<strong>of</strong> veterans experienc<strong>in</strong>g homelessness <strong>in</strong><br />
unsheltered places (2,299 more veterans).<br />
Partly <strong>of</strong>fsett<strong>in</strong>g the <strong>in</strong>crease <strong>in</strong> unsheltered<br />
veterans, the number <strong>of</strong> sheltered veterans<br />
decreased by 1,714 people (or 7%).<br />
• <strong>The</strong> number <strong>of</strong> homeless veterans who were<br />
women <strong>in</strong>creased by seven percent (243<br />
additional female veterans), and the number<br />
<strong>of</strong> veterans who were men <strong>in</strong>creased by one<br />
percent (347 additional male veterans). <strong>The</strong>se<br />
<strong>in</strong>creases were driven by <strong>in</strong>creases <strong>in</strong> the<br />
unsheltered population for both genders.<br />
• <strong>The</strong> number <strong>of</strong> veterans who were Hispanic<br />
<strong>in</strong>creased between 2016 and 2017, by 586<br />
people (or 17%). Hispanic veterans comprise 10<br />
percent <strong>of</strong> all homeless veterans and 15 percent<br />
<strong>of</strong> unsheltered veterans, up from 9 percent and<br />
13 percent <strong>in</strong> 2016.<br />
• Increases among veterans experienc<strong>in</strong>g<br />
homelessness were due entirely to <strong>in</strong>creases<br />
among veterans <strong>in</strong> households without children.<br />
<strong>The</strong> number <strong>of</strong> veterans <strong>in</strong> families decl<strong>in</strong>ed<br />
overall (by 16%), among sheltered veterans (by<br />
11%) and unsheltered veterans (by 29%).<br />
52
<strong>The</strong> 2017 Annual Homeless Assessment Report to Congress: Part 1<br />
S<strong>in</strong>ce 2009<br />
• Po<strong>in</strong>t-<strong>in</strong>-time data started to identify veterans<br />
<strong>in</strong> 2009. <strong>The</strong> number <strong>of</strong> veterans experienc<strong>in</strong>g<br />
homelessness <strong>in</strong>creased between 2009 and 2010<br />
and then dropped every year until this past year.<br />
• S<strong>in</strong>ce 2009, veteran homelessness has dropped<br />
considerably, with 45 percent (or 33,311) fewer<br />
veterans experienc<strong>in</strong>g homelessness <strong>in</strong> 2017<br />
than <strong>in</strong> 2009.<br />
• Veteran homelessness decreased both<br />
among those <strong>in</strong> shelters and those found <strong>in</strong><br />
unsheltered locations. Between 2009 and 2017,<br />
the number <strong>of</strong> unsheltered veterans decreased<br />
by 49 percent (or 14,592 fewer veterans), and<br />
by 43 percent (or 18,719 fewer veterans) among<br />
those stay<strong>in</strong>g <strong>in</strong> shelters.<br />
EXHIBIT 5.2: Proportion <strong>of</strong> Adults Experienc<strong>in</strong>g <strong>Homelessness</strong> Who Are Veterans<br />
Sheltered Status, 2017<br />
Sheltered Status<br />
# <strong>of</strong> Veterans Experienc<strong>in</strong>g<br />
<strong>Homelessness</strong><br />
# <strong>of</strong> Adults Experienc<strong>in</strong>g<br />
<strong>Homelessness</strong><br />
% <strong>of</strong> Adults Experienc<strong>in</strong>g<br />
<strong>Homelessness</strong> Who are<br />
Veterans<br />
Total 40,056 438,913 9.1<br />
Sheltered 24,690 257,578 9.6<br />
Unsheltered 15,366 181,335 8.5<br />
EXHIBIT 5.3: Demographic Characteristics <strong>of</strong> Homeless Veterans<br />
2017<br />
All Veterans Sheltered Veterans Unsheltered Veterans<br />
Characteristic<br />
# % # % # %<br />
Total Veterans 40,056 100 24,690 100% 15,366 100<br />
Gender<br />
Female 3,571 8.9 2,071 8.4 1,500 9.8<br />
Male 36,302 90.6 22,556 91.4 13,746 89.5<br />
Transgender 131 0.3 51 0.2 80 0.5<br />
Don’t Identify as Male,<br />
Female, or Transgender<br />
52 0.1 12 0.0 40 0.3<br />
Ethnicity<br />
Non-Hispanic 35,912 89.7 22,781 92.3 13,131 85.5<br />
Hispanic 4,144 10.3 1,909 7.7 2,235 14.5<br />
Race<br />
White 22,744 56.8 13,718 55.6 9,026 58.7<br />
African American 13,260 33.1 9,245 37.4 4,015 26.1<br />
Asian 447 1.1 188 0.8 259 1.7<br />
Native American 1,307 3.3 496 2.0 811 5.3<br />
Pacific Islander 376 0.9 134 0.5 242 1.6<br />
Multiple Races 1,922 4.8 909 3.7 1,013 6.6<br />
EXHIBIT 5.4: Change <strong>in</strong> Numbers <strong>of</strong> Homeless Veterans<br />
By Sheltered Status, 2009–2017<br />
2016–2017 2010–2017 2009–2017<br />
# % # % # %<br />
Total Veterans 585 1.5 -34,031 -45.9 -33,311 -45.4<br />
Sheltered -1,714 -6.5 -18,747 -43.2 -18,719 -43.1<br />
Unsheltered 2,299 17.6 -15,284 -49.9 -14,592 -48.7<br />
53
5State 1National Estimates<br />
Homeless Veterans<br />
<strong>Homelessness</strong> <strong>in</strong> the United States<br />
Data source: PIT 2009-2017<br />
EXHIBIT 5.5: Estimates <strong>of</strong> Homeless Veterans<br />
By State, 2017<br />
WA<br />
2,093<br />
OR<br />
1,251<br />
NV<br />
832<br />
CA<br />
11,472<br />
AK<br />
124<br />
MT<br />
ND<br />
205<br />
74<br />
ID<br />
SD<br />
228<br />
WY 130<br />
63<br />
NE<br />
174<br />
UT<br />
220 CO<br />
1,078 KS<br />
217<br />
AZ NM<br />
970 248<br />
TX<br />
2,200<br />
OK<br />
349<br />
ME,131<br />
VT, 94<br />
MN<br />
NH, 124<br />
281<br />
WI<br />
NY MA, 853<br />
329 MI<br />
1,244 RI, 95<br />
773<br />
CT, 191<br />
IA<br />
PA<br />
171 IL<br />
NJ, 583<br />
OH 963<br />
864 IN 862<br />
DE, 91<br />
615 WV MD, 536<br />
VA<br />
MO<br />
KY 137 DC, 285<br />
478<br />
538 489<br />
NC, 931<br />
Share <strong>of</strong> Homeless Veterans<br />
TN, 757<br />
AR<br />
SC<br />
Less than 1%<br />
239<br />
480<br />
MS AL<br />
1%–2.9%<br />
GA<br />
57 269<br />
3%–6%<br />
712<br />
LA<br />
Greater than 6%<br />
383<br />
FL 2,817<br />
HI<br />
615<br />
On a S<strong>in</strong>gle Night <strong>in</strong> January 2017<br />
• Just under 30 percent <strong>of</strong> all veterans<br />
experienc<strong>in</strong>g homelessness were <strong>in</strong> California<br />
(29% or 11,472 veterans).<br />
• In three states, more than half <strong>of</strong> all veterans<br />
experienc<strong>in</strong>g homelessness were unsheltered.<br />
Those states were: California (67%), Hawaii<br />
(62%), and Oregon (53%).<br />
• Three states sheltered more than 95 percent<br />
<strong>of</strong> homeless veterans. In Nebraska, only one<br />
percent <strong>of</strong> veterans were unsheltered, <strong>in</strong> Rhode<br />
Island only three percent, and <strong>in</strong> New York five<br />
percent.<br />
• Some states with large numbers <strong>of</strong> homeless<br />
veterans are not among the states with the<br />
largest numbers <strong>of</strong> veterans. Oregon had the<br />
fifth largest number <strong>of</strong> veterans experienc<strong>in</strong>g<br />
homelessness, but the 25th largest number<br />
<strong>of</strong> veterans. Colorado had the seventh largest<br />
homeless veteran population and the 19th<br />
largest population <strong>of</strong> all veterans. In Virg<strong>in</strong>ia,<br />
the reverse was true. <strong>The</strong> state had the eighth<br />
largest population <strong>of</strong> veterans and was 25th<br />
<strong>in</strong> its population <strong>of</strong> veterans experienc<strong>in</strong>g<br />
homelessness.<br />
S<strong>in</strong>ce 2016<br />
• While homelessness among veterans <strong>in</strong>creased<br />
nationwide between 2016 and 2017, veteran<br />
homelessness decreased <strong>in</strong> 36 states and the<br />
District <strong>of</strong> Columbia. <strong>The</strong> largest absolute<br />
decreases were <strong>in</strong> Georgia (343 fewer<br />
veterans) and South Carol<strong>in</strong>a (258). <strong>The</strong> largest<br />
percentage decrease was <strong>in</strong> Mississippi (60%),<br />
followed by North Dakota (36%), South Carol<strong>in</strong>a<br />
(35%), and Utah (34%).<br />
• <strong>The</strong> number <strong>of</strong> veterans experienc<strong>in</strong>g<br />
homelessness <strong>in</strong>creased <strong>in</strong> 14 states between<br />
2016 and 2017. <strong>The</strong> largest absolute <strong>in</strong>creases,<br />
and those driv<strong>in</strong>g the nationwide <strong>in</strong>crease,<br />
were <strong>in</strong> California (1,860 more veterans),<br />
Wash<strong>in</strong>gton (609), and Texas (432). <strong>The</strong> largest<br />
percentage <strong>in</strong>creases were <strong>in</strong> Wash<strong>in</strong>gton (41%),<br />
Kansas (28%), Texas (24%), and Montana (24%).<br />
54
<strong>The</strong> 2017 Annual Homeless Assessment Report to Congress: Part 1<br />
55
5State 1National Estimates<br />
Homeless Veterans<br />
<strong>Homelessness</strong> <strong>in</strong> the United States<br />
Data source: PIT 2009–2017; Excludes Puerto Rico and U.S. territories<br />
EXHIBIT 5.6: States with the Highest and Lowest Rates <strong>of</strong> Unsheltered Veterans<br />
2017<br />
Highest Rates<br />
CALIFORNIA<br />
HAWAII<br />
OREGON<br />
WASHINGTON<br />
NEW MEXICO<br />
66.7%<br />
61.5%<br />
53.4%<br />
47.7%<br />
45.6%<br />
11,472 Homeless<br />
7,657 Unsheltered<br />
615 Homeless<br />
378 Unsheltered<br />
1,251 Homeless<br />
668 Unsheltered<br />
2,093 Homeless<br />
999 Unsheltered<br />
248 Homeless<br />
113 Unsheltered<br />
Lowest Rates<br />
NEBRASKA<br />
RHODE ISLAND<br />
NEW YORK<br />
MASSACH<strong>US</strong>ETTS<br />
VERMONT<br />
1.1%<br />
3.2%<br />
4.7%<br />
5.3%<br />
5.3%<br />
174 Homeless<br />
2 Unsheltered<br />
95 Homeless<br />
3 Unsheltered<br />
1,244 Homeless<br />
58 Unsheltered<br />
853 Homeless<br />
45 Unsheltered<br />
94 Homeless<br />
5 Unsheltered<br />
S<strong>in</strong>ce 2009<br />
• Between 2009 and 2017, the number <strong>of</strong><br />
veterans experienc<strong>in</strong>g homelessness decreased<br />
<strong>in</strong> 45 states plus the District <strong>of</strong> Columbia, with<br />
the largest absolute decreases <strong>in</strong> California<br />
(6,501 fewer veterans), New York (4,635), and<br />
Florida (4,318). New York also had a large<br />
percentage decrease, 79 percent. Other large<br />
percentage decreases were <strong>in</strong> Mississippi<br />
(84%), Louisiana (81%), and Alabama (75%).<br />
• <strong>The</strong> number <strong>of</strong> veterans experienc<strong>in</strong>g<br />
homelessness <strong>in</strong>creased <strong>in</strong> five states between<br />
2009 and 2017. <strong>The</strong> largest absolute <strong>in</strong>creases<br />
were <strong>in</strong> Wash<strong>in</strong>gton (130 more veterans) and<br />
Hawaii (116). <strong>The</strong> largest percentage <strong>in</strong>creases<br />
were <strong>in</strong> Vermont (54%) and Utah (33%).<br />
56
<strong>The</strong> 2017 Annual Homeless Assessment Report to Congress: Part 1<br />
EXHIBIT 5.7: Largest Changes <strong>in</strong> Homeless Veterans<br />
By State, 2016-2017 and 2009-2017<br />
Largest Increases<br />
2016–2017 2009–2017<br />
CALIFORNIA 1,860 / 19.4% WASHINGTON 130 / 6.6%<br />
WASHINGTON 609 / 41.0% HAWAII 116 / 23.3%<br />
TEXAS 432 / 24.4% UTAH 54 / 32.5%<br />
KANSAS 48 / 28.4% VERMONT 33 / 53.6%<br />
NORTH CAROLINA 43 / 4.8% MAINE 8 / 6.5%<br />
Largest Decreases<br />
GEORGIA -343 / -32.5% CALIFORNIA -6,501 / -36.2%<br />
SOUTH CAROLINA -258 / -35.0% NEW YORK -4,635 / -78.8%<br />
PENNSYLVANIA -173 / -15.2% FLORIDA -4,318 / -60.5%<br />
UTAH -115 / -34.3% TEXAS -3,291 / -59.9%<br />
ALABAMA -104 / -27.9% GEORGIA -2,048 / -74.2%<br />
Note: Figures from 2009-2017 exclude North Dakota, Colorado, South Dakota, Wyom<strong>in</strong>g, and Michigan.<br />
57
5Estimates 1National Estimates by CoC<br />
Homeless Veterans<br />
<strong>Homelessness</strong> <strong>in</strong> the United States<br />
Balance <strong>of</strong> State and Statewide CoCs<br />
Smaller Cities, Counties, and Regional CoCs<br />
Data source: PIT 2009-2017; Excludes Puerto Rico and U.S. territories<br />
Major Cities<br />
0 EXHIBIT 5.8: Homeless Veterans 100<br />
By CoC Category and Sheltered Status, 2017<br />
Homeless<br />
Veterans<br />
Sheltered<br />
Veterans<br />
Unsheltered<br />
Veterans<br />
0% 100%<br />
48.3<br />
44.3<br />
42.5<br />
54.6 32.1<br />
38.5 13.2<br />
13.1<br />
13.3<br />
• <strong>The</strong> smaller city, county, and regional CoCs<br />
<strong>of</strong> Santa Cruz City and County and Orange<br />
County <strong>in</strong> California had rates <strong>of</strong> unsheltered<br />
veterans at or above 85 percent (92% and 88%).<br />
Somerset County <strong>in</strong> New Jersey sheltered all<br />
veterans experienc<strong>in</strong>g homelessness <strong>in</strong> 2017.<br />
• Hawaii BoS and Georgia BoS had the highest<br />
rates <strong>of</strong> unsheltered veterans <strong>in</strong> the BoS and<br />
statewide category, with 86 percent and 75<br />
percent, respectively.<br />
Major Cities<br />
Smaller City, County, and Regional CoCs<br />
Balance <strong>of</strong> State and Statewide CoCs<br />
On a S<strong>in</strong>gle Night <strong>in</strong> January 2017<br />
• Nearly half <strong>of</strong> all homeless veterans were <strong>in</strong><br />
major cities (48%). Smaller cities, counties,<br />
and regional CoCs accounted for a 39 percent,<br />
while 13 percent <strong>of</strong> homeless veterans were <strong>in</strong><br />
BoS and statewide CoCs.<br />
• Major cities accounted for a higher percentage<br />
<strong>of</strong> unsheltered veterans than <strong>of</strong> sheltered<br />
veterans (55% versus 44%). In contrast, smaller<br />
cities, counties, and regional CoCs had a larger<br />
share <strong>of</strong> all sheltered veterans (43%) than <strong>of</strong><br />
unsheltered veterans (32%).<br />
• Some major cities with the largest numbers<br />
<strong>of</strong> homeless veterans are not among the cities<br />
with the largest numbers <strong>of</strong> veterans. Seattle,<br />
WA has the second largest number <strong>of</strong> homeless<br />
veterans but was 34th <strong>in</strong> its number <strong>of</strong> all<br />
veterans. San Antonio, TX and Jacksonville,<br />
FL had the second and fifth largest numbers<br />
<strong>of</strong> veterans but the 25th and 39th largest<br />
populations <strong>of</strong> homeless veterans.<br />
• <strong>The</strong> five major cities with the highest<br />
percentage <strong>of</strong> homeless veterans stay<strong>in</strong>g <strong>in</strong><br />
unsheltered locations were <strong>in</strong> California. Los<br />
Angeles had the highest rate, with 76 percent<br />
<strong>of</strong> homeless veterans stay<strong>in</strong>g <strong>in</strong> unsheltered<br />
locations there.<br />
Cont<strong>in</strong>uums <strong>of</strong> Care (CoC) Were<br />
Divided <strong>in</strong>to Three Geographic<br />
Categories<br />
Major city CoCs (n=48) cover the 50 largest<br />
cities <strong>in</strong> the United States. In two cases<br />
(Phoenix and Mesa, AZ, and Arl<strong>in</strong>gton and<br />
Fort Worth, TX), two large cities were located<br />
<strong>in</strong> the same CoC.<br />
Smaller city, county, and regional CoCs<br />
(n=306) are jurisdictions that are neither one<br />
<strong>of</strong> the 50 largest cities <strong>in</strong> the United States nor<br />
Balance <strong>of</strong> State and Statewide CoCs.<br />
Balance <strong>of</strong> State (BoS) and statewide CoCs<br />
(n=40) are typically composed <strong>of</strong> multiple<br />
rural counties or represent an entire state.<br />
Changes over Time<br />
• Between 2016 and 2017 all <strong>of</strong> the <strong>in</strong>creases<br />
<strong>in</strong> veteran homelessness occurred <strong>in</strong> major<br />
cities. <strong>The</strong> number <strong>of</strong> veterans experienc<strong>in</strong>g<br />
homelessness <strong>in</strong>creased by 12 percent <strong>in</strong> major<br />
cities (2,026 more veterans) but decl<strong>in</strong>ed across<br />
the other two categories <strong>of</strong> CoCs. In major<br />
cities, a 48 percent <strong>in</strong>crease <strong>in</strong> the number <strong>of</strong><br />
unsheltered veterans was only partly <strong>of</strong>fset by<br />
a six percent decl<strong>in</strong>e <strong>in</strong> sheltered veterans.<br />
58
<strong>The</strong> 2017 Annual Homeless Assessment Report to Congress: Part 1<br />
• However, s<strong>in</strong>ce these data were collected <strong>in</strong><br />
2009, the number <strong>of</strong> veterans experienc<strong>in</strong>g<br />
homelessness has dropped considerably across<br />
all CoC categories. <strong>The</strong> number <strong>of</strong> veterans<br />
experienc<strong>in</strong>g homelessness dropped by 31<br />
percent <strong>in</strong> major cities and by 29 percent <strong>in</strong><br />
both smaller cities, counties, and regional CoCs<br />
and BoS and statewide CoCs.<br />
• Between 2009 and 2017, both smaller cities,<br />
counties, and regional CoCs and BoS and<br />
statewide CoCs experienced larger decl<strong>in</strong>es<br />
<strong>in</strong> the numbers <strong>of</strong> veterans <strong>in</strong> unsheltered<br />
locations (44% and 40%, respectively) than <strong>in</strong><br />
sheltered locations (19% and 20%). In major<br />
cities the reverse was true. S<strong>in</strong>ce 2009 the<br />
number <strong>of</strong> veterans <strong>in</strong> shelter <strong>in</strong> major cities<br />
decl<strong>in</strong>ed by 43 percent, and by five percent <strong>in</strong><br />
unsheltered locations. This is due <strong>in</strong> large part<br />
to the recent uptick <strong>in</strong> unsheltered veterans <strong>in</strong><br />
major cities.<br />
EXHIBIT 5.9: CoCs with the Largest Numbers <strong>of</strong> Veterans Experienc<strong>in</strong>g <strong>Homelessness</strong><br />
By CoC Category, 2017<br />
Major City CoCs Smaller City, County, and Regional CoCs Balance <strong>of</strong> State and Statewide CoCs<br />
CoC<br />
Total<br />
Homeless<br />
Veterans<br />
CoC<br />
Total<br />
Homeless<br />
Veterans<br />
CoC<br />
Total<br />
Homeless<br />
Veterans<br />
Los Angeles City & County, CA 4,476 Honolulu, HI 449 Texas Balance <strong>of</strong> State 674<br />
Seattle/K<strong>in</strong>g County, WA 1,329<br />
Santa Ana/Anaheim/Orange<br />
County, CA<br />
San Diego City and County, CA 1,067 St.Petersburg/Clearwater/<br />
Largo/P<strong>in</strong>ellas County, FL<br />
Las Vegas/Clark County, NV 691<br />
San Francisco, CA 684<br />
San Jose/Santa Clara City &<br />
County, CA<br />
Asheville/Buncombe County,<br />
NC<br />
Watsonville/Santa Cruz City &<br />
County, CA<br />
405 Wash<strong>in</strong>gton Balance <strong>of</strong> State 383<br />
329 Oregon Balance <strong>of</strong> State 379<br />
239 Colorado Balance <strong>of</strong> State 332<br />
236 Indiana Balance <strong>of</strong> State 287<br />
660 Chester County, PA 224 Arizona Balance <strong>of</strong> State 238<br />
Denver, CO 548 Pasco County, FL 220 Montana Statewide 205<br />
New York City, NY 535<br />
Orlando/Orange, Osceola,<br />
Sem<strong>in</strong>ole Counties, FL<br />
Oakland/Alameda County, CA 531 Pittsfield/Berkshire County, MA 213<br />
Chicago, IL 528<br />
Santa Rosa/Petaluma/Sonoma<br />
County, CA<br />
218 Wiscons<strong>in</strong> Statewide 180<br />
North Carol<strong>in</strong>a Balance <strong>of</strong><br />
State<br />
176<br />
211 Hawaii Balance <strong>of</strong> State 166<br />
59
5Estimates 1National Estimates by CoC<br />
Homeless Veterans<br />
<strong>Homelessness</strong> <strong>in</strong> the United States<br />
Data source: PIT 2009-2017<br />
EXHIBIT 5.10: CoCs with the Highest and Lowest Rates <strong>of</strong> Unsheltered Veterans<br />
Experienc<strong>in</strong>g <strong>Homelessness</strong><br />
By CoC Category, 2017<br />
CoC<br />
Highest Rates<br />
Los Angeles City &<br />
Count, CA<br />
Oakland/Alameda<br />
County, CA<br />
Major City CoCs<br />
Total<br />
Homeless<br />
Veterans<br />
Smaller City, County,<br />
and Regional CoCs<br />
Total<br />
%<br />
Unsheltered CoC Homeless<br />
Veterans<br />
4,476 76.1%<br />
531 71.2%<br />
Watsonville/Santa<br />
Cruz City & County,<br />
CA<br />
Santa Ana/Anaheim/<br />
Orange County, CA<br />
Balance <strong>of</strong> State<br />
and Statewide CoCs<br />
Total<br />
%<br />
Unsheltered CoC Homeless<br />
Veterans<br />
236 91.9%<br />
405 88.1%<br />
Hawaii Balance<br />
<strong>of</strong> State<br />
Georgia Balance<br />
<strong>of</strong> State<br />
%<br />
Unsheltered<br />
166 86.1%<br />
157 74.5%<br />
Sacramento City &<br />
County, CA<br />
469 69.7% Pasco County, FL 220 79.5%<br />
Texas Balance <strong>of</strong><br />
State<br />
674 65.9%<br />
San Jose/Santa Clara<br />
City & County CoC,<br />
CA<br />
660 68.5% Eugene/Spr<strong>in</strong>gfield/<br />
Lane County, OR<br />
164 73.2%<br />
Oregon Balance<br />
<strong>of</strong> State<br />
379 63.3%<br />
Fresno/Madera<br />
County, CA<br />
211 58.3% Chico/Paradise/Butte<br />
County, CA<br />
110 72.7% Colorado<br />
Balance <strong>of</strong> State<br />
332 57.5%<br />
Omaha/Council<br />
Bluffs, NE<br />
M<strong>in</strong>neapolis/<br />
Hennep<strong>in</strong>, MN<br />
104 1.0% Somerset County, NJ 100 0.0% Wiscons<strong>in</strong><br />
Balance <strong>of</strong> State<br />
110 2.7% Chester County, PA 224 0.4%<br />
Boston, MA 233 3.4% C<strong>in</strong>c<strong>in</strong>nati/Hamilton,<br />
OH<br />
Memphis/Shelby<br />
County, TN<br />
Indianapolis, IN 328 4.6%<br />
213 4.2% Pittsfield/Berkshire<br />
County, MA<br />
Nassau, Suffolk<br />
Counties/Babylon/<br />
Islip/Hunt<strong>in</strong>gton, NY<br />
Excludes Puerto Rico and U.S. territories, and CoCs with fewer than 100 total homeless veterans.<br />
South Dakota<br />
Statewide<br />
192 1.0% Connecticut<br />
Statewide<br />
213 1.9%<br />
141 2.1%<br />
Ma<strong>in</strong>e Balance<br />
<strong>of</strong> State<br />
Indiana Balance<br />
<strong>of</strong> State<br />
180 5.0%<br />
130 5.4%<br />
143 8.4%<br />
131 8.4%<br />
287 10.8%<br />
60
<strong>The</strong> 2017 Annual Homeless Assessment Report to Congress: Part 1<br />
EXHIBIT 5.11: Veterans Experienc<strong>in</strong>g <strong>Homelessness</strong><br />
By CoC Category and Sheltered Status, 2009–2017<br />
25000<br />
20,922<br />
Major Cities,<br />
Sheltered<br />
20000<br />
19,191<br />
Major Cities,<br />
Unsheltered<br />
16,149<br />
15000<br />
10000<br />
5000<br />
12,960<br />
8,689<br />
4,047<br />
3,404<br />
14,253<br />
13,865<br />
11,296<br />
9,947<br />
8,643<br />
8,595<br />
4,801 4,851<br />
4,034<br />
3,369<br />
13,736<br />
13,444<br />
10,932<br />
10,479<br />
8,336<br />
7,308<br />
5,944 4,900<br />
5,058<br />
4,265<br />
3,239<br />
2,807<br />
2,029<br />
Smaller Cities, Counties,<br />
and Regional CoCs,<br />
Sheltered<br />
Smaller Cities, Counties,<br />
and Regional CoCs,<br />
Unsheltered<br />
Balance <strong>of</strong> State<br />
and Statewide CoCs,<br />
Sheltered<br />
Balance <strong>of</strong> State<br />
and Statewide CoCs,<br />
Unsheltered<br />
0<br />
2009 2011 2013 2015 2017<br />
EXHIBIT 5.12: Change <strong>in</strong> Numbers <strong>of</strong> Homeless Veterans<br />
By Sheltered Status and CoC Category, 2016–2017<br />
Total Change Sheltered Change Unsheltered Change<br />
# % # % # %<br />
Major Cities 2,026 11.8 -660 -5.7 2,686 47.5<br />
Smaller Cities, Counties, and<br />
Regional CoCs<br />
-1,185 -7.2 -1,027 -8.9 -158 -3.1<br />
Balance <strong>of</strong> State and Statewide CoCs -198 -3.6 -22 -0.7 -176 -8.0<br />
61
6National 1National Estimates<br />
<strong>Homelessness</strong> Chronically Homeless <strong>in</strong> the United Individuals States<br />
Data source: PIT 2007–2017<br />
EXHIBIT 6.1: PIT Estimates <strong>of</strong><br />
Chronically Homeless Individuals<br />
By Sheltered Status, 2007–2017<br />
119,813 120,115<br />
107,212<br />
106,062<br />
86,289<br />
86,962<br />
78,045<br />
96,268<br />
83,170<br />
74,697<br />
61,620 62,733 64,551 83,989<br />
63,621 77,486<br />
56,87152,786<br />
60,333<br />
54,815 52,890<br />
41,768 45,418 45,592<br />
43,329<br />
103,522<br />
38,971 32,647<br />
29,418 31,203<br />
28,355 24,596 26,629<br />
2007 2008 2009 2010 2011 2012 2013 2014 2015 2016 2017<br />
Chronically Homeless Individuals<br />
Sheltered Chronically Homeless Individuals<br />
Unsheltered Chronically Homeless Individuals<br />
On a S<strong>in</strong>gle Night <strong>in</strong> January 2017<br />
• Nearly one-quarter <strong>of</strong> <strong>in</strong>dividuals experienc<strong>in</strong>g<br />
homelessness had chronic patterns <strong>of</strong><br />
150000 homelessness (86,962 <strong>of</strong> 369,081 homeless<br />
<strong>in</strong>dividuals, or 24%).<br />
120000 • Nearly seven <strong>in</strong> ten chronically homeless<br />
<strong>in</strong>dividuals (69% or 60,333 people) were<br />
90000 stay<strong>in</strong>g <strong>in</strong> unsheltered locations such as under<br />
bridges, <strong>in</strong> cars, or <strong>in</strong> abandoned build<strong>in</strong>gs.<br />
60000<br />
This is much higher than the unsheltered rate<br />
for all people experienc<strong>in</strong>g homelessness as<br />
<strong>in</strong>dividuals <strong>in</strong> the United States, which was 48<br />
30000<br />
percent.<br />
S<strong>in</strong>ce 2016:<br />
• For the first time s<strong>in</strong>ce 2008, the number<br />
<strong>of</strong> <strong>in</strong>dividuals with chronic patterns <strong>of</strong><br />
homelessness <strong>in</strong>creased. Between 2016 and<br />
2017, chronic homelessness <strong>in</strong>creased by 12<br />
percent overall (or by 9,476 people), by eight<br />
percent (or 2,033) among sheltered <strong>in</strong>dividuals,<br />
and by 14 percent (or 7,443 people) among<br />
unsheltered <strong>in</strong>dividuals.<br />
• Individuals with chronic patterns <strong>of</strong><br />
homelessness made up a slightly larger share<br />
<strong>of</strong> all homeless <strong>in</strong>dividuals <strong>in</strong> 2017 (24%) than<br />
<strong>in</strong> 2016 (22%).<br />
S<strong>in</strong>ce 2007:<br />
• While chronic homelessness <strong>in</strong>creased recently,<br />
27 percent fewer <strong>in</strong>dividuals had chronic<br />
patterns <strong>of</strong> homelessness <strong>in</strong> 2017 than did <strong>in</strong><br />
2007, a decl<strong>in</strong>e <strong>of</strong> 32,851 people. <strong>The</strong> number<br />
<strong>of</strong> <strong>in</strong>dividuals who were unsheltered and<br />
chronically homeless decreased by 17,712<br />
(23%), and the number <strong>of</strong> sheltered chronically<br />
homeless <strong>in</strong>dividuals decl<strong>in</strong>ed by 15,139 (36%).<br />
• Between 2007 and 2017, the share <strong>of</strong><br />
<strong>in</strong>dividuals experienc<strong>in</strong>g homelessness who<br />
had chronic patterns <strong>of</strong> homelessness decl<strong>in</strong>ed<br />
from 29 percent to 24 percent.<br />
• <strong>The</strong> share <strong>of</strong> chronically homeless <strong>in</strong>dividuals<br />
who were unsheltered was higher <strong>in</strong> 2017<br />
(69%) than <strong>in</strong> 2007 (65%).<br />
0<br />
EXHIBIT 6.2: Change <strong>in</strong> Numbers <strong>of</strong> Chronically Homeless Individuals<br />
By Sheltered Status, 2007–2017<br />
Total Chronically<br />
Homeless Individuals<br />
Sheltered Chronically<br />
Homeless Individuals<br />
Unsheltered<br />
Chronically Homeless<br />
Individuals<br />
Change 2016–2017 Change 2010–2017 Change 2007–2017<br />
# % # % # %<br />
9,476 12.2% -19,100 -18.0% -32,851 -27.4%<br />
2,033 8.3% -16,700 -38.5% -15,139 -36.2%<br />
7,443 14.1% -2,400 -3.8% -17,712 -22.7%<br />
62
<strong>The</strong> 2017 Annual Homeless Assessment Report to Congress: Part 1<br />
63
6State 1National Estimates<br />
<strong>Homelessness</strong> Chronically Homeless <strong>in</strong> the United Individuals States<br />
Data source: PIT 2007-2017, Excludes PR and <strong>US</strong> territories<br />
EXHIBIT 6.3: Estimates <strong>of</strong> Chronically Homeless Individuals<br />
By State, 2017<br />
WA<br />
4,357<br />
OR<br />
3,120<br />
NV<br />
502<br />
CA<br />
35,798<br />
AK<br />
216<br />
ID<br />
391<br />
UT<br />
163<br />
AZ<br />
1,463<br />
MT<br />
182<br />
WY<br />
14<br />
CO<br />
2,126<br />
NM<br />
712<br />
ND<br />
37<br />
SD<br />
101<br />
NE<br />
361<br />
KS<br />
252<br />
OK<br />
578<br />
TX<br />
3,497<br />
ME, 189<br />
VT, 111<br />
MN<br />
NH, 100<br />
813<br />
WI<br />
NY MA, 1,238<br />
342 MI<br />
5,087 RI, 240<br />
709<br />
PA<br />
CT, 387<br />
IA<br />
IL OH<br />
NJ,<br />
170<br />
1,372 955<br />
1,355 IN 725<br />
DE, 123<br />
486 WV MD, 1,436<br />
VA<br />
MO<br />
KY 188 864<br />
DC, 1,470<br />
883<br />
383<br />
Share <strong>of</strong> Chronically<br />
NC, 994<br />
Homeless Individuals<br />
TN, 1,295<br />
AR<br />
SC<br />
Less than 1%<br />
450<br />
792<br />
MS AL<br />
1%–2.9%<br />
GA<br />
61 344 963<br />
3%–6%<br />
LA<br />
Greater than 6%<br />
609<br />
FL<br />
4,951<br />
HI<br />
1,588<br />
On a S<strong>in</strong>gle Night <strong>in</strong> January 2017<br />
• California accounted for 42 percent <strong>of</strong><br />
all <strong>in</strong>dividuals with chronic patterns <strong>of</strong><br />
homelessness <strong>in</strong> the United States, which<br />
is higher than its share <strong>of</strong> all <strong>in</strong>dividuals<br />
experienc<strong>in</strong>g homelessness <strong>in</strong> the United<br />
States (31%). California accounted for more<br />
than half <strong>of</strong> the nation’s unsheltered chronically<br />
homeless <strong>in</strong>dividuals (53%).<br />
• More than half <strong>of</strong> all chronically homeless<br />
<strong>in</strong>dividuals were <strong>in</strong> three states: CA (42%), NY<br />
(6%), and FL (6%).<br />
• In n<strong>in</strong>e states, the percent <strong>of</strong> chronically<br />
homeless <strong>in</strong>dividuals stay<strong>in</strong>g <strong>in</strong> unsheltered<br />
locations exceeded 70 percent, with California<br />
and Hawaii report<strong>in</strong>g the highest rates (88%<br />
and 90%).<br />
• Wyom<strong>in</strong>g and Ma<strong>in</strong>e sheltered all <strong>in</strong>dividuals<br />
with chronic patterns <strong>of</strong> homelessness. Rhode<br />
Island and Indiana also had low rates <strong>of</strong><br />
unsheltered chronic homelessness, with 10<br />
percent <strong>of</strong> <strong>in</strong>dividuals liv<strong>in</strong>g <strong>in</strong> unsheltered<br />
locations <strong>in</strong> Rhode Island and 11 percent <strong>in</strong><br />
Indiana.<br />
• Individuals were most likely to have chronic<br />
patterns <strong>of</strong> homelessness if they were <strong>in</strong><br />
the District <strong>of</strong> Columbia, with 41 percent<br />
<strong>of</strong> homeless <strong>in</strong>dividuals there experienc<strong>in</strong>g<br />
chronic homelessness. Three states had rates<br />
above 30 percent: New Mexico (38%), Hawaii<br />
(35%), and California (32%). <strong>The</strong>se three states<br />
and the District <strong>of</strong> Columbia also had among<br />
the highest rates <strong>of</strong> homeless <strong>in</strong>dividuals with<br />
chronic patterns <strong>of</strong> homelessness <strong>in</strong> 2016.<br />
64
<strong>The</strong> 2017 Annual Homeless Assessment Report to Congress: Part 1<br />
EXHIBIT 6.4: States with the Highest and Lowest Rates <strong>of</strong> Unsheltered Chronically<br />
Homeless Individuals<br />
2017<br />
Highest Rates<br />
HAWAII<br />
CALIFORNIA<br />
MISSISSIPPI<br />
FLORIDA<br />
NEVADA<br />
89.7%<br />
87.6%<br />
78.7%<br />
77.2%<br />
75.9%<br />
1,588 Homeless<br />
1,424 Unsheltered<br />
35,798 Homeless<br />
31,368 Unsheltered<br />
61 Homeless<br />
48 Unsheltered<br />
4,951 Homeless<br />
3,824 Unsheltered<br />
502 Homeless<br />
381 Unsheltered<br />
Lowest Rates<br />
MAINE<br />
WYOMING<br />
RHODE ISLAND<br />
INDIANA<br />
WISCONSIN<br />
0.0%<br />
0.0%<br />
10.4%<br />
11.1%<br />
19.6%<br />
189 Homeless<br />
0 Unsheltered<br />
14 Homeless<br />
0 Unsheltered<br />
240 Homeless<br />
25 Unsheltered<br />
486 Homeless<br />
54 Unsheltered<br />
342 Homeless<br />
67 Unsheltered<br />
EXHIBIT 6.5: Largest Change <strong>in</strong> the Numbers <strong>of</strong> Chronically Homeless Individuals<br />
By State, 2007–2017<br />
2016–2017 2007–2017<br />
Largest Increases<br />
CALIFORNIA 5,996 / 20.1% WASHINGTON 1,754 / 67.4%<br />
WASHINGTON 2,050 / 88.9% HAWAII 810 / 104.1%<br />
NEW YORK 975 / 23.7% IDAHO 296 / 311.6%<br />
COLORADO 484 / 29.5% OREGON 291 / 10.3%<br />
ILLINOIS 418 / 44.6% SOUTH CAROLINA 219 / 38.2%<br />
Largest Decreases<br />
GEORGIA -695 / -41.9% CALIFORNIA -4,543 / -11.3%<br />
FLORIDA -464 / -8.6% TEXAS -4,434 / -55.9%<br />
TENNESSEE -345 / -21.0% FLORIDA -2,512 / -33.7%<br />
NEW HAMPSHIRE -127 / -55.9% OHIO -1,583 / -68.6%<br />
SOUTH CAROLINA -121 / -13.3% NEW JERSEY -1,570 / -62.2%<br />
Due to methodological changes, Michigan was excluded from the list <strong>of</strong> largest changes 2007-2017.<br />
65
6State 1National Estimates<br />
<strong>Homelessness</strong> Chronically Homeless <strong>in</strong> the United Individuals States<br />
Data source: PIT 2007–2017; Excludes Puerto Rico and U.S. territories<br />
Changes Over Time<br />
• Over half <strong>of</strong> all states, 28, experienced an<br />
<strong>in</strong>crease between 2016 and 2017 <strong>in</strong> the<br />
number <strong>of</strong> <strong>in</strong>dividuals with chronic patterns <strong>of</strong><br />
homelessness. California by far had the largest<br />
<strong>in</strong>crease, with 5,996 more chronically homeless<br />
<strong>in</strong>dividuals <strong>in</strong> 2017 than <strong>in</strong> 2016. <strong>The</strong> next<br />
largest <strong>in</strong>crease occurred <strong>in</strong> Wash<strong>in</strong>gton, with<br />
2,050 more <strong>in</strong>dividuals with chronic patterns <strong>of</strong><br />
homelessness there <strong>in</strong> 2017. Other states with<br />
the largest absolute <strong>in</strong>creases were: New York<br />
(975), Colorado (484), and Ill<strong>in</strong>ois (418).<br />
• Of the 22 states and the District <strong>of</strong> Columbia<br />
that had decl<strong>in</strong>es <strong>in</strong> the number <strong>of</strong> chronically<br />
homeless <strong>in</strong>dividuals between 2016 and 2017,<br />
the largest absolute decreases occurred <strong>in</strong><br />
Georgia (695 fewer people), Florida (464), and<br />
Tennessee (345).<br />
• Over a longer period <strong>of</strong> time, 2007-2017,<br />
38 states and the District <strong>of</strong> Columbia had<br />
decreases <strong>in</strong> chronic homelessness among<br />
<strong>in</strong>dividuals. California experienced the largest<br />
decl<strong>in</strong>e <strong>in</strong> the number <strong>of</strong> chronically homeless<br />
<strong>in</strong>dividuals, with 4,543 fewer chronically<br />
homeless <strong>in</strong>dividuals <strong>in</strong> 2017 than <strong>in</strong> 2007.<br />
Texas also experienced a considerable<br />
decl<strong>in</strong>e, with 4,434 fewer chronically<br />
homeless <strong>in</strong>dividuals. Other states with large<br />
absolute decl<strong>in</strong>es were: Florida (2,512 fewer<br />
people), Ohio (1,583), New Jersey (1,570),<br />
Massachusetts (1,552), and Georgia (1,521).<br />
• Among the 12 states that experienced <strong>in</strong>creases<br />
<strong>in</strong> the number <strong>of</strong> <strong>in</strong>dividuals with chronic<br />
patterns <strong>of</strong> homelessness between 2007 and<br />
2017, the largest absolute <strong>in</strong>creases occurred<br />
<strong>in</strong> Wash<strong>in</strong>gton, with 1,754 more chronically<br />
homeless <strong>in</strong>dividuals <strong>in</strong> 2017 than <strong>in</strong> 2007.<br />
Other states with large absolute <strong>in</strong>creases<br />
were: Hawaii (810 more chronically homeless<br />
<strong>in</strong>dividuals), Idaho (296), and Oregon (291).<br />
More than half <strong>of</strong> all chronically<br />
homeless <strong>in</strong>dividuals were <strong>in</strong> three<br />
states: CA (42%), NY (6%), and FL<br />
(6%).<br />
66
<strong>The</strong> 2017 Annual Homeless Assessment Report to Congress: Part 1<br />
67 67
6Estimates 1National Estimates by CoC<br />
<strong>Homelessness</strong> Chronically Homeless <strong>in</strong> the United Individuals States<br />
Data source: PIT 2007-2017<br />
Balance <strong>of</strong> State and Statewide CoCs<br />
Smaller Cities, Counties, and Regional CoCs<br />
Major Cities<br />
EXHIBIT 6.6: Chronically Homeless<br />
Individuals<br />
0 100<br />
By CoC Category and Sheltered Status, 2017<br />
All Chronically<br />
Homeless<br />
Sheltered<br />
Chronically Homeless<br />
Individuals<br />
Unsheltered<br />
Chronically Homeless<br />
Individuals<br />
0% 100%<br />
Major Cities<br />
51.2<br />
57.3<br />
33.3 9.4<br />
36.3<br />
12.5<br />
60.1 31.9 8.0<br />
Smaller City, County, and Regional CoCs<br />
Balance <strong>of</strong> State and Statewide CoCs<br />
On a S<strong>in</strong>gle Night <strong>in</strong> January 2017<br />
• Los Angeles had the largest number<br />
<strong>of</strong> <strong>in</strong>dividuals with chronic patterns <strong>of</strong><br />
homelessness, with 19 percent <strong>of</strong> the nation’s<br />
chronically homeless <strong>in</strong>dividuals, 16,016 people.<br />
New York City had the second largest number,<br />
with 4,401 <strong>in</strong>dividuals with chronic patterns <strong>of</strong><br />
homelessness.<br />
• Major city CoCs accounted for 57 percent<br />
<strong>of</strong> all <strong>in</strong>dividuals with chronic patterns <strong>of</strong><br />
homelessness, smaller cities, counties and<br />
regional CoCs had 33 percent, and BoS and<br />
statewide CoCs accounted for n<strong>in</strong>e percent <strong>of</strong><br />
chronically homeless <strong>in</strong>dividuals.<br />
• Major cities accounted for a larger share <strong>of</strong> the<br />
chronically homeless <strong>in</strong>dividual population<br />
found <strong>in</strong> places not suitable for human<br />
habitation, (60%) than <strong>of</strong> the sheltered chronic<br />
population (51%).<br />
• Boston, MA had the lowest percentage<br />
<strong>of</strong> <strong>in</strong>dividuals with chronic patterns <strong>of</strong><br />
homelessness who were unsheltered, at seven<br />
percent. Ma<strong>in</strong>e BoS reported no unsheltered<br />
chronically homeless <strong>in</strong>dividuals on the night <strong>of</strong><br />
the count. Among smaller cities, counties, and<br />
regional CoCs, Cambridge, MA reported the<br />
lowest unsheltered rate (14%) followed closely<br />
by Grand Rapids, MI (15%).<br />
• <strong>The</strong> District <strong>of</strong> Columbia and Long Beach,<br />
CA had the highest rates <strong>of</strong> chronic<br />
homelessness among homeless <strong>in</strong>dividuals<br />
<strong>of</strong> major cities, each with 41 percent. While<br />
Los Angeles and New York had the largest<br />
numbers <strong>of</strong> <strong>in</strong>dividuals with chronic patterns<br />
<strong>of</strong> homelessness, their rates <strong>of</strong> chronic<br />
homelessness were not among the highest<br />
(34% <strong>in</strong> Los Angeles and 14% <strong>in</strong> New York).<br />
• Among smaller cities, counties, and regional<br />
CoCs, Hendry, Hardee, and Highlands<br />
Counties <strong>in</strong> Florida had the highest rate <strong>of</strong><br />
chronic homelessness among <strong>in</strong>dividuals<br />
(63%) followed by Norman, OK (61%). In New<br />
Mexico BoS, almost half (48%) <strong>of</strong> <strong>in</strong>dividuals<br />
experienc<strong>in</strong>g homelessness had chronic<br />
patterns <strong>of</strong> homelessness, the highest rate <strong>of</strong> its<br />
CoC category.<br />
Cont<strong>in</strong>uums <strong>of</strong> Care (CoC) Were<br />
Divided <strong>in</strong>to Three Geographic<br />
Categories<br />
Major city CoCs (n=48) cover the 50 largest<br />
cities <strong>in</strong> the United States. In two cases<br />
(Phoenix and Mesa, AZ, and Arl<strong>in</strong>gton and<br />
Fort Worth, TX), two large cities were located<br />
<strong>in</strong> the same CoC.<br />
Smaller city, county, and regional CoCs<br />
(n=306) are jurisdictions that are neither one<br />
<strong>of</strong> the 50 largest cities <strong>in</strong> the United States nor<br />
Balance <strong>of</strong> State and Statewide CoCs.<br />
Balance <strong>of</strong> State (BoS) and statewide CoCs<br />
(n=40) are typically composed <strong>of</strong> multiple<br />
rural counties or represent an entire state.<br />
68
<strong>The</strong> 2017 Annual Homeless Assessment Report to Congress: Part 1<br />
EXHIBIT 6.7: CoCs with the Largest Numbers <strong>of</strong> Chronically Homeless Individuals<br />
By CoC Category, 2017<br />
CoC<br />
Major City CoCs Smaller City, County, and Regional CoCs Balance <strong>of</strong> State and Statewide CoCs<br />
Total<br />
Chronically<br />
Homeless<br />
Individuals<br />
CoC<br />
Total<br />
Chronically<br />
Homeless<br />
Individuals<br />
CoC<br />
Total<br />
Chronically<br />
Homeless<br />
Individuals<br />
Los Angeles City & County, CA 16,016 Honolulu, HI 1,037 Wash<strong>in</strong>gton Balance <strong>of</strong> State 834<br />
New York City, NY 4,401 Sal<strong>in</strong>as/Monterey, San Benito<br />
Counties, CA<br />
Seattle/K<strong>in</strong>g County, WA 2,483 Santa Ana/Anaheim/Orange<br />
County, CA<br />
San Francisco, CA 2,112 St. Petersburg/Clearwater/<br />
Largo/P<strong>in</strong>ellas County, FL<br />
San Diego City and County, CA 2,088 Santa Rosa/Petaluma/Sonoma<br />
County, CA<br />
San Jose/Santa Clara City &<br />
County, CA<br />
2,018 Eugene/Spr<strong>in</strong>gfield/Lane<br />
County, OR<br />
Oakland/Alameda County, CA 1,620 Ft Lauderdale/Broward County,<br />
FL<br />
District <strong>of</strong> Columbia 1,470 Watsonville/Santa Cruz City &<br />
County, CA<br />
Portland-Gresham-Multnomah<br />
County, OR<br />
1,240 Chico/Paradise/Butte County<br />
CoC, CA<br />
900 Texas Balance <strong>of</strong> State 764<br />
873 Colorado Balance <strong>of</strong> State 722<br />
690 Oregon Balance <strong>of</strong> State 668<br />
577 Hawaii Balance <strong>of</strong> State 551<br />
568 New Mexico Balance <strong>of</strong> State 368<br />
558 Arizona Balance <strong>of</strong> State 358<br />
525 Connecticut Balance <strong>of</strong> State 339<br />
495 North Carol<strong>in</strong>a Balance <strong>of</strong> State 321<br />
Sacramento City & County, CA 1,091 Vallejo/Solano County, CA 425 Indiana Balance <strong>of</strong> State 305<br />
Changes Over Time<br />
• Between 2016 and 2017, the number<br />
<strong>of</strong> <strong>in</strong>dividuals with chronic patterns <strong>of</strong><br />
homelessness <strong>in</strong>creased both <strong>in</strong> major cities and<br />
<strong>in</strong> smaller cities, counties, and regional CoCs,<br />
while it dropped <strong>in</strong> BoS and statewide CoCs.<br />
• Increases between 2016 and 2017 were steepest<br />
<strong>in</strong> major cities, with 9,234 more chronically<br />
homeless <strong>in</strong>dividuals <strong>in</strong> those CoCs (a 23%<br />
rise). Major cities experienced <strong>in</strong>creases <strong>in</strong><br />
the number <strong>of</strong> sheltered chronically homeless<br />
<strong>in</strong>dividuals (14% <strong>in</strong>crease) and unsheltered<br />
chronically homeless <strong>in</strong>dividuals (27%).<br />
• Los Angeles, CA experienced the largest<br />
<strong>in</strong>crease, with 3,046 more <strong>in</strong>dividuals with<br />
chronic patterns <strong>of</strong> homelessness <strong>in</strong> 2017 than<br />
<strong>in</strong> 2016 -- 33 percent <strong>of</strong> the total <strong>in</strong>crease <strong>in</strong> the<br />
major cities CoC category. Of the 48 CoCs <strong>in</strong> the<br />
major cities category, 29 experienced <strong>in</strong>creases<br />
and 19 experienced decl<strong>in</strong>es, signify<strong>in</strong>g that<br />
these <strong>in</strong>creases were not accounted for by only<br />
a few CoCs. Between 2007 and 2017, the numer<br />
<strong>of</strong> people with chronic patterns <strong>of</strong> homelessness<br />
fell nationally by 27 percent. Decl<strong>in</strong>es occurred<br />
across CoC types, with a 14 percent decl<strong>in</strong>e<br />
<strong>in</strong> major cities, 39 percent decrease <strong>in</strong> smaller<br />
cities, counties and regional CoCs, and a 38<br />
percent decl<strong>in</strong>e <strong>in</strong> BoS or statewide CoCs.<br />
• While the number <strong>of</strong> unsheltered <strong>in</strong>dividuals<br />
with chronic patterns <strong>of</strong> homelessness <strong>in</strong><br />
major cities <strong>in</strong> 2017 was lower than it was <strong>in</strong><br />
2007, it has risen steadily s<strong>in</strong>ce 2014. Much <strong>of</strong><br />
the variability is related to fluctuations <strong>in</strong> the<br />
number <strong>of</strong> unsheltered chronically homelessness<br />
<strong>in</strong>dividuals <strong>in</strong> Los Angeles. Remov<strong>in</strong>g Los<br />
Angeles from analysis shows unsheltered<br />
chronic homelessness <strong>in</strong> major cities decl<strong>in</strong><strong>in</strong>g<br />
each year between 2011 and 2016, but<br />
<strong>in</strong>creas<strong>in</strong>g by 34 percent <strong>in</strong> the last year.<br />
69
6Estimates 1National Estimates by CoC<br />
<strong>Homelessness</strong> Chronically Homeless <strong>in</strong> the United Individuals States<br />
Data source: PIT 2007-2017, Excludes Puerto Rico and U.S. Territories<br />
EXHIBIT 6.8: CoCs with the Highest and Lowest Rates <strong>of</strong> Unsheltered Chronically<br />
Homeless Individuals<br />
By CoC Category, 2017<br />
CoC<br />
Highest Rates<br />
Los Angeles City &<br />
County, CA<br />
Fresno/Madera<br />
County, CA<br />
San Jose/Santa Clara<br />
City & County, CA<br />
Major City CoCs<br />
Total<br />
Chronically<br />
Homeless<br />
Individuals<br />
Smaller City, County,<br />
and Regional CoCs a<br />
Total<br />
%<br />
Unsheltered CoC Chronically<br />
Homeless<br />
Individuals<br />
16,016 95.4% Hendry, Hardee,<br />
Highlands Counties,<br />
FL<br />
688 93.5% Ocala/Marion<br />
County, FL<br />
Balance <strong>of</strong> State<br />
and Statewide CoCs<br />
Total<br />
%<br />
Unsheltered CoC Chronically<br />
Homeless<br />
Individuals<br />
236 100.0% Hawaii Balance<br />
<strong>of</strong> State<br />
137 100.0% Arizona Balance<br />
<strong>of</strong> State<br />
2,018 87.1% Amarillo, TX 112 100.0% Georgia Balance<br />
<strong>of</strong> State<br />
%<br />
Unsheltered<br />
551 95.1%<br />
358 83.5%<br />
210 79.0%<br />
Oakland/Alameda<br />
County, CA<br />
1,620 86.8% Merced City &<br />
County, CA<br />
120 99.2% Texas Balance <strong>of</strong><br />
State<br />
764 78.1%<br />
San Antonio/Bexar<br />
County, TX<br />
646 85.3% Lake County, CA 134 98.5% Wash<strong>in</strong>gton<br />
Balance <strong>of</strong> State<br />
834 75.9%<br />
Lowest Rates<br />
Boston, MA 526 7.2% Cambridge, MA 181 14.4% Ma<strong>in</strong>e Balance<br />
<strong>of</strong> State<br />
Omaha/Council<br />
Bluffs, NE<br />
M<strong>in</strong>neapolis/<br />
Hennep<strong>in</strong> County,<br />
MN<br />
Dallas City &<br />
County/Irv<strong>in</strong>g, TX<br />
276 13.8% Grand Rapids/<br />
Wyom<strong>in</strong>g/Kent<br />
County, MI<br />
318 18.6% Pittsburgh/<br />
McKeesport/Penn<br />
Hills/Allegheny<br />
County, PA<br />
511 20.7% Yonkers/<br />
Mount Vernon/<br />
New Rochelle/<br />
Westchester, NY<br />
108 14.8% Indiana Balance<br />
<strong>of</strong> State<br />
117 16.2% Rhode Island<br />
Statewide<br />
109 16.5% Wiscons<strong>in</strong><br />
Balance <strong>of</strong> State<br />
Indianapolis, IN 181 23.2% Boise/Ada County, ID 302 18.9% South Dakota<br />
Statewide<br />
189 0.0%<br />
305 3.9%<br />
240 10.4%<br />
169 16.0%<br />
101 19.8%<br />
a<br />
Excludes CoCs with less than 100 total chronically homeless <strong>in</strong>dividuals.<br />
Los Angeles, CA experienced the<br />
largest <strong>in</strong>crease, with 3,046 more<br />
<strong>in</strong>dividuals with chronic patterns <strong>of</strong><br />
homelessness <strong>in</strong> 2017 than <strong>in</strong> 2016<br />
70
5000<br />
<strong>The</strong> 2017 Annual Homeless Assessment Report to Congress: Part 1<br />
EXHIBIT 6.9: Individuals with Chronic Patterns <strong>of</strong> <strong>Homelessness</strong><br />
By CoC Category and Sheltered Status, 2007–2017<br />
40000<br />
39,160<br />
35,517<br />
Major Cities,<br />
Sheltered<br />
35000<br />
30000<br />
25000<br />
20000<br />
15000<br />
10000<br />
5000<br />
0<br />
29,514<br />
28,221<br />
27,271<br />
29703<br />
25,477<br />
25,629 25,769<br />
20,034<br />
23,843<br />
17,673<br />
17,383<br />
19,996<br />
19,162<br />
18,848<br />
17,531<br />
16,279 13,237 12,949 13,536<br />
11,720 11,505<br />
7,006<br />
7,654<br />
5,803<br />
6,041 6,083<br />
9,611<br />
4,718<br />
5,979 5,712 5,056<br />
4,204<br />
3,702<br />
3,313<br />
2007 2008 2009 2010 2011 2012 2013 2014 2015 2016 2017<br />
Major Cities,<br />
Unsheltered<br />
Smaller Cities, Counties,<br />
and Regional CoCs,<br />
Sheltered<br />
Smaller Cities, Counties,<br />
and Regional CoCs,<br />
Unsheltered<br />
Balance <strong>of</strong> State<br />
and Statewide CoCs,<br />
Sheltered<br />
Balance <strong>of</strong> State<br />
and Statewide CoCs,<br />
Unsheltered<br />
EXHIBIT 6.10: Change <strong>in</strong> Numbers <strong>of</strong> Chronically Homeless Individuals<br />
By Sheltered Status and CoC Category, 2016–2017<br />
40000<br />
Total Change Sheltered Change Unsheltered Change<br />
# % # % # %<br />
Major Cities 9,234 23.2% 1,646 13.8% 7,588 27.2%<br />
35000 Smaller City, County, and Regional<br />
CoCs<br />
1,000 3.6% 126 1.3% 874 4.9%<br />
Balance <strong>of</strong> State and Statewide CoCs -513 -6.0% 303 10.1% -816 -14.7%<br />
30000<br />
25000<br />
20000<br />
15000<br />
10000<br />
71<br />
Balance <strong>of</strong> State and Statewide CoCs, Unsh
7Inventory 1National Estimates <strong>of</strong> Beds<br />
<strong>in</strong> the United States<br />
<strong>Homelessness</strong> <strong>in</strong> the United States<br />
Data source: HIC 2007–2017<br />
EXHIBIT 7.1: Inventory <strong>of</strong> Beds for Homeless<br />
and Formerly Homeless People<br />
2007–2017<br />
353,800<br />
340,906<br />
318,673<br />
300,282<br />
284,298<br />
267,106 274,786 277,537<br />
264,440264,629<br />
236,798<br />
238,708 249,497<br />
219,381 225,840 229,206<br />
211,451 211,222<br />
214,425 221,610 197,192<br />
211,205 205,062207,589 185,332<br />
188,636 195,724 200,623 201,879<br />
173,224<br />
159,784<br />
144,749<br />
120,249<br />
2007 2008 2009 2010 2011 2012 2013 2014 2015 2016 2017<br />
Emergency Shelter<br />
Transitional Hous<strong>in</strong>g<br />
Permanent Supportive Hous<strong>in</strong>g<br />
Note: <strong>The</strong> number <strong>of</strong> Permanent Supportive Hous<strong>in</strong>g beds <strong>in</strong> 2015 is lower<br />
than orig<strong>in</strong>ally reported <strong>in</strong> the 2015 AHAR. <strong>The</strong> PSH <strong>in</strong>ventory was reduced<br />
by 539 beds <strong>in</strong> the Riverside City and County CoC.<br />
400000<br />
This section describes the nation’s capacity to<br />
350000 house homeless and formerly homeless people<br />
us<strong>in</strong>g hous<strong>in</strong>g <strong>in</strong>ventory data submitted by<br />
300000 communities each year. <strong>The</strong>se data provide<br />
estimates <strong>of</strong> the number <strong>of</strong> beds for two types<br />
250000<br />
<strong>of</strong> projects available on the night <strong>of</strong> the Po<strong>in</strong>t-<strong>in</strong>-<br />
Time count:<br />
200000<br />
1. Shelter projects, serv<strong>in</strong>g people currently<br />
150000 experienc<strong>in</strong>g homelessness: Emergency<br />
Shelters, Transitional Hous<strong>in</strong>g projects, and<br />
100000<br />
Safe Havens<br />
2. Permanent Hous<strong>in</strong>g projects, serv<strong>in</strong>g<br />
formerly homeless people: Rapid<br />
Rehous<strong>in</strong>g, Permanent Supportive Hous<strong>in</strong>g,<br />
and Other Permanent Hous<strong>in</strong>g<br />
EXHIBIT 7.2: Distribution <strong>of</strong> Bed Inventory<br />
By Type, 2017<br />
Rapid<br />
Rehous<strong>in</strong>g<br />
Transitional<br />
Hous<strong>in</strong>g<br />
44.3%<br />
Beds for People<br />
Experienc<strong>in</strong>g<br />
<strong>Homelessness</strong><br />
Other<br />
Permanent<br />
Hous<strong>in</strong>g<br />
10.4%<br />
13.4%<br />
5.8%<br />
30.9%<br />
Emergency<br />
Shelter<br />
Permanent<br />
Supportive<br />
Hous<strong>in</strong>g<br />
39.4%<br />
55.6%<br />
Permanent<br />
Hous<strong>in</strong>g Beds<br />
Note: <strong>The</strong> small share <strong>of</strong> Safe Haven beds (0.1%) not <strong>in</strong>cluded <strong>in</strong> this exhibit.<br />
On a S<strong>in</strong>gle Night <strong>in</strong> January 2017<br />
• 899,059 beds available on a year-round basis<br />
were available <strong>in</strong> emergency shelters (ES), safe<br />
havens (SH), transitional hous<strong>in</strong>g (TH), rapid<br />
rehous<strong>in</strong>g (RRH), permanent supportive hous<strong>in</strong>g<br />
(PSH), or other permanent hous<strong>in</strong>g (OPH).<br />
• For the second consecutive year, a larger share<br />
<strong>of</strong> beds was dedicated to hous<strong>in</strong>g people who<br />
were formerly experienc<strong>in</strong>g homelessness (56%)<br />
rather than to provid<strong>in</strong>g temporary places to<br />
stay <strong>in</strong> <strong>in</strong> emergency shelters, safe havens, or<br />
transitional hous<strong>in</strong>g programs (44%).<br />
• Of the 399,439 beds dedicated to shelter<strong>in</strong>g<br />
people currently experienc<strong>in</strong>g homelessness, 70<br />
percent were ES beds, and 30 percent were TH<br />
beds. Less than one percent <strong>of</strong> these beds were<br />
provided through SH projects (0.4%).<br />
• Of the 499,620 beds <strong>in</strong> hous<strong>in</strong>g for formerly<br />
homeless people, 71 percent were <strong>in</strong> PSH.<br />
Smaller shares were <strong>in</strong> RRH (19%) and OPH<br />
(10%).<br />
72
<strong>The</strong> 2017 Annual Homeless Assessment Report to Congress: Part 1<br />
Beds by Household Type, 2017<br />
• Communities were asked to identify the<br />
number <strong>of</strong> beds targeted to households with<br />
adults and children (i.e., families), households<br />
without children (i.e., adult-only households),<br />
and households with only children.<br />
• ES beds targeted families and adult-only<br />
households <strong>in</strong> approximately equal proportions,<br />
51 and 48 percent.<br />
• TH beds were also evenly split, with 50 percent<br />
dedicated to families and 49 percent to adultonly<br />
households.<br />
• RRH was <strong>in</strong>itially designed to primarily serve<br />
families. In recent years, RRH has been also<br />
targeted to <strong>in</strong>dividuals, veterans, and youth. In<br />
2017, nearly three-quarters <strong>of</strong> RRH beds (73%)<br />
were targeted to people <strong>in</strong> families.<br />
• Almost two-thirds (64%) <strong>of</strong> PSH beds were<br />
targeted to adult-only households, while about<br />
two-thirds (65%) <strong>of</strong> OPH beds were targeted to<br />
families.<br />
• Beds target<strong>in</strong>g child-only households were<br />
rarer—only 4,042 beds <strong>in</strong> total—but were most<br />
prevalent <strong>in</strong> ES projects.<br />
EXHIBIT 7.3: Project Types for Homeless and Formerly Homeless People<br />
SHELTER FOR HOMELESS PEOPLE<br />
Emergency Shelter (ES): is a facility with the primary<br />
purpose <strong>of</strong> provid<strong>in</strong>g temporary shelter for homeless<br />
people<br />
Transitional Hous<strong>in</strong>g (TH): typically provides<br />
homeless people with up to 24 months <strong>of</strong> shelter and<br />
supportive services<br />
Safe Haven (SH): provides temporary shelter and<br />
services to hard-to-serve <strong>in</strong>dividuals<br />
PERMANENT HO<strong>US</strong>ING FOR FORMERLY<br />
HOMELESS PEOPLE<br />
Rapid Rehous<strong>in</strong>g (RRH): is a hous<strong>in</strong>g model designed<br />
to provide temporary hous<strong>in</strong>g assistance to people<br />
experienc<strong>in</strong>g homelessness, mov<strong>in</strong>g them quickly out<br />
<strong>of</strong> homelessness and <strong>in</strong>to permanent hous<strong>in</strong>g<br />
Permanent Supportive Hous<strong>in</strong>g (PSH): provides<br />
long-term hous<strong>in</strong>g with supportive services for<br />
formerly homeless people with disabilities, and <strong>of</strong>ten<br />
those with chronic patterns <strong>of</strong> homelessness<br />
Other Permanent Hous<strong>in</strong>g (OPH): provides hous<strong>in</strong>g<br />
with or without services that is specifically for formerly<br />
homeless people but that does not require people to<br />
have a disability<br />
EXHIBIT 7.4: Inventory <strong>of</strong> Beds<br />
By Household Type, 2017<br />
Beds for Adult-Only<br />
Households<br />
Beds for People <strong>in</strong><br />
Families<br />
Beds for Child-Only<br />
Households<br />
Total Year-Round<br />
Beds<br />
# % # % # % # %<br />
Emergency Shelter 133,344 48.0% 141,350 50.9% 2,843 1.0% 277,537 30.9%<br />
Transitional Hous<strong>in</strong>g 59,294 49.3% 59,936 49.8% 1,019 0.8% 120,249 13.4%<br />
Safe Haven 1,653 100.0% 0 0.0% 1,653 0.2%<br />
Rapid Rehous<strong>in</strong>g 24,893 26.6% 68,789 73.4% 36 0.0% 93,718 10.4%<br />
Permanent Supportive Hous<strong>in</strong>g 227,523 64.3% 126,186 35.7% 91 0.0% 353,800 39.4%<br />
Other Permanent Hous<strong>in</strong>g 17,969 34.5% 34,080 65.4% 53 0.1% 52,102 5.8%<br />
Total Beds 464,676 51.7% 430,341 47.9% 4,042 0.4% 899,059 100%<br />
73
7Inventory 1National Estimates <strong>of</strong> Beds<br />
<strong>in</strong> the United States<br />
<strong>Homelessness</strong> <strong>in</strong> the United States<br />
Data source: HIC 2007–2017<br />
EXHIBIT 7.5: Inventory <strong>of</strong> Beds Dedicated to Specific Populations<br />
By Household Type, 2007–2017<br />
Bed Type<br />
Total Beds<br />
Beds Dedicated<br />
to People with<br />
Chronic Patterns <strong>of</strong><br />
<strong>Homelessness</strong><br />
Beds Dedicated to<br />
Veterans<br />
Beds Dedicated to<br />
Youth*<br />
# % # % # %<br />
Emergency Shelter 277,537 4,756 1.7% 6,140 2.2%<br />
Transitional Hous<strong>in</strong>g 120,249 15,681 13.0% 10,077 8.4%<br />
Safe Haven 1,653 314 19.0% 8 0.5%<br />
Rapid Rehous<strong>in</strong>g 93,718 18,281 19.5% 2,323 2.5%<br />
Permanent Supportive Hous<strong>in</strong>g 353,800 149,005 42.1% 100,652 28.4% 4,117 1.2%<br />
Other Permanent Hous<strong>in</strong>g 52,102 1,857 3.6% 627 1.2%<br />
Major Cities Total Beds 899,059 149,005 16.6% 141,541 15.7% 23,292 2.6%<br />
* Beds dedicated to youth are beds set aside by programs to serve people under the age <strong>of</strong> 25 unless there are no people under 25 present.<br />
ounties, and Regional CoCs In the case <strong>of</strong> parent<strong>in</strong>g youth, these beds <strong>in</strong>clude beds for their children<br />
f State and Statewide CoCs<br />
EXHIBIT 7.6: Distribution <strong>of</strong> Beds<br />
0 100<br />
By Type and CoC Category*<br />
Major Cities<br />
Smaller Cities,<br />
Counties, and Regional<br />
Cocs<br />
Balance <strong>of</strong> State and<br />
Statewide Cocs<br />
0% 100%<br />
26.0<br />
Emergency Shelter<br />
Transitional Hous<strong>in</strong>g<br />
Rapid Rehous<strong>in</strong>g<br />
34.1 11.2 8.3 41.0 5.3<br />
14.9<br />
12.0<br />
40.2<br />
33.0 16.8 13.4 31.6<br />
Permanent Supportive Hous<strong>in</strong>g<br />
Other Permanent Hous<strong>in</strong>g<br />
*Excludes SH, which accounts for 0.1 or 0.2% <strong>of</strong> beds <strong>in</strong> all three CoC types<br />
Beds Targeted to Specific Populations,<br />
2017<br />
• PSH programs may dedicate all or a subset <strong>of</strong><br />
their <strong>in</strong>ventory to people with chronic patterns<br />
<strong>of</strong> homelessness. In 2017, there were 149,005<br />
PSH beds dedicated to people experienc<strong>in</strong>g<br />
chronic homelessness, represent<strong>in</strong>g 42 percent<br />
<strong>of</strong> all PSH beds.<br />
• Sixteen percent <strong>of</strong> all beds (141,541 beds) were<br />
dedicated to households with veterans. More<br />
than seven <strong>in</strong> ten beds dedicated to veterans<br />
were PSH beds. PSH beds dedicated to veterans<br />
accounted for 28 percent <strong>of</strong> all PSH beds.<br />
6.6<br />
5.2<br />
• <strong>The</strong>re were 23,292 beds targeted to<br />
unaccompanied youth and families with youth<br />
parents (where all members are under the age<br />
<strong>of</strong> 25). Of these beds, 43 percent (or 10,077)<br />
were <strong>in</strong> TH, represent<strong>in</strong>g about eight percent <strong>of</strong><br />
all TH beds.<br />
Beds by CoC Category, 2017<br />
• In major cities, 55 percent <strong>of</strong> all beds were <strong>in</strong><br />
permanent hous<strong>in</strong>g (RRH, PSH, OPH), and 45<br />
percent <strong>in</strong> shelters (ES, TH, SH). In smaller<br />
cities, counties, and regional CoCs, 59 percent<br />
<strong>of</strong> beds were <strong>in</strong> permanent hous<strong>in</strong>g, and<br />
permanent hous<strong>in</strong>g beds represented half <strong>of</strong> all<br />
beds <strong>in</strong> BoS and statewide CoCs.<br />
• In all three categories <strong>of</strong> CoCs, PSH beds<br />
represented the majority <strong>of</strong> the <strong>in</strong>ventory <strong>of</strong><br />
permanent hous<strong>in</strong>g projects, but they were<br />
most prevalent <strong>in</strong> major city CoCs (75%).<br />
• Consider<strong>in</strong>g the <strong>in</strong>ventory for both currently<br />
and formerly homeless people, <strong>in</strong> major cities,<br />
PSH beds accounted for the largest share <strong>of</strong> the<br />
hous<strong>in</strong>g <strong>in</strong>ventory (41%), followed by ES beds<br />
(34%).<br />
• Similarly, PSH represented 40 percent <strong>of</strong> the<br />
<strong>in</strong>ventory <strong>in</strong> smaller cities, counties, and<br />
regional CoCs, but ES beds comprised a<br />
74
<strong>The</strong> 2017 Annual Homeless Assessment Report to Congress: Part 1<br />
smaller share <strong>of</strong> the bed <strong>in</strong>ventory (26%) than<br />
the other CoC types.<br />
• In BoS and statewide CoCs, PSH does not<br />
represent the largest share <strong>of</strong> beds. In these<br />
CoCs, ES represents 33 percent <strong>of</strong> their<br />
<strong>in</strong>ventory, followed by PSH (32%). BoS and<br />
statewide CoCs have the largest share <strong>of</strong> TH<br />
beds (17%) and RRH beds (13%).<br />
S<strong>in</strong>ce 2016<br />
• Between 2016 and 2017, the total <strong>in</strong>ventory<br />
<strong>of</strong> year-round beds for people currently or<br />
formerly experienc<strong>in</strong>g homelessness <strong>in</strong>creased<br />
by 31,957 beds, a five percent <strong>in</strong>crease driven<br />
primarily by growth <strong>in</strong> the permanent hous<strong>in</strong>g<br />
<strong>in</strong>ventory.<br />
• <strong>The</strong> number <strong>of</strong> beds <strong>in</strong> shelter projects (ES,<br />
TH, and SH) decl<strong>in</strong>ed by 11,846 beds, or three<br />
percent. <strong>The</strong> number <strong>of</strong> ES beds <strong>in</strong>creased<br />
by 12,908 beds (or 5%), but the TH <strong>in</strong>ventory<br />
decl<strong>in</strong>ed by almost twice that marg<strong>in</strong>, with<br />
24,500 fewer beds (a 17% decrease). <strong>The</strong><br />
number <strong>of</strong> SH beds also decreased, by 254<br />
beds.<br />
• <strong>The</strong> <strong>in</strong>ventory <strong>in</strong> hous<strong>in</strong>g for people formerly<br />
experienc<strong>in</strong>g homelessness grew by 43,803<br />
beds, or 10 percent. Each project type<br />
experienced <strong>in</strong>creases s<strong>in</strong>ce 2016: 16,577 more<br />
beds <strong>in</strong> RRH (a 22% <strong>in</strong>crease), 12,894 more<br />
beds <strong>in</strong> PSH (4%), and 14,332 more beds <strong>in</strong> OPH<br />
(38%).<br />
• <strong>The</strong> number <strong>of</strong> PSH beds dedicated to serv<strong>in</strong>g<br />
people experienc<strong>in</strong>g chronic homelessness<br />
<strong>in</strong>creased by 37,615 beds (34%).<br />
• <strong>The</strong> number <strong>of</strong> beds dedicated to veteran<br />
households <strong>in</strong>creased by 12,251 (10%), and the<br />
number <strong>of</strong> beds dedicated to unaccompanied<br />
youth and families with youth parents<br />
<strong>in</strong>creased by 2,089 (10%).<br />
EXHIBIT 7.7: Change <strong>in</strong> the National Inventory <strong>of</strong> Beds<br />
By Project Type, 2007-2017<br />
Change 2016-2017 Change 2007-2017<br />
# % # %<br />
Total Beds 31,957 3.7% 287,767 47.1%<br />
Emergency Shelter 12,908 4.9% 66,086 31.3%<br />
Transitional Hous<strong>in</strong>g -24,500 -16.9% -90,956 -43.1%<br />
Safe Haven -254 -13.3%<br />
Rapid Rehous<strong>in</strong>g 16,577 21.5%<br />
Permanent Supportive<br />
Hous<strong>in</strong>g<br />
Other Permanent<br />
Hous<strong>in</strong>g<br />
12,894 3.8% 165,164 87.6%<br />
14,332 37.9%<br />
75
7Inventory 1National Estimates <strong>of</strong> Beds<br />
<strong>in</strong> the United States<br />
<strong>Homelessness</strong> <strong>in</strong> the United States<br />
Data source: HIC 2007–2017<br />
EXHIBIT 7.8: Inventory <strong>of</strong> PSH Beds for Chronically Homeless People<br />
2007-2017<br />
149,005<br />
111,390<br />
95,066<br />
94,282<br />
33.8%<br />
17.2% 37,615<br />
81,666<br />
74,693<br />
0.8% 16,324<br />
67,964<br />
15.5% 784<br />
9.3% 12,616<br />
50,602<br />
55,256<br />
9.9%<br />
42,298<br />
23.0%<br />
6,973<br />
37,807<br />
6,729<br />
9.2% 12,708<br />
19.6%<br />
11.9%<br />
4,654<br />
8,304<br />
4,491<br />
2007–2017<br />
294.1%<br />
111,198<br />
2007 2008 2009 2010 2011 2012<br />
2013 2014<br />
2015 2016 2017<br />
S<strong>in</strong>ce 2007<br />
• <strong>The</strong>re were 287,767 more beds <strong>in</strong> 2017 for<br />
people currently or formerly experienc<strong>in</strong>g<br />
homelessness than there were <strong>in</strong> 2007, an<br />
<strong>in</strong>crease <strong>of</strong> 47 percent.<br />
• In 2007, there were about as many ES beds<br />
(211,451) as there were TH beds (211,205).<br />
Over time, the ES <strong>in</strong>ventory <strong>in</strong>creased, more<br />
resources were devoted to permanent hous<strong>in</strong>g,<br />
and the TH <strong>in</strong>ventory decl<strong>in</strong>ed. Between 2007<br />
and 2017, the number <strong>of</strong> TH beds dropped by<br />
43 percent.<br />
• <strong>The</strong> number <strong>of</strong> PSH beds has risen each year<br />
s<strong>in</strong>ce 2007, as communities have <strong>in</strong>creas<strong>in</strong>gly<br />
devoted resources to PSH. Over the ten-year<br />
period from 2007 to 2017, the PSH <strong>in</strong>ventory<br />
grew by 165,164 beds <strong>in</strong> total, an <strong>in</strong>crease <strong>of</strong> 88<br />
percent.<br />
• Much <strong>of</strong> the <strong>in</strong>crease <strong>in</strong> PSH beds is for<br />
beds target<strong>in</strong>g people experienc<strong>in</strong>g chronic<br />
homelessness. <strong>The</strong> number <strong>of</strong> those beds<br />
<strong>in</strong>creased dramatically between 2007 and 2017;<br />
111,198 PSH beds for chronically homeless<br />
people were added <strong>in</strong> this 10-year period, a 294<br />
percent <strong>in</strong>crease.<br />
76
<strong>The</strong> 2017 Annual Homeless Assessment Report to Congress: Part 1<br />
77
Appendix<br />
ALABAMA<br />
-7.7%<br />
change from 2016<br />
-37.3%<br />
change from 2010<br />
8 <strong>in</strong> every 10,000<br />
people were experienc<strong>in</strong>g<br />
homelessness<br />
30.0%<br />
70.0%<br />
Estimates <strong>of</strong> <strong>Homelessness</strong><br />
2,985 <strong>in</strong>dividuals<br />
people <strong>in</strong> families<br />
808 with children<br />
unaccompanied<br />
294 homeless youth<br />
n Unsheltered (1,137)<br />
n Sheltered (2,656)<br />
269 veterans<br />
Total Homeless, 2017<br />
3,793<br />
chronically homeless<br />
344 <strong>in</strong>dividuals<br />
ALASKA<br />
-4.9%<br />
change from 2016<br />
-1.0%<br />
change from 2010<br />
25 <strong>in</strong> every 10,000<br />
people were experienc<strong>in</strong>g<br />
homelessness<br />
15.9%<br />
84.1%<br />
Estimates <strong>of</strong> <strong>Homelessness</strong><br />
1,354 <strong>in</strong>dividuals<br />
people <strong>in</strong> families<br />
491 with children<br />
unaccompanied<br />
162 homeless youth<br />
n Unsheltered (294)<br />
n Sheltered (1,551)<br />
124 veterans<br />
ARIZONA<br />
Total Homeless, 2017<br />
1,845<br />
-7.8%<br />
change from 2017<br />
-34.7%<br />
change from 2010<br />
13 <strong>in</strong> every 10,000<br />
people were experienc<strong>in</strong>g<br />
homelessness<br />
35.4%<br />
64.6%<br />
chronically homeless<br />
216 <strong>in</strong>dividuals<br />
Estimates <strong>of</strong> <strong>Homelessness</strong><br />
6,488 <strong>in</strong>dividuals<br />
people <strong>in</strong> families<br />
2,459 with children<br />
unaccompanied<br />
578 homeless youth<br />
n Unsheltered (3,166)<br />
n Sheltered (5,781)<br />
970 veterans<br />
78<br />
Total Homeless, 2017<br />
8,947<br />
chronically homeless<br />
1,463 <strong>in</strong>dividuals
ARKANSAS<br />
+0.2%<br />
change from 2016<br />
-10.7%<br />
change from 2010<br />
8 <strong>in</strong> every 10,000<br />
people were experienc<strong>in</strong>g<br />
homelessness<br />
48.4%<br />
51.6%<br />
Appendix<br />
Estimates <strong>of</strong> <strong>Homelessness</strong><br />
2,068 <strong>in</strong>dividuals<br />
people <strong>in</strong> families<br />
399 with children<br />
unaccompanied<br />
208 homeless youth<br />
n Unsheltered (1,194)<br />
n Sheltered (1,273)<br />
239 veterans<br />
Total Homeless, 2017<br />
2,467<br />
CALIFORNIA<br />
+13.7%<br />
change from 2016<br />
+8.7%<br />
change from 2010<br />
34 <strong>in</strong> every 10,000<br />
people were experienc<strong>in</strong>g<br />
homelessness<br />
68.2%<br />
31.8%<br />
chronically homeless<br />
450 <strong>in</strong>dividuals<br />
Estimates <strong>of</strong> <strong>Homelessness</strong><br />
112,756 <strong>in</strong>dividuals<br />
people <strong>in</strong> families<br />
21,522 with children<br />
unaccompanied<br />
15,458 homeless youth<br />
n Unsheltered (91,642)<br />
n Sheltered (42,636)<br />
11,472 veterans<br />
Total Homeless, 2017<br />
134,278<br />
chronically homeless<br />
35,798 <strong>in</strong>dividuals<br />
COLORADO<br />
3.7%<br />
change from 2016<br />
-29.3%<br />
change from 2010<br />
20 <strong>in</strong> every 10,000<br />
people were experienc<strong>in</strong>g<br />
homelessness<br />
35.3%<br />
64.7%<br />
Estimates <strong>of</strong> <strong>Homelessness</strong><br />
7,571 <strong>in</strong>dividuals<br />
people <strong>in</strong> families<br />
3,369 with children<br />
unaccompanied<br />
763 homeless youth<br />
n Unsheltered (3,859)<br />
n Sheltered (7,081)<br />
1,078 veterans<br />
Total Homeless, 2017<br />
10,940<br />
chronically homeless<br />
2,126 <strong>in</strong>dividuals<br />
79
Appendix<br />
CONNECTICUT<br />
-13.2%<br />
change from 2016<br />
-21.5%<br />
change from 2010<br />
10 <strong>in</strong> every 10,000<br />
people were experienc<strong>in</strong>g<br />
homelessness<br />
12.3%<br />
87.7%<br />
Estimates <strong>of</strong> <strong>Homelessness</strong><br />
2,208 <strong>in</strong>dividuals<br />
people <strong>in</strong> families<br />
1,180 with children<br />
unaccompanied<br />
170 homeless youth<br />
Total Homeless, 2017<br />
3,388<br />
DELAWARE<br />
-7.1%<br />
change from 2016<br />
+1.2%<br />
change from 2010<br />
n Unsheltered (416)<br />
n Sheltered (2,972)<br />
10 <strong>in</strong> every 10,000<br />
people were experienc<strong>in</strong>g<br />
homelessness<br />
5.8%<br />
94.2%<br />
191 veterans<br />
chronically homeless<br />
387 <strong>in</strong>dividuals<br />
Estimates <strong>of</strong> <strong>Homelessness</strong><br />
615 <strong>in</strong>dividuals<br />
people <strong>in</strong> families<br />
379 with children<br />
unaccompanied<br />
45 homeless youth<br />
Total Homeless, 2017<br />
994<br />
n Unsheltered (58)<br />
n Sheltered (936)<br />
91 veterans<br />
chronically homeless<br />
123 <strong>in</strong>dividuals<br />
DISTRICT OF COLUMBIA<br />
110 <strong>in</strong> every 10,000<br />
people were experienc<strong>in</strong>g<br />
homelessness<br />
-10.5%<br />
change from 2016<br />
+14.3%<br />
change from 2010<br />
12.0%<br />
88.0%<br />
Estimates <strong>of</strong> <strong>Homelessness</strong><br />
3,583 <strong>in</strong>dividuals<br />
people <strong>in</strong> families<br />
3,890 with children<br />
unaccompanied<br />
228 homeless youth<br />
80<br />
Total Homeless, 2017<br />
7,473<br />
n Unsheltered (897)<br />
n Sheltered (6,576)<br />
285 veterans<br />
chronically homeless<br />
1,470 <strong>in</strong>dividuals
FLORIDA<br />
-4.1%<br />
change from 2016<br />
-44.1%<br />
change from 2010<br />
16 <strong>in</strong> every 10,000<br />
people were experienc<strong>in</strong>g<br />
homelessness<br />
46.8%<br />
53.2%<br />
Appendix<br />
Estimates <strong>of</strong> <strong>Homelessness</strong><br />
22,768 <strong>in</strong>dividuals<br />
people <strong>in</strong> families<br />
9,422 with children<br />
unaccompanied<br />
2,019 homeless youth<br />
n Unsheltered (15,079)<br />
n Sheltered (17,111)<br />
2,817 veterans<br />
GEORGIA<br />
Total Homeless, 2017<br />
32,190<br />
-21.2%<br />
change from 2016<br />
-48.7%<br />
change from 2010<br />
10 <strong>in</strong> every 10,000<br />
people were experienc<strong>in</strong>g<br />
homelessness<br />
34.6%<br />
65.4%<br />
chronically homeless<br />
4,951 <strong>in</strong>dividuals<br />
Estimates <strong>of</strong> <strong>Homelessness</strong><br />
7,422 <strong>in</strong>dividuals<br />
people <strong>in</strong> families<br />
2,752 with children<br />
unaccompanied<br />
526 homeless youth<br />
n Unsheltered (3,523)<br />
n Sheltered (6,651)<br />
712 veterans<br />
Total Homeless, 2017<br />
10,174<br />
chronically homeless<br />
963 <strong>in</strong>dividuals<br />
HAWAII<br />
-8.8%<br />
change from 2016<br />
+23.8%<br />
change from 2010<br />
51 <strong>in</strong> every 10,000<br />
people were experienc<strong>in</strong>g<br />
homelessness<br />
52.6%<br />
47.4%<br />
Estimates <strong>of</strong> <strong>Homelessness</strong><br />
4,535 <strong>in</strong>dividuals<br />
people <strong>in</strong> families<br />
2,685 with children<br />
unaccompanied<br />
319 homeless youth<br />
n Unsheltered (3,800)<br />
n Sheltered (3,420)<br />
615 veterans<br />
Total Homeless, 2017<br />
7,220<br />
chronically homeless<br />
1,588 <strong>in</strong>dividuals<br />
81
Appendix<br />
IDAHO<br />
-9.3%<br />
change from 2016<br />
-13.2%<br />
change from 2010<br />
12 <strong>in</strong> every 10,000<br />
people were experienc<strong>in</strong>g<br />
homelessness<br />
31.4%<br />
68.6%<br />
Estimates <strong>of</strong> <strong>Homelessness</strong><br />
1,309 <strong>in</strong>dividuals<br />
people <strong>in</strong> families<br />
728 with children<br />
unaccompanied<br />
113 homeless youth<br />
n Unsheltered (639)<br />
n Sheltered (1,398)<br />
228 veterans<br />
ILLINOIS<br />
Total Homeless, 2017<br />
2,037<br />
-6.8%<br />
change from 2016<br />
-25.0%<br />
change from 2010<br />
8 <strong>in</strong> every 10,000<br />
people were experienc<strong>in</strong>g<br />
homelessness<br />
20.9%<br />
79.1%<br />
chronically homeless<br />
391 <strong>in</strong>dividuals<br />
Estimates <strong>of</strong> <strong>Homelessness</strong><br />
6,894 <strong>in</strong>dividuals<br />
people <strong>in</strong> families<br />
3,904 with children<br />
unaccompanied<br />
730 homeless youth<br />
n Unsheltered (2,257)<br />
n Sheltered (8,541)<br />
864 veterans<br />
Total Homeless, 2017<br />
10,798<br />
chronically homeless<br />
1,355 <strong>in</strong>dividuals<br />
INDIANA<br />
-6.2%<br />
change from 2016<br />
-15.7%<br />
change from 2010<br />
8 <strong>in</strong> every 10,000<br />
people were experienc<strong>in</strong>g<br />
homelessness<br />
10.5%<br />
89.5%<br />
Estimates <strong>of</strong> <strong>Homelessness</strong><br />
3,623 <strong>in</strong>dividuals<br />
people <strong>in</strong> families<br />
1,815 with children<br />
unaccompanied<br />
294 homeless youth<br />
82<br />
Total Homeless, 2017<br />
5,438<br />
n Unsheltered (569)<br />
n Sheltered (4,869)<br />
615 veterans<br />
chronically homeless<br />
486 <strong>in</strong>dividuals
IOWA<br />
-10.1%<br />
change from 2016<br />
-8.6%<br />
change from 2010<br />
9 <strong>in</strong> every 10,000<br />
people were experienc<strong>in</strong>g<br />
homelessness<br />
3.8%<br />
96.2%<br />
Appendix<br />
Estimates <strong>of</strong> <strong>Homelessness</strong><br />
1,500 <strong>in</strong>dividuals<br />
people <strong>in</strong> families<br />
1,256 with children<br />
unaccompanied<br />
140 homeless youth<br />
KANSAS<br />
Total Homeless, 2017<br />
2,756<br />
+1.4%<br />
change from 2016<br />
+13.0%<br />
change from 2010<br />
n Unsheltered (104)<br />
n Sheltered (2,652)<br />
8 <strong>in</strong> every 10,000<br />
people were experienc<strong>in</strong>g<br />
homelessness<br />
15.1%<br />
84.9%<br />
171 veterans<br />
chronically homeless<br />
170 <strong>in</strong>dividuals<br />
Estimates <strong>of</strong> <strong>Homelessness</strong><br />
1,423 <strong>in</strong>dividuals<br />
people <strong>in</strong> families<br />
864 with children<br />
unaccompanied<br />
103 homeless youth<br />
Total Homeless, 2017<br />
2,287<br />
n Unsheltered (345)<br />
n Sheltered (1,942)<br />
217 veterans<br />
chronically homeless<br />
252 <strong>in</strong>dividuals<br />
KENTUCKY<br />
-5.0%<br />
change from 2016<br />
-39.2%<br />
change from 2010<br />
9 <strong>in</strong> every 10,000<br />
people were experienc<strong>in</strong>g<br />
homelessness<br />
18.1%<br />
81.9%<br />
Estimates <strong>of</strong> <strong>Homelessness</strong><br />
3,032 <strong>in</strong>dividuals<br />
people <strong>in</strong> families<br />
993 with children<br />
unaccompanied<br />
253 homeless youth<br />
n Unsheltered (727)<br />
n Sheltered (3,298)<br />
489 veterans<br />
Total Homeless, 2017<br />
4,025<br />
chronically homeless<br />
383 <strong>in</strong>dividuals<br />
83
Appendix<br />
LOUISIANA<br />
-17.3%<br />
change from 2016<br />
-73.5%<br />
change from 2010<br />
7 <strong>in</strong> every 10,000<br />
people were experienc<strong>in</strong>g<br />
homelessness<br />
29.5%<br />
70.5%<br />
Estimates <strong>of</strong> <strong>Homelessness</strong><br />
2,559 <strong>in</strong>dividuals<br />
people <strong>in</strong> families<br />
746 with children<br />
unaccompanied<br />
236 homeless youth<br />
n Unsheltered (975)<br />
n Sheltered 2,330)<br />
383 veterans<br />
Total Homeless, 2017<br />
3,305<br />
chronically homeless<br />
609 <strong>in</strong>dividuals<br />
MAINE<br />
+1.7%<br />
change from 2016<br />
-4.2%<br />
change from 2010<br />
17 <strong>in</strong> every 10,000<br />
people were experienc<strong>in</strong>g<br />
homelessness<br />
7.9%<br />
92.1%<br />
Estimates <strong>of</strong> <strong>Homelessness</strong><br />
1,352 <strong>in</strong>dividuals<br />
people <strong>in</strong> families<br />
928 with children<br />
unaccompanied<br />
178 homeless youth<br />
Total Homeless, 2017<br />
2,280<br />
n Unsheltered (180)<br />
n Sheltered (2,100)<br />
131 veterans<br />
chronically homeless<br />
189 <strong>in</strong>dividuals<br />
MARYLAND<br />
-5.7%<br />
change from 2016<br />
-33.2%<br />
change from 2010<br />
12 <strong>in</strong> every 10,000<br />
people were experienc<strong>in</strong>g<br />
homelessness<br />
24.0%<br />
76.0%<br />
Estimates <strong>of</strong> <strong>Homelessness</strong><br />
5,077 <strong>in</strong>dividuals<br />
people <strong>in</strong> families<br />
2,170 with children<br />
unaccompanied<br />
272 homeless youth<br />
n Unsheltered (1,736)<br />
n Sheltered (5,511)<br />
536 veterans<br />
84<br />
Total Homeless, 2017<br />
7,247<br />
chronically homeless<br />
1,436 <strong>in</strong>dividuals
MASSACH<strong>US</strong>ETTS<br />
-10.4%<br />
change from 2016<br />
+5.5%<br />
change from 2010<br />
26 <strong>in</strong> every 10,000<br />
people were experienc<strong>in</strong>g<br />
homelessness<br />
5.6%<br />
94.4%<br />
Appendix<br />
Estimates <strong>of</strong> <strong>Homelessness</strong><br />
6,267 <strong>in</strong>dividuals<br />
people <strong>in</strong> families<br />
11,298 with children<br />
unaccompanied<br />
469 homeless youth<br />
MICHIGAN<br />
Total Homeless, 2017<br />
17,565<br />
-2.8%<br />
change from 2016<br />
-30.7%<br />
change from 2010<br />
n Unsheltered (991)<br />
n Sheltered (16,574)<br />
9 <strong>in</strong> every 10,000<br />
people were experienc<strong>in</strong>g<br />
homelessness<br />
11.3%<br />
88.7%<br />
853 veterans<br />
chronically homeless<br />
1,238 <strong>in</strong>dividuals<br />
Estimates <strong>of</strong> <strong>Homelessness</strong><br />
5,628 <strong>in</strong>dividuals<br />
people <strong>in</strong> families<br />
3,423 with children<br />
unaccompanied<br />
608 homeless youth<br />
Total Homeless, 2017<br />
9,051<br />
MINNESOTA<br />
+4.5%<br />
change from 2016<br />
-2.6%<br />
change from 2010<br />
n Unsheltered (1,023)<br />
n Sheltered (8,028)<br />
14 <strong>in</strong> every 10,000<br />
people were experienc<strong>in</strong>g<br />
homelessness<br />
14.4%<br />
85.6%<br />
773 veterans<br />
chronically homeless<br />
709 <strong>in</strong>dividuals<br />
Estimates <strong>of</strong> <strong>Homelessness</strong><br />
3,899 <strong>in</strong>dividuals<br />
people <strong>in</strong> families<br />
3,769 with children<br />
unaccompanied<br />
889 homeless youth<br />
Total Homeless, 2017<br />
7,668<br />
n Unsheltered (1,108)<br />
n Sheltered (6,560)<br />
281 veterans<br />
chronically homeless<br />
813 <strong>in</strong>dividuals<br />
85
Appendix<br />
MISSISSIPPI<br />
-15.3%<br />
change from 2016<br />
-46.3%<br />
change from 2010<br />
5 <strong>in</strong> every 10,000<br />
people were experienc<strong>in</strong>g<br />
homelessness<br />
48.8%<br />
51.2%<br />
Estimates <strong>of</strong> <strong>Homelessness</strong><br />
1,100 <strong>in</strong>dividuals<br />
people <strong>in</strong> families<br />
372 with children<br />
unaccompanied<br />
59 homeless youth<br />
n Unsheltered (719)<br />
n Sheltered (753)<br />
57 veterans<br />
MISSOURI<br />
Total Homeless, 2017<br />
1,472<br />
-2.5%<br />
change from 2016<br />
-25.7%<br />
change from 2010<br />
10 <strong>in</strong> every 10,000<br />
people were experienc<strong>in</strong>g<br />
homelessness<br />
19.1%<br />
80.9%<br />
chronically homeless<br />
61 <strong>in</strong>dividuals<br />
Estimates <strong>of</strong> <strong>Homelessness</strong><br />
3,768 <strong>in</strong>dividuals<br />
people <strong>in</strong> families<br />
2,269 with children<br />
unaccompanied<br />
548 homeless youth<br />
n Unsheltered (1,152)<br />
n Sheltered (4,885)<br />
538 veterans<br />
MONTANA<br />
Total Homeless, 2017<br />
6,037<br />
+7.8%<br />
change from 2016<br />
-5.3%<br />
change from 2010<br />
15 <strong>in</strong> every 10,000<br />
people were experienc<strong>in</strong>g<br />
homelessness<br />
35.6%<br />
64.4%<br />
chronically homeless<br />
883 <strong>in</strong>dividuals<br />
Estimates <strong>of</strong> <strong>Homelessness</strong><br />
987 <strong>in</strong>dividuals<br />
people <strong>in</strong> families<br />
542 with children<br />
unaccompanied<br />
106 homeless youth<br />
n Unsheltered (544)<br />
n Sheltered (985)<br />
205 veterans<br />
86<br />
Total Homeless, 2017<br />
1,529<br />
chronically homeless<br />
182 <strong>in</strong>dividuals
NEBRASKA<br />
-9.2%<br />
change from 2016<br />
-35.5%<br />
change from 2010<br />
13 <strong>in</strong> every 10,000<br />
people were experienc<strong>in</strong>g<br />
homelessness<br />
4.8%<br />
95.2%<br />
1,698 <strong>in</strong>dividuals<br />
Appendix<br />
Estimates <strong>of</strong> <strong>Homelessness</strong><br />
people <strong>in</strong> families<br />
803 with children<br />
unaccompanied<br />
164 homeless youth<br />
NEVADA<br />
Total Homeless, 2017<br />
2,501<br />
+5.9%<br />
change from 2016<br />
-30.1%<br />
change from 2010<br />
n Unsheltered (120)<br />
n Sheltered (2,381)<br />
27 <strong>in</strong> every 10,000<br />
people were experienc<strong>in</strong>g<br />
homelessness<br />
58.4%<br />
41.6%<br />
174 veterans<br />
chronically homeless<br />
361 <strong>in</strong>dividuals<br />
Estimates <strong>of</strong> <strong>Homelessness</strong><br />
7,281 <strong>in</strong>dividuals<br />
people <strong>in</strong> families<br />
552 with children<br />
unaccompanied<br />
2,166 homeless youth<br />
n Unsheltered (4,578)<br />
n Sheltered (3,255)<br />
832 veterans<br />
Total Homeless, 2017<br />
7,833<br />
NEW HAMPSHIRE<br />
+6.6%<br />
change from 2016<br />
-7.5%<br />
change from 2010<br />
11 <strong>in</strong> every 10,000<br />
people were experienc<strong>in</strong>g<br />
homelessness<br />
12.0%<br />
88.0%<br />
chronically homeless<br />
502 <strong>in</strong>dividuals<br />
Estimates <strong>of</strong> <strong>Homelessness</strong><br />
776 <strong>in</strong>dividuals<br />
people <strong>in</strong> families<br />
680 with children<br />
unaccompanied<br />
76 homeless youth<br />
Total Homeless, 2017<br />
1,456<br />
n Unsheltered (174)<br />
n Sheltered (1,282)<br />
124 veterans<br />
chronically homeless<br />
100 <strong>in</strong>dividuals<br />
87
Appendix<br />
NEW JERSEY<br />
-4.0%<br />
change from 2016<br />
-37.9%<br />
change from 2010<br />
10 <strong>in</strong> every 10,000<br />
people were experienc<strong>in</strong>g<br />
homelessness<br />
16.6%<br />
83.4%<br />
Estimates <strong>of</strong> <strong>Homelessness</strong><br />
5,433 <strong>in</strong>dividuals<br />
people <strong>in</strong> families<br />
3,103 with children<br />
unaccompanied<br />
492 homeless youth<br />
n Unsheltered (1,414)<br />
n Sheltered (7,122)<br />
583 veterans<br />
Total Homeless, 2017<br />
8,536<br />
NEW MEXICO<br />
+9.7%<br />
change from 2016<br />
-28.6%<br />
change from 2010<br />
12 <strong>in</strong> every 10,000<br />
people were experienc<strong>in</strong>g<br />
homelessness<br />
32.1%<br />
67.9%<br />
chronically homeless<br />
955 <strong>in</strong>dividuals<br />
Estimates <strong>of</strong> <strong>Homelessness</strong><br />
1,865 <strong>in</strong>dividuals<br />
people <strong>in</strong> families<br />
617 with children<br />
unaccompanied<br />
181 homeless youth<br />
n Unsheltered (796)<br />
n Sheltered (1,686)<br />
248 veterans<br />
Total Homeless, 2017<br />
2,482<br />
NEW YORK<br />
+3.6%<br />
change from 2016<br />
+36.4%<br />
change from 2010<br />
45 <strong>in</strong> every 10,000<br />
people were experienc<strong>in</strong>g<br />
homelessness<br />
5.1%<br />
94.9%<br />
chronically homeless<br />
712 <strong>in</strong>dividuals<br />
Estimates <strong>of</strong> <strong>Homelessness</strong><br />
37,390 <strong>in</strong>dividuals<br />
people <strong>in</strong> families<br />
52,113 with children<br />
unaccompanied<br />
2,829 homeless youth<br />
88<br />
Total Homeless, 2017<br />
89,503<br />
n Unsheltered (4,555)<br />
n Sheltered (84,948)<br />
1,244 veterans<br />
chronically homeless<br />
5,087 <strong>in</strong>dividuals
NORTH CAROLINA<br />
-6.2%<br />
change from 2016<br />
-26.5%<br />
change from 2010<br />
9 <strong>in</strong> every 10,000<br />
people were experienc<strong>in</strong>g<br />
homelessness<br />
27.3%<br />
72.7%<br />
6,044 <strong>in</strong>dividuals<br />
Appendix<br />
Estimates <strong>of</strong> <strong>Homelessness</strong><br />
people <strong>in</strong> families<br />
2,918 with children<br />
unaccompanied<br />
434 homeless youth<br />
Total Homeless, 2017<br />
8,962<br />
NORTH DAKOTA<br />
+18.0%<br />
change from 2016<br />
+36.3%<br />
change from 2010<br />
n Unsheltered (2,451)<br />
n Sheltered (6,511)<br />
14 <strong>in</strong> every 10,000<br />
people were experienc<strong>in</strong>g<br />
homelessness<br />
30.4%<br />
69.6%<br />
931 veterans<br />
chronically homeless<br />
994 <strong>in</strong>dividuals<br />
Estimates <strong>of</strong> <strong>Homelessness</strong><br />
832 <strong>in</strong>dividuals<br />
people <strong>in</strong> families<br />
257 with children<br />
unaccompanied<br />
80 homeless youth<br />
n Unsheltered (331)<br />
n Sheltered (758)<br />
74 veterans<br />
OHIO<br />
Total Homeless, 2017<br />
1,089<br />
-3.0%<br />
change from 2016<br />
-19.7%<br />
change from 2010<br />
9 <strong>in</strong> every 10,000<br />
people were experienc<strong>in</strong>g<br />
homelessness<br />
13.0%<br />
87.0%<br />
chronically homeless<br />
37 <strong>in</strong>dividuals<br />
Estimates <strong>of</strong> <strong>Homelessness</strong><br />
6,688 <strong>in</strong>dividuals<br />
people <strong>in</strong> families<br />
3,407 with children<br />
unaccompanied<br />
695 homeless youth<br />
Total Homeless, 2017<br />
10,095<br />
n Unsheltered (1,309)<br />
n Sheltered (8,786)<br />
862 veterans<br />
chronically homeless<br />
725 <strong>in</strong>dividuals<br />
89
Appendix<br />
OKLAHOMA<br />
+2.2%<br />
change from 2016<br />
-19.7%<br />
change from 2010<br />
11 <strong>in</strong> every 10,000<br />
people were experienc<strong>in</strong>g<br />
homelessness<br />
26.6%<br />
73.4%<br />
Estimates <strong>of</strong> <strong>Homelessness</strong><br />
2,824 <strong>in</strong>dividuals<br />
people <strong>in</strong> families<br />
1,375 with children<br />
unaccompanied<br />
363 homeless youth<br />
n Unsheltered (1,115)<br />
n Sheltered (3,084)<br />
349 veterans<br />
OREGON<br />
Total Homeless, 2017<br />
4,199<br />
+5.4%<br />
change from 2016<br />
-28.4%<br />
change from 2010<br />
34 <strong>in</strong> every 10,000<br />
people were experienc<strong>in</strong>g<br />
homelessness<br />
57.1%<br />
42.9%<br />
chronically homeless<br />
578 <strong>in</strong>dividuals<br />
Estimates <strong>of</strong> <strong>Homelessness</strong><br />
10,434 <strong>in</strong>dividuals<br />
people <strong>in</strong> families<br />
3,519 with children<br />
unaccompanied<br />
1,462 homeless youth<br />
n Unsheltered (7,967)<br />
n Sheltered (5,986)<br />
1,251 veterans<br />
Total Homeless, 2017<br />
13,953<br />
PENNSYLVANIA<br />
-7.8%<br />
change from 2016<br />
-2.6%<br />
change from 2010<br />
11 <strong>in</strong> every 10,000<br />
people were experienc<strong>in</strong>g<br />
homelessness<br />
12.7%<br />
87.3%<br />
chronically homeless<br />
3,120 <strong>in</strong>dividuals<br />
Estimates <strong>of</strong> <strong>Homelessness</strong><br />
8,271 <strong>in</strong>dividuals<br />
people <strong>in</strong> families<br />
5,867 with children<br />
unaccompanied<br />
756 homeless youth<br />
90<br />
Total Homeless, 2017<br />
14,138<br />
n Unsheltered (1,798)<br />
n Sheltered (12,340)<br />
963 veterans<br />
chronically homeless<br />
1,372 <strong>in</strong>dividuals
RHODE ISLAND<br />
+1.7%<br />
change from 2016<br />
-8.0%<br />
change from 2010<br />
11 <strong>in</strong> every 10,000<br />
people were experienc<strong>in</strong>g<br />
homelessness<br />
5.8%<br />
94.2%<br />
802 <strong>in</strong>dividuals<br />
Appendix<br />
Estimates <strong>of</strong> <strong>Homelessness</strong><br />
people <strong>in</strong> families<br />
378 with children<br />
unaccompanied<br />
49 homeless youth<br />
Total Homeless, 2017<br />
1,180<br />
SOUTH CAROLINA<br />
-22.5%<br />
change from 2016<br />
-12.5%<br />
change from 2010<br />
n Unsheltered (69)<br />
n Sheltered (1,111)<br />
8 <strong>in</strong> every 10,000<br />
people were experienc<strong>in</strong>g<br />
homelessness<br />
38.3%<br />
61.7%<br />
95 veterans<br />
chronically homeless<br />
240 <strong>in</strong>dividuals<br />
Estimates <strong>of</strong> <strong>Homelessness</strong><br />
2,896 <strong>in</strong>dividuals<br />
people <strong>in</strong> families<br />
1,020 with children<br />
unaccompanied<br />
173 homeless youth<br />
Total Homeless, 2017<br />
3,916<br />
SOUTH DAKOTA<br />
-12.0%<br />
change from 2016<br />
+29.0%<br />
change from 2010<br />
n Unsheltered (1,501)<br />
n Sheltered (2,415)<br />
11 <strong>in</strong> every 10,000<br />
people were experienc<strong>in</strong>g<br />
homelessness<br />
18.1%<br />
81.9%<br />
480 veterans<br />
chronically homeless<br />
792 <strong>in</strong>dividuals<br />
Estimates <strong>of</strong> <strong>Homelessness</strong><br />
611 <strong>in</strong>dividuals<br />
people <strong>in</strong> families<br />
332 with children<br />
unaccompanied<br />
66 homeless youth<br />
n Unsheltered (171)<br />
n Sheltered (772)<br />
130 veterans<br />
Total Homeless, 2017<br />
943<br />
chronically homeless<br />
101 <strong>in</strong>dividuals<br />
91
Appendix<br />
TENNESSEE<br />
-5.4%<br />
change from 2016<br />
-19.1%<br />
change from 2010<br />
13 <strong>in</strong> every 10,000<br />
people were experienc<strong>in</strong>g<br />
homelessness<br />
33.3%<br />
66.7%<br />
Estimates <strong>of</strong> <strong>Homelessness</strong><br />
6,137 <strong>in</strong>dividuals<br />
people <strong>in</strong> families<br />
2,172 with children<br />
unaccompanied<br />
457 homeless youth<br />
n Unsheltered (2,765)<br />
n Sheltered (5,544)<br />
757 veterans<br />
TEXAS<br />
Total Homeless, 2017<br />
8,309<br />
+1.8%<br />
change from 2016<br />
-33.0%<br />
change from 2010<br />
9 <strong>in</strong> every 10,000<br />
people were experienc<strong>in</strong>g<br />
homelessness<br />
36.1%<br />
63.9%<br />
chronically homeless<br />
1,295 <strong>in</strong>dividuals<br />
Estimates <strong>of</strong> <strong>Homelessness</strong><br />
16,708 <strong>in</strong>dividuals<br />
people <strong>in</strong> families<br />
6,840 with children<br />
unaccompanied<br />
1,318 homeless youth<br />
n Unsheltered (8,493)<br />
n Sheltered (15,055)<br />
2,200 veterans<br />
UTAH<br />
Total Homeless, 2017<br />
23,548<br />
+1.6%<br />
change from 2016<br />
-13.2%<br />
change from 2010<br />
9 <strong>in</strong> every 10,000<br />
people were experienc<strong>in</strong>g<br />
homelessness<br />
9.7%<br />
90.3%<br />
chronically homeless<br />
3,497 <strong>in</strong>dividuals<br />
Estimates <strong>of</strong> <strong>Homelessness</strong><br />
1,882 <strong>in</strong>dividuals<br />
people <strong>in</strong> families<br />
970 with children<br />
unaccompanied<br />
180 homeless youth<br />
92<br />
Total Homeless, 2017<br />
2,852<br />
n Unsheltered (278)<br />
n Sheltered (2,574)<br />
220 veterans<br />
chronically homeless<br />
163 <strong>in</strong>dividuals
VERMONT<br />
+9.7%<br />
change from 2016<br />
+0.4%<br />
change from 2010<br />
20 <strong>in</strong> every 10,000<br />
people were experienc<strong>in</strong>g<br />
homelessness<br />
10.9%<br />
89.1%<br />
697 <strong>in</strong>dividuals<br />
Appendix<br />
Estimates <strong>of</strong> <strong>Homelessness</strong><br />
people <strong>in</strong> families<br />
528 with children<br />
unaccompanied<br />
94 homeless youth<br />
VIRGINIA<br />
Total Homeless, 2017<br />
1,225<br />
-3.2%<br />
change from 2016<br />
-33.2%<br />
change from 2010<br />
n Unsheltered (134)<br />
n Sheltered (1,091)<br />
7 <strong>in</strong> every 10,000<br />
people were experienc<strong>in</strong>g<br />
homelessness<br />
16.6%<br />
83.4%<br />
94 veterans<br />
chronically homeless<br />
111 <strong>in</strong>dividuals<br />
Estimates <strong>of</strong> <strong>Homelessness</strong><br />
4,028 <strong>in</strong>dividuals<br />
people <strong>in</strong> families<br />
2,039 with children<br />
unaccompanied<br />
303 homeless youth<br />
n Unsheltered (1,008)<br />
n Sheltered (5,059)<br />
478 veterans<br />
Total Homeless, 2017<br />
6,067<br />
WASHINGTON<br />
+1.4%<br />
change from 2016<br />
-7.7%<br />
change from 2010<br />
29 <strong>in</strong> every 10,000<br />
people were experienc<strong>in</strong>g<br />
homelessness<br />
40.7%<br />
59.3%<br />
chronically homeless<br />
864 <strong>in</strong>dividuals<br />
Estimates <strong>of</strong> <strong>Homelessness</strong><br />
14,781 <strong>in</strong>dividuals<br />
people <strong>in</strong> families<br />
6,331 with children<br />
unaccompanied<br />
2,135 homeless youth<br />
Total Homeless, 2017<br />
21,112<br />
n Unsheltered (8,591)<br />
n Sheltered (12,521)<br />
2,093 veterans<br />
chronically homeless<br />
4,357 <strong>in</strong>dividuals<br />
93
Appendix<br />
WEST VIRGINIA<br />
-5.6%<br />
change from 2016<br />
-42.2%<br />
change from 2010<br />
7 <strong>in</strong> every 10,000<br />
people were experienc<strong>in</strong>g<br />
homelessness<br />
14.4%<br />
85.6%<br />
Estimates <strong>of</strong> <strong>Homelessness</strong><br />
1,032 <strong>in</strong>dividuals<br />
people <strong>in</strong> families<br />
277 with children<br />
unaccompanied<br />
79 homeless youth<br />
Total Homeless, 2017<br />
1,309<br />
WISCONSIN<br />
-11.6%<br />
change from 2016<br />
-20.6%<br />
change from 2010<br />
n Unsheltered (188)<br />
n Sheltered (1,121)<br />
9 <strong>in</strong> every 10,000<br />
people were experienc<strong>in</strong>g<br />
homelessness<br />
6.8%<br />
93.2%<br />
137 veterans<br />
chronically homeless<br />
188 <strong>in</strong>dividuals<br />
Estimates <strong>of</strong> <strong>Homelessness</strong><br />
2,645 <strong>in</strong>dividuals<br />
people <strong>in</strong> families<br />
2,382 with children<br />
unaccompanied<br />
276 homeless youth<br />
WYOMING<br />
Total Homeless, 2017<br />
5,027<br />
+1.9%<br />
change from 2016<br />
+50.8%<br />
change from 2010<br />
n Unsheltered (340)<br />
n Sheltered (4,687)<br />
15 <strong>in</strong> every 10,000<br />
people were experienc<strong>in</strong>g<br />
homelessness<br />
41.6%<br />
58.4%<br />
329 veterans<br />
chronically homeless<br />
342 <strong>in</strong>dividuals<br />
Estimates <strong>of</strong> <strong>Homelessness</strong><br />
622 <strong>in</strong>dividuals<br />
people <strong>in</strong> families<br />
251 with children<br />
unaccompanied<br />
62 homeless youth<br />
n Unsheltered (363)<br />
n Sheltered (510)<br />
63 veterans<br />
94<br />
Total Homeless, 2017<br />
873<br />
chronically homeless<br />
14 <strong>in</strong>dividuals
<strong>The</strong> U.S. Department <strong>of</strong><br />
Hous<strong>in</strong>g and Urban Development<br />
OFFICE OF COMMUNITY PLANNING AND DEVELOPMENT
Page 261 <strong>of</strong> 289
Attachment B<br />
End<strong>in</strong>g Chronic <strong>Homelessness</strong><br />
Page 262 <strong>of</strong> 289
End<strong>in</strong>g Chronic <strong>Homelessness</strong> <strong>in</strong> 2017<br />
No one with a disability should have to experience long-term homelessness.<br />
<strong>The</strong> Opportunity<br />
<strong>The</strong> President’s FY 2016 Budget request <strong>in</strong>cludes an <strong>in</strong>crease <strong>of</strong> $265 million <strong>in</strong> HUD’s Homeless Assistance Grants. If funded by Congress,<br />
this would help to create the supportive hous<strong>in</strong>g necessary to achieve an end to chronic homelessness <strong>in</strong> 2017. Do<strong>in</strong>g so will not only<br />
save and improve quality <strong>of</strong> lives, it will also save money. End<strong>in</strong>g chronic homelessness could reduce avoidable public costs such as<br />
avoidable emergency department visits, jail, and shelter costs.<br />
<strong>The</strong> Need<br />
On any given night, nearly 85,000 Americans with disabl<strong>in</strong>g<br />
health conditions who have been homeless for long periods<br />
<strong>of</strong> time—some for years or decades—can be found sleep<strong>in</strong>g<br />
on our streets, <strong>in</strong> shelters, or other places not meant for<br />
human habitation. <strong>The</strong>se men and women experienc<strong>in</strong>g<br />
chronic homelessness commonly have a comb<strong>in</strong>ation <strong>of</strong><br />
mental health problems, substance use disorders, and<br />
medical conditions that worsen over time and too <strong>of</strong>ten lead<br />
to an early death.<br />
Without connections to the right types <strong>of</strong> care, they cycle <strong>in</strong><br />
and out <strong>of</strong> hospital emergency departments and <strong>in</strong>patient<br />
beds, detox programs, jails, prisons, and psychiatric<br />
<strong>in</strong>stitutions—all at high public expense. Some studies have<br />
found that leav<strong>in</strong>g a person to rema<strong>in</strong> chronically homeless<br />
costs taxpayers as much as $30,000 to $50,000 per year.<br />
<strong>The</strong> Solution<br />
<strong>The</strong>re is a proven solution to chronic homelessness:<br />
Supportive Hous<strong>in</strong>g. Supportive hous<strong>in</strong>g has been shown to<br />
help people permanently stay out <strong>of</strong> homelessness,<br />
improve health conditions, and, by reduc<strong>in</strong>g their use <strong>of</strong><br />
crisis services, lower public costs. Numerous studies have<br />
shown that it is cheaper to provide people experienc<strong>in</strong>g<br />
chronic homelessness with supportive hous<strong>in</strong>g than to have<br />
them rema<strong>in</strong> homeless.<br />
Based on this overwhelm<strong>in</strong>g evidence, the Obama<br />
Adm<strong>in</strong>istration has cont<strong>in</strong>ued the effort begun by the prior<br />
Adm<strong>in</strong>istration to achieve an end to chronic homelessness<br />
through the creation <strong>of</strong> supportive hous<strong>in</strong>g. In 2010, the<br />
Adm<strong>in</strong>istration set a goal to end chronic homelessness, and<br />
has focused on <strong>in</strong>creas<strong>in</strong>g the supply <strong>of</strong> supportive hous<strong>in</strong>g<br />
and promot<strong>in</strong>g the adoption <strong>of</strong> Hous<strong>in</strong>g First practices that<br />
help people obta<strong>in</strong> hous<strong>in</strong>g quickly and without barriers and<br />
preconditions.<br />
Source: Culhane, Metraux, and Hadley (2002)<br />
usich.gov
Progress to Date<br />
S<strong>in</strong>ce 2010, the number <strong>of</strong> people experienc<strong>in</strong>g chronic homelessness on any given night has decl<strong>in</strong>ed by 22,892, or 21 percent.<br />
S<strong>in</strong>ce 2007, the number <strong>of</strong> sheltered <strong>in</strong>dividuals experienc<strong>in</strong>g chronic homelessness decl<strong>in</strong>ed by 25 percent, or 10,565 people, and<br />
the number <strong>of</strong> <strong>in</strong>dividuals experienc<strong>in</strong>g chronic homelessness who are unsheltered decl<strong>in</strong>ed by 33 percent, or 25,632 people.<br />
Communities—like the State <strong>of</strong> Utah—are announc<strong>in</strong>g that they have achieved an end to chronic homelessness. Progress across the<br />
country is uneven, however, and <strong>in</strong> most communities today, there are not enough supportive hous<strong>in</strong>g units to end chronic<br />
homelessness. Shortfalls <strong>in</strong> the Federal budget, <strong>in</strong>clud<strong>in</strong>g through sequestration, have made it impossible to achieve the goal<br />
nationally by the orig<strong>in</strong>al deadl<strong>in</strong>e <strong>of</strong> 2015.<br />
<strong>The</strong> Strategy<br />
<strong>The</strong> Adm<strong>in</strong>istration rema<strong>in</strong>s committed to this goal, and has reset the timeframe for achiev<strong>in</strong>g it from 2015 to 2017. To achieve this<br />
goal <strong>in</strong> this timeframe, Federal agencies are work<strong>in</strong>g with national partners and communities to:<br />
<br />
<br />
<br />
<br />
Create more supportive hous<strong>in</strong>g by redirect<strong>in</strong>g exist<strong>in</strong>g hous<strong>in</strong>g resources<br />
Leverage Medicaid and behavioral health systems to provide supportive services<br />
Improve the target<strong>in</strong>g <strong>of</strong> supportive hous<strong>in</strong>g units to people experienc<strong>in</strong>g chronic homelessness<br />
Implement best practices like Hous<strong>in</strong>g First and assertive outreach and engagement.<br />
However, even the most aggressive use <strong>of</strong> exist<strong>in</strong>g resources still leaves a gap <strong>of</strong> 25,500 supportive hous<strong>in</strong>g units. <strong>The</strong> requested <strong>in</strong>crease<br />
<strong>of</strong> $265 million <strong>in</strong> HUD’s budget will fill this gap and enable communities to achieve an end to chronic homelessness nationally.<br />
<strong>The</strong> Data<br />
Estimates <strong>of</strong> People Experienc<strong>in</strong>g Chronic <strong>Homelessness</strong><br />
By State, 2014<br />
SOURCE: HUD 2014 Annual Homeless Assessment Report to Congress<br />
Contact<br />
(202) 708-4663 | 1275 First Street, NE, Suite 227 | Wash<strong>in</strong>gton, DC 20552 | usich.gov
Page 263 <strong>of</strong> 289
Attachment C<br />
State and Local Recommendations<br />
Page 264 <strong>of</strong> 289
January 2005 Report No. 05-01<br />
<strong>Economic</strong> Impact <strong>of</strong> <strong>Homelessness</strong> Is Significant;<br />
Improvements Needed at State and Local Levels<br />
at a glance<br />
<strong>The</strong> economic impact <strong>of</strong> homelessness <strong>in</strong> Florida is<br />
significant, with the state, local, and federal<br />
governments spend<strong>in</strong>g at least $168 million annually for<br />
programs and services to assist the homeless. This<br />
total excludes expenses <strong>in</strong>curred by local entities such<br />
as the police, courts, emergency service providers,<br />
hospital emergency rooms, and some private charities<br />
<strong>in</strong> deal<strong>in</strong>g with homeless persons, as these costs are<br />
not tracked by homeless coalitions, service providers,<br />
or government agencies.<br />
Statewide, Florida is do<strong>in</strong>g well <strong>in</strong> obta<strong>in</strong><strong>in</strong>g dedicated<br />
federal fund<strong>in</strong>g for the homeless. However, some areas<br />
<strong>of</strong> the state have not done well <strong>in</strong> access<strong>in</strong>g federal<br />
fund<strong>in</strong>g.<br />
State agencies assist local homeless efforts by<br />
provid<strong>in</strong>g technical assistance, direct services, and<br />
fund<strong>in</strong>g. However, some state agency practices and<br />
adm<strong>in</strong>istrative requirements <strong>of</strong> ma<strong>in</strong>stream programs<br />
could be improved.<br />
Coord<strong>in</strong>ation among local homeless service providers is<br />
occurr<strong>in</strong>g, but could be improved by <strong>in</strong>creased<br />
participation <strong>of</strong> service providers and full implementation<br />
<strong>of</strong> their computerized <strong>in</strong>formation systems.<br />
Scope __________________<br />
Chapter 2001-98, Laws <strong>of</strong> Florida, directed the Office<br />
<strong>of</strong> Program Policy Analysis and Government<br />
Accountability (OPPAGA) to exam<strong>in</strong>e state efforts to<br />
address homelessness. As provided by law, our<br />
report addresses the four questions below.<br />
Office <strong>of</strong> Program Policy Analysis & Government Accountability<br />
an <strong>of</strong>fice <strong>of</strong> the Florida Legislature<br />
• What is the economic impact <strong>of</strong> homelessness<br />
<strong>in</strong> Florida?<br />
• To what extent are local cont<strong>in</strong>uums <strong>of</strong> care<br />
access<strong>in</strong>g dedicated and ma<strong>in</strong>stream federal<br />
fund<strong>in</strong>g for the homeless?<br />
• How can state agency practices be improved<br />
to better assist the homeless?<br />
• How can local providers better coord<strong>in</strong>ate<br />
services for the homeless?<br />
Background _____________<br />
<strong>Homelessness</strong> is a chronic problem <strong>in</strong> Florida. 1<br />
In 2003, Florida’s homeless population was<br />
estimated to range from 68,785 to 76,675 persons<br />
on any particular day. 2 Homeless populations<br />
<strong>in</strong>clude various subgroups, such as families,<br />
veterans, senior citizens, and youth. People may<br />
become homeless for many reasons, <strong>in</strong>clud<strong>in</strong>g<br />
poverty, lack <strong>of</strong> affordable hous<strong>in</strong>g and<br />
transportation, unemployment, illness, and<br />
divorce. Homeless <strong>in</strong>dividuals also frequently<br />
suffer from substance abuse and mental illness.<br />
Federal, state, and local governments, faith-based<br />
organizations, and private and non-pr<strong>of</strong>it entities<br />
provide services to assist the homeless <strong>in</strong> secur<strong>in</strong>g<br />
hous<strong>in</strong>g, employment and health and treatment<br />
1<br />
Florida law def<strong>in</strong>es a “homeless” person as an <strong>in</strong>dividual who lacks<br />
a fixed, regular, and adequate night time residence or someone<br />
whose primary nighttime residence is a shelter, an <strong>in</strong>stitution, or a<br />
public or private place not designed for regular sleep<strong>in</strong>g<br />
accommodations.<br />
2<br />
Homeless population based on two estimated counts conducted <strong>in</strong><br />
Florida dur<strong>in</strong>g 2003.
OPPAGA Report Report No. 05-01<br />
services. Homeless <strong>in</strong>dividuals are typically<br />
assisted at the local level through a network <strong>of</strong><br />
service providers that may <strong>in</strong>clude shelters, food<br />
and cloth<strong>in</strong>g banks, and mental health and<br />
substance abuse treatment centers.<br />
Fund<strong>in</strong>g to address homelessness <strong>in</strong> Florida is<br />
provided by a variety <strong>of</strong> sources, <strong>in</strong>clud<strong>in</strong>g<br />
federal, state, and local governments and private<br />
donations. See page 3 for further discussion <strong>of</strong><br />
homelessness fund<strong>in</strong>g and Appendix A, page 8,<br />
for a list <strong>of</strong> fund<strong>in</strong>g sources.<br />
State Office on <strong>Homelessness</strong>. At the state level,<br />
the Department <strong>of</strong> Children and Families’ Office<br />
on <strong>Homelessness</strong> serves as the central po<strong>in</strong>t <strong>of</strong><br />
contact on homeless issues. 3 <strong>The</strong> <strong>of</strong>fice’s primary<br />
role is to coord<strong>in</strong>ate state agencies and programs<br />
that serve the homeless or persons at risk <strong>of</strong><br />
becom<strong>in</strong>g homeless. <strong>The</strong> <strong>of</strong>fice also adm<strong>in</strong>isters<br />
state-funded grant programs to assist local<br />
coalitions that serve the homeless.<br />
<strong>The</strong> Legislature appropriated the Department <strong>of</strong><br />
Children and Families $726,655 and three full-time<br />
equivalent positions to adm<strong>in</strong>ister the Office on<br />
<strong>Homelessness</strong> <strong>in</strong> Fiscal Year 2004-05. 4<br />
Council on <strong>Homelessness</strong>. <strong>The</strong> Council on<br />
<strong>Homelessness</strong> is responsible for develop<strong>in</strong>g<br />
policies to reduce homelessness <strong>in</strong> the state and<br />
advis<strong>in</strong>g the State Office on <strong>Homelessness</strong>. <strong>The</strong><br />
council also annually prepares a report to the<br />
Governor and Legislature recommend<strong>in</strong>g actions<br />
that can help reduce homelessness <strong>in</strong> Florida. <strong>The</strong><br />
council has 15 members represent<strong>in</strong>g state<br />
agencies, gubernatorial appo<strong>in</strong>tees, statewide<br />
organizations, and homeless advocacy groups.<br />
Local Homeless Coalitions. Homeless coalitions<br />
plan, coord<strong>in</strong>ate, and monitor the delivery <strong>of</strong><br />
services to the homeless at the local level.<br />
Homeless coalitions consist <strong>of</strong> local organizations<br />
and government agencies that provide services for<br />
the homeless. Members <strong>in</strong>clude mental health<br />
and substance abuse treatment providers, county<br />
health departments, entities that provide food<br />
and shelter, law enforcement units, regional<br />
workforce boards, public hous<strong>in</strong>g authorities,<br />
school districts, and county and municipal<br />
governments. As <strong>of</strong> November 2004, 29 homeless<br />
3<br />
Chapter 2001-98, Laws <strong>of</strong> Florida, created the state Office on<br />
<strong>Homelessness</strong> and the Council on <strong>Homelessness</strong>.<br />
4<br />
<strong>The</strong> Office on <strong>Homelessness</strong> is funded primarily by general revenue.<br />
2<br />
coalitions represent<strong>in</strong>g all 67 counties were<br />
operat<strong>in</strong>g <strong>in</strong> Florida.<br />
Homeless coalitions must establish cont<strong>in</strong>uum <strong>of</strong><br />
care plans <strong>in</strong> order to be eligible to apply for federal<br />
homeless grants from the U.S. Department <strong>of</strong><br />
Hous<strong>in</strong>g and Urban Development (HUD) and<br />
certa<strong>in</strong> state grants adm<strong>in</strong>istered by the State<br />
Office on <strong>Homelessness</strong>. 5 <strong>The</strong> coalitions or a<br />
designated lead agency are to use these plans to<br />
establish a framework for provid<strong>in</strong>g emergency,<br />
transitional, and permanent hous<strong>in</strong>g as well as<br />
supportive services to the homeless and persons at<br />
risk <strong>of</strong> becom<strong>in</strong>g homeless. Sixty-one <strong>of</strong> Florida’s<br />
67 counties are currently covered under a<br />
cont<strong>in</strong>uum <strong>of</strong> care system; the rema<strong>in</strong><strong>in</strong>g six<br />
counties are rural counties that have few homeless<br />
service providers. (See Appendix B on page 13 for<br />
a map <strong>of</strong> areas covered by cont<strong>in</strong>uums <strong>of</strong> care and<br />
their lead agencies.)<br />
Questions and Answers ––<br />
Our review <strong>of</strong> homelessness <strong>in</strong> Florida considered<br />
four questions.<br />
• What is the economic impact <strong>of</strong> homelessness<br />
<strong>in</strong> Florida?<br />
• To what extent are local cont<strong>in</strong>uums <strong>of</strong> care<br />
access<strong>in</strong>g dedicated and ma<strong>in</strong>stream federal<br />
funds for the homeless?<br />
• How can state agency practices be improved<br />
to better assist the homeless?<br />
• How can local governments and entities better<br />
coord<strong>in</strong>ate services for the homeless?<br />
What is the economic impact <strong>of</strong><br />
homelessness <strong>in</strong> Florida?<br />
<strong>Homelessness</strong> has a significant economic impact<br />
on the state, <strong>in</strong>clud<strong>in</strong>g the costs <strong>of</strong> provid<strong>in</strong>g<br />
direct services to homeless persons. As shown <strong>in</strong><br />
Exhibit 1, we identified $168 million <strong>in</strong> state,<br />
federal, and local fund<strong>in</strong>g for programs and<br />
services to assist the homeless, such as hous<strong>in</strong>g,<br />
food preparation and distribution, transportation<br />
and mental health counsel<strong>in</strong>g.<br />
This figure does not <strong>in</strong>clude the expenses <strong>in</strong>curred<br />
by various local entities, such as some private<br />
charities as well as the police, the courts,<br />
5<br />
<strong>The</strong>se grants <strong>in</strong>clude the state Challenge Grant and Homeless<br />
Hous<strong>in</strong>g Assistance Grant. See Appendix A.
Report No. 05-01<br />
OPPAGA Report<br />
emergency service providers, and hospital<br />
emergency rooms that deal with homeless<br />
persons. Homeless persons <strong>of</strong>ten are arrested for<br />
various m<strong>in</strong>or crimes such as vagrancy, and <strong>of</strong>ten<br />
require emergency health treatment. <strong>The</strong>se<br />
expenses cannot be determ<strong>in</strong>ed because they are<br />
not separately tracked by homeless coalitions,<br />
service providers, and government agencies;<br />
however, they are likely to be significant. This can<br />
be illustrated by the case <strong>of</strong> a homeless <strong>in</strong>dividual<br />
whose service-related expenses were tracked by<br />
the homeless coalition serv<strong>in</strong>g the City <strong>of</strong><br />
Jacksonville. This person was a 35-year-old<br />
chronically homeless male diagnosed with bipolar<br />
disorder and alcoholism. <strong>The</strong> local homeless<br />
coalition estimated that local entities <strong>in</strong>curred<br />
$43,545 <strong>in</strong> costs over a seven-month period <strong>in</strong><br />
deal<strong>in</strong>g with this <strong>in</strong>dividual. <strong>The</strong>se costs <strong>in</strong>cluded<br />
amounts result<strong>in</strong>g from four separate admittances<br />
to a crisis stabilization unit for mental illness, three<br />
emergency room visits, two admittances to the<br />
hospital <strong>in</strong>tensive care unit, 120 total days spent <strong>in</strong><br />
the county jail, and two stays at a local shelter.<br />
Exhibit 1<br />
Identifiable Fund<strong>in</strong>g for Homeless Services<br />
Totaled $168 Million <strong>in</strong> Fiscal Year 2002-03 1<br />
Fund<strong>in</strong>g Source<br />
(Federal Fiscal Year 2003 and<br />
State Fiscal Year 2002-03)<br />
Amount <strong>of</strong><br />
Fund<strong>in</strong>g<br />
Federal funds dedicated to homeless<br />
Cont<strong>in</strong>uum <strong>of</strong> Care programs $ 51,396,280<br />
Emergency Shelter Grants 6,977,570<br />
Other homeless grants 28,980,993<br />
Federal funds available for general population,<br />
but used to fund local homeless programs* 8,331,611 2<br />
State funds dedicated to homeless -<br />
Office on <strong>Homelessness</strong> State Grants $ 9,731,564<br />
Florida Hous<strong>in</strong>g F<strong>in</strong>ance Corporation 5,000,000<br />
Other homeless grants 10,986,805 2<br />
Local funds $46,464,496 2<br />
Estimated Total $167,869,319<br />
1 OPPAGA collected <strong>in</strong>formation for the time period that <strong>in</strong>cludes<br />
Federal Fiscal Year 2003 and State Fiscal Year 2002-03. Fund<strong>in</strong>g<br />
amounts were reported by the U.S. Department <strong>of</strong> Hous<strong>in</strong>g and<br />
Urban Development, State Office on <strong>Homelessness</strong>, and local<br />
homeless coalitions.<br />
2<br />
Estimates <strong>of</strong> these fund<strong>in</strong>g amounts were provided by only n<strong>in</strong>e<br />
homeless coalitions. Total fund<strong>in</strong>g is likely to be greater.<br />
Source: OPPAGA analysis <strong>of</strong> various fund<strong>in</strong>g data.<br />
This figure also does not <strong>in</strong>clude the societal costs<br />
<strong>of</strong> homeless, which cannot be readily calculated.<br />
<strong>The</strong>se costs could <strong>in</strong>clude degraded property<br />
3<br />
values <strong>in</strong> areas frequented by homeless persons,<br />
lost economic activity, and disrupted education<br />
and family situations <strong>of</strong> children affected by<br />
homelessness.<br />
To what extent is the state access<strong>in</strong>g<br />
dedicated federal homeless funds?<br />
A major source <strong>of</strong> dedicated fund<strong>in</strong>g for homeless<br />
programs is the U.S. Department <strong>of</strong> Hous<strong>in</strong>g and<br />
Urban Development (HUD). HUD annually<br />
awards dedicated funds for homeless programs<br />
created by the McK<strong>in</strong>ney-Vento Homeless<br />
Assistance Act to local cont<strong>in</strong>uums <strong>of</strong> care. 6<br />
Florida is do<strong>in</strong>g well on a statewide basis <strong>in</strong><br />
obta<strong>in</strong><strong>in</strong>g dedicated homeless fund<strong>in</strong>g from HUD.<br />
As shown <strong>in</strong> Exhibit 2, HUD has awarded Florida<br />
more than its pro-rata amount <strong>of</strong> funds <strong>in</strong> each <strong>of</strong><br />
the last three fiscal years.<br />
Exhibit 2<br />
Florida Received More Than Its Pro-Rata Amount <strong>of</strong><br />
McK<strong>in</strong>ney-Vento Act Fund<strong>in</strong>g From Federal<br />
Fiscal Years 2001 to 2003<br />
Federal Fiscal Year<br />
2001 2002 2003<br />
Award Amount $48,692,766 $41,239,338 $51,396,280<br />
Pro Rata Amount 37,106,859 37,416,000 37,416,000<br />
Difference $11,585,907 $ 3,823,338 $13,980,280<br />
Source: U.S. Department <strong>of</strong> Hous<strong>in</strong>g and Urban Development.<br />
As part <strong>of</strong> its competitive grant process, HUD<br />
<strong>in</strong>itially estimates a “pro-rata need,” which is the<br />
dollar expression <strong>of</strong> relative homeless assistance<br />
needs it assigns to each community or groups <strong>of</strong><br />
communities us<strong>in</strong>g U.S. Census Bureau data.<br />
HUD may award a community fund<strong>in</strong>g that<br />
exceeds its pro-rata amount if the community’s<br />
cont<strong>in</strong>uum <strong>of</strong> care entity submits a fund<strong>in</strong>g<br />
application that<br />
• meets HUD’s grant award criteria, such as<br />
provid<strong>in</strong>g permanent hous<strong>in</strong>g for disabled adults;<br />
• clearly identifies a priority need and <strong>in</strong>cludes<br />
documentation show<strong>in</strong>g how a proposed<br />
project would elim<strong>in</strong>ate or substantially<br />
decrease the need; and<br />
6<br />
<strong>The</strong> federal McK<strong>in</strong>ney-Vento Homeless Assistance Act was passed<br />
<strong>in</strong> 1987. It provides fund<strong>in</strong>g to state and local groups through<br />
formula or competitive grants to assist communities to develop<br />
hous<strong>in</strong>g and provide services for the homeless.
OPPAGA Report Report No. 05-01<br />
• requests renewal fund<strong>in</strong>g for projects that<br />
were funded <strong>in</strong> previous years.<br />
Cont<strong>in</strong>uums <strong>of</strong> care may receive less than their<br />
pro-rata amount if HUD determ<strong>in</strong>es that their<br />
fund<strong>in</strong>g applications do not adequately address<br />
grant award criteria or if the cont<strong>in</strong>uum does not<br />
seek renewal fund<strong>in</strong>g for its projects.<br />
Some Florida cont<strong>in</strong>uums have not done well <strong>in</strong><br />
access<strong>in</strong>g HUD fund<strong>in</strong>g. Between 2001 and 2003,<br />
15 cont<strong>in</strong>uums received less than their pro-rata<br />
amount as <strong>in</strong>itially determ<strong>in</strong>ed by HUD. State<br />
Office on <strong>Homelessness</strong> and HUD managers<br />
reported that coalitions received less than their<br />
pro-rata amount because they failed to apply for<br />
fund<strong>in</strong>g, submitted applications that conta<strong>in</strong>ed<br />
errors or <strong>in</strong>cluded activities that were <strong>in</strong>eligible for<br />
fund<strong>in</strong>g, or did not have a permanent hous<strong>in</strong>g<br />
project <strong>in</strong>cluded <strong>in</strong> their plans.<br />
Access to ma<strong>in</strong>stream services could be<br />
improved. A major concern <strong>in</strong> serv<strong>in</strong>g homeless<br />
<strong>in</strong>dividuals is ensur<strong>in</strong>g they have access to federal<br />
ma<strong>in</strong>stream assistance programs. Ma<strong>in</strong>stream<br />
programs are those that provide various forms <strong>of</strong><br />
f<strong>in</strong>ancial, health, and social support designed to<br />
remedy the disabl<strong>in</strong>g conditions and other<br />
problems that prevent homeless <strong>in</strong>dividuals from<br />
becom<strong>in</strong>g healthy and liv<strong>in</strong>g as self-sufficiently as<br />
possible <strong>in</strong> permanent, stable hous<strong>in</strong>g. <strong>The</strong>se<br />
programs, such as Temporary Assistance to Needy<br />
Families (TANF), Medicaid, and Social Security<br />
Income (SSI) are <strong>in</strong>tended to help lower <strong>in</strong>come<br />
people and not dedicated to serv<strong>in</strong>g the homeless.<br />
<strong>The</strong> U.S. Department <strong>of</strong> Hous<strong>in</strong>g and Urban<br />
Development requires local cont<strong>in</strong>uums <strong>of</strong> care to<br />
report on the extent to which they are<br />
systematically assist<strong>in</strong>g homeless persons to access<br />
federal ma<strong>in</strong>stream program services as part <strong>of</strong><br />
their grant applications. As shown <strong>in</strong> Exhibit 3,<br />
most <strong>of</strong> Florida’s homeless cont<strong>in</strong>uums <strong>of</strong> care<br />
reported they were assist<strong>in</strong>g homeless people<br />
access several ma<strong>in</strong>stream programs.<br />
However, some cont<strong>in</strong>uums could improve their<br />
efforts to help homeless <strong>in</strong>dividuals access federal<br />
programs. For example, 11 <strong>of</strong> 26 cont<strong>in</strong>uums did<br />
not report help<strong>in</strong>g homeless persons access<br />
services provided through the State Children’s<br />
Health Insurance Program (SCHIP), and eight did<br />
not report help<strong>in</strong>g them access Workforce<br />
Investment Act services.<br />
Exhibit 3<br />
Most Cont<strong>in</strong>uums <strong>of</strong> Care Assist Homeless Persons<br />
Access Ma<strong>in</strong>stream Program Services<br />
Number <strong>of</strong> Cont<strong>in</strong>uums<br />
Assist<strong>in</strong>g Homeless<br />
Ma<strong>in</strong>stream Program<br />
(N=26)<br />
State Children’s Health Insurance<br />
Program (SCHIP) 15<br />
Workforce Incentive Act (WIA) 18<br />
Supplemental Security Disability<br />
Income (SSDI) 22<br />
Supplemental Security Income (SSI) 23<br />
Veterans Health Care 23<br />
Medicaid 24<br />
Food Stamps 24<br />
Temporary Assistance for Needy<br />
Families (TANF) 25<br />
Source: OPPAGA analysis <strong>of</strong> 26 Cont<strong>in</strong>uum <strong>of</strong> Care applications.<br />
We contacted representatives <strong>of</strong> six cont<strong>in</strong>uums <strong>of</strong><br />
care that reported that their member agencies did<br />
not rout<strong>in</strong>ely help homeless persons identify,<br />
apply for, and follow up to receive benefits for<br />
two or more ma<strong>in</strong>stream programs. <strong>The</strong>se<br />
representatives gave several reasons for not<br />
assist<strong>in</strong>g homeless <strong>in</strong>dividuals to access<br />
ma<strong>in</strong>stream programs, <strong>in</strong>clud<strong>in</strong>g not be<strong>in</strong>g aware<br />
<strong>of</strong> programs such as SCHIP and the Workforce<br />
Investment Act and difficulty <strong>in</strong> work<strong>in</strong>g with<br />
their regional workforce agency that adm<strong>in</strong>isters<br />
the Workforce Investment Act. However, two<br />
representatives <strong>in</strong>dicated that their cont<strong>in</strong>uums<br />
had <strong>in</strong>correctly completed their HUD grant<br />
applications and were <strong>in</strong> fact help<strong>in</strong>g homeless<br />
persons access ma<strong>in</strong>stream programs.<br />
One <strong>of</strong> the objectives <strong>in</strong> the Council on<br />
<strong>Homelessness</strong> strategic plan is to <strong>in</strong>crease the<br />
percentage <strong>of</strong> homeless <strong>in</strong>dividuals assisted by<br />
ma<strong>in</strong>stream programs. In September 2004, the<br />
Office on <strong>Homelessness</strong> proposed that<br />
representatives <strong>of</strong> local cont<strong>in</strong>uums <strong>of</strong> care meet<br />
with state agency <strong>of</strong>ficials who adm<strong>in</strong>ister<br />
ma<strong>in</strong>stream programs to (1) identify barriers that<br />
limit the ability <strong>of</strong> the homeless to access program<br />
benefits, and (2) work cooperatively to develop<br />
solutions that can elim<strong>in</strong>ate those barriers. As <strong>of</strong><br />
November 2004, the Office on <strong>Homelessness</strong> had<br />
developed a list <strong>of</strong> programs that local homeless<br />
coalitions need help access<strong>in</strong>g. <strong>The</strong>se programs<br />
<strong>in</strong>clude the Department <strong>of</strong> Children and Families’<br />
Emergency F<strong>in</strong>ancial Assistance for Hous<strong>in</strong>g<br />
4
Report No. 05-01<br />
OPPAGA Report<br />
Program, Public Hous<strong>in</strong>g Authorities’ Section 8<br />
Program, and Temporary Assistance for Needy<br />
Families. Accord<strong>in</strong>g to Office on <strong>Homelessness</strong><br />
managers, workshops to address barriers posed by<br />
these programs will take place dur<strong>in</strong>g the first<br />
quarter <strong>of</strong> 2005.<br />
<strong>The</strong> council’s strategic plan also notes that it is<br />
seek<strong>in</strong>g to establish work<strong>in</strong>g agreements with<br />
agencies that adm<strong>in</strong>ister ma<strong>in</strong>stream programs to<br />
ensure there is a concerted effort to reduce<br />
barriers to homeless <strong>in</strong>dividuals. To date, it has<br />
fully executed an agreement with the Agency for<br />
Workforce Innovation and Workforce Florida to<br />
assist the homeless <strong>in</strong> achiev<strong>in</strong>g greater<br />
<strong>in</strong>dependence through employment. <strong>The</strong> council<br />
is <strong>in</strong> the process <strong>of</strong> f<strong>in</strong>aliz<strong>in</strong>g agreements with the<br />
Department <strong>of</strong> Community Affairs and the<br />
Department <strong>of</strong> Corrections.<br />
How can state agency practices be improved<br />
to better assist the homeless?<br />
State agencies perform a variety <strong>of</strong> functions that<br />
benefit the homeless, <strong>in</strong>clud<strong>in</strong>g provid<strong>in</strong>g<br />
technical assistance and fund<strong>in</strong>g to local<br />
coalitions. (See Appendix C on page 14 for a<br />
description <strong>of</strong> services provided by state agencies<br />
to assist the homeless.)<br />
Most (11 <strong>of</strong> 15) local coalition directors respond<strong>in</strong>g<br />
to an OPPAGA survey gave high rat<strong>in</strong>gs to the<br />
assistance provided by the state Office on<br />
<strong>Homelessness</strong>. However, coalition directors<br />
identified some state agency functions that could<br />
be improved to enhance services for the homeless,<br />
such as better discharge plann<strong>in</strong>g for homeless<br />
persons and streaml<strong>in</strong><strong>in</strong>g certa<strong>in</strong> adm<strong>in</strong>istrative<br />
requirements.<br />
Few state agencies have developed or<br />
implemented discharge plann<strong>in</strong>g policies.<br />
Discharge plann<strong>in</strong>g is important for people leav<strong>in</strong>g<br />
state services who are at risk <strong>of</strong> becom<strong>in</strong>g<br />
homeless. <strong>The</strong>se persons <strong>in</strong>clude <strong>in</strong>mates exit<strong>in</strong>g<br />
state correctional facilities, children ag<strong>in</strong>g out <strong>of</strong><br />
foster care, families com<strong>in</strong>g <strong>of</strong>f public assistance,<br />
developmentally disabled <strong>in</strong>dividuals be<strong>in</strong>g de<strong>in</strong>stitutionalized,<br />
and mentally ill persons leav<strong>in</strong>g<br />
state <strong>in</strong>stitutions. Discharge plann<strong>in</strong>g refers to<br />
prepar<strong>in</strong>g a person <strong>in</strong> an <strong>in</strong>stitution for return to<br />
the community and l<strong>in</strong>k<strong>in</strong>g these <strong>in</strong>dividuals to<br />
needed community support services.<br />
Some local coalition directors expressed concern<br />
that state agencies were not adequately plann<strong>in</strong>g<br />
for the discharge <strong>of</strong> persons who could potentially<br />
become homeless. For example, the Department<br />
<strong>of</strong> Correction’s current discharge plann<strong>in</strong>g efforts<br />
relies on show<strong>in</strong>g <strong>in</strong>mates <strong>in</strong>structional videos<br />
prior to their release.<br />
<strong>The</strong> state Council on <strong>Homelessness</strong> is work<strong>in</strong>g to<br />
address these concerns and identified discharge<br />
plann<strong>in</strong>g as a priority issue <strong>in</strong> its strategic plan. <strong>The</strong><br />
council is work<strong>in</strong>g with state agencies to formulate<br />
program-level discharge plann<strong>in</strong>g agreements for<br />
various populations at risk <strong>of</strong> becom<strong>in</strong>g homeless.<br />
<strong>The</strong>se discharge plans are to address whether<br />
<strong>in</strong>dividuals will have hous<strong>in</strong>g, services such as<br />
transportation, medication, and cloth<strong>in</strong>g, personal<br />
identification and documentation, employment,<br />
benefits (TANF, Food Stamps, Medicaid), and a<br />
support network (family, friends) once they are<br />
released. <strong>The</strong> Department <strong>of</strong> Corrections is<br />
currently develop<strong>in</strong>g a discharge plan that it expects<br />
to f<strong>in</strong>alize by the end <strong>of</strong> 2004. <strong>The</strong> Office on<br />
<strong>Homelessness</strong> expects the Department <strong>of</strong> Children<br />
and Families, which adm<strong>in</strong>isters state public<br />
assistance, foster care, and mental health programs,<br />
and the Agency for Persons with Disabilities to start<br />
develop<strong>in</strong>g discharge plans <strong>in</strong> 2005.<br />
Requirements <strong>of</strong> some assistance programs pose<br />
barriers to homeless applicants. Coalition<br />
directors identified several state adm<strong>in</strong>istrative<br />
requirements that impede homeless persons <strong>in</strong><br />
access<strong>in</strong>g assistance programs. <strong>The</strong>y told us that<br />
the adm<strong>in</strong>istrative requirements <strong>of</strong> programs such<br />
as Medicaid, Food Stamps, and Temporary<br />
Assistance for Needy Families (TANF) make it<br />
difficult for them to provide services to the<br />
homeless.<br />
Specifically, coalition directors noted client<br />
identification and application requirements, and<br />
the eligibility determ<strong>in</strong>ation process for these<br />
programs as barriers to assist<strong>in</strong>g clients. Many<br />
programs require applicants to provide<br />
documents prov<strong>in</strong>g their identity, citizenship,<br />
<strong>in</strong>come, and f<strong>in</strong>ancial resources. However,<br />
homeless people <strong>of</strong>ten do not have these<br />
documents because they may not have a safe and<br />
secure place to store important papers. This may<br />
delay the process<strong>in</strong>g and approval <strong>of</strong> their<br />
applications for services.<br />
5
OPPAGA Report Report No. 05-01<br />
<strong>The</strong>se barriers are consistent with those noted <strong>in</strong> a<br />
2002 report by the U.S. Government Accountability<br />
Office (GAO). <strong>The</strong> GAO report noted that<br />
homelessness complicates the ability <strong>of</strong> people to<br />
access program services because paperwork<br />
requirements and the need to regularly<br />
communicate with agencies and service providers<br />
tend to be more difficult for <strong>in</strong>dividuals lack<strong>in</strong>g a<br />
permanent address or phone number. 7<br />
How can local entities better coord<strong>in</strong>ate<br />
services for the homeless?<br />
Homeless coalitions depend on numerous local<br />
agencies to provide various services to homeless<br />
persons. Local service providers <strong>in</strong>clude shelters,<br />
food and cloth<strong>in</strong>g banks, and mental health and<br />
substance abuse treatment centers. Ideally,<br />
homeless <strong>in</strong>dividuals can access these services<br />
through a coord<strong>in</strong>ated system <strong>of</strong> local service<br />
providers.<br />
Most local service providers are try<strong>in</strong>g to<br />
coord<strong>in</strong>ate their activities. Our review <strong>of</strong> local<br />
cont<strong>in</strong>uum <strong>of</strong> care plans submitted to HUD <strong>in</strong><br />
2003 determ<strong>in</strong>ed that most providers attended<br />
meet<strong>in</strong>gs held to coord<strong>in</strong>ate delivery <strong>of</strong> homeless<br />
services. Over half <strong>of</strong> the local homeless coalition<br />
directors who responded to an OPPAGA survey<br />
reported that service providers participated <strong>in</strong><br />
their local cont<strong>in</strong>uum <strong>of</strong> care.<br />
However, efforts to further improve coord<strong>in</strong>ation<br />
are h<strong>in</strong>dered by two factors:<br />
• some homeless service providers are not<br />
participat<strong>in</strong>g <strong>in</strong> their local cont<strong>in</strong>uums <strong>of</strong> care;<br />
and<br />
• most homeless coalitions have not yet fully<br />
implemented homeless management<br />
<strong>in</strong>formation systems.<br />
Some homeless service providers do not<br />
participate <strong>in</strong> their local cont<strong>in</strong>uums <strong>of</strong> care. Six<br />
coalition directors respond<strong>in</strong>g to our survey<br />
reported that some providers <strong>of</strong> homeless services<br />
<strong>in</strong> their community were not participat<strong>in</strong>g <strong>in</strong> the<br />
local cont<strong>in</strong>uum <strong>of</strong> care, <strong>in</strong>clud<strong>in</strong>g some public<br />
hous<strong>in</strong>g authorities, public defenders, and state<br />
attorneys. <strong>The</strong>y believed that these entities may<br />
not be participat<strong>in</strong>g because they do not have the<br />
7<br />
<strong>Homelessness</strong>: Improv<strong>in</strong>g Program Coord<strong>in</strong>ation and Client Access<br />
to Programs, Government Accountability Office, GAO-02-485T,<br />
March 6, 2002.<br />
6<br />
time or the personnel to devote to the<br />
cont<strong>in</strong>uum’s activities or were not <strong>in</strong>terested <strong>in</strong><br />
be<strong>in</strong>g <strong>in</strong>volved. Coalition directors noted that<br />
the limited <strong>in</strong>volvement <strong>of</strong> these and other<br />
stakeholders makes it difficult to coord<strong>in</strong>ate<br />
services, reduces their ability to acquire federal<br />
fund<strong>in</strong>g, and impedes efforts to share <strong>in</strong>formation<br />
about homeless <strong>in</strong>dividuals .<br />
Most homeless coalitions have not yet fully<br />
implemented homeless management <strong>in</strong>formation<br />
systems. HUD requires communities that receive<br />
federal dedicated homeless fund<strong>in</strong>g to track<br />
<strong>in</strong>formation about their clients with a computerized<br />
<strong>in</strong>formation system. <strong>The</strong>se <strong>in</strong>formation systems are<br />
expected to allow local providers to systematically<br />
share <strong>in</strong>formation, <strong>in</strong>tegrate services, and maximize<br />
the use <strong>of</strong> resources. Shar<strong>in</strong>g client <strong>in</strong>formation also<br />
should reduce duplication <strong>in</strong> provider <strong>in</strong>take<br />
activities, facilitate referrals among providers, and<br />
improve the coord<strong>in</strong>ation <strong>of</strong> services.<br />
Most homeless coalition directors respond<strong>in</strong>g to<br />
our survey reported their coalitions have not fully<br />
implemented homeless management <strong>in</strong>formation<br />
systems. For example, two coalition directors said<br />
their systems had not yet been developed. Other<br />
coalition directors told us that only a few <strong>of</strong> their<br />
local service providers were enter<strong>in</strong>g <strong>in</strong>formation<br />
<strong>in</strong>to their systems.<br />
Although the U.S. Congress <strong>in</strong>itially <strong>in</strong>tended<br />
homeless management <strong>in</strong>formation systems to be<br />
fully implemented by 2004, this goal has not been<br />
met. Accord<strong>in</strong>g to Office on <strong>Homelessness</strong><br />
managers, HUD’s 2005 Notice <strong>of</strong> Fund<strong>in</strong>g<br />
Availability will encourage local cont<strong>in</strong>uums <strong>of</strong><br />
care to speed up implement<strong>in</strong>g their <strong>in</strong>formation<br />
systems. <strong>The</strong>y said that participation <strong>in</strong> a system<br />
will be a factor <strong>in</strong> determ<strong>in</strong><strong>in</strong>g the amount <strong>of</strong><br />
fund<strong>in</strong>g local cont<strong>in</strong>uums <strong>of</strong> care receive from<br />
HUD. HUD is also provid<strong>in</strong>g technical assistance<br />
to cont<strong>in</strong>uum <strong>of</strong> care agencies to assist them <strong>in</strong><br />
implement<strong>in</strong>g their homeless management<br />
<strong>in</strong>formation systems.<br />
A problem that could limit the usefulness <strong>of</strong> the<br />
<strong>in</strong>formation systems is that some local providers<br />
do not wish to use the systems due to concerns<br />
with the confidentiality <strong>of</strong> client data. For<br />
example, one provider director told us he did not<br />
want to participate <strong>in</strong> the <strong>in</strong>formation system<br />
because he was concerned that law enforcement<br />
agencies would access the system and use it to
Report No. 05-01<br />
OPPAGA Report<br />
locate and arrest homeless persons. Until such<br />
issues are resolved, it is likely that some local<br />
providers will not enter client data <strong>in</strong>to local<br />
homeless <strong>in</strong>formation systems.<br />
Conclusions and<br />
Recommendations _______<br />
<strong>The</strong> economic impact <strong>of</strong> homelessness <strong>in</strong> Florida is<br />
significant. We identified $168 million <strong>in</strong> state,<br />
federal, and local fund<strong>in</strong>g for programs and<br />
services to assist the homeless, such as hous<strong>in</strong>g,<br />
food preparation and distribution, transportation<br />
and mental health counsel<strong>in</strong>g. However, this<br />
figure excludes additional expenses <strong>in</strong>curred by<br />
various local entities, such as the police, the<br />
courts, emergency service providers, and hospital<br />
emergency rooms, <strong>in</strong> deal<strong>in</strong>g with homeless<br />
persons. <strong>The</strong>se expenses cannot be precisely<br />
determ<strong>in</strong>ed because they are not rout<strong>in</strong>ely<br />
tracked by homeless coalitions, service providers,<br />
and government agencies.<br />
Florida is do<strong>in</strong>g well on a statewide basis <strong>in</strong><br />
obta<strong>in</strong><strong>in</strong>g dedicated federal fund<strong>in</strong>g for the<br />
homeless; however, some local homeless<br />
cont<strong>in</strong>uums <strong>of</strong> care have not been successful <strong>in</strong><br />
access<strong>in</strong>g dedicated and ma<strong>in</strong>stream federal<br />
fund<strong>in</strong>g for the homeless.<br />
State agencies assist local homeless efforts by<br />
provid<strong>in</strong>g technical assistance, direct services, and<br />
fund<strong>in</strong>g. However, some state agency practices<br />
such as discharge plann<strong>in</strong>g could be improved, and<br />
some adm<strong>in</strong>istrative requirements <strong>of</strong> programs such<br />
as Medicaid, food stamps, and TANF pose barriers<br />
to homeless persons seek<strong>in</strong>g benefits.<br />
Coord<strong>in</strong>ation among local homeless service<br />
providers is occurr<strong>in</strong>g, but could be improved by<br />
gett<strong>in</strong>g more entities to participate <strong>in</strong> local<br />
cont<strong>in</strong>uums <strong>of</strong> care and by local coalitions fully<br />
implement<strong>in</strong>g their computerized <strong>in</strong>formation<br />
systems.<br />
To improve the provision <strong>of</strong> services to homeless<br />
<strong>in</strong> Florida, we recommend that the State Office on<br />
<strong>Homelessness</strong> take the actions described below.<br />
• Expand their assistance to local cont<strong>in</strong>uums <strong>of</strong><br />
care experienc<strong>in</strong>g difficulty receiv<strong>in</strong>g the prorata<br />
amount <strong>of</strong> dedicated federal fund<strong>in</strong>g for<br />
the homeless. <strong>The</strong> <strong>of</strong>fice should help these<br />
cont<strong>in</strong>uums develop plans and proposals that<br />
meet federal grant award criteria and priorities;<br />
• Develop and dissem<strong>in</strong>ate guidel<strong>in</strong>es for<br />
access<strong>in</strong>g and qualify<strong>in</strong>g for ma<strong>in</strong>stream<br />
program benefits. In addition, the Council on<br />
<strong>Homelessness</strong> also should cont<strong>in</strong>ue its efforts<br />
to establish work<strong>in</strong>g agreements with<br />
ma<strong>in</strong>stream program agencies to reduce<br />
barriers to access by homeless <strong>in</strong>dividuals.<br />
• Revise the terms <strong>of</strong> its grants to require subgrantees<br />
(local service providers) to participate<br />
<strong>in</strong> a homeless management <strong>in</strong>formation<br />
system. Such <strong>in</strong>formation systems are expected<br />
to benefit local providers by allow<strong>in</strong>g them to<br />
systematically share <strong>in</strong>formation, <strong>in</strong>tegrate<br />
services, and maximize the use <strong>of</strong> resources.<br />
In addition, we recommend that the Council on<br />
<strong>Homelessness</strong> work with state agencies to<br />
develop discharge plans to help prevent<br />
<strong>in</strong>dividuals transition<strong>in</strong>g out <strong>of</strong> <strong>in</strong>stitutions and<br />
other forms <strong>of</strong> state care from becom<strong>in</strong>g homeless.<br />
Agency Response ________<br />
In accordance with the provisions <strong>of</strong> s. 11.51(6),<br />
Florida Statutes, a draft <strong>of</strong> our report was<br />
submitted to the Secretary <strong>of</strong> the Department <strong>of</strong><br />
Children and Families for review and response.<br />
<strong>The</strong> Secretary’s written response is reproduced <strong>in</strong><br />
its entirety on page 16 (Appendix D).<br />
OPPAGA supports the Florida Legislature by provid<strong>in</strong>g evaluative research and objective analyses to promote government accountability and the efficient<br />
and effective use <strong>of</strong> public resources. This project was conducted <strong>in</strong> accordance with applicable evaluation standards. Copies <strong>of</strong> this report <strong>in</strong> pr<strong>in</strong>t or<br />
alternate accessible format may be obta<strong>in</strong>ed by telephone (850/488-0021 or 800/531-2477), by FAX (850/487-3804), <strong>in</strong> person, or by mail (OPPAGA<br />
Report Production, Claude Pepper Build<strong>in</strong>g, Room 312, 111 W. Madison St., Tallahassee, FL 32399-1475). Cover photo by Mark Foley.<br />
Florida Monitor: www.oppaga.state.fl.us<br />
Project supervised by Larry Novey (850/487-3768)<br />
Project conducted by Michelle Harrison (850/487-9220) and Shunti H. Taylor<br />
Gary R. VanLand<strong>in</strong>gham, OPPAGA Interim Director<br />
7
OPPAGA Report Report No. 05-01<br />
Appendix A<br />
Many Fund<strong>in</strong>g Sources Exist to Assist Homeless<br />
Program<br />
Education for Homeless Children<br />
and Youths - McK<strong>in</strong>ney Act<br />
Elementary and Secondary<br />
Education Act Part A <strong>of</strong> Title I<br />
Homeless Veterans Re<strong>in</strong>tegration<br />
Project - McK<strong>in</strong>ney Act<br />
Veterans Employment Program -<br />
Title IV-C <strong>of</strong> JTPA<br />
Workforce Investment Act (WIA)<br />
Emergency Food & Shelter<br />
Program<br />
State Apartment Incentive Loan<br />
Community Health Centers<br />
Community Services Block Grant<br />
Head Start<br />
Health Care for the Homeless -<br />
McK<strong>in</strong>ney Act<br />
Purpose<br />
Ensures homeless children, <strong>in</strong>clud<strong>in</strong>g<br />
pre-schoolers, equal access to free and<br />
appropriate public education.<br />
Provides before/after school programs,<br />
summer school, preschool, alternative<br />
school programs, home visits, parent<br />
education, and childcare.<br />
Funds projects designed to expedite the<br />
re<strong>in</strong>tegration <strong>of</strong> homeless veterans <strong>in</strong>to<br />
the labor force.<br />
Provides employment and tra<strong>in</strong><strong>in</strong>g<br />
grants.<br />
Increase employment, retention, and<br />
earn<strong>in</strong>g <strong>of</strong> participants.<br />
Provides a broad range <strong>of</strong> food, shelter,<br />
and supportive services.<br />
Provides f<strong>in</strong>ancial assistance to<br />
construct or renovate apartments for<br />
those with very low <strong>in</strong>comes; 8% setaside<br />
specifically targeted for formerly<br />
homeless.<br />
Supports development and operation <strong>of</strong><br />
community health centers <strong>in</strong> medically<br />
underserved areas/populations.<br />
For services and activities to reduce<br />
poverty, <strong>in</strong>cludes employment,<br />
education, hous<strong>in</strong>g assistance, nutrition,<br />
energy, emergency, and health<br />
services.<br />
Provides health, educational, nutritional,<br />
social and other services to preschool<br />
children from low-<strong>in</strong>come families.<br />
Provides primary health care, substance<br />
abuse treatment, case management,<br />
outreach and mental health treatment<br />
Fund<strong>in</strong>g Source<br />
and Level<br />
U.S. Department <strong>of</strong><br />
Education Federal Fiscal<br />
Year FFY04 $2.8 million.<br />
U.S. Department <strong>of</strong><br />
Education State Fiscal<br />
Year (SFY) 2003-04<br />
$523,834,879<br />
U.S. Department <strong>of</strong> Labor<br />
FFY04 $150,000<br />
U.S. Department <strong>of</strong> Labor<br />
FFY04 $8,421,000<br />
U.S. Department <strong>of</strong> Labor<br />
FFY04 $143,371,066<br />
Federal Emergency<br />
Management Agency<br />
FFY04 $7,695,570<br />
Florida Hous<strong>in</strong>g F<strong>in</strong>ance<br />
Corporation SFY03-04<br />
$56,499,140<br />
U.S. Department <strong>of</strong> Health<br />
and Human Services 2003<br />
$51,873,732<br />
U.S. Department <strong>of</strong> Health<br />
and Human Services<br />
FFY04 $18,678,760<br />
U.S. Department <strong>of</strong> Health<br />
and Human Services<br />
FFY04 $262,647,907<br />
U.S. Department <strong>of</strong> Health<br />
and Human Services<br />
Calendar year 03<br />
$5,323,136<br />
Target<br />
Funds<br />
Yes<br />
No<br />
Lead Agency<br />
Florida<br />
Department <strong>of</strong><br />
Education<br />
Florida<br />
Department <strong>of</strong><br />
Education<br />
Allocation<br />
Process<br />
Formula grant<br />
Formula grant<br />
Yes Direct to locals Project grants<br />
(competitive)<br />
No<br />
No<br />
Yes<br />
No<br />
No<br />
No<br />
Agency for<br />
Workforce<br />
Innovation<br />
Agency for<br />
Workforce<br />
Innovation<br />
United Way <strong>of</strong><br />
Florida<br />
Florida Hous<strong>in</strong>g<br />
F<strong>in</strong>ance<br />
Corporation<br />
Florida<br />
Department <strong>of</strong><br />
Health<br />
Florida<br />
Department <strong>of</strong><br />
Community<br />
Affairs<br />
Formula grant<br />
Formula grant<br />
Formula grant<br />
Provides low<br />
<strong>in</strong>terest loans<br />
(competitive)<br />
Project grant<br />
(discretionary)<br />
Formula grant<br />
Eligible Populations<br />
Homeless children and youth, <strong>in</strong>clud<strong>in</strong>g<br />
preschool children.<br />
Educationally deprived homeless children are<br />
eligible.<br />
Homeless veterans.<br />
Veterans who are disabled, from the Vietnam<br />
era, or have applied for service with<strong>in</strong> 12<br />
months <strong>of</strong> military separation.<br />
Youth with education and employment<br />
barriers. Adults with employment barriers,<br />
certa<strong>in</strong> dislocated workers.<br />
Hungry and homeless people and those at<br />
risk <strong>of</strong> becom<strong>in</strong>g homeless.<br />
Very low <strong>in</strong>come <strong>in</strong>dividuals and families.<br />
Residents <strong>of</strong> medically underserved areas.<br />
<strong>The</strong> poor and near-poor.<br />
No Direct to locals Project grant Primarily children ages 3-5 from low-<strong>in</strong>come<br />
families.<br />
Yes Direct to locals Project grants<br />
(discretionary)<br />
Homeless <strong>in</strong>dividuals and families.<br />
8
Report No. 05-01<br />
OPPAGA Report<br />
Program<br />
Maternal and Child Health<br />
Services Block Grant<br />
Medicaid<br />
Projects for Assistance <strong>in</strong><br />
Transition from <strong>Homelessness</strong><br />
(PATH) - McK<strong>in</strong>ney Act<br />
Runaway and Homeless Youth -<br />
Basic Center<br />
Runaway and Homeless Youth -<br />
Education and Prevention Grants<br />
to Reduce Sexual Abuse <strong>of</strong><br />
Runaway, Homeless, and Street<br />
Youth<br />
Runaway and Homeless Youth -<br />
Transitional Liv<strong>in</strong>g for Older<br />
Homeless Youth<br />
Ryan White Care Act Titles I and II<br />
KidCare - State Children's Health<br />
Insurance Program (SCHIP)<br />
Substance Abuse Prevention and<br />
Treatment Block Grant<br />
Temporary Assistance for Needy<br />
Families (TANF)<br />
Purpose<br />
Supports activities to improve the health<br />
status <strong>of</strong> pregnant women, mothers,<br />
<strong>in</strong>fants, and children.<br />
Provides services <strong>in</strong>clud<strong>in</strong>g <strong>in</strong>-and outpatient<br />
hospital services, physician<br />
services, medical and surgical dental<br />
services, and nurs<strong>in</strong>g facility services.<br />
Provides residential treatment and<br />
support services to those with mental<br />
illnesses and co-occurr<strong>in</strong>g substance<br />
abuse, who are homeless or at risk <strong>of</strong><br />
be<strong>in</strong>g homeless.<br />
Provides funds to establish and operate<br />
local centers for runaway or homeless<br />
youth.<br />
Funds street-based education and<br />
outreach, emergency shelter, and<br />
related services for runaway and<br />
homeless youth who have been, or are<br />
at risk <strong>of</strong> be<strong>in</strong>g, sexually exploited and<br />
abused.<br />
Supports residential services (up to 18<br />
mo.) to homeless youth to ensure<br />
successful transition to self-sufficient<br />
liv<strong>in</strong>g.<br />
Provides funds to improve the quality<br />
and availability <strong>of</strong> care for <strong>in</strong>dividuals<br />
and families liv<strong>in</strong>g with HIV/AIDS.<br />
Provides funds to states to enable them<br />
to <strong>in</strong>itiate an expanded child health<br />
assistance to un<strong>in</strong>sured, low-<strong>in</strong>come<br />
children<br />
Provides f<strong>in</strong>ancial assistance to states<br />
for plann<strong>in</strong>g, implement<strong>in</strong>g, and<br />
evaluat<strong>in</strong>g activities to prevent and treat<br />
substance abuse.<br />
Provides fund<strong>in</strong>g for state-designed<br />
programs <strong>of</strong> time-limited and workconditional<br />
aid to families with children.<br />
Fund<strong>in</strong>g Source<br />
and Level<br />
U.S. Department <strong>of</strong> Health<br />
and Human Services<br />
FFY04 $20,994,684<br />
State General Revenue &<br />
trust funds $5,222,630,155<br />
U.S. Department <strong>of</strong> Health<br />
and Human Services<br />
$7,738,461,947 SFY03-04<br />
TOTAL $12,961,092,102<br />
U.S. Department <strong>of</strong> Health<br />
and Human Services<br />
FFY04 $2,566,000<br />
U.S. Department <strong>of</strong> Health<br />
and Human Services<br />
FFY04 $2,363,285<br />
U.S. Department <strong>of</strong> Health<br />
and Human Services<br />
FFY04 $490,000<br />
U.S. Department <strong>of</strong> Health<br />
and Human Services<br />
FFY04 $1,609,519<br />
U.S. Department <strong>of</strong> Health<br />
and Human Services<br />
FFY04 $112,196,959<br />
Agency for Health Care<br />
Adm<strong>in</strong>istration<br />
$143,062,333 U.S.<br />
Department <strong>of</strong> Health and<br />
Human Services<br />
$354,242,918 SFY03-04<br />
TOTAL $497,305,251<br />
U.S. Department <strong>of</strong> Health<br />
and Human Services<br />
SFY03-04 $95,483,056<br />
U.S. Department <strong>of</strong> Health<br />
and Human Services<br />
SFY03-04 $223,343,035<br />
Target<br />
Funds<br />
No<br />
No<br />
Yes<br />
Lead Agency<br />
Florida<br />
Department <strong>of</strong><br />
Health<br />
Agency for Health<br />
Care<br />
Adm<strong>in</strong>istration<br />
Florida<br />
Department <strong>of</strong><br />
Children and<br />
Families<br />
Allocation<br />
Process<br />
Formula grant<br />
Entitlement<br />
Formula grant<br />
Yes Direct to locals Project grants<br />
(discretionary)<br />
Yes Direct to locals Project grants<br />
(discretionary)<br />
Yes Direct to locals Project grants<br />
(discretionary)<br />
No<br />
No<br />
No<br />
No<br />
Title I - direct to<br />
locals. Title II –<br />
Florida<br />
Department <strong>of</strong><br />
Health<br />
Agency for Health<br />
Care<br />
Adm<strong>in</strong>istration<br />
Florida<br />
Department <strong>of</strong><br />
Children and<br />
Families<br />
Florida<br />
Department <strong>of</strong><br />
Children and<br />
Families<br />
Formula and<br />
project grants<br />
(discretionary)<br />
Formula grant<br />
Formula grant<br />
Block grant<br />
Eligible Populations<br />
Pregnant women, mothers, <strong>in</strong>fants and<br />
children, and children with special health care<br />
needs.<br />
Low-<strong>in</strong>come persons over age 65, bl<strong>in</strong>d, or<br />
disabled; low-<strong>in</strong>come children and pregnant<br />
women.<br />
Persons with mental illness, <strong>in</strong>clud<strong>in</strong>g those<br />
with substance abuse disorders, who are<br />
homeless or at risk <strong>of</strong> becom<strong>in</strong>g homeless.<br />
Runaway and homeless youth and their<br />
families are eligible for benefits.<br />
Adolescents up to the age <strong>of</strong> 24 who are<br />
liv<strong>in</strong>g on the streets.<br />
Homeless youth aged 16 to 21.<br />
Low-<strong>in</strong>come, un<strong>in</strong>sured, and under<strong>in</strong>sured<br />
HIV <strong>in</strong>fected <strong>in</strong>dividuals and their families.<br />
Low <strong>in</strong>come children and children who are<br />
not eligible for medical assistance under<br />
Medicaid or are not covered under a group<br />
health or other health <strong>in</strong>surance plan.<br />
All <strong>in</strong>dividuals suffer<strong>in</strong>g from alcohol and<br />
other drug abuse.<br />
Needy families with children.<br />
9
OPPAGA Report Report No. 05-01<br />
Program<br />
Community Development Block<br />
Grant (CDBG)<br />
Emergency Shelter Grant -<br />
McK<strong>in</strong>ney Act<br />
Home Investment Partnerships<br />
Program (HOME)<br />
Hous<strong>in</strong>g Opportunities for Persons<br />
with AIDS (HOPWA)<br />
Section 8 Project-Based Rental<br />
Assistance (Public and Indian<br />
Hous<strong>in</strong>g)<br />
Section 8 Rental Voucher Program<br />
(Public and Indian Hous<strong>in</strong>g)<br />
Section 8 S<strong>in</strong>gle Room Occupancy<br />
Moderate Rehabilitation -<br />
McK<strong>in</strong>ney Act<br />
Shelter Plus Care Program -<br />
McK<strong>in</strong>ney Act<br />
Supportive Hous<strong>in</strong>g Program -<br />
McK<strong>in</strong>ney Act<br />
Purpose<br />
Assists urban communities to provide<br />
decent hous<strong>in</strong>g, a suitable liv<strong>in</strong>g<br />
environment and expanded economic<br />
opportunities.<br />
Provides for shelter bedspace and<br />
supportive services for homeless.<br />
For acquisition, reconstruction,<br />
rehabilitation, and new construction <strong>of</strong><br />
affordable rental and ownership units.<br />
Provides for long-term comprehensive<br />
strategies to meet hous<strong>in</strong>g needs <strong>of</strong><br />
persons with AIDS or related diseases<br />
and their families.<br />
Pays a portion (generally 70%) <strong>of</strong><br />
residents' rent for hous<strong>in</strong>g owned by<br />
private landlords, public hous<strong>in</strong>g<br />
authorities, and state hous<strong>in</strong>g f<strong>in</strong>ance<br />
agencies.<br />
Voucher subsidy that aids families with<br />
very low <strong>in</strong>comes to obta<strong>in</strong> decent, safe,<br />
and sanitary rental hous<strong>in</strong>g.<br />
Rental assistance for homeless persons<br />
liv<strong>in</strong>g <strong>in</strong> s<strong>in</strong>gle-room occupancy units.<br />
Funds the moderate rehabilitation <strong>of</strong><br />
residential properties that will conta<strong>in</strong><br />
multiple s<strong>in</strong>gle-room dwell<strong>in</strong>g units.<br />
Provides rental assistance for homeless<br />
persons with disabilities (supportive<br />
services provided by other sources).<br />
Provides for short-term transitional and<br />
permanent hous<strong>in</strong>g with support<br />
services for homeless persons.<br />
Fund<strong>in</strong>g Source<br />
and Level<br />
U.S. Department <strong>of</strong><br />
Hous<strong>in</strong>g and Urban<br />
Development FFY04<br />
$189,116,184<br />
U.S. Department <strong>of</strong><br />
Hous<strong>in</strong>g and Urban<br />
Development FY04<br />
$6,977,570<br />
U.S. Department <strong>of</strong><br />
Hous<strong>in</strong>g and Urban<br />
Development FFY04<br />
$84,125,727<br />
U.S. Department <strong>of</strong><br />
Hous<strong>in</strong>g and Urban<br />
Development FFY04<br />
$32,393,000<br />
U.S. Department <strong>of</strong><br />
Hous<strong>in</strong>g and Urban<br />
Development<br />
FFY04 $62,878,287<br />
U.S. Department <strong>of</strong><br />
Hous<strong>in</strong>g and Urban<br />
Development FFY04<br />
$695,181,036<br />
U.S. Department <strong>of</strong><br />
Hous<strong>in</strong>g and Urban<br />
Development FFY03<br />
$470,400<br />
U.S. Department <strong>of</strong><br />
Hous<strong>in</strong>g and Urban<br />
Development FFY03<br />
$9,066,338<br />
U.S. Department <strong>of</strong><br />
Hous<strong>in</strong>g and Urban<br />
Development FFY03<br />
$41,859,544<br />
Target<br />
Funds<br />
No<br />
Yes<br />
No<br />
No<br />
No<br />
No<br />
Lead Agency<br />
Florida<br />
Department <strong>of</strong><br />
Community<br />
Affairs and<br />
direct to locals<br />
Florida<br />
Department <strong>of</strong><br />
Children and<br />
Families<br />
Florida Hous<strong>in</strong>g<br />
F<strong>in</strong>ance<br />
Corporation and<br />
direct to locals<br />
U.S. Department<br />
<strong>of</strong> Hous<strong>in</strong>g and<br />
Urban<br />
Development and<br />
Florida<br />
Department <strong>of</strong><br />
Health<br />
Local hous<strong>in</strong>g<br />
authorities<br />
Local hous<strong>in</strong>g<br />
authorities<br />
Allocation<br />
Process<br />
Formula and<br />
project grants<br />
(competitive)<br />
Formula grant<br />
Formula grant<br />
Formula and<br />
project<br />
(competitive)<br />
Payment contract<br />
with a private<br />
landlord or an<br />
annual contract<br />
with a hous<strong>in</strong>g<br />
f<strong>in</strong>ance agency or<br />
a public hous<strong>in</strong>g<br />
authority.<br />
Paid directly to<br />
hous<strong>in</strong>g<br />
authorities<br />
Yes Direct to locals Project grants<br />
(competitive)<br />
Yes Direct to locals Project grant<br />
(competitive)<br />
Yes Direct to locals Project grant<br />
(competitive)<br />
Eligible Populations<br />
Persons with low and moderate <strong>in</strong>comes.<br />
Homeless <strong>in</strong>dividuals and families.<br />
Individuals and families with low and very low<br />
<strong>in</strong>comes.<br />
Low-<strong>in</strong>come <strong>in</strong>dividuals with HIV or AIDS and<br />
their families.<br />
Individuals and families with very low<br />
<strong>in</strong>comes.<br />
Families with very low <strong>in</strong>comes.<br />
Homeless s<strong>in</strong>gle <strong>in</strong>dividuals.<br />
Homeless persons with disabilities <strong>in</strong>clud<strong>in</strong>g<br />
serious mental illness, AIDS, chronic drugs<br />
and/or alcohol problems; and if also<br />
homeless, their families.<br />
Homeless <strong>in</strong>dividuals and families with<br />
children eligible for all but the permanent<br />
hous<strong>in</strong>g for persons with disabilities.<br />
Homeless persons with disabilities eligible for<br />
all components.<br />
10
Report No. 05-01<br />
OPPAGA Report<br />
Program<br />
Supplemental Security Income<br />
(SSI)<br />
Child and Adult Care Food<br />
Program (<strong>in</strong>cludes Child Care<br />
Centers, Family Day Care Homes,<br />
After School Snack Program for<br />
Children)<br />
Emergency Food Assistance<br />
Program<br />
Food Stamps<br />
Homeless Children Nutrition<br />
Program<br />
National School Lunch Program<br />
School Breakfast Program<br />
Special Supplemental Nutrition<br />
Program for Women, Infants, and<br />
Children (WIC)<br />
Summer Food Service Program<br />
Domiciliary Care for Homeless<br />
Veterans<br />
Purpose<br />
Provides monthly payments to elderly,<br />
bl<strong>in</strong>d, or disabled <strong>in</strong>dividuals with low<br />
<strong>in</strong>comes and few resources.<br />
Provides meals and snacks to children<br />
and adults <strong>in</strong> nonresidential day care<br />
facilities<br />
Provides free, healthful foods. Provides<br />
states with commodity foods and funds<br />
to help cover costs <strong>of</strong> transport<strong>in</strong>g,<br />
process<strong>in</strong>g, stor<strong>in</strong>g, and distribut<strong>in</strong>g the<br />
commodities.<br />
Provides f<strong>in</strong>ancial assistance for people<br />
to buy food and improve their diets.<br />
Homeless persons may purchase<br />
prepared meals from authorized<br />
providers.<br />
Provides meals to homeless children<br />
under age 6 <strong>in</strong> emergency shelters.<br />
Assists the states, through cash grants<br />
and food donations, <strong>in</strong> mak<strong>in</strong>g the<br />
school lunch program available to<br />
school students.<br />
Provides the states with cash<br />
assistance for nonpr<strong>of</strong>it breakfast<br />
programs.<br />
Provides supplemental nutritious foods,<br />
nutrition education, and health care<br />
referrals.<br />
Provides funds for program sponsors to<br />
serve free, nutritious meals to children<br />
<strong>in</strong> low-<strong>in</strong>come areas when school is not<br />
<strong>in</strong> session.<br />
Provides health and social services to<br />
homeless veterans <strong>in</strong> a domiciliary<br />
sett<strong>in</strong>g.<br />
Fund<strong>in</strong>g Source<br />
and Level<br />
Social Security<br />
Adm<strong>in</strong>istration Calendar<br />
year 02 $1,814,408<br />
U.S. Department <strong>of</strong><br />
Agriculture SFY03-04<br />
$98,573,266<br />
U.S. Department <strong>of</strong><br />
Agriculture FFY04<br />
$6,839,663 <strong>in</strong><br />
commodities.<br />
U.S. Department <strong>of</strong><br />
Agriculture SFY03-04<br />
$917,836,348<br />
U.S. Department <strong>of</strong><br />
Agriculture SFY03-04<br />
$501,212<br />
U.S. Department <strong>of</strong><br />
Agriculture FFY03<br />
$403,403,045 <strong>in</strong> fund<strong>in</strong>g<br />
and commodities<br />
U.S. Department <strong>of</strong><br />
Agriculture FFY03<br />
$99,284,968<br />
U.S. Department <strong>of</strong><br />
Agriculture FFY04<br />
$232,902,249<br />
U.S. Department <strong>of</strong><br />
Agriculture FFY03<br />
$14,038,782 <strong>in</strong> fund<strong>in</strong>g<br />
and commodities<br />
U.S. Department <strong>of</strong><br />
Veterans Affairs FFY03<br />
$1,284,175<br />
Target<br />
Funds<br />
No<br />
No<br />
No<br />
No<br />
Yes<br />
No<br />
No<br />
No<br />
No<br />
Yes<br />
Lead Agency<br />
Direct to<br />
recipients<br />
Florida<br />
Department <strong>of</strong><br />
Health – children;<br />
Florida<br />
Department <strong>of</strong><br />
Elder Affairs -<br />
adults<br />
Florida<br />
Department <strong>of</strong><br />
Agriculture and<br />
Consumer<br />
Services<br />
Florida<br />
Department <strong>of</strong><br />
Children and<br />
Families<br />
Florida<br />
Department <strong>of</strong><br />
Health<br />
Florida<br />
Department <strong>of</strong><br />
Education<br />
Florida<br />
Department <strong>of</strong><br />
Education<br />
Florida<br />
Department <strong>of</strong><br />
Health<br />
Florida<br />
Department <strong>of</strong><br />
Agriculture and<br />
Consumer<br />
Services<br />
U.S. Department<br />
<strong>of</strong> Veterans<br />
Affairs - Medical<br />
Centers<br />
Allocation<br />
Process<br />
Entitlement<br />
Entitlement<br />
Formula grant<br />
Entitlement<br />
Formula grant<br />
Eligible Populations<br />
Individuals who are; aged 65 or older; bl<strong>in</strong>d;<br />
disabled and meet monthly <strong>in</strong>come and<br />
resources limit requirements.<br />
Children up to age 12, migrant children up to<br />
age 15, certa<strong>in</strong> children with disabilities over<br />
age 12, functionally impaired adults and<br />
adults aged 60 or older who are not residents<br />
<strong>of</strong> an <strong>in</strong>stitution.<br />
Needy persons who meet the eligibility<br />
criteria established by the state.<br />
Low <strong>in</strong>come families and <strong>in</strong>dividuals.<br />
Children under 6 years <strong>of</strong> age who are <strong>in</strong><br />
emergency shelters.<br />
Entitlement All children enrolled <strong>in</strong> schools where the<br />
program is operat<strong>in</strong>g. Free to children at or<br />
below 130% <strong>of</strong> poverty level, reduced price<br />
(max. 40 cents) to children between 130%<br />
and 185% <strong>of</strong> poverty level.<br />
Entitlement All children enrolled <strong>in</strong> schools where the<br />
program is operat<strong>in</strong>g. Free to children at or<br />
below 130% <strong>of</strong> poverty level, reduced price<br />
(max. 30 cents) to children between 130%<br />
and 185% <strong>of</strong> poverty level.<br />
Formula grant Low-<strong>in</strong>come pregnant, postpartum, and<br />
breastfeed<strong>in</strong>g women; <strong>in</strong>fants; and children<br />
up to the age <strong>of</strong> 5 determ<strong>in</strong>ed to be at<br />
nutritional risk.<br />
Entitlement Children aged 18 or younger. Operat<strong>in</strong>g site<br />
must be <strong>in</strong> eligible area (50% <strong>of</strong> children at or<br />
below 185% <strong>of</strong> poverty level); or 50% <strong>of</strong><br />
participat<strong>in</strong>g children are eligible for free or<br />
reduced school lunch.<br />
Direct payments<br />
to VA medical<br />
centers<br />
Veterans who are homeless or at risk <strong>of</strong><br />
becom<strong>in</strong>g homeless and have a cl<strong>in</strong>ical need<br />
for VA-based biopsychosocial residential<br />
rehabilitation services.<br />
11
OPPAGA Report Report No. 05-01<br />
Program<br />
Homeless Chronically Mental III<br />
Veterans Program<br />
Purpose<br />
Provides care, treatment, and<br />
rehabilitative services to homeless<br />
veterans suffer<strong>in</strong>g from chronic mental<br />
illness.<br />
HUD-VASH (Supported Hous<strong>in</strong>g) HUD partnership, VA provides<br />
permanent hous<strong>in</strong>g and ongo<strong>in</strong>g<br />
treatment to eligible veterans.<br />
Homeless Women's Veterans<br />
Program<br />
Loan Guarantee for Homeless<br />
Vets Multi-family Hous<strong>in</strong>g<br />
VA Homeless Providers Grant and<br />
Per Diem Program<br />
Veterans Industries/ Compensated<br />
Work <strong>The</strong>rapy/ Transitional<br />
Employment<br />
Challenge Grant<br />
Emergency F<strong>in</strong>ancial Assistance<br />
for Hous<strong>in</strong>g<br />
Homeless Grant-<strong>in</strong>-Aid Program<br />
Homeless Hous<strong>in</strong>g Assistance<br />
Grant<br />
Local Homeless Coalition Grant<br />
(Staff<strong>in</strong>g Grant)<br />
Provides outreach and social services to<br />
homeless and potentially homeless<br />
women veterans.<br />
Authorizes VA to guarantee loans for<br />
construction or rehabilitation <strong>of</strong><br />
multifamily/rental transitional hous<strong>in</strong>g for<br />
homeless veterans.<br />
Funds new programs and service<br />
centers to furnish supportive services<br />
and supportive hous<strong>in</strong>g for homeless<br />
veterans.<br />
Offers structured work opportunities and<br />
supervised therapeutic hous<strong>in</strong>g.<br />
Funds the lead agency <strong>of</strong> local<br />
homeless cont<strong>in</strong>uum <strong>of</strong> care systems to<br />
implement that system <strong>of</strong> assistance to<br />
the homeless<br />
Provides a one time payment up to<br />
$400 to homeless families, or those at<br />
immediate risk <strong>of</strong> homelessness, to<br />
cover rent or mortgage payments to<br />
prevent homelessness.<br />
Direct service to homeless clients,<br />
<strong>in</strong>cludes education and outreach,<br />
eviction prevention assistance, meals,<br />
supportive services.<br />
Funds the construction or rehabilitation<br />
<strong>of</strong> transitional and permanent hous<strong>in</strong>g<br />
for homeless people<br />
Helps to fund staff capacity <strong>in</strong> each <strong>of</strong><br />
Florida’s local homeless coalitions.<br />
Fund<strong>in</strong>g Source<br />
and Level<br />
U.S. Department <strong>of</strong><br />
Veterans Affairs FFY03<br />
$2,337,605<br />
U.S. Department <strong>of</strong><br />
Veterans Affairs FFY03<br />
$306,007<br />
U.S. Department <strong>of</strong><br />
Veterans Affairs FFY03<br />
$219,083<br />
U.S. Department <strong>of</strong><br />
Veterans Affairs Pend<strong>in</strong>g<br />
project <strong>in</strong> Miami<br />
U.S. Department <strong>of</strong><br />
Veterans Affairs FFY03<br />
$1,574,316<br />
U.S. Department <strong>of</strong><br />
Veterans Affairs FFY03<br />
$123,827<br />
State Florida Hous<strong>in</strong>g<br />
Trust Fund SFY03-04<br />
$1,648,525<br />
State Florida Hous<strong>in</strong>g<br />
Trust Fund $900,000<br />
Federal TANF $900,000<br />
SFY03-04 TOTAL $1.8<br />
million<br />
State General Revenue<br />
SFY03-04 $665,938<br />
State Florida Hous<strong>in</strong>g<br />
Trust Fund SFY03-04<br />
$4,438,776<br />
State General Revenue<br />
SFY03-04 $343,750<br />
Target<br />
Funds<br />
Yes<br />
Yes<br />
Yes<br />
No<br />
Lead Agency<br />
U.S. Department<br />
<strong>of</strong> Veterans<br />
Affairs - Medical<br />
Centers<br />
U.S. Department<br />
<strong>of</strong> Veterans<br />
Affairs<br />
U.S. Department<br />
<strong>of</strong> Veterans<br />
Affairs<br />
U.S. Department<br />
<strong>of</strong> Veterans<br />
Affairs - Medical<br />
Centers<br />
Allocation<br />
Process<br />
Direct services<br />
and contract<br />
awards<br />
Direct to U.S.<br />
Department <strong>of</strong><br />
Veterans Affairs<br />
Medical Centers<br />
Direct to U.S.<br />
Department <strong>of</strong><br />
Veterans Affairs<br />
Medical Centers<br />
Competitive<br />
application<br />
process / formula<br />
Yes Direct to locals Project grant<br />
(competitive)<br />
No<br />
Yes<br />
Yes<br />
Yes<br />
Yes<br />
Yes<br />
U.S. Department<br />
<strong>of</strong> Veterans<br />
Affairs<br />
Florida<br />
Department <strong>of</strong><br />
Children and<br />
Families<br />
Florida<br />
Department <strong>of</strong><br />
Children and<br />
Families<br />
Florida<br />
Department <strong>of</strong><br />
Children and<br />
Families<br />
Florida<br />
Department <strong>of</strong><br />
Children and<br />
Families<br />
Florida<br />
Department <strong>of</strong><br />
Children and<br />
Families<br />
Direct to U.S.<br />
Department <strong>of</strong><br />
Veterans Affairs<br />
Medical Centers<br />
Competitive<br />
application<br />
process<br />
Apply at DCF<br />
field <strong>of</strong>fices.<br />
Funds allocated<br />
by the date <strong>of</strong> the<br />
applications<br />
received.<br />
Formula grant by<br />
district; allocated<br />
by DCF district<br />
adm<strong>in</strong>istrator.<br />
Competitive<br />
application<br />
process<br />
Direct allocation<br />
to each<br />
recognized<br />
coalition<br />
Eligible Populations<br />
Homeless veterans with substance abuse<br />
and/or chronic mental health problems.<br />
Homeless veterans with mental illness and<br />
substance abuse disorders.<br />
Homeless women veterans.<br />
Fund<strong>in</strong>g may be used to support projects<br />
serv<strong>in</strong>g homeless veterans and persons who<br />
are not veterans.<br />
Veterans who were discharged or released<br />
under conditions other than dishonorable.<br />
At-risk and homeless veterans with physical,<br />
psychiatric and substance abuse disorders<br />
Homeless <strong>in</strong>dividuals and families.<br />
Families with dependent children, at or below<br />
200% <strong>of</strong> federal poverty rate, and who are<br />
homeless or face the threat <strong>of</strong> homelessness.<br />
Homeless <strong>in</strong>dividuals and families.<br />
Homeless <strong>in</strong>dividuals and families.<br />
Homeless <strong>in</strong>dividuals and families.<br />
Source: OPPAGA analysis.<br />
12
Report No. 05-01<br />
OPPAGA Report<br />
Appendix B<br />
Most Florida Counties Are Covered By a<br />
Cont<strong>in</strong>uum <strong>of</strong> Care<br />
Escambia<br />
Santa Rosa<br />
Okaloosa<br />
Walton<br />
Holmes<br />
Wash<strong>in</strong>gton<br />
Bay<br />
Northeast Zone -- Districts 3, 4, 12<br />
Suwannee Valley - Columbia, Hamilton, Lafayette, and Suwannee counties<br />
North Central Florida Cont<strong>in</strong>uum <strong>of</strong> Care - Alachua, Levy, and Putnam counties<br />
Emergency Services & Homeless Coalition <strong>of</strong> Jacksonville - Duval and Clay counties<br />
Emergency Services & Homeless Coalition <strong>of</strong> St. Johns County, Inc. - St. Johns County<br />
Volusia/Flagler County Coalition for the Homeless - Volusia and Flagler counties<br />
Jackson<br />
Nassau<br />
Gadsden<br />
Jefferson<br />
Calhoun<br />
Leon<br />
Madison<br />
Hamilton<br />
Duval<br />
Baker<br />
Liberty<br />
Wakulla<br />
Suwannee<br />
Columbia<br />
Taylor<br />
Clay<br />
St. Johns<br />
Gulf<br />
Frankl<strong>in</strong><br />
Lafayette<br />
Union<br />
Bradford<br />
Panhandle Zone -- Districts 1 & 2<br />
Escarosa Coalition on the Homeless – Escambia and Santa Rosa counties<br />
Okaloosa/Walton Coalition for the Homeless – Okaloosa and Walton counties<br />
Homeless & Hunger Coalition <strong>of</strong> N.W. Florida, Inc. - Bay, Calhoun, Gulf, Holmes,<br />
Jackson, and Wash<strong>in</strong>gton counties<br />
Tallahassee Coalition for the Homeless - Frankl<strong>in</strong>, Gadsden, Jefferson, Leon, Liberty,<br />
Madison, Taylor, and Wakulla counties<br />
Dixie<br />
Gilchrist<br />
Levy<br />
Alachua<br />
Marion<br />
Citrus<br />
Sumter<br />
Putnam<br />
Lake<br />
Flagler<br />
Volusia<br />
Sem<strong>in</strong>ole<br />
Central Zone -- Districts 7, 13, 14<br />
Brevard County Department <strong>of</strong> Hous<strong>in</strong>g and Human Services –Brevard County<br />
Homeless Services Network <strong>of</strong> Central Florida - Orange, Osceola, and Sem<strong>in</strong>ole counties<br />
United Way <strong>of</strong> Marion County - Marion County<br />
Mid-Florida Homeless Coalition - Citrus, Hernando, Lake, and Sumter counties<br />
Homeless Coalition <strong>of</strong> Polk County, Inc. - Polk County<br />
Florida Heartland Rural Consortia - DeSoto, Glades, Hardee, Hendry, Highlands, and<br />
Okeechobee counties<br />
Suncoast Zone<br />
Coalition for the Homeless <strong>of</strong> Pasco County - Pasco County<br />
P<strong>in</strong>ellas County Coalition for the Homeless - P<strong>in</strong>ellas County<br />
Homeless Coalition <strong>of</strong> Hillsborough County – Hillsborough County<br />
Sarasota/Manatee Cont<strong>in</strong>uum <strong>of</strong> Care - Manatee and Sarasota counties<br />
P<strong>in</strong>ellas<br />
Hernando<br />
Pasco<br />
Hillsborough<br />
Manatee<br />
Sarasota<br />
Polk<br />
Hardee<br />
DeSoto<br />
Charlotte<br />
Lee<br />
Orange<br />
Brevard<br />
Osceola<br />
Indian River<br />
Okeechobee<br />
St. Lucie<br />
Highlands<br />
Mart<strong>in</strong><br />
Lake<br />
Okeechobee<br />
Glades<br />
Palm Beach<br />
Hendry<br />
South Zone -- Districts 8, 9, 10, 15<br />
Charlotte County Homeless Coalition - Charlotte County<br />
Collier County Department <strong>of</strong> F<strong>in</strong>ancial Adm<strong>in</strong>istration & Hous<strong>in</strong>g - Collier County<br />
Lee County Department <strong>of</strong> Human Services - Lee County<br />
Homeless Coalition <strong>of</strong> Palm Beach County, Inc. - Palm Beach County<br />
Broward County Homeless Initiative Partnership Adm<strong>in</strong>istration - Broward County<br />
Treasure Coast Homeless Services Council, Inc. - Indian River, Mart<strong>in</strong>, and St. Lucie counties<br />
Collier<br />
Monroe<br />
Broward<br />
Dade<br />
Miami Zone -- District 11<br />
Miami-Dade County Homeless Trust - Miami-Dade County<br />
Southernmost Homeless Assistance League - Monroe County<br />
Source: Office on <strong>Homelessness</strong>.<br />
13
OPPAGA Report Report No. 05-01<br />
Appendix C<br />
State Agency Activities to Assist the Homeless<br />
State agencies perform a variety <strong>of</strong> functions that benefit the homeless, <strong>in</strong>clud<strong>in</strong>g provid<strong>in</strong>g direct<br />
services to homeless <strong>in</strong>dividuals and technical assistance and fund<strong>in</strong>g to local coalitions. <strong>The</strong> table<br />
below lists the services that assist the homeless provided by n<strong>in</strong>e state agencies.<br />
Agency<br />
Agency for Health Care Adm<strong>in</strong>istration<br />
Children and Families<br />
Community Affairs<br />
Education<br />
Environmental Protection<br />
Florida Hous<strong>in</strong>g F<strong>in</strong>ance Corporation<br />
Type <strong>of</strong> Assistance<br />
• Provides Medicaid services for homeless adults who are elderly or<br />
disabled. Children and Families determ<strong>in</strong>es eligibility.<br />
• Provides hospitals with Medicaid disproportionate share money used to<br />
compensate them for services they render to low-<strong>in</strong>come patients,<br />
<strong>in</strong>clud<strong>in</strong>g people who are homeless.<br />
• Provides Medicaid providers an appropriation for services they render to<br />
eligible Medicaid recipients.<br />
• Adm<strong>in</strong>isters state and federal grant programs to assist homeless<br />
coalitions, homeless service providers and people who are homeless or at<br />
risk <strong>of</strong> becom<strong>in</strong>g homeless.<br />
• Determ<strong>in</strong>es Medicaid eligibility for homeless families or s<strong>in</strong>gle adults who<br />
are disabled or elderly.<br />
• Determ<strong>in</strong>es Food Stamp Program eligibility for homeless families or s<strong>in</strong>gle<br />
adults.<br />
• Provides mental health treatment beds.<br />
• Adm<strong>in</strong>isters Projects for Assistance <strong>in</strong> Transition from <strong>Homelessness</strong><br />
(PATH) for persons who have been diagnosed with both mental illness and<br />
substance abuse problems. Provides hous<strong>in</strong>g assistance and outreach for<br />
substance abuse treatment.<br />
• Provides medical and cash assistance to refugees, <strong>in</strong>clud<strong>in</strong>g refugees who<br />
are homeless.<br />
• Provides services and temporary shelter to victims <strong>of</strong> domestic violence.<br />
• Adm<strong>in</strong>isters the federal Community Services Block Grant Program that<br />
assists low-<strong>in</strong>come households by provid<strong>in</strong>g such services as job tra<strong>in</strong><strong>in</strong>g,<br />
education, employment assistance. <strong>The</strong> program also provides temporary<br />
assistance with emergency needs such as rent, utilities, transportation,<br />
food, cloth<strong>in</strong>g, and prescription drugs.<br />
• Develop and adopt the State <strong>of</strong> Florida Consolidated Plan, which is a<br />
federally required document that outl<strong>in</strong>es the state’s plans and efforts <strong>in</strong><br />
hous<strong>in</strong>g and community development.<br />
• Adm<strong>in</strong>isters federal grant programs to assist school districts <strong>in</strong> serv<strong>in</strong>g<br />
homeless children.<br />
• Adm<strong>in</strong>isters a water supply restoration program provid<strong>in</strong>g short-term and<br />
long-term safe dr<strong>in</strong>k<strong>in</strong>g water supplies <strong>in</strong> the areas where there is a public<br />
health threat.<br />
• Adm<strong>in</strong>isters federal revolv<strong>in</strong>g loan programs that provide low <strong>in</strong>terest loans<br />
to small communities for wastewater and dr<strong>in</strong>k<strong>in</strong>g water <strong>in</strong>frastructure<br />
construction.<br />
• Adm<strong>in</strong>isters grants to disadvantaged small community water and<br />
wastewater systems.<br />
• Provides affordable hous<strong>in</strong>g tra<strong>in</strong><strong>in</strong>g and technical assistance to homeless<br />
providers.<br />
• Provides grants and low <strong>in</strong>terest loans to develop affordable rental and<br />
ownership units.<br />
14
Report No. 05-01<br />
OPPAGA Report<br />
Agency<br />
Health<br />
Transportation Disadvantaged<br />
Commission<br />
Type <strong>of</strong> Assistance<br />
• Adm<strong>in</strong>isters the federal Hous<strong>in</strong>g Opportunities for Persons with AIDS<br />
(HOPWA) Program that provides f<strong>in</strong>ancial assistance and services (i.e.,<br />
transitional hous<strong>in</strong>g, assistance with rent, mortgage, and utilities, and case<br />
management) for persons with HIV disease and AIDS.<br />
• Provides specialized services for people who are homeless and have<br />
tuberculosis.<br />
• Provides sexually transmitted disease screen<strong>in</strong>g and education for people<br />
liv<strong>in</strong>g <strong>in</strong> homeless shelters.<br />
• Provides HIV test<strong>in</strong>g and prevention counsel<strong>in</strong>g.<br />
• Adm<strong>in</strong>isters the federal Special Supplemental Nutrition Program for<br />
Women, Infants and Children (WIC) that assists pregnant and<br />
breastfeed<strong>in</strong>g women, new mothers, <strong>in</strong>fants, and children up to the age <strong>of</strong><br />
five who have a low or moderate <strong>in</strong>come, are at nutrition risk, and who live<br />
<strong>in</strong> Florida. This may <strong>in</strong>clude homeless women and children. WIC provides<br />
healthy foods, nutrition education and counsel<strong>in</strong>g, breastfeed<strong>in</strong>g support,<br />
and referrals for health care at no cost to eligible persons.<br />
• Adm<strong>in</strong>isters the Healthy Start <strong>in</strong>itiative that provides for universal risk<br />
screen<strong>in</strong>g <strong>of</strong> all Florida's pregnant women and newborn <strong>in</strong>fants to identify<br />
those at risk <strong>of</strong> poor birth, health and developmental outcomes. Children<br />
and Families determ<strong>in</strong>es eligibility.<br />
• Assists homeless families by expla<strong>in</strong><strong>in</strong>g the application and eligibility<br />
process for the Florida KidCare program that provides health <strong>in</strong>surance for<br />
children from birth through age 18 who do not have <strong>in</strong>surance. Children<br />
and Families determ<strong>in</strong>es eligibility.<br />
• Adm<strong>in</strong>isters the Homeless Children Nutrition Program provides cash<br />
reimbursement for certa<strong>in</strong> meals and snacks served to children liv<strong>in</strong>g <strong>in</strong><br />
temporary residential sett<strong>in</strong>gs.<br />
• Provides transportation services to people whose physical or mental<br />
disability, <strong>in</strong>come status, or age makes them unable to transport<br />
themselves or to purchase transportation.<br />
Workforce Innovation<br />
• Provides services to job seekers through the One-Stop delivery system,<br />
<strong>in</strong>clud<strong>in</strong>g job tra<strong>in</strong><strong>in</strong>g, education, and employment options and <strong>in</strong>tegrates<br />
several services provided by co-located agencies, such as the Welfare-to-<br />
Work, TANF, and Food Stamp programs.<br />
Source: Governor’s Commission on the Homeless F<strong>in</strong>al Report for 2001 and OPPAGA analysis.<br />
15
OPPAGA Report Report No. 05-01<br />
Appendix D<br />
Jeb Bush<br />
Governor<br />
Lucy D. Hadi<br />
Secretary<br />
December 30, 2004<br />
Mr. Gary VanLand<strong>in</strong>gham<br />
Interim Director<br />
Office <strong>of</strong> Program Policy Analysis and<br />
Government Accountability<br />
111 West Madison Street, Room 312<br />
Tallahassee, Florida 32399-1475<br />
Dear Mr. VanLand<strong>in</strong>gham:<br />
<strong>The</strong> department has reviewed the prelim<strong>in</strong>ary f<strong>in</strong>d<strong>in</strong>gs and conclusions <strong>in</strong> your report<br />
on the <strong>Economic</strong> Impact <strong>of</strong> <strong>Homelessness</strong>. <strong>The</strong> department concurs with the f<strong>in</strong>d<strong>in</strong>gs<br />
and conclusions, <strong>in</strong>clud<strong>in</strong>g the recommendations to improve services to the homeless<br />
by state and local entities.<br />
<strong>The</strong> Office on <strong>Homelessness</strong> will cont<strong>in</strong>ue to provide technical assistance to local<br />
cont<strong>in</strong>uums <strong>of</strong> care by encourag<strong>in</strong>g them to apply for HUD fund<strong>in</strong>g and assist<strong>in</strong>g<br />
them <strong>in</strong> meet<strong>in</strong>g the necessary criteria for acquir<strong>in</strong>g federal grant awards. Our <strong>of</strong>fice<br />
will also cont<strong>in</strong>ue our efforts to help homeless <strong>in</strong>dividuals acquire assistance from<br />
ma<strong>in</strong>stream programs. Workshops to address barriers posed by these programs will<br />
be held dur<strong>in</strong>g the first quarter <strong>of</strong> 2005. We have made changes to our 2005 grant<br />
agreement to require sub-grantees to participate <strong>in</strong> a computerized <strong>in</strong>formation<br />
system to help maximize resources by <strong>in</strong>tegrat<strong>in</strong>g services and shar<strong>in</strong>g <strong>in</strong>formation.<br />
Additionally, the Office <strong>of</strong> <strong>Homelessness</strong> will support the work <strong>of</strong> the Council on<br />
<strong>Homelessness</strong> as they develop discharge plann<strong>in</strong>g procedures with<strong>in</strong> state agencies<br />
to reduce the risk <strong>of</strong> people leav<strong>in</strong>g state services and facilities from becom<strong>in</strong>g<br />
homeless.<br />
<strong>The</strong> department wishes to express our appreciation to the research team for this<br />
report. <strong>The</strong> cooperative work<strong>in</strong>g relationship with our Office on <strong>Homelessness</strong> was<br />
appreciated, and allowed for cont<strong>in</strong>uous <strong>in</strong>put to the report's f<strong>in</strong>d<strong>in</strong>gs.<br />
S<strong>in</strong>cerely,<br />
/s/<br />
Lucy D. Hadi<br />
Secretary<br />
1317 W<strong>in</strong>ewood Boulevard, Tallahassee, Florida 32399-0700<br />
<strong>The</strong> Department <strong>of</strong> Children and Families is committed to work<strong>in</strong>g <strong>in</strong> partnership with local<br />
communities to ensure safety, well-be<strong>in</strong>g and self-sufficiency for the people we serve.<br />
16
Page 265 <strong>of</strong> 289
Advocacy Foundation Publishers<br />
Page 266 <strong>of</strong> 289
Advocacy Foundation Publishers<br />
<strong>The</strong> e-Advocate Quarterly<br />
Page 267 <strong>of</strong> 289
Issue Title Quarterly<br />
Vol. I 2015 <strong>The</strong> Fundamentals<br />
I<br />
<strong>The</strong> ComeUnity ReEng<strong>in</strong>eer<strong>in</strong>g<br />
Project Initiative<br />
Q-1 2015<br />
II <strong>The</strong> Adolescent Law Group Q-2 2015<br />
III<br />
Landmark Cases <strong>in</strong> <strong>US</strong><br />
Juvenile Justice (PA)<br />
Q-3 2015<br />
IV <strong>The</strong> First Amendment Project Q-4 2015<br />
Vol. II 2016 Strategic Development<br />
V <strong>The</strong> Fourth Amendment Project Q-1 2016<br />
VI<br />
Landmark Cases <strong>in</strong> <strong>US</strong><br />
Juvenile Justice (NJ)<br />
Q-2 2016<br />
VII Youth Court Q-3 2016<br />
VIII<br />
<strong>The</strong> <strong>Economic</strong> <strong>Consequences</strong> <strong>of</strong> Legal<br />
Decision-Mak<strong>in</strong>g<br />
Q-4 2016<br />
Vol. III 2017 Susta<strong>in</strong>ability<br />
IX <strong>The</strong> Sixth Amendment Project Q-1 2017<br />
X<br />
<strong>The</strong> <strong>The</strong>ological Foundations <strong>of</strong><br />
<strong>US</strong> Law & Government<br />
Q-2 2017<br />
XI <strong>The</strong> Eighth Amendment Project Q-3 2017<br />
XII<br />
<strong>The</strong> EB-5 Investor<br />
Immigration Project*<br />
Q-4 2017<br />
Vol. IV 2018 Collaboration<br />
XIII Strategic Plann<strong>in</strong>g Q-1 2018<br />
XIV<br />
<strong>The</strong> Juvenile Justice<br />
Legislative Reform Initiative<br />
Q-2 2018<br />
XV <strong>The</strong> Advocacy Foundation Coalition Q-3 2018<br />
Page 268 <strong>of</strong> 289
XVI<br />
for Drug-Free Communities<br />
Landmark Cases <strong>in</strong> <strong>US</strong><br />
Juvenile Justice (GA)<br />
Q-4 2018<br />
Page 269 <strong>of</strong> 289
Issue Title Quarterly<br />
Vol. V 2019 Organizational Development<br />
XVII <strong>The</strong> Board <strong>of</strong> Directors Q-1 2019<br />
XVIII <strong>The</strong> Inner Circle Q-2 2019<br />
XIX Staff & Management Q-3 2019<br />
XX Succession Plann<strong>in</strong>g Q-4 2019<br />
XXI <strong>The</strong> Budget* Bonus #1<br />
XXII Data-Driven Resource Allocation* Bonus #2<br />
Vol. VI 2020 Missions<br />
XXIII Critical Th<strong>in</strong>k<strong>in</strong>g Q-1 2020<br />
XXIV<br />
<strong>The</strong> Advocacy Foundation<br />
Endowments Initiative Project<br />
Q-2 2020<br />
XXV International Labor Relations Q-3 2020<br />
XXVI Immigration Q-4 2020<br />
Vol. VII 2021 Community Engagement<br />
XXVII<br />
<strong>The</strong> 21 st Century Charter Schools<br />
Initiative<br />
Q-1 2021<br />
XXVIII <strong>The</strong> All-Sports M<strong>in</strong>istry @ ... Q-2 2021<br />
XXIX Lobby<strong>in</strong>g for Nonpr<strong>of</strong>its Q-3 2021<br />
XXX<br />
XXXI<br />
Advocacy Foundation Missions -<br />
Domestic<br />
Advocacy Foundation Missions -<br />
International<br />
Q-4 2021<br />
Bonus<br />
Page 270 <strong>of</strong> 289
Vol. VIII<br />
2022 ComeUnity ReEng<strong>in</strong>eer<strong>in</strong>g<br />
XXXII<br />
<strong>The</strong> Creative & F<strong>in</strong>e Arts M<strong>in</strong>istry<br />
@ <strong>The</strong> Foundation<br />
Q-1 2022<br />
XXXIII <strong>The</strong> Advisory Council & Committees Q-2 2022<br />
XXXIV<br />
<strong>The</strong> <strong>The</strong>ological Orig<strong>in</strong>s<br />
<strong>of</strong> Contemporary Judicial Process<br />
Q-3 2022<br />
XXXV <strong>The</strong> Second Chance M<strong>in</strong>istry @ ... Q-4 2022<br />
Vol. IX 2023 Legal Reformation<br />
XXXVI <strong>The</strong> Fifth Amendment Project Q-1 2023<br />
XXXVII <strong>The</strong> Judicial Re-Eng<strong>in</strong>eer<strong>in</strong>g Initiative Q-2 2023<br />
XXXVIII<br />
<strong>The</strong> Inner-Cities Strategic<br />
Revitalization Initiative<br />
Q-3 2023<br />
XXXVIX Habeas Corpus Q-4 2023<br />
Vol. X 2024 ComeUnity Development<br />
XXXVX<br />
<strong>The</strong> Inner-City Strategic<br />
Revitalization Plan<br />
Q-1 2024<br />
XXXVXI <strong>The</strong> Mentor<strong>in</strong>g Initiative Q-2 2024<br />
XXXVXII <strong>The</strong> Violence Prevention Framework Q-3 2024<br />
XXXVXIII <strong>The</strong> Fatherhood Initiative Q-4 2024<br />
Vol. XI 2025 Public Interest<br />
XXXVXIV Public Interest Law Q-1 2025<br />
L (50) Spiritual Resource Development Q-2 2025<br />
Page 271 <strong>of</strong> 289
LI<br />
Nonpr<strong>of</strong>it Confidentiality<br />
In <strong>The</strong> Age <strong>of</strong> Big Data<br />
Q-3 2025<br />
LII Interpret<strong>in</strong>g <strong>The</strong> Facts Q-4 2025<br />
Vol. XII 2026 Poverty In America<br />
LIII<br />
American Poverty<br />
In <strong>The</strong> New Millennium<br />
Q-1 2026<br />
LIV Outcome-Based Th<strong>in</strong>k<strong>in</strong>g Q-2 2026<br />
LV Transformational Social Leadership Q-3 2026<br />
LVI <strong>The</strong> Cycle <strong>of</strong> Poverty Q-4 2026<br />
Vol. XIII 2027 Rais<strong>in</strong>g Awareness<br />
LVII ReEng<strong>in</strong>eer<strong>in</strong>g Juvenile Justice Q-1 2027<br />
LVIII Corporations Q-2 2027<br />
LVIX <strong>The</strong> Prison Industrial Complex Q-3 2027<br />
LX Restoration <strong>of</strong> Rights Q-4 2027<br />
Vol. XIV 2028 Culturally Relevant Programm<strong>in</strong>g<br />
LXI Community Culture Q-1 2028<br />
LXII Corporate Culture Q-2 2028<br />
LXIII Strategic Cultural Plann<strong>in</strong>g Q-3 2028<br />
LXIV<br />
<strong>The</strong> Cross-Sector/ Coord<strong>in</strong>ated<br />
Service Approach to Del<strong>in</strong>quency<br />
Prevention<br />
Q-4 2028<br />
Page 272 <strong>of</strong> 289
Vol. XV 2029 Inner-Cities Revitalization<br />
LXIV<br />
LXV<br />
LXVI<br />
Part I – Strategic Hous<strong>in</strong>g<br />
Revitalization<br />
(<strong>The</strong> Twenty Percent Pr<strong>of</strong>it Marg<strong>in</strong>)<br />
Part II – Jobs Tra<strong>in</strong><strong>in</strong>g, Educational<br />
Redevelopment<br />
and <strong>Economic</strong> Empowerment<br />
Part III - F<strong>in</strong>ancial Literacy<br />
and Susta<strong>in</strong>ability<br />
Q-1 2029<br />
Q-2 2029<br />
Q-3 2029<br />
LXVII Part IV – Solutions for <strong>Homelessness</strong> Q-4 2029<br />
LXVIII<br />
<strong>The</strong> Strategic Home Mortgage<br />
Initiative<br />
Bonus<br />
Vol. XVI 2030 Susta<strong>in</strong>ability<br />
LXVIII Social Program Susta<strong>in</strong>ability Q-1 2030<br />
LXIX<br />
<strong>The</strong> Advocacy Foundation<br />
Endowments Initiative<br />
Q-2 2030<br />
LXX Capital Ga<strong>in</strong>s Q-3 2030<br />
LXXI Susta<strong>in</strong>ability Investments Q-4 2030<br />
Vol. XVII 2031 <strong>The</strong> Justice Series<br />
LXXII Distributive Justice Q-1 2031<br />
LXXIII Retributive Justice Q-2 2031<br />
LXXIV Procedural Justice Q-3 2031<br />
LXXV (75) Restorative Justice Q-4 2031<br />
LXXVI Unjust Legal Reason<strong>in</strong>g Bonus<br />
Page 273 <strong>of</strong> 289
Vol. XVIII 2032 Public Policy<br />
LXXVII Public Interest Law Q-1 2032<br />
LXXVIII Reform<strong>in</strong>g Public Policy Q-2 2032<br />
LXXVIX ... Q-3 2032<br />
LXXVX ... Q-4 2032<br />
Page 274 <strong>of</strong> 289
<strong>The</strong> e-Advocate Monthly Review<br />
2018<br />
Transformational Problem Solv<strong>in</strong>g January 2018<br />
<strong>The</strong> Advocacy Foundation February 2018<br />
Opioid Initiative<br />
Native-American Youth March 2018<br />
In the Juvenile Justice System<br />
Barriers to Reduc<strong>in</strong>g Conf<strong>in</strong>ement April 2018<br />
Lat<strong>in</strong>o and Hispanic Youth May 2018<br />
In the Juvenile Justice System<br />
Social Entrepreneurship June 2018<br />
<strong>The</strong> <strong>Economic</strong> <strong>Consequences</strong> <strong>of</strong><br />
<strong>Homelessness</strong> <strong>in</strong> America S.Ed – June 2018<br />
African-American Youth July 2018<br />
In the Juvenile Justice System<br />
Gang Deconstruction August 2018<br />
Social Impact Invest<strong>in</strong>g September 2018<br />
Opportunity Youth: October 2018<br />
Disenfranchised Young People<br />
<strong>The</strong> <strong>Economic</strong> Impact <strong>of</strong> Social November 2018<br />
<strong>of</strong> Social Programs Development<br />
Gun Control December 2018<br />
2019<br />
<strong>The</strong> U.S. Stock Market January 2019<br />
Prison-Based Gerrymander<strong>in</strong>g February 2019<br />
Literacy-Based Prison Construction March 2019<br />
Children <strong>of</strong> Incarcerated Parents April 2019<br />
Page 275 <strong>of</strong> 289
African-American Youth <strong>in</strong> <strong>The</strong> May 2019<br />
Juvenile Justice System<br />
Racial Pr<strong>of</strong>il<strong>in</strong>g June 2019<br />
Mass Collaboration July 2019<br />
Concentrated Poverty August 2019<br />
De-Industrialization September 2019<br />
Overcom<strong>in</strong>g Dyslexia October 2019<br />
Overcom<strong>in</strong>g Attention Deficit November 2019<br />
<strong>The</strong> Gift <strong>of</strong> Adversity December 2019<br />
2020<br />
<strong>The</strong> Gift <strong>of</strong> Hypersensitivity January 2020<br />
<strong>The</strong> Gift <strong>of</strong> Introspection February 2020<br />
<strong>The</strong> Gift <strong>of</strong> Introversion March 2020<br />
<strong>The</strong> Gift <strong>of</strong> Spirituality April 2020<br />
<strong>The</strong> Gift <strong>of</strong> Transformation May 2020<br />
…<br />
Page 276 <strong>of</strong> 289
<strong>The</strong> e-Advocate Quarterly<br />
Special Editions<br />
Crowdfund<strong>in</strong>g W<strong>in</strong>ter-Spr<strong>in</strong>g 2017<br />
Social Media for Nonpr<strong>of</strong>its October 2017<br />
Mass Media for Nonpr<strong>of</strong>its November 2017<br />
<strong>The</strong> Opioid Crisis <strong>in</strong> America: January 2018<br />
Issues <strong>in</strong> Pa<strong>in</strong> Management<br />
<strong>The</strong> Opioid Crisis <strong>in</strong> America: February 2018<br />
<strong>The</strong> Drug Culture <strong>in</strong> the U.S.<br />
<strong>The</strong> Opioid Crisis <strong>in</strong> America: March 2018<br />
Drug Abuse Among Veterans<br />
<strong>The</strong> Opioid Crisis <strong>in</strong> America: April 2018<br />
Drug Abuse Among America’s<br />
Teens<br />
<strong>The</strong> Opioid Crisis <strong>in</strong> America: May 2018<br />
Alcoholism<br />
<strong>The</strong> <strong>Economic</strong> <strong>Consequences</strong> <strong>of</strong> June 2018<br />
<strong>Homelessness</strong> <strong>in</strong> <strong>The</strong> <strong>US</strong><br />
<strong>The</strong> <strong>Economic</strong> <strong>Consequences</strong> <strong>of</strong> July 2018<br />
Opioid Addiction <strong>in</strong> America<br />
Page 277 <strong>of</strong> 289
<strong>The</strong> e-Advocate Journal<br />
<strong>of</strong> <strong>The</strong>ological Jurisprudence<br />
Vol. I - 2017<br />
<strong>The</strong> <strong>The</strong>ological Orig<strong>in</strong>s <strong>of</strong> Contemporary Judicial Process<br />
Scriptural Application to <strong>The</strong> Model Crim<strong>in</strong>al Code<br />
Scriptural Application for Tort Reform<br />
Scriptural Application to Juvenile Justice Reformation<br />
Vol. II - 2018<br />
Scriptural Application for <strong>The</strong> Canons <strong>of</strong> Ethics<br />
Scriptural Application to Contracts Reform<br />
& <strong>The</strong> Uniform Commercial Code<br />
Scriptural Application to <strong>The</strong> Law <strong>of</strong> Property<br />
Scriptural Application to <strong>The</strong> Law <strong>of</strong> Evidence<br />
Page 278 <strong>of</strong> 289
Legal Missions International<br />
Page 279 <strong>of</strong> 289
Issue Title Quarterly<br />
Vol. I 2015<br />
I<br />
II<br />
God’s Will and <strong>The</strong> 21 st Century<br />
Democratic Process<br />
<strong>The</strong> Community<br />
Engagement Strategy<br />
Q-1 2015<br />
Q-2 2015<br />
III Foreign Policy Q-3 2015<br />
IV<br />
Public Interest Law<br />
<strong>in</strong> <strong>The</strong> New Millennium<br />
Q-4 2015<br />
Vol. II 2016<br />
V Ethiopia Q-1 2016<br />
VI Zimbabwe Q-2 2016<br />
VII Jamaica Q-3 2016<br />
VIII Brazil Q-4 2016<br />
Vol. III 2017<br />
IX India Q-1 2017<br />
X Sur<strong>in</strong>ame Q-2 2017<br />
XI <strong>The</strong> Caribbean Q-3 2017<br />
XII United States/ Estados Unidos Q-4 2017<br />
Vol. IV 2018<br />
XIII Cuba Q-1 2018<br />
XIV Gu<strong>in</strong>ea Q-2 2018<br />
XV Indonesia Q-3 2018<br />
XVI Sri Lanka Q-4 2018<br />
Page 280 <strong>of</strong> 289
Vol. V 2019<br />
XVII Russia Q-1 2019<br />
XVIII Australia Q-2 2019<br />
XIV South Korea Q-3 2019<br />
XV Puerto Rico Q-4 2019<br />
Issue Title Quarterly<br />
Vol. VI 2020<br />
XVI Tr<strong>in</strong>idad & Tobago Q-1 2020<br />
XVII Egypt Q-2 2020<br />
XVIII Sierra Leone Q-3 2020<br />
XIX South Africa Q-4 2020<br />
XX Israel Bonus<br />
Vol. VII 2021<br />
XXI Haiti Q-1 2021<br />
XXII Peru Q-2 2021<br />
XXIII Costa Rica Q-3 2021<br />
XXIV Ch<strong>in</strong>a Q-4 2021<br />
XXV Japan Bonus<br />
Vol VIII 2022<br />
XXVI Chile Q-1 2022<br />
Page 281 <strong>of</strong> 289
<strong>The</strong> e-Advocate Juvenile Justice Report<br />
______<br />
Vol. I – Juvenile Del<strong>in</strong>quency <strong>in</strong> <strong>The</strong> <strong>US</strong><br />
Vol. II. – <strong>The</strong> Prison Industrial Complex<br />
Vol. III – Restorative/ Transformative Justice<br />
Vol. IV – <strong>The</strong> Sixth Amendment Right to <strong>The</strong> Effective Assistance <strong>of</strong> Counsel<br />
Vol. V – <strong>The</strong> <strong>The</strong>ological Foundations <strong>of</strong> Juvenile Justice<br />
Vol. VI – Collaborat<strong>in</strong>g to Eradicate Juvenile Del<strong>in</strong>quency<br />
Page 282 <strong>of</strong> 289
<strong>The</strong> e-Advocate Newsletter<br />
Genesis <strong>of</strong> <strong>The</strong> Problem<br />
Family Structure<br />
Societal Influences<br />
Evidence-Based Programm<strong>in</strong>g<br />
Strengthen<strong>in</strong>g Assets v. Elim<strong>in</strong>at<strong>in</strong>g Deficits<br />
2012 - Juvenile Del<strong>in</strong>quency <strong>in</strong> <strong>The</strong> <strong>US</strong><br />
Introduction/Ideology/Key Values<br />
Philosophy/Application & Practice<br />
Expungement & Pardons<br />
Pardons & Clemency<br />
Examples/Best Practices<br />
2013 - Restorative Justice <strong>in</strong> <strong>The</strong> <strong>US</strong><br />
2014 - <strong>The</strong> Prison Industrial Complex<br />
25% <strong>of</strong> the World's Inmates Are In the <strong>US</strong><br />
<strong>The</strong> <strong>Economic</strong>s <strong>of</strong> Prison Enterprise<br />
<strong>The</strong> Federal Bureau <strong>of</strong> Prisons<br />
<strong>The</strong> After-Effects <strong>of</strong> Incarceration/Individual/Societal<br />
<strong>The</strong> Fourth Amendment Project<br />
<strong>The</strong> Sixth Amendment Project<br />
<strong>The</strong> Eighth Amendment Project<br />
<strong>The</strong> Adolescent Law Group<br />
2015 - <strong>US</strong> Constitutional Issues In <strong>The</strong> New Millennium<br />
Page 283 <strong>of</strong> 289
2018 - <strong>The</strong> <strong>The</strong>ological Law Firm Academy<br />
<strong>The</strong> <strong>The</strong>ological Foundations <strong>of</strong> <strong>US</strong> Law & Government<br />
<strong>The</strong> <strong>Economic</strong> <strong>Consequences</strong> <strong>of</strong> Legal Decision-Mak<strong>in</strong>g<br />
<strong>The</strong> Juvenile Justice Legislative Reform Initiative<br />
<strong>The</strong> EB-5 International Investors Initiative<br />
2017 - Organizational Development<br />
<strong>The</strong> Board <strong>of</strong> Directors<br />
<strong>The</strong> Inner Circle<br />
Staff & Management<br />
Succession Plann<strong>in</strong>g<br />
Bonus #1 <strong>The</strong> Budget<br />
Bonus #2 Data-Driven Resource Allocation<br />
2018 - Susta<strong>in</strong>ability<br />
<strong>The</strong> Data-Driven Resource Allocation Process<br />
<strong>The</strong> Quality Assurance Initiative<br />
<strong>The</strong> Advocacy Foundation Endowments Initiative<br />
<strong>The</strong> Community Engagement Strategy<br />
2019 - Collaboration<br />
Critical Th<strong>in</strong>k<strong>in</strong>g for Transformative Justice<br />
International Labor Relations<br />
Immigration<br />
God's Will & <strong>The</strong> 21st Century Democratic Process<br />
<strong>The</strong> Community Engagement Strategy<br />
<strong>The</strong> 21st Century Charter Schools Initiative<br />
2020 - Community Engagement<br />
Page 284 <strong>of</strong> 289
Extras<br />
<strong>The</strong> Nonpr<strong>of</strong>it Advisors Group Newsletters<br />
<strong>The</strong> 501(c)(3) Acquisition Process<br />
<strong>The</strong> Board <strong>of</strong> Directors<br />
<strong>The</strong> Gladiator Mentality<br />
Strategic Plann<strong>in</strong>g<br />
Fundrais<strong>in</strong>g<br />
501(c)(3) Re<strong>in</strong>statements<br />
<strong>The</strong> Collaborative <strong>US</strong>/ International Newsletters<br />
How You Th<strong>in</strong>k Is Everyth<strong>in</strong>g<br />
<strong>The</strong> Reciprocal Nature <strong>of</strong> Bus<strong>in</strong>ess Relationships<br />
Accelerate Your Pr<strong>of</strong>essional Development<br />
<strong>The</strong> Competitive Nature <strong>of</strong> Grant Writ<strong>in</strong>g<br />
Assess<strong>in</strong>g <strong>The</strong> Risks<br />
Page 285 <strong>of</strong> 289
Page 286 <strong>of</strong> 289
About <strong>The</strong> Author<br />
John C (Jack) Johnson III<br />
Founder & CEO<br />
Jack was educated at Temple University, <strong>in</strong> Philadelphia, Pennsylvania and Rutgers<br />
Law School, <strong>in</strong> Camden, New Jersey. In 1999, he moved to Atlanta, Georgia to pursue<br />
greater opportunities to provide Advocacy and Preventive Programmatic services for atrisk/<br />
at-promise young persons, their families, and Justice Pr<strong>of</strong>essionals embedded <strong>in</strong> the<br />
Juvenile Justice process <strong>in</strong> order to help facilitate its transcendence <strong>in</strong>to the 21 st Century.<br />
<strong>The</strong>re, along with a small group <strong>of</strong> community and faith-based pr<strong>of</strong>essionals, “<strong>The</strong> Advocacy Foundation, Inc." was conceived<br />
and developed over roughly a thirteen year period, orig<strong>in</strong>ally chartered as a Juvenile Del<strong>in</strong>quency Prevention and Educational<br />
Support Services organization consist<strong>in</strong>g <strong>of</strong> Mentor<strong>in</strong>g, Tutor<strong>in</strong>g, Counsel<strong>in</strong>g, Character Development, Community Change<br />
Management, Practitioner Re-Education & Tra<strong>in</strong><strong>in</strong>g, and a host <strong>of</strong> related components.<br />
<strong>The</strong> Foundation’s Overarch<strong>in</strong>g Mission is “To help Individuals, Organizations, & Communities Achieve <strong>The</strong>ir Full Potential”, by<br />
implement<strong>in</strong>g a wide array <strong>of</strong> evidence-based proactive multi-discipl<strong>in</strong>ary "Restorative & Transformative Justice" programs &<br />
projects currently throughout the northeast, southeast, and western <strong>in</strong>ternational-waters regions, provid<strong>in</strong>g prevention and support<br />
services to at-risk/ at-promise youth, to young adults, to their families, and to Social Service, Justice and Mental<br />
Health pr<strong>of</strong>essionals” everywhere. <strong>The</strong> Foundation has s<strong>in</strong>ce relocated its headquarters to Philadelphia, Pennsylvania, and been<br />
expanded to <strong>in</strong>clude a three-tier mission.<br />
In addition to his work with the Foundation, Jack also served as an Adjunct Pr<strong>of</strong>essor <strong>of</strong> Law & Bus<strong>in</strong>ess at National-Louis<br />
University <strong>of</strong> Atlanta (where he taught Political Science, Bus<strong>in</strong>ess & Legal Ethics, Labor & Employment Relations, and Critical<br />
Th<strong>in</strong>k<strong>in</strong>g courses to undergraduate and graduate level students). Jack has also served as Board President for a host <strong>of</strong> wellestablished<br />
and up & com<strong>in</strong>g nonpr<strong>of</strong>it organizations throughout the region, <strong>in</strong>clud<strong>in</strong>g “Visions Unlimited Community<br />
Development Systems, Inc.”, a multi-million dollar, award-w<strong>in</strong>n<strong>in</strong>g, Violence Prevention and Gang Intervention Social Service<br />
organization <strong>in</strong> Atlanta, as well as Vice-Chair <strong>of</strong> the Georgia/ Metropolitan Atlanta Violence Prevention Partnership, a state-wide<br />
300 organizational member, violence prevention group led by the Morehouse School <strong>of</strong> Medic<strong>in</strong>e, Emory University and <strong>The</strong><br />
Orig<strong>in</strong>al, Atlanta-Based, Mart<strong>in</strong> Luther K<strong>in</strong>g Center.<br />
Attorney Johnson’s prior accomplishments <strong>in</strong>clude a wide-array <strong>of</strong> Pr<strong>of</strong>essional Legal practice areas, <strong>in</strong>clud<strong>in</strong>g Private Firm,<br />
Corporate and Government post<strong>in</strong>gs, just about all <strong>of</strong> which yielded significant pr<strong>of</strong>essional awards & accolades, the history and<br />
chronology <strong>of</strong> which are available for review onl<strong>in</strong>e. Throughout his career, Jack has served a wide variety <strong>of</strong> for-pr<strong>of</strong>it<br />
corporations, law firms, and nonpr<strong>of</strong>it organizations as Board Chairman, Secretary, Associate, and General Counsel s<strong>in</strong>ce 1990.<br />
www.<strong>The</strong>AdvocacyFoundation.org<br />
Clayton County Youth Services Partnership, Inc. – Chair; Georgia Violence Prevention Partnership, Inc – Vice Chair; Fayette<br />
County NAACP - Legal Redress Committee Chairman; Clayton County Fatherhood Initiative Partnership – Pr<strong>in</strong>cipal<br />
Investigator; Morehouse School <strong>of</strong> Medic<strong>in</strong>e School <strong>of</strong> Community Health Feasibility Study - Steer<strong>in</strong>g Committee; Atlanta<br />
Violence Prevention Capacity Build<strong>in</strong>g Project – Project Partner; Clayton County M<strong>in</strong>ister’s Conference, President 2006-2007;<br />
Liberty In Life M<strong>in</strong>istries, Inc. – Board Secretary; Young Adults Talk, Inc. – Board <strong>of</strong> Directors; ROYAL, Inc - Board <strong>of</strong><br />
Directors; Temple University Alumni Association; Rutgers Law School Alumni Association; Sertoma International; Our<br />
Common Welfare Board <strong>of</strong> Directors – President)2003-2005; River’s Edge Elementary School PTA (Co-President); Summerhill<br />
Community M<strong>in</strong>istries; Outstand<strong>in</strong>g Young Men <strong>of</strong> America; Employee <strong>of</strong> the Year; Academic All-American - Basketball;<br />
Church Trustee.<br />
Page 287 <strong>of</strong> 289
www.<strong>The</strong>AdvocacyFoundation.org<br />
Page 288 <strong>of</strong> 289
Page 289 <strong>of</strong> 289


