

De-Industrialization
De-Industrialization
De-Industrialization

You also want an ePaper? Increase the reach of your titles
YUMPU automatically turns print PDFs into web optimized ePapers that Google loves.
VIII. Shrinking Cities<br />
in The U.S.<br />
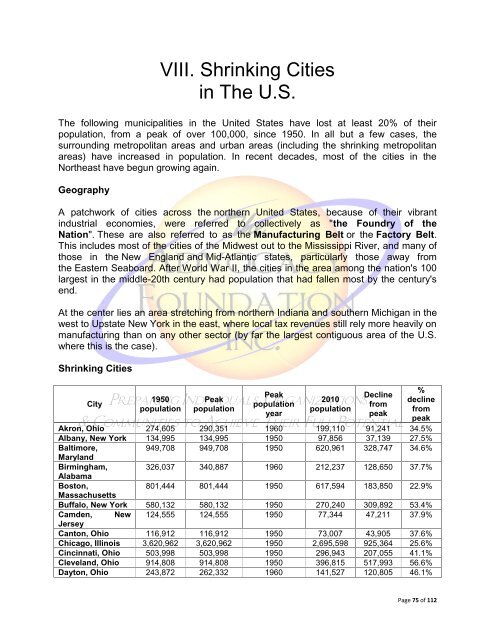
The following municipalities in the United States have lost at least 20% of their<br />
population, from a peak of over 100,000, since 1950. In all but a few cases, the<br />
surrounding metropolitan areas and urban areas (including the shrinking metropolitan<br />
areas) have increased in population. In recent decades, most of the cities in the<br />
Northeast have begun growing again.<br />
Geography<br />
A patchwork of cities across the northern United States, because of their vibrant<br />
industrial economies, were referred to collectively as "the Foundry of the<br />
Nation". These are also referred to as the Manufacturing Belt or the Factory Belt.<br />
This includes most of the cities of the Midwest out to the Mississippi River, and many of<br />
those in the New England and Mid-Atlantic states, particularly those away from<br />
the Eastern Seaboard. After World War II, the cities in the area among the nation's 100<br />
largest in the middle-20th century had population that had fallen most by the century's<br />
end.<br />
At the center lies an area stretching from northern Indiana and southern Michigan in the<br />
west to Upstate New York in the east, where local tax revenues still rely more heavily on<br />
manufacturing than on any other sector (by far the largest contiguous area of the U.S.<br />
where this is the case).<br />
Shrinking Cities<br />
City<br />
%<br />
Peak<br />
<strong>De</strong>cline<br />
1950 Peak<br />
2010<br />
decline<br />
population<br />
from<br />
population population<br />
population<br />
from<br />
year<br />
peak<br />
peak<br />
Akron, Ohio 274,605 290,351 1960 199,110 91,241 34.5%<br />
Albany, New York 134,995 134,995 1950 97,856 37,139 27.5%<br />
Baltimore,<br />
949,708 949,708 1950 620,961 328,747 34.6%<br />
Maryland<br />
Birmingham, 326,037 340,887 1960 212,237 128,650 37.7%<br />
Alabama<br />
Boston,<br />
801,444 801,444 1950 617,594 183,850 22.9%<br />
Massachusetts<br />
Buffalo, New York 580,132 580,132 1950 270,240 309,892 53.4%<br />
Camden, New 124,555 124,555 1950 77,344 47,211 37.9%<br />
Jersey<br />
Canton, Ohio 116,912 116,912 1950 73,007 43,905 37.6%<br />
Chicago, Illinois 3,620,962 3,620,962 1950 2,695,598 925,364 25.6%<br />
Cincinnati, Ohio 503,998 503,998 1950 296,943 207,055 41.1%<br />
Cleveland, Ohio 914,808 914,808 1950 396,815 517,993 56.6%<br />
Dayton, Ohio 243,872 262,332 1960 141,527 120,805 46.1%<br />
Page 75 of 112


