

De-Industrialization
De-Industrialization
De-Industrialization

You also want an ePaper? Increase the reach of your titles
YUMPU automatically turns print PDFs into web optimized ePapers that Google loves.
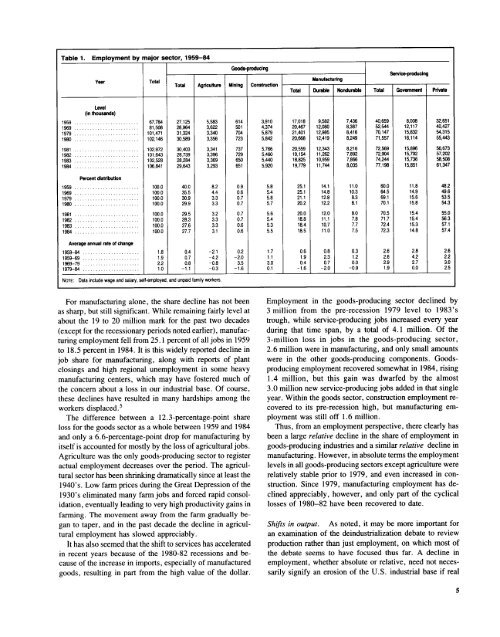
Table 1 . Employment by major sector, 1959-84<br />
Goods-producing<br />
Year<br />
Total<br />
Total Agriculture Mining Construction<br />
Service- p roducin g<br />
Manufacturing<br />
Total Durable Nondurable Total Government Private<br />
Level<br />
(in thousands)<br />
1959 . . . . . . . . . . . . . . . . . . . . . . . . . 67,784 27,125 5,583 614 3,910 17,018 9,582 7,436 40,659 8,008 32,651<br />
1969 . . . . . . . . . . . . . . . . . . . . . . . . . 81,508 28,964 3,622 501 4,374 20,467 12,080 8,387 52,544 12,117 40,427<br />
1979 . . . . . . . . . . . . . . . . . . . . . . . . . 101,471 31,324 3,340 704 5,879 21,401 12,985 8,416 70,147 15,832 54,315<br />
1980 . . . . . . . . . . . . . . . . . . . . . . . . . 102,146 30,589 3,356 723 5,842 20,668 12,419 8,249 71,557 16,114 55,443<br />
1981 . . . . . . . . . . . . . . . . . . . . . . . . . 102,972 30,403 3,341 737 5,766 20,559 12,343 8,216 72,569 15,896 56,673<br />
1982 . . . . . . . . . . . . . . . . . . . . . . . . . 101,643 28,739 3,396 729 5,460 19,154 11,262 7,892 72,904 15,702 57,202<br />
1983 . . . . . . . . . . . . . . . . . . . . . . . . . 102,528 28,284 3,369 650 5,440 18,825 10,959 7,866 74,244 15,736 58,508<br />
1984 . . . . . . . . . . . . . . . . . . . . . . . . . 106,841 29,643 3,293 651 5,920 19,779 11,744 8,035 77,198 15,851 61,347<br />
Percent distribution<br />
1959 . . . . . . . . . . . . . . . . . . . . . . . . . 100.0 40.0 8.2 0 .9 5 .8 25 .1 14.1 11 .0 60 .0 11 .8 48.2<br />
1969 . . . . . . . . . . . . . . . . . . . . . . . . . 100.0 35.5 4.4 0 .6 5 .4 25 .1 14.8 10.3 64 .5 14.9 49.6<br />
1979 . . . . . . . . . . . . . . . . . . . . . . . . . 100.0 30.9 3.3 0 .7 5 .8 21 .1 12 .8 8.3 69 .1 15.6 53.5<br />
1980 . . . . . . . . . . . . . . . . . . . . . . . . . 100.0 29.9 3.3 0 .7 5 .7 20 .2 12 .2 8.1 70 .1 15.8 54.3<br />
1981 . . . . . . . . . . . . . . . . . . . . . . . . . 100.0 29 .5 3 .2 0.7 5 .6 20 .0 12 .0 8.0 70 .5 15.4 55.0<br />
1982 . . . . . . . . . . . . . . . . . . . . . . . . . 100.0 28 .3 3 .3 0.7 5 .4 18 .8 11 .1 7 .8 71 .7 15.4 56.3<br />
1983 . . . . . . . . . . . . . . . . . . . . . . . . . 100.0 27 .6 3 .3 0.6 5.3 18.4 10 .7 7 .7 72 .4 15.3 57 .1<br />
1984 . . . . . . . . . . . . . . . . . . . . . . . . . 100.0 27 .7 3 .1 0.6 5.5 18.5 11 .0 7 .5 72 .3 14.8 57 .4<br />
Average annual rate of change<br />
1959-84 . . . . . . . . . . . . . . . . . . . . . . 1 .8 0 .4 -2 .1 0.2 1 .7 0.6 0 .8 0 .3 2 .6 2 .8 2 .6<br />
1959-69 . . . . . . . . . . . . . . . . . . . . . . 1 .9 0 .7 -4 .2 -2.0 1 .1 1 .9 2 .3 1 .2 2.6 4 .2 2 .2<br />
1969-79 . . . . . . . . . . . . . . . . . . . . . . 2 .2 0 .8 -0 .8 3.5 3.0 0.4 0 .7 0 .0 2.9 2 .7 3 .0<br />
1979-84 . . . . . . . . . . . . . . . . . . . . . . 1 .0 -1 .1 -0 .3 -1 .6 0.1 -1 .6 -2 .0 -0 .9 1 .9 0 .0 2 .5<br />
NOTE :<br />
Data include wage and salary, self-employed, and unpaid family workers.<br />
For manufacturing alone, the share decline has not been<br />
as sharp, but still significant . While remaining fairly level at<br />
about the 19 to 20 million mark for the past two decades<br />
(except for the recessionary periods noted earlier), manufacturing<br />
employment fell from 25 .1 percent of all jobs in 1959<br />
to 18 .5 percent in 1984 . It is this widely reported decline in<br />
job share for manufacturing, along with reports of plant<br />
closings and high regional unemployment in some heavy<br />
manufacturing centers, which may have fostered much of<br />
the concern about a loss in our industrial base . Of course,<br />
these declines have resulted in many hardships among the<br />
workers displaced .'<br />
The difference between a 12 .3-percentage-point share<br />
loss for the goods sector as a whole between 1959 and 1984<br />
and only a 6 .6-percentage-point drop for manufacturing by<br />
itself is accounted for mostly by the loss of agricultural jobs .<br />
Agriculture was the only goods-producing sector to register<br />
actual employment decreases over the period . The agricultural<br />
sector has been shrinking dramatically since at least the<br />
1940'' . Low farm prices during the Great <strong>De</strong>pression of the<br />
1930'' eliminated many farm jobs and forced rapid consolidation,<br />
eventually leading to very high productivity gains in<br />
farming .<br />
The movement away from the farm gradually began<br />
to taper, and in the past decade the decline in agricultural<br />
employment has slowed appreciably .<br />
It has also seemed that the shift to services has accelerated<br />
in recent years because of the 1980-82 recessions and because<br />
of the increase in imports, especially of manufactured<br />
goods, resulting in part from the high value of the dollar .<br />
Employment in the goods-producing sector declined by<br />
3 million from the pre-recession 1979 level to 1983''<br />
trough, while service-producing jobs increased every year<br />
during that time span, by a total of 4.1 million . Of the<br />
3-million loss in jobs in the goods-producing sector,<br />
2.6 million were in manufacturing, and only small amounts<br />
were in the other goods-producing components . Goodsproducing<br />
employment recovered somewhat in 1984, rising<br />
1 .4 million, but this gain was dwarfed by the almost<br />
3.0 million new service-producing jobs added in that single<br />
year . Within the goods sector, construction employment recovered<br />
to its pre-recession high, but manufacturing employment<br />
was still off 1 .6 million .<br />
Thus, from an employment perspective, there clearly has<br />
been a large relative decline in the share of employment in<br />
goods-producing industries and a similar relative decline in<br />
manufacturing . However, in absolute terms the employment<br />
levels in all goods-producing sectors except agriculture were<br />
relatively stable prior to 1979, and even increased in construction<br />
. Since 1979, manufacturing employment has declined<br />
appreciably, however, and only part of the cyclical<br />
losses of 1980-82 have been recovered to date .<br />
Shifts in output . As noted, it may be more important for<br />
an examination of the deindustrialization debate to review<br />
production rather than just employment, on which most of<br />
the debate seems to have focused thus far . A decline in<br />
employment, whether absolute or relative, need not necessarily<br />
signify an erosion of the U.S . industrial base if real


