

Genetic variability, heritability, genetic advance and trait correlations in selected sorghum (Sorghum bicolor L. Moench) varieties
Abstract Study was carried out to estimate the genetic variability, heritability and genetic advance as well as association between yield and yield related traits in selected sorghum varieties. Ten sorghum varieties were evaluated in randomize complete block design with 2 replicates across two environments. Data were recorded on plant height, days to 50% flowering, number of productive tillers, panicle length, panicle width, panicle weight, 100 seed mass and grain yield. Mean squares were significant (P≤0.05) for all traits in the individual and combined analysis of variance, implying high variation in the sorghum population. Panicle length, panicle width, Dry panicle weight and 100 seed mass could be employed as target traits to improving grain yield. All the traits evaluated exhibited high genotypic and phenotypic components of variance than environmental variance, showing that characters in the population was genetically controlled and can be exploited in breeding programs. High heritability and estimated genetic advance as percentage of mean for most of the traits indicates the presence of additive genes and suggested reliable sorghum improvement through selection for the traits. Grain yield was significant and positively associated with days to 50% flowering, number of fertile tillers, panicle width, dry panicle weight and 100 seed mass.
Abstract
Study was carried out to estimate the genetic variability, heritability and genetic advance as well as association between yield and yield related traits in selected sorghum varieties. Ten sorghum varieties were evaluated in randomize complete block design with 2 replicates across two environments. Data were recorded on plant height, days to 50% flowering, number of productive tillers, panicle length, panicle width, panicle weight, 100 seed mass and grain yield. Mean squares were significant (P≤0.05) for all traits in the individual and combined analysis of variance, implying high variation in the sorghum population. Panicle length, panicle width, Dry panicle weight and 100 seed mass could be employed as target traits to improving grain yield. All the traits evaluated exhibited high genotypic and phenotypic components of variance than environmental variance, showing that characters in the population was genetically controlled and can be exploited in breeding programs. High heritability and estimated genetic advance as percentage of mean for most of the traits indicates the presence of additive genes and suggested reliable sorghum improvement through selection for the traits. Grain yield was significant and positively associated with days to 50% flowering, number of fertile tillers, panicle width, dry panicle weight and 100 seed mass.

You also want an ePaper? Increase the reach of your titles
YUMPU automatically turns print PDFs into web optimized ePapers that Google loves.
Int. J. Agron. Agri. R.<br />
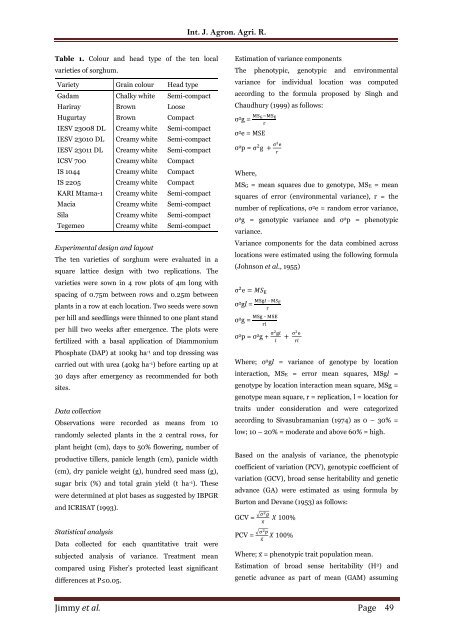
Table 1. Colour <strong>and</strong> head type of the ten local<br />
<strong>varieties</strong> of <strong>sorghum</strong>.<br />
Variety Gra<strong>in</strong> colour Head type<br />
Gadam Chalky white Semi-compact<br />
Hariray Brown Loose<br />
Hugurtay Brown Compact<br />
IESV 23008 DL Creamy white Semi-compact<br />
IESV 23010 DL Creamy white Semi-compact<br />
IESV 23011 DL Creamy white Semi-compact<br />
ICSV 700 Creamy white Compact<br />
IS 1044 Creamy white Compact<br />
IS 2205 Creamy white Compact<br />
KARI Mtama-1 Creamy white Semi-compact<br />
Macia Creamy white Semi-compact<br />
Sila Creamy white Semi-compact<br />
Tegemeo Creamy white Semi-compact<br />
Experimental design <strong>and</strong> layout<br />
The ten <strong>varieties</strong> of <strong>sorghum</strong> were evaluated <strong>in</strong> a<br />
square lattice design with two replications. The<br />
<strong>varieties</strong> were sown <strong>in</strong> 4 row plots of 4m long with<br />
spac<strong>in</strong>g of 0.75m between rows <strong>and</strong> 0.25m between<br />
plants <strong>in</strong> a row at each location. Two seeds were sown<br />
per hill <strong>and</strong> seedl<strong>in</strong>gs were th<strong>in</strong>ned to one plant st<strong>and</strong><br />
per hill two weeks after emergence. The plots were<br />
fertilized with a basal application of Diammonium<br />
Phosphate (DAP) at 100kg ha -1 <strong>and</strong> top dress<strong>in</strong>g was<br />
carried out with urea (40kg ha -1 ) before eart<strong>in</strong>g up at<br />
30 days after emergency as recommended for both<br />
sites.<br />
Data collection<br />
Observations were recorded as means from 10<br />
r<strong>and</strong>omly <strong>selected</strong> plants <strong>in</strong> the 2 central rows, for<br />
plant height (cm), days to 50% flower<strong>in</strong>g, number of<br />
productive tillers, panicle length (cm), panicle width<br />
(cm), dry panicle weight (g), hundred seed mass (g),<br />
sugar brix (%) <strong>and</strong> total gra<strong>in</strong> yield (t ha -1 ). These<br />
were determ<strong>in</strong>ed at plot bases as suggested by IBPGR<br />
<strong>and</strong> ICRISAT (1993).<br />
Statistical analysis<br />
Data collected for each quantitative <strong>trait</strong> were<br />
subjected analysis of variance. Treatment mean<br />
compared us<strong>in</strong>g Fisher’s protected least significant<br />
differences at P≤0.05.<br />
Estimation of variance components<br />
The phenotypic, genotypic <strong>and</strong> environmental<br />
variance for <strong>in</strong>dividual location was computed<br />
accord<strong>in</strong>g to the formula proposed by S<strong>in</strong>gh <strong>and</strong><br />
Chaudhury (1999) as follows:<br />
σ 2 g = MS G−MS E<br />
r<br />
σ 2 e = MSE<br />
σ 2 p = σ 2 g + σ2 e<br />
r<br />
Where,<br />
MSG = mean squares due to genotype, MSE = mean<br />
squares of error (environmental variance), r = the<br />
number of replications, σ 2 e = r<strong>and</strong>om error variance,<br />
σ 2 g = genotypic variance <strong>and</strong> σ 2 p = phenotypic<br />
variance.<br />
Variance components for the data comb<strong>in</strong>ed across<br />
locations were estimated us<strong>in</strong>g the follow<strong>in</strong>g formula<br />
(Johnson et al., 1955)<br />
σ 2 e = MS E<br />
σ 2 gl = MSgl – MS E<br />
r<br />
σ 2 MSg – MSE<br />
g =<br />
rl<br />
σ 2 p = σ 2 g + σ2 gl<br />
l<br />
+ σ2 e<br />
rl<br />
Where; σ 2 gl = variance of genotype by location<br />
<strong>in</strong>teraction, MSE = error mean squares, MSgl =<br />
genotype by location <strong>in</strong>teraction mean square, MSg =<br />
genotype mean square, r = replication, l = location for<br />
<strong>trait</strong>s under consideration <strong>and</strong> were categorized<br />
accord<strong>in</strong>g to Sivasubramanian (1974) as 0 – 30% =<br />
low; 10 – 20% = moderate <strong>and</strong> above 60% = high.<br />
Based on the analysis of variance, the phenotypic<br />
coefficient of variation (PCV), genotypic coefficient of<br />
variation (GCV), broad sense <strong>heritability</strong> <strong>and</strong> <strong>genetic</strong><br />
<strong>advance</strong> (GA) were estimated as us<strong>in</strong>g formula by<br />
Burton <strong>and</strong> Devane (1953) as follows:<br />
GCV = √σ2 g<br />
x̅<br />
X 100%<br />
PCV = √σ2 p<br />
X 100%<br />
x̅<br />
Where; x̅ = phenotypic <strong>trait</strong> population mean.<br />
Estimation of broad sense <strong>heritability</strong> (H 2 ) <strong>and</strong><br />
<strong>genetic</strong> <strong>advance</strong> as part of mean (GAM) assum<strong>in</strong>g<br />
Jimmy et al. Page 49


