

Genetic variability, heritability, genetic advance and trait correlations in selected sorghum (Sorghum bicolor L. Moench) varieties
Abstract Study was carried out to estimate the genetic variability, heritability and genetic advance as well as association between yield and yield related traits in selected sorghum varieties. Ten sorghum varieties were evaluated in randomize complete block design with 2 replicates across two environments. Data were recorded on plant height, days to 50% flowering, number of productive tillers, panicle length, panicle width, panicle weight, 100 seed mass and grain yield. Mean squares were significant (P≤0.05) for all traits in the individual and combined analysis of variance, implying high variation in the sorghum population. Panicle length, panicle width, Dry panicle weight and 100 seed mass could be employed as target traits to improving grain yield. All the traits evaluated exhibited high genotypic and phenotypic components of variance than environmental variance, showing that characters in the population was genetically controlled and can be exploited in breeding programs. High heritability and estimated genetic advance as percentage of mean for most of the traits indicates the presence of additive genes and suggested reliable sorghum improvement through selection for the traits. Grain yield was significant and positively associated with days to 50% flowering, number of fertile tillers, panicle width, dry panicle weight and 100 seed mass.
Abstract
Study was carried out to estimate the genetic variability, heritability and genetic advance as well as association between yield and yield related traits in selected sorghum varieties. Ten sorghum varieties were evaluated in randomize complete block design with 2 replicates across two environments. Data were recorded on plant height, days to 50% flowering, number of productive tillers, panicle length, panicle width, panicle weight, 100 seed mass and grain yield. Mean squares were significant (P≤0.05) for all traits in the individual and combined analysis of variance, implying high variation in the sorghum population. Panicle length, panicle width, Dry panicle weight and 100 seed mass could be employed as target traits to improving grain yield. All the traits evaluated exhibited high genotypic and phenotypic components of variance than environmental variance, showing that characters in the population was genetically controlled and can be exploited in breeding programs. High heritability and estimated genetic advance as percentage of mean for most of the traits indicates the presence of additive genes and suggested reliable sorghum improvement through selection for the traits. Grain yield was significant and positively associated with days to 50% flowering, number of fertile tillers, panicle width, dry panicle weight and 100 seed mass.

Create successful ePaper yourself
Turn your PDF publications into a flip-book with our unique Google optimized e-Paper software.
Int. J. Agron. Agri. R.<br />
Significant (p≤0.05) positive associations were<br />
observed between dry panicle weight with days to<br />
50% flower<strong>in</strong>g (r =0.77), number of tillers (r =0.32),<br />
panicle length (r =0.65) <strong>and</strong> panicle width (r =0.71).<br />
Panicle diameter was highly significant <strong>and</strong> positively<br />
related to days to 50% flower<strong>in</strong>g (r =0.75) <strong>and</strong> panicle<br />
length (r =0.69). Highly significant positive<br />
association was recorded between panicle length <strong>and</strong><br />
days to 50% flower<strong>in</strong>g (r =0.64). There negative<br />
significant relationships between plant height <strong>and</strong> dry<br />
panicle weight (r = -0.39), hundred seed mass (r = -<br />
0.39) <strong>and</strong> gra<strong>in</strong> yield (r = -0.41).<br />
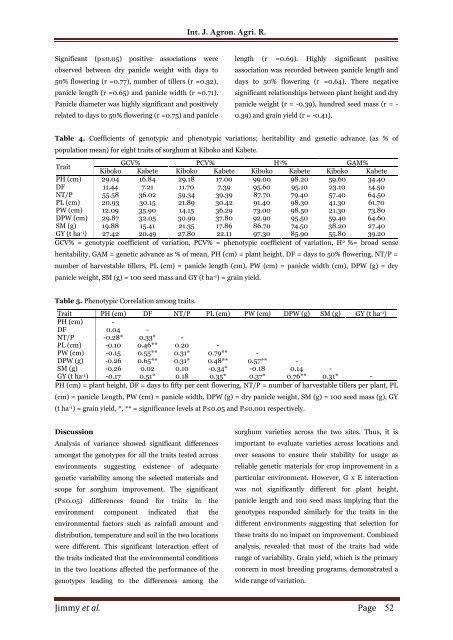
Table 4. Coefficients of genotypic <strong>and</strong> phenotypic variations; <strong>heritability</strong> <strong>and</strong> <strong>genetic</strong> <strong>advance</strong> (as % of<br />
population mean) for eight <strong>trait</strong>s of <strong>sorghum</strong> at Kiboko <strong>and</strong> Kabete.<br />
Trait<br />
GCV% PCV% H 2 % GAM%<br />
Kiboko Kabete Kiboko Kabete Kiboko Kabete Kiboko Kabete<br />
PH (cm) 29.04 16.84 29.18 17.00 99.00 98.20 59.60 34.40<br />
DF 11.44 7.21 11.70 7.39 95.60 95.10 23.10 14.50<br />
NT/P 55.58 36.02 59.34 39.39 87.70 79.40 57.40 64.50<br />
PL (cm) 20.93 30.15 21.89 30.42 91.40 98.30 41.30 61.70<br />
PW (cm) 12.09 35.90 14.15 36.29 73.00 98.50 21.30 73.80<br />
DPW (cm) 29.87 32.05 30.99 37.80 92.90 95.50 59.40 64.60<br />
SM (g) 19.88 15.41 21.35 17.86 86.70 74.50 38.20 27.40<br />
GY (t ha -1 ) 27.42 20.49 27.80 22.11 97.30 85.90 55.80 39.20<br />
GCV% = genotypic coefficient of variation, PCV% = phenotypic coefficient of variation, H 2 %= broad sense<br />
<strong>heritability</strong>, GAM = <strong>genetic</strong> <strong>advance</strong> as % of mean, PH (cm) = plant height, DF = days to 50% flower<strong>in</strong>g, NT/P =<br />
number of harvestable tillers, PL (cm) = panicle length (cm), PW (cm) = panicle width (cm), DPW (g) = dry<br />
panicle weight, SM (g) = 100 seed mass <strong>and</strong> GY (t ha -1 ) = gra<strong>in</strong> yield.<br />
Table 5. Phenotypic Correlation among <strong>trait</strong>s.<br />
Trait PH (cm) DF NT/P PL (cm) PW (cm) DPW (g) SM (g) GY (t ha -1 )<br />
PH (cm) -<br />
DF 0.04 -<br />
NT/P -0.28* 0.33* -<br />
PL (cm) -0.10 0.46** 0.20 -<br />
PW (cm) -0.15 0.55** 0.31* 0.79** -<br />
DPW (g) -0.26 0.65** 0.31* 0.48** 0.57** -<br />
SM (g) -0.26 0.02 0.10 -0.34* -0.18 0.14 -<br />
GY (t ha -1 ) -0.17 0.51* 0.18 0.35* 0.37* 0.76** 0.31* -<br />
PH (cm) = plant height, DF = days to fifty per cent flower<strong>in</strong>g, NT/P = number of harvestable tillers per plant, PL<br />
(cm) = panicle Length, PW (cm) = panicle width, DPW (g) = dry panicle weight, SM (g) = 100 seed mass (g), GY<br />
(t ha -1 ) = gra<strong>in</strong> yield, *, ** = significance levels at P≤0.05 <strong>and</strong> P≤0.001 respectively.<br />
Discussion<br />
Analysis of variance showed significant differences<br />
amongst the genotypes for all the <strong>trait</strong>s tested across<br />
environments suggest<strong>in</strong>g existence of adequate<br />
<strong>genetic</strong> <strong>variability</strong> among the <strong>selected</strong> materials <strong>and</strong><br />
scope for <strong>sorghum</strong> improvement. The significant<br />
(P≤0.05) differences found for <strong>trait</strong>s <strong>in</strong> the<br />
environment component <strong>in</strong>dicated that the<br />
environmental factors such as ra<strong>in</strong>fall amount <strong>and</strong><br />
distribution, temperature <strong>and</strong> soil <strong>in</strong> the two locations<br />
were different. This significant <strong>in</strong>teraction effect of<br />
the <strong>trait</strong>s <strong>in</strong>dicated that the environmental conditions<br />
<strong>in</strong> the two locations affected the performance of the<br />
genotypes lead<strong>in</strong>g to the differences among the<br />
<strong>sorghum</strong> <strong>varieties</strong> across the two sites. Thus, it is<br />
important to evaluate <strong>varieties</strong> across locations <strong>and</strong><br />
over seasons to ensure their stability for usage as<br />
reliable <strong>genetic</strong> materials for crop improvement <strong>in</strong> a<br />
particular environment. However, G x E <strong>in</strong>teraction<br />
was not significantly different for plant height,<br />
panicle length <strong>and</strong> 100 seed mass imply<strong>in</strong>g that the<br />
genotypes responded similarly for the <strong>trait</strong>s <strong>in</strong> the<br />
different environments suggest<strong>in</strong>g that selection for<br />
these <strong>trait</strong>s do no impact on improvement. Comb<strong>in</strong>ed<br />
analysis, revealed that most of the <strong>trait</strong>s had wide<br />
range of <strong>variability</strong>. Gra<strong>in</strong> yield, which is the primary<br />
concern <strong>in</strong> most breed<strong>in</strong>g programs, demonstrated a<br />
wide range of variation.<br />
Jimmy et al. Page 52


