

Genetic variability, heritability, genetic advance and trait correlations in selected sorghum (Sorghum bicolor L. Moench) varieties
Abstract Study was carried out to estimate the genetic variability, heritability and genetic advance as well as association between yield and yield related traits in selected sorghum varieties. Ten sorghum varieties were evaluated in randomize complete block design with 2 replicates across two environments. Data were recorded on plant height, days to 50% flowering, number of productive tillers, panicle length, panicle width, panicle weight, 100 seed mass and grain yield. Mean squares were significant (P≤0.05) for all traits in the individual and combined analysis of variance, implying high variation in the sorghum population. Panicle length, panicle width, Dry panicle weight and 100 seed mass could be employed as target traits to improving grain yield. All the traits evaluated exhibited high genotypic and phenotypic components of variance than environmental variance, showing that characters in the population was genetically controlled and can be exploited in breeding programs. High heritability and estimated genetic advance as percentage of mean for most of the traits indicates the presence of additive genes and suggested reliable sorghum improvement through selection for the traits. Grain yield was significant and positively associated with days to 50% flowering, number of fertile tillers, panicle width, dry panicle weight and 100 seed mass.
Abstract
Study was carried out to estimate the genetic variability, heritability and genetic advance as well as association between yield and yield related traits in selected sorghum varieties. Ten sorghum varieties were evaluated in randomize complete block design with 2 replicates across two environments. Data were recorded on plant height, days to 50% flowering, number of productive tillers, panicle length, panicle width, panicle weight, 100 seed mass and grain yield. Mean squares were significant (P≤0.05) for all traits in the individual and combined analysis of variance, implying high variation in the sorghum population. Panicle length, panicle width, Dry panicle weight and 100 seed mass could be employed as target traits to improving grain yield. All the traits evaluated exhibited high genotypic and phenotypic components of variance than environmental variance, showing that characters in the population was genetically controlled and can be exploited in breeding programs. High heritability and estimated genetic advance as percentage of mean for most of the traits indicates the presence of additive genes and suggested reliable sorghum improvement through selection for the traits. Grain yield was significant and positively associated with days to 50% flowering, number of fertile tillers, panicle width, dry panicle weight and 100 seed mass.

You also want an ePaper? Increase the reach of your titles
YUMPU automatically turns print PDFs into web optimized ePapers that Google loves.
Int. J. Agron. Agri. R.<br />
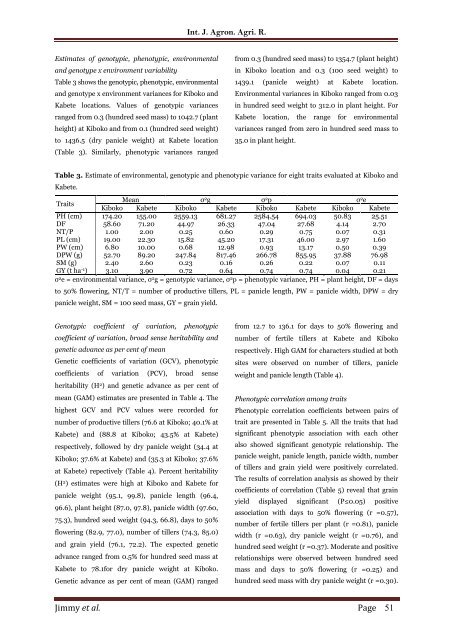
Estimates of genotypic, phenotypic, environmental<br />
<strong>and</strong> genotype x environment <strong>variability</strong><br />
Table 3 shows the genotypic, phenotypic, environmental<br />
<strong>and</strong> genotype x environment variances for Kiboko <strong>and</strong><br />
Kabete locations. Values of genotypic variances<br />
ranged from 0.3 (hundred seed mass) to 1042.7 (plant<br />
height) at Kiboko <strong>and</strong> from 0.1 (hundred seed weight)<br />
to 1436.5 (dry panicle weight) at Kabete location<br />
(Table 3). Similarly, phenotypic variances ranged<br />
from 0.3 (hundred seed mass) to 1354.7 (plant height)<br />
<strong>in</strong> Kiboko location <strong>and</strong> 0.3 (100 seed weight) to<br />
1439.1 (panicle weight) at Kabete location.<br />
Environmental variances <strong>in</strong> Kiboko ranged from 0.03<br />
<strong>in</strong> hundred seed weight to 312.0 <strong>in</strong> plant height. For<br />
Kabete location, the range for environmental<br />
variances ranged from zero <strong>in</strong> hundred seed mass to<br />
35.0 <strong>in</strong> plant height.<br />
Table 3. Estimate of environmental, genotypic <strong>and</strong> phenotypic variance for eight <strong>trait</strong>s evaluated at Kiboko <strong>and</strong><br />
Kabete.<br />
Traits<br />
Mean σ 2 g σ 2 p σ 2 e<br />
Kiboko Kabete Kiboko Kabete Kiboko Kabete Kiboko Kabete<br />
PH (cm) 174.20 155.00 2559.13 681.27 2584.54 694.03 50.83 25.51<br />
DF 58.60 71.20 44.97 26.33 47.04 27.68 4.14 2.70<br />
NT/P 1.00 2.00 0.25 0.60 0.29 0.75 0.07 0.31<br />
PL (cm) 19.00 22.30 15.82 45.20 17.31 46.00 2.97 1.60<br />
PW (cm) 6.80 10.00 0.68 12.98 0.93 13.17 0.50 0.39<br />
DPW (g) 52.70 89.20 247.84 817.46 266.78 855.95 37.88 76.98<br />
SM (g) 2.40 2.60 0.23 0.16 0.26 0.22 0.07 0.11<br />
GY (t ha -1 ) 3.10 3.90 0.72 0.64 0.74 0.74 0.04 0.21<br />
σ 2 e = environmental variance, σ 2 g = genotypic variance, σ 2 p = phenotypic variance, PH = plant height, DF = days<br />
to 50% flower<strong>in</strong>g, NT/T = number of productive tillers, PL = panicle length, PW = panicle width, DPW = dry<br />
panicle weight, SM = 100 seed mass, GY = gra<strong>in</strong> yield.<br />
Genotypic coefficient of variation, phenotypic<br />
coefficient of variation, broad sense <strong>heritability</strong> <strong>and</strong><br />
<strong>genetic</strong> <strong>advance</strong> as per cent of mean<br />
<strong>Genetic</strong> coefficients of variation (GCV), phenotypic<br />
coefficients of variation (PCV), broad sense<br />
<strong>heritability</strong> (H 2 ) <strong>and</strong> <strong>genetic</strong> <strong>advance</strong> as per cent of<br />
mean (GAM) estimates are presented <strong>in</strong> Table 4. The<br />
highest GCV <strong>and</strong> PCV values were recorded for<br />
number of productive tillers (76.6 at Kiboko; 40.1% at<br />
Kabete) <strong>and</strong> (88.8 at Kiboko; 43.5% at Kabete)<br />
respectively, followed by dry panicle weight (34.4 at<br />
Kiboko; 37.6% at Kabete) <strong>and</strong> (35.3 at Kiboko; 37.6%<br />
at Kabete) repectively (Table 4). Percent <strong>heritability</strong><br />
(H 2 ) estimates were high at Kiboko <strong>and</strong> Kabete for<br />
panicle weight (95.1, 99.8), panicle length (96.4,<br />
96.6), plant height (87.0, 97.8), panicle width (97.60,<br />
75.3), hundred seed weight (94.3, 66.8), days to 50%<br />
flower<strong>in</strong>g (82.9, 77.0), number of tillers (74.3, 85.0)<br />
<strong>and</strong> gra<strong>in</strong> yield (76.1, 72.2). The expected <strong>genetic</strong><br />
<strong>advance</strong> ranged from 0.5% for hundred seed mass at<br />
Kabete to 78.1for dry panicle weight at Kiboko.<br />
<strong>Genetic</strong> <strong>advance</strong> as per cent of mean (GAM) ranged<br />
from 12.7 to 136.1 for days to 50% flower<strong>in</strong>g <strong>and</strong><br />
number of fertile tillers at Kabete <strong>and</strong> Kiboko<br />
respectively. High GAM for characters studied at both<br />
sites were observed on number of tillers, panicle<br />
weight <strong>and</strong> panicle length (Table 4).<br />
Phenotypic correlation among <strong>trait</strong>s<br />
Phenotypic correlation coefficients between pairs of<br />
<strong>trait</strong> are presented <strong>in</strong> Table 5. All the <strong>trait</strong>s that had<br />
significant phenotypic association with each other<br />
also showed significant genotypic relationship. The<br />
panicle weight, panicle length, panicle width, number<br />
of tillers <strong>and</strong> gra<strong>in</strong> yield were positively correlated.<br />
The results of correlation analysis as showed by their<br />
coefficients of correlation (Table 5) reveal that gra<strong>in</strong><br />
yield displayed significant (P≤0.05) positive<br />
association with days to 50% flower<strong>in</strong>g (r =0.57),<br />
number of fertile tillers per plant (r =0.81), panicle<br />
width (r =0.63), dry panicle weight (r =0.76), <strong>and</strong><br />
hundred seed weight (r =0.37). Moderate <strong>and</strong> positive<br />
relationships were observed between hundred seed<br />
mass <strong>and</strong> days to 50% flower<strong>in</strong>g (r =0.25) <strong>and</strong><br />
hundred seed mass with dry panicle weight (r =0.30).<br />
Jimmy et al. Page 51


