You also want an ePaper? Increase the reach of your titles
YUMPU automatically turns print PDFs into web optimized ePapers that Google loves.
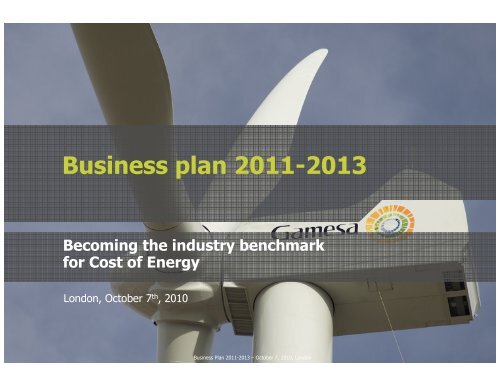
Business plan 2011-2013<br />
Becoming the industry benchmark<br />
for Cost of Energy<br />
<strong>WORK</strong> <strong>IN</strong> <strong>PROGRESS</strong><br />
London, October 7 th , 2010<br />
Business Plan 2011-2013 – October 7, 2010, London<br />
"A4rb_speech" – 20100111 – do not delete this text
Contents Page<br />
A. New industry environment 3<br />
B. <strong>Gamesa</strong>'s value proposition:<br />
Reliable partner that maximizes the return of wind power projects 16<br />
C. Three strategic vectors: 28<br />
- Cost of Energy 30<br />
- Growth 41<br />
- Efficiency 60<br />
D. Financial targets 72<br />
E. Conclusions 77<br />
Business Plan 2011-2013 – October 7, 2010, London<br />
2<br />
"A4rb_speech" – 20100111 – do not delete this text
A.New industry environment<br />
<strong>WORK</strong> <strong>IN</strong> <strong>PROGRESS</strong><br />
Business Plan 2011-2013 – October 7, 2010, London<br />
3<br />
"A4rb_speech" – 20100111 – do not delete this text
A NEW <strong>IN</strong>DUSTRY ENVIRONMENT<br />
The wind industry is transforming itself rapidly<br />
THE SLOWDOWN<br />
OF 2009 AND<br />
2010 HAS<br />
TRANSFORMED<br />
THE W<strong>IN</strong>D<br />
<strong>IN</strong>DUSTRY<br />
1<br />
2<br />
3<br />
MARKET:<br />
CLIENTS:<br />
SUPPLIERS:<br />
o Recent volatility driven by regulatory uncertainty<br />
o Long term growth trend supported by:<br />
o Onshore in Europe through Eastern Europe<br />
o Growth coming from Asia and other emerging markets<br />
– plus US once regulation clarifies<br />
o Offshore taking off after 2013<br />
o Wind technology close to grid parity/acceptance as<br />
established generation technology in relevant markets<br />
o Moving towards professional operators – utilities and large<br />
IPPs- seeking reliable, long term WTM partners that offer<br />
expertise along the whole value chain<br />
o Wind power internationalization requires WTM global support<br />
Basis for competition is offering the best possible CoE as a<br />
combination of project CAPEX, O&M costs, performance and<br />
availability over the wind farm's life<br />
o Large industrial conglomerates (Western present, Asian<br />
entering) have increased their market share at the expense<br />
of pioneers<br />
o Smaller, local players are reducing their presence<br />
Business Plan 2011-2013 – October 7, 2010, London<br />
4<br />
"A4rb_speech" "A4rb_speech" – 20100111 – do not delete this text
A NEW <strong>IN</strong>DUSTRY – DEMAND<br />
But the growth fundamentals are still in place<br />
ENERGY<br />
SECURITY<br />
CLIMATE<br />
CONCERNS<br />
W<strong>IN</strong>D<br />
DRIVERS<br />
AFFORDABILITY<br />
OF ENERGY<br />
Business Plan 2011-2013 – October 7, 2010, London<br />
WHY W<strong>IN</strong>D?<br />
o Reduces CO 2 emissions<br />
o Reduces dependence from<br />
fossil resources<br />
o Increases energy security<br />
o Increases price stability<br />
Competitive<br />
Cost of Energy (CoE) is<br />
key<br />
5<br />
"A4rb_speech" "A4rb_speech" – 20100111 – do not delete this text
A NEW <strong>IN</strong>DUSTRY – DEMAND<br />
Despite the slow down, there is an unbroken growth<br />
trend<br />
Incremental wind power capacity (GW)<br />
CAGR (%) PER GEOGRAPHY, 2013<br />
42%<br />
2005-2008<br />
13%<br />
2010-2013<br />
Source: BTM; GWEC; EER; Companies; Press;<br />
Roland Berger Strategy Consultants<br />
12%<br />
2013-2014<br />
Business Plan 2011-2013 – October 7, 2010, London<br />
Portugal<br />
Brazil Turkey<br />
Italy 2%<br />
Canada 4% 1%<br />
5%<br />
Spain<br />
3%<br />
4%<br />
UK 5%<br />
France 5%<br />
Germany<br />
6%<br />
India<br />
6%<br />
25%<br />
USA<br />
32%<br />
China<br />
6<br />
"A4rb_speech" "A4rb_speech" – 20100111 – do not delete this text
A NEW <strong>IN</strong>DUSTRY – DEMAND<br />
With attractive opportunities mostly in emerging<br />
markets<br />
Wind power market attractiveness, 2010-2020<br />
Already<br />
attractive<br />
BY<br />
MARKET<br />
ATTRACTIVE-<br />
NESS<br />
Expected to<br />
improve<br />
attractiveness<br />
1) Load factor (%)<br />
Incentives x LF 1)<br />
EUR/MWh<br />
60<br />
50<br />
40<br />
30<br />
20<br />
10<br />
0<br />
0<br />
Germany<br />
Spain Portugal<br />
Mature wind countries<br />
Large<br />
today<br />
Italy<br />
USA<br />
US<br />
High growth<br />
potential<br />
France<br />
China<br />
UK<br />
India<br />
Business Plan 2011-2013 – October 7, 2010, London<br />
Turkey<br />
Countries still in an<br />
"embryonic stage"<br />
Canada<br />
Brazil<br />
9 12 15 18 21 24 27 30 33 36<br />
Size = Installed capacity (GW)<br />
BY MARKET GROWTH<br />
Growth<br />
potential<br />
Installed wind<br />
capacity CAGR<br />
2010-2013<br />
7<br />
"A4rb_speech" "A4rb_speech" – 20100111 – do not delete this text
A NEW <strong>IN</strong>DUSTRY – DEMAND<br />
Offshore "is here" and expected to takeoff after<br />
2013<br />
Offshore, 2006-2014 (accumulated installed capacity, GW)<br />
16<br />
14<br />
12<br />
10<br />
8<br />
6<br />
4<br />
2<br />
0<br />
Actual<br />
Forecasts<br />
converged<br />
BTM<br />
2006<br />
2.9 GW<br />
BTM<br />
2008<br />
2003 2004 2005 2006 2007 2008 2009 2010 2011 2012 2013 2014<br />
BTM<br />
2010<br />
<strong>Gamesa</strong><br />
estimates<br />
Key players'<br />
purchasing<br />
decision<br />
timeframe<br />
Source: BTM 2004, 2006, 2008, 2010; 4C Offshore database; thewindpower.net; Roland Berger Strategy Consultants<br />
Business Plan 2011-2013 – October 7, 2010, London<br />
o Large utilities will drive market<br />
development<br />
o Purchasing decisions around<br />
2012/13, following explicit<br />
commitments and bidding processes<br />
of German and UK governments<br />
o Offshore projects will still take 2-<br />
5 years to mature – more<br />
ambitious annual growths only<br />
after 2015<br />
8<br />
"A4rb_speech" – 20100111 – do not delete this text
A NEW <strong>IN</strong>DUSTRY – DEMAND<br />
Starting in the North Sea, China and US to follow<br />
Annual added offshore capacity, 2009-2020 (GW)<br />
0,0<br />
2009<br />
USA EUROPE (North Sea) CH<strong>IN</strong>A<br />
0,3<br />
2013<br />
1,3<br />
2020<br />
1) Recently announced by the Chinese govt. (cumulative)<br />
Source: BTM; EWEA; DENA; EER; Airtricity;<br />
Roland Berger Strategy Consultants<br />
0,6<br />
1,4<br />
4,4<br />
2009 2013 2020<br />
2009 2013 2020<br />
Business Plan 2011-2013 – October 7, 2010, London<br />
0,1<br />
0,1<br />
5-10 1)<br />
0,7<br />
9<br />
"A4rb_speech" "A4rb_speech" – 20100111 – do not delete this text
A NEW <strong>IN</strong>DUSTRY – DEMAND<br />
Regulatory outlook positive in most markets<br />
Regulatory outlook mostly positive with uncertainty in the US and Southern<br />
Europe<br />
USA UK<br />
CH<strong>IN</strong>A<br />
o UNTIL NOW – American Recovery and<br />
Reinvestment Act (2009). Extension of<br />
PTC until Dec. 2012, introduction of ITC,<br />
Treasury Cash Grants, manufacturing tax<br />
credits, and DOE loan guarantee programme.<br />
o OUTLOOK – RES 1) under discussion, but<br />
positive perspectives in the M/T: a<br />
bipartisan group of senators reintroduced a<br />
RES 1) bill (Sep. 2010)<br />
BRAZIL<br />
o UNTIL NOW – PRO<strong>IN</strong>FA 2) scheme to boost<br />
the share of renewable energy sources in the<br />
Brazilian electricity mix. Capacity allocated<br />
through auctions: 1st wind auction in Dec.<br />
2009 (1 GW), 2 nd auction in Aug. 2010 (c. 2<br />
GW) with an average price of R$/MWh 131<br />
o OUTLOOK – PRO<strong>IN</strong>FA’s main objective is to<br />
increase the share of renewable energy<br />
up to 10% of Brazil’s electricity supply<br />
by 2020<br />
o UNTIL NOW – two support mechanisms,<br />
ROCs 3) (large facilities) and FIT (small<br />
facilities). Additional financial support for<br />
offshore wind<br />
o OUTLOOK – target of reaching 15% of final<br />
energy consumption from renewable sources<br />
by 2020 and 25 GW additional offshore<br />
(UK earmarked up to GBP 120 m to<br />
support offshore wind industry)<br />
CONT<strong>IN</strong>ENTAL EUROPE<br />
o UNTIL NOW – Feed it tariffs with<br />
significant differences among countries.<br />
Reduced incentives due to current<br />
budgetary shortages<br />
o OUTLOOK – explicit commitment with<br />
sustainability. Ambitious targets in emission<br />
reductions and renewable generation –<br />
Energy-Climate package (20/20/20)<br />
1) Renewable Electricity Standard; 2) "Programa de Incentivo às Fontes Alternativas de Energia Elétrica";<br />
3) Renewables Obligation Certificates<br />
Business Plan 2011-2013 – October 7, 2010, London<br />
o UNTIL NOW – obligation to purchase the full<br />
amount of the electricity produced from<br />
renewable sources: Wind energy as a<br />
priority to diversify the energy mix. Feed<br />
in Tariff scheme introduced in 2009.<br />
Target of 100 GW by 2020 for wind power.<br />
o OUTLOOK – “ Development of the<br />
Emerging Energy Industry Plan” and<br />
12th five year plan (2011-2015)<br />
<strong>IN</strong>DIA<br />
o UNTIL NOW –Incentives for wind introduced<br />
at state level – RPS 1) and financial<br />
incentives as well as Feed in Tariffs.<br />
Introduction of generation based<br />
incentive in December.<br />
o OUTLOOK – 10% contribution of<br />
renewable energy sources by 2015.<br />
National renewable energy policy currently<br />
under consideration<br />
10<br />
"A4rb_speech" – 20100111 – do not delete this text
A NEW <strong>IN</strong>DUSTRY – CLIENTS<br />
Utilities and large operators are driving industry<br />
consolidation<br />
Client mix in owned MW – Europe (% market share)<br />
Investors<br />
65%<br />
7% +5% 15%<br />
7% +1% 7%<br />
21% +2% 20%<br />
2002<br />
Other IPPs<br />
-7%<br />
Top 20 IPPs<br />
Source: EER; Roland Berger Strategy Consultants<br />
58%<br />
2004<br />
Utilities<br />
-24%<br />
-2%<br />
+6%<br />
+20%<br />
35%<br />
12%<br />
15%<br />
38%<br />
2010<br />
Business Plan 2011-2013 – October 7, 2010, London<br />
o Utilities building up<br />
portfolios domestically<br />
to fulfill renewable<br />
obligations<br />
o Utilities expanding into<br />
new markets via wind<br />
o Many new IPPs created by<br />
Private Equities,<br />
construction, oil – aiming<br />
to sell their portfolios to<br />
utilities<br />
o More traditional developers<br />
looking to evolve into wind<br />
IPPs<br />
11<br />
"A4rb_speech" – 20100111 – do not delete this text
A NEW <strong>IN</strong>DUSTRY – CLIENTS<br />
While aiming at fulfilling renewable targets and<br />
gaining operational scale<br />
Utilities and large operators – key trends<br />
MA<strong>IN</strong>STREAM TECHNOLOGY:<br />
o Renewables units moving from "exotic" nice-to-have to<br />
mainstream generation units with similar targets and requirements<br />
o Generation equipment sourced through same procedures as<br />
conventional equipment<br />
GRADUAL APPROACH:<br />
o Wind gradually added into the generation portfolios<br />
o Major acquisitions to support growth while building up internal<br />
teams to perform activities in-house<br />
<strong>IN</strong>TERNATIONAL:<br />
o Venture outside home markets with renewable technologies<br />
as they are more "predictable" and seen as less aggressive by<br />
incumbents<br />
Source: EWEA; Roland Berger Strategy Consultants<br />
Business Plan 2011-2013 – October 7, 2010, London<br />
o Utilities have<br />
steadily migrated<br />
from risk-averse<br />
turnkey project<br />
acquisition, to<br />
greater vertical<br />
integration to<br />
capture more value<br />
o Advanced<br />
operators use wind<br />
power as "peakers"<br />
in their generation<br />
portfolio<br />
12<br />
"A4rb_speech" – 20100111 – do not delete this text
A NEW <strong>IN</strong>DUSTRY – COMPETITION<br />
Pioneer manufacturers maintain the lead in market<br />
share<br />
Main players in the industry, 2009 (market share; size)<br />
500 MW<br />
PIONEERS<br />
(41% MS)<br />
Source: Companies; BTM, Roland Berger Strategy Consultants<br />
CONGLOMERATES (22% MS) LOCALS<br />
(37% MS)<br />
Business Plan 2011-2013 – October 7, 2010, London<br />
13<br />
"A4rb_speech" – 20100111 – do not delete this text
A NEW <strong>IN</strong>DUSTRY – COMPETITION<br />
While local and international operators fight their<br />
way in their markets<br />
Local vs. international WTM per region, 2005-2009 (Installed GW per year; market share)<br />
USA EUROPE + RoW <strong>IN</strong>DIA<br />
2.5 GW 8.6 GW 8.2 GW 15.5 GW<br />
61%<br />
39%<br />
2005<br />
Local<br />
Foreign<br />
53%<br />
47%<br />
2009<br />
Source: BTM; Roland Berger Strategy Consultants<br />
83%<br />
17%<br />
2005<br />
81%<br />
19%<br />
2009<br />
1.3 GW<br />
63%<br />
37%<br />
2005<br />
Business Plan 2011-2013 – October 7, 2010, London<br />
1.2 GW<br />
81%<br />
19%<br />
2009<br />
CH<strong>IN</strong>A<br />
0.5 GW<br />
28%<br />
72%<br />
2005<br />
14.0 GW<br />
82%<br />
18%<br />
2009<br />
14<br />
"A4rb_speech" – 20100111 – do not delete this text
A NEW <strong>IN</strong>DUSTRY – OUTLOOK<br />
Positive outlook with competitive CoE a key for<br />
success<br />
Characteristics of the "new wind industry"<br />
DEMAND<br />
CLIENTS<br />
COMPETITION<br />
o Despite current single digit growth, unbroken trend<br />
o Shift in demand to new geographies (China, India)<br />
o CoE reduction decreases regulatory dependency<br />
o Offshore still developing – takeoff only after 2013<br />
o More sophisticated customers<br />
o Move towards utilities and IPPs<br />
o Clients seek long term partners<br />
o Demand for expertise along the value chain – industry<br />
internationalization requires WTM global support<br />
o Western players are differentiating technologically<br />
o New players continuously entering, particularly in Low<br />
Cost Countries (LCCs)<br />
Business Plan 2011-2013 – October 7, 2010, London<br />
TAKEAWAYS<br />
� Be global<br />
� CoE competitive<br />
� Be close<br />
� Be integrated<br />
� Be technologically<br />
innovative<br />
� Be cost efficient<br />
15<br />
"A4rb_speech" "A4rb_speech" – 20100111 – do not delete this text
Business Plan 2011-2013 – October 7, 2010, London<br />
16<br />
B. <strong>Gamesa</strong>'s value proposition<br />
"A4rb_speech" – 20100111 – do not delete this text
B VISION AND VALUE PROPOSITION<br />
Value proposition based on client expectations<br />
GAMESA VALUE PROPOSITION<br />
Competitive CoE<br />
Superior reliability and service offering<br />
The right products with superior technology<br />
Extensive geographical presence<br />
Flexible response times<br />
Business Plan 2011-2013 – October 7, 2010, London<br />
17<br />
"A4rb_speech" "A4rb_speech" – 20100111 – do not delete this text
B KEY DIFFERENTIAT<strong>IN</strong>G FACTORS<br />
A proven track record<br />
6<br />
5<br />
Profitable through the<br />
economic cycle<br />
Consistent delivery on<br />
business plans<br />
4 Financially sound Integrated player<br />
3<br />
Business Plan 2011-2013 – October 7, 2010, London<br />
Global company<br />
Consistent<br />
technology innovation<br />
1<br />
2<br />
18<br />
"A4rb_speech" "A4rb_speech" – 20100111 – do not delete this text
B 1<br />
GLOBAL COMPANY<br />
Global player in activity, management and<br />
financing<br />
<strong>Gamesa</strong> is a global company<br />
3,145 MW sold worldwide, 2009 Syndicated loan<br />
Rest of Europe<br />
32%<br />
73%<br />
RoW<br />
11%<br />
15%<br />
China<br />
27%<br />
15%<br />
Domestic<br />
USA<br />
…<br />
Business Plan 2011-2013 – October 7, 2010, London<br />
Global banks<br />
55%<br />
45% Domestic banks<br />
o More than half of the<br />
participants in current<br />
syndicated loan (EUR 1.2 bn) are<br />
global banks<br />
o The contribution of those<br />
international institutions amounts<br />
up to c. 40% of the<br />
authorized limit<br />
19<br />
"A4rb_speech" "A4rb_speech" – 20100111 – do not delete this text
✓<br />
✓<br />
✓<br />
✓<br />
✓<br />
✓<br />
✓<br />
✓<br />
B 1 GLOBAL COMPANY<br />
Global client base and footprint<br />
Top 10 wind power ranking, 2009<br />
Long<br />
Yuan<br />
Datang<br />
2.1<br />
1.9<br />
3.0<br />
2.9<br />
2.7<br />
4.5<br />
6.7<br />
6.2<br />
6.2<br />
✓ <strong>Gamesa</strong> clients<br />
Source: BTM; Macquarie; Roland Berger Strategy Consultants<br />
10.4<br />
Footprint<br />
Manufacturing facilities<br />
(blades and nacelles)<br />
Business Plan 2011-2013 – October 7, 2010, London<br />
20<br />
"A4rb_speech" "A4rb_speech" – 20100111 – do not delete this text
B 2 CONSISTENT TECHNOLOGY <strong>IN</strong>NOVATION<br />
Product innovation to cover >90% of existing<br />
installations<br />
Product line, 2005-2009 (vs. % installed capacity per WTG segment)<br />
CLASS<br />
I<br />
II<br />
III<br />
93%<br />
13% 80% 5% 2%<br />
G52<br />
G58<br />
G58<br />
G80<br />
G87<br />
G90<br />
G87<br />
G9x<br />
G90 G97<br />
G13X<br />
Sub MW Mainstream Multi MW<br />
Business Plan 2011-2013 – October 7, 2010, London<br />
G128<br />
Existing WTG Announced WTG Prototype stage R&D stage<br />
G11X<br />
OFS<br />
Offshore<br />
WTG<br />
segment<br />
21<br />
"A4rb_speech" "A4rb_speech" – 20100111 – do not delete this text
B 3 <strong>IN</strong>TEGRATED PLAYER<br />
Uniquely positioned as "one-stop-shop"<br />
Value chain presence and track-record, as of Dec. 2009<br />
GAMESA W<strong>IN</strong>D FARMS<br />
PROMOTION<br />
Prospecting<br />
4 GW 18 GW 12 GW<br />
Licensing<br />
1-12 m 12-36 m<br />
<strong>Gamesa</strong>’s experience<br />
Not covered by <strong>Gamesa</strong><br />
1) Engineering, Procurement, Construction<br />
Exworks<br />
delivery<br />
GAMESA<br />
WTG<br />
EPC 1) /Logistics<br />
/ Construction<br />
+ 12-24 m<br />
O&M<br />
Business Plan 2011-2013 – October 7, 2010, London<br />
GAMESA SERVICES<br />
Operation &<br />
Maintenance<br />
GENERATION<br />
Energy<br />
Management<br />
Ongoing during 20+ years<br />
(RE) CYCLE<br />
Repowering/<br />
Decomissioning<br />
22<br />
"A4rb_speech" "A4rb_speech" – 20100111 – do not delete this text
B 4 F<strong>IN</strong>ANCIALLY SOUND<br />
Financially sound without accessing to the equity<br />
markets<br />
Debt structure<br />
Credit facilities, 2010<br />
EUR MM<br />
1,200<br />
200<br />
113<br />
731<br />
c.2,250<br />
Maturity date<br />
October 2012<br />
2018<br />
Long term loans of different<br />
maturities >12 months<br />
Bilateral credit lines with annual<br />
extensions<br />
Business Plan 2011-2013 – October 7, 2010, London<br />
NFD/EBITDA, 2005-2010 (x)<br />
4.3x 4.2x<br />
3.4x<br />
3.3x<br />
3.8x<br />
3.2x<br />
3.7x<br />
2.2x 2.3x<br />
2.0x<br />
1.6x<br />
0.5x<br />
1.2x<br />
0.3x<br />
0.7x 0.7x<br />
0,1x<br />
1.1x<br />
1.6x<br />
0.7x<br />
1.5x<br />
1.1x<br />
1Q 2Q 3Q 4Q 1Q 2Q 3Q 4Q 1Q 2Q 3Q 4Q 1Q 2Q 3Q 4Q 1Q 2Q 3Q 4Q 1Q 2Q<br />
2005 2006 2007 2008 2009 2010<br />
Group NFD/EBITDA<br />
23<br />
"A4rb_speech" "A4rb_speech" – 20100111 – do not delete this text
B 5 SOLID DELIVERY ON BUS<strong>IN</strong>ESS PLANS<br />
Consistent delivery of business plan targets<br />
Fulfillment of business plans since 2000<br />
2000 2001 2005<br />
2009<br />
2000 – IPO<br />
o 2001 Net Profit<br />
• Commited:<br />
• Real:<br />
✓<br />
EUR 61 m<br />
EUR 61 m<br />
"9/11"<br />
2002 – 2004<br />
Business Plan<br />
o 2004 Net Profit<br />
• Commited:<br />
• Real:<br />
✓<br />
EUR 94 m<br />
EUR 163 m<br />
Business Plan 2011-2013 – October 7, 2010, London<br />
2006 – 2008<br />
Business Plan<br />
o 2008 EBITDA<br />
• Commited:<br />
• Real:<br />
MARKET<br />
CONTRACTION<br />
✓<br />
EUR 400 m<br />
EUR 495 m<br />
✓<br />
SUBPRIME<br />
CRISIS<br />
Objectives<br />
achieved<br />
2011 – 2013<br />
Business Plan<br />
24<br />
"A4rb_speech" "A4rb_speech" – 20100111 – do not delete this text
B 5 SOLID DELIVERY ON BUS<strong>IN</strong>ESS PLANS<br />
Consistent quarterly profitability<br />
EBIT evolution per quarter, 2005-2010 (EUR m)<br />
25<br />
1Q<br />
51<br />
2Q<br />
6<br />
3Q<br />
Note: WTG division<br />
11<br />
4Q<br />
33<br />
1Q<br />
36<br />
2Q<br />
39<br />
3Q<br />
55<br />
4Q<br />
23<br />
1Q<br />
39<br />
2Q<br />
35<br />
3Q<br />
36<br />
4Q<br />
2005 2006 2007 2008 2009 2010<br />
39<br />
1Q<br />
73<br />
2Q<br />
Business Plan 2011-2013 – October 7, 2010, London<br />
85<br />
3Q<br />
14<br />
4Q<br />
52<br />
1Q<br />
66<br />
2Q<br />
46<br />
3Q<br />
62<br />
4Q<br />
28<br />
1Q<br />
28<br />
2Q<br />
25<br />
"A4rb_speech" "A4rb_speech" – 20100111 – do not delete this text
B 6 PROFITABLE DOWNTURN MANAGEMENT<br />
Proactive management of the industry downturn<br />
Proactive management of industry downturn, 2007-2010<br />
Activity – worldwide and <strong>Gamesa</strong> (MW)<br />
World<br />
w/ China<br />
World<br />
ex-China<br />
<strong>Gamesa</strong><br />
17,000<br />
2007<br />
3,289<br />
21,000<br />
2008<br />
3,684<br />
23,000<br />
3,145<br />
20,000<br />
2,400-2,500<br />
7.3%<br />
0.5x<br />
2009 2010<br />
2007 2008 2009 2010<br />
Downturn Downturn<br />
Business Plan 2011-2013 – October 7, 2010, London<br />
Group EBIT margin (%) and NFD/EBITDA (x)<br />
6.1%<br />
0.1x<br />
5.5%<br />
0.7x<br />
Growth below market evolution is consistent with a policy of<br />
margins before volumes and production aligned with deliveries<br />
Guidance<br />
B 6 PROFITABLE DOWNTURN MANAGEMENT<br />
While investing in growth and optimizing the cost<br />
structure<br />
Profitable downturn management – specific examples, 2008-2010<br />
P&L management Balance sheet management<br />
o Continuous sales growth in<br />
China, India, USA<br />
o Successful implementation of<br />
the Cost Optimization Plan<br />
o Cost reduction through<br />
capacity adjustments in Spain<br />
(16%manufacturing workforce –<br />
FTE- reduction in Spain in 2009)<br />
Profitable<br />
downturn<br />
management<br />
Business Plan 2011-2013 – October 7, 2010, London<br />
o EUR 1.2 bn syndicated loan<br />
extended from Dec. 2010 to<br />
Oct. 2012<br />
o Alignment of manufacturing<br />
and deliveries – Reduce<br />
manufacturing by 22% in 2010 and<br />
adjust guidance figures provided to<br />
the market in Feb. 2010<br />
o Continuous dividend payment<br />
and no access to equity capital<br />
markets<br />
27<br />
"A4rb_speech" "A4rb_speech" – 20100111 – do not delete this text
C.Three strategic vectors:<br />
Cost of Energy,<br />
Growth and Efficiency<br />
<strong>WORK</strong> <strong>IN</strong> <strong>PROGRESS</strong><br />
Business Plan 2011-2013 – October 7, London<br />
28<br />
"A4rb_speech" – 20100111 – do not delete this text
Value Proposition and strategic vectors<br />
GAMESA'S VALUE PROPOSITION:<br />
"A Client-focused wind power value innovator"<br />
<strong>Gamesa</strong> will…<br />
… deliver wind projects with a<br />
competitive generation cost,<br />
… lead in developing long<br />
lasting relationships,<br />
… offer a complete and flexible<br />
range of leading technology products<br />
and services<br />
… therefore maximizing the<br />
clients wind projects' return<br />
… while optimizing system<br />
integration of wind power<br />
1<br />
2<br />
3<br />
Business Plan 2011-2013 – October 7, 2010, London<br />
STRATEGIC VECTORS<br />
COST OF ENERGY<br />
GROWTH<br />
EFFICIENCY<br />
29<br />
"A4rb_speech" "A4rb_speech" – 20100111 – do not delete this text
Three strategic vectors to achieve<br />
financial targets<br />
1<br />
COST OF ENERGY<br />
3<br />
Business Plan 2011-2013 – October 7, 2010, London<br />
2<br />
GROWTH<br />
EFFICIENCY<br />
30<br />
"A4rb_speech" – 20100111 – do not delete this text
C COST OF ENERGY<br />
<strong>Gamesa</strong>’s differentiation driver to<br />
maximize the value for the customer<br />
RELIABILITY<br />
EFFICIENCY<br />
AVAILABILITY<br />
COST OF ENERGY<br />
[EUR / MWh]<br />
Business Plan 2011-2013 – October 7, 2010, London<br />
����CoE<br />
31<br />
"A4rb_speech" – 20100111 – do not delete this text
C COST OF ENERGY<br />
Becoming the Cost of Energy reference:<br />
30% reduction in 5 years<br />
1a<br />
PRODUCT RANGE<br />
AND PERFORMANCE<br />
1b<br />
FLEET<br />
PERFORMANCE<br />
AND BEST <strong>IN</strong> CLASS<br />
AVAILABILITY<br />
o Ambitious 5-year product plan: 5 new<br />
product families<br />
o Develop the new offshore platform in two<br />
stages, first stage in 2012, second in 2014<br />
o New technologies applied to product platforms<br />
(e.g. permanent magnet generator, medium<br />
speed gearbox, full converter, sectional blade<br />
design, …)<br />
o Maintenance enhancements to lower costs<br />
o Innovative methodologies to minimize<br />
downtimes, energy losses and stoppages<br />
o WTG life extension programs to avoid the<br />
increase of running costs of ageing turbines, and<br />
extend the return of the current projects<br />
Business Plan 2011-2013 – October 7, 2010, London<br />
OBJECTIVES<br />
o <strong>IN</strong> 3 YEARS:<br />
20%<br />
reduction in<br />
Cost of<br />
Energy<br />
o <strong>IN</strong> 5 YEARS:<br />
30%<br />
reduction in<br />
Cost of<br />
Energy<br />
32<br />
"A4rb_speech" – 20100111 – do not delete this text
Reduction to be achieved through product range<br />
and availability improvements<br />
TODAY<br />
CoE<br />
today<br />
C 1a COST OF ENERGY – PRODUCT RANGE AND PERFORMANCE<br />
Impact of levers on CoE (illustrative)<br />
-12%<br />
Product<br />
range and<br />
performance<br />
-8%<br />
Fleet<br />
performance<br />
and<br />
availability<br />
-30%<br />
2013<br />
CoE target<br />
2013<br />
-10%<br />
2015<br />
Innovation CoE target<br />
applied to 2015<br />
product range<br />
Business Plan 2011-2013 – October 7, 2010, London<br />
Supported by …<br />
o Supported by over 1,500,000<br />
engineering hours per year<br />
o To double R&D personnel by 2013<br />
o More than 150 patent<br />
families<br />
55<br />
77 100118150<br />
2005<br />
2006<br />
2007<br />
2008<br />
2009<br />
33<br />
"A4rb_speech" "A4rb_speech" – 20100111 – do not delete this text
C 1a COST OF ENERGY – PRODUCT RANGE AND PERFORMANCE<br />
Ambitious product innovation roadmap<br />
until 2015 …<br />
Innovation roadmap – 5 new product families in 5 years<br />
Sub<br />
MW<br />
Multi<br />
MW<br />
Offshore<br />
2010 2011 2012 2013<br />
G90cII<br />
G58cII<br />
� Current best<br />
in class CoE<br />
G97cIII<br />
G128cII<br />
Know-how<br />
G87cS<br />
Know-how<br />
G11X-<br />
Offshore<br />
G9X-FC<br />
Mark 2<br />
G13xcIII<br />
� Best in<br />
class CoE<br />
G9X-FC<br />
Mark 3<br />
� Best onshore<br />
output per<br />
sqm<br />
� New platform for new<br />
market segment<br />
2014 2015<br />
� Best adaptability to<br />
grid requirements<br />
G12x<br />
Business Plan 2011-2013 – October 7, 2010, London<br />
� Best in class<br />
CoE<br />
G14X-<br />
Offshore<br />
o Technology is<br />
critical to achieve<br />
CoE targets –<br />
<strong>Gamesa</strong> has a clear<br />
product innovation<br />
roadmap until 2015<br />
o Main goals: to be<br />
the benchmark in<br />
CoE and adapt the<br />
product to demand<br />
requirements<br />
o Innovative Multi<br />
MW technologies<br />
(already developed)<br />
to be applied to all<br />
platforms<br />
34<br />
"A4rb_speech" – 20100111 – do not delete this text
C 1a COST OF ENERGY – PRODUCT RANGE AND PERFORMANCE<br />
… added to continuous development of<br />
advanced technologies<br />
Research roadmap, 2010-2015<br />
OFFSHORE<br />
RESEARCH<br />
CONTROL<br />
ROTOR<br />
MATE-<br />
RIALS<br />
W<strong>IN</strong>D<br />
FARM<br />
ENERGY<br />
STORAGE<br />
2010 2011 2012 2013 2014 2015<br />
Windlider 2015<br />
Increasing efficiency<br />
WTG design<br />
UPW<strong>IN</strong>D<br />
8-10 MW Offshore<br />
Technologies<br />
Advance Control System<br />
Generation 1<br />
Advance Rotor<br />
Generation 1<br />
Reliawind<br />
New generation of<br />
more reliable<br />
wind turbines<br />
� Healthy and Environmentally friendly materials<br />
� New materials for wind turbine components<br />
� Advanced Offshore materials<br />
Proto Step 1<br />
Twenties<br />
Wind Farm<br />
Control Technologies<br />
Advance Control System<br />
Generation 2<br />
Advance Rotor<br />
Generation 2<br />
Greengrid<br />
Sustainergy<br />
Very Large Scale Concentrated Energy Storage<br />
Distributed Energy Storage<br />
Proto Step 1<br />
AZIMUT<br />
New Technologies for a<br />
15 MW Offshore<br />
Wind Turbine<br />
Business Plan 2011-2013 – October 7, 2010, London<br />
o Leading several<br />
European projects<br />
on Multi-MW WTG<br />
development and<br />
wind farm<br />
management<br />
o Maintaining the<br />
leading edge in<br />
rotor, control and<br />
material<br />
development<br />
o Leading applied<br />
research in energy<br />
storage<br />
35<br />
"A4rb_speech" – 20100111 – do not delete this text
C 1a COST OF ENERGY – PRODUCT RANGE AND PERFORMANCE<br />
Two development stages for<br />
offshore product platform<br />
Technology projects and offshore platform timeline, until 2015<br />
G11XOFS<br />
Technology project<br />
o In-house design of compliant, reliable,<br />
profitable 5 MW offshore WTG based on<br />
internally developed Multi MW platform<br />
o Expertise in marine technologies (ie.<br />
Northrop Grumman Shipbuilding)<br />
G14XOFS<br />
Technology project<br />
2011 2012 2013 2014 2015<br />
Prototype<br />
(Q2-2012)<br />
o In-house design of compliant, reliable, profitable 6-7 MW<br />
offshore WTG<br />
Serial<br />
production<br />
(2013)<br />
Prototype<br />
(Q2-2014)<br />
Business Plan 2011-2013 – October 7, 2010, London<br />
Serial<br />
production<br />
(2015)<br />
ROADMAP<br />
o Technology ready<br />
for series<br />
production in 2013<br />
o UK: wind turbine<br />
erection starts by<br />
2014<br />
36<br />
"A4rb_speech" – 20100111 – do not delete this text
Bringing the best minds worldwide to the GAMESA<br />
technology team<br />
USA Resident<br />
Engineering<br />
Oxford Valley (PA)<br />
Existing offices<br />
New offices<br />
C 1a COST OF ENERGY – PRODUCT RANGE AND PERFORMANCE<br />
50% of 2013 technology workforce in international centers, global leadership through key partnerships<br />
USA Offshore G11X<br />
Virginia<br />
Sept 2010<br />
EU Technology<br />
(Madrid, Spain)<br />
Technology R&D<br />
Headquarters<br />
Pamplona (Spain)<br />
Brazil Resident<br />
Engineering<br />
TBD<br />
March 2011<br />
UK Offshore G14X<br />
June 2011<br />
EU Technology<br />
Bilbao (Spain)<br />
India Resident<br />
Engineering +<br />
Engineering Office<br />
Chennai<br />
January 2011<br />
Business Plan 2011-2013 – October 7, 2010, London<br />
Materials R&D Office<br />
Singapore<br />
Dec. 2010<br />
China Resident<br />
Engineering<br />
Tianjin<br />
37<br />
"A4rb_speech" – 20100111 – do not delete this text
C 1b<br />
COST OF ENERGY – FLEET PERFORMANCE AND BEST <strong>IN</strong> CLASS AVAILABILITY<br />
Optimizing CoE through wind farm<br />
production improvement and O&M cost<br />
reduction<br />
Impact of availability vs. Opex on CoE<br />
- 1% operational costs + 1% availability<br />
-0.16% in CoE -1.5% in CoE<br />
Cost reduction<br />
Wind farm production<br />
optimization (MWh)<br />
Business Plan 2011-2013 – October 7, 2010, London<br />
o Availability has a<br />
positive impact on<br />
CoE by increasing<br />
energy production<br />
and reducing<br />
operational costs<br />
o Availability has a<br />
much higher impact<br />
on more advanced<br />
and high CAPEX<br />
machines<br />
38<br />
"A4rb_speech" – 20100111 – do not delete this text
C 1b<br />
COST OF ENERGY – FLEET PERFORMANCE AND BEST <strong>IN</strong> CLASS AVAILABILITY<br />
Program set up to improve availability<br />
and fleet performance<br />
DESIGN FOR<br />
RELIABILITY<br />
COMPONENTS<br />
REPAIR<br />
MA<strong>IN</strong>TENANCE<br />
PROGRAMS<br />
SERVICES<br />
SOURC<strong>IN</strong>G<br />
DESCRIPTION (EXAMPLES)<br />
o Integration of field knowledge to change WTG<br />
design<br />
o Reliability centered maintenance<br />
o In-house repairing, reconditioning of small and<br />
large components<br />
o Components stock management close to field<br />
o Improve on large components logistics<br />
o Process automation and innovation<br />
o Scheduled maintenance in low wind conditions<br />
o Predictive and customized maintenance programs<br />
o Performance-based contracts for subcontractors<br />
o Training and certification programs<br />
Business Plan 2011-2013 – October 7, 2010, London<br />
IMPACT<br />
o Availability without<br />
maintenance<br />
o Extension of WTG's useful life<br />
o Reduction of WTG downtime<br />
o New source of income<br />
o Reduction of running costs<br />
o Decreased risk of large<br />
interventions<br />
o Lower manpower costs<br />
o Better service levels<br />
39<br />
"A4rb_speech" – 20100111 – do not delete this text
C 1b<br />
Optimization of preventive program –<br />
better at low winds<br />
From…<br />
COST OF ENERGY – FLEET PERFORMANCE AND BEST <strong>IN</strong> CLASS AVAILABILITY<br />
o Inflexible date of prevention<br />
Power curve<br />
Wind lost<br />
Prevention Wind speed<br />
<strong>Gamesa</strong>’s Wind<br />
forecast technology<br />
application<br />
+<br />
Perform preventive<br />
maintenance in low<br />
wind conditions<br />
+<br />
Adjust preventive<br />
program to specific<br />
conditions of<br />
wind farm<br />
Business Plan 2011-2013 – October 7, 2010, London<br />
To…<br />
o Prevention program scheduled<br />
depending on wind speed<br />
Power curve<br />
Wind lost<br />
Prevention Wind speed<br />
40<br />
"A4rb_speech" – 20100111 – do not delete this text
Three strategic vectors to achieve<br />
financial targets<br />
1<br />
COST OF ENERGY<br />
3<br />
Business Plan 2011-2013 – October 7, 2010, London<br />
2<br />
GROWTH<br />
EFFICIENCY<br />
41<br />
"A4rb_speech" – 20100111 – do not delete this text
C<br />
Grow by serving global markets with<br />
an integrated value proposal<br />
2a<br />
WTG SALES<br />
2b<br />
W<strong>IN</strong>D PROJECTS<br />
DEVELOPMENT<br />
2c<br />
GROWTH<br />
SERVICES<br />
o Access to new product segments (Multi MW; offshore)<br />
o Commercial expansion to new geographies and client<br />
segments<br />
o Proactive tailored offering<br />
o Development and sale of complete wind projects through<br />
<strong>Gamesa</strong> Energía (4 GW know-how) – access to new<br />
clients, like industrial energy consumers<br />
o Advance the business model from pure greenfield and<br />
extend the successful market approach to all markets<br />
o Back-to-back O&M framework contracts<br />
(utilities and IPPs)<br />
o Large components repair and overhaul<br />
Business Plan 2011-2013 – October 7, 2010, London<br />
OBJECTIVES<br />
o 4 GW in 33<br />
target<br />
markets by<br />
2013<br />
o Deliveries of<br />
700 MW p.a.<br />
by 2013<br />
o 24 GW<br />
under O&M<br />
by 2013<br />
42<br />
"A4rb_speech" – 20100111 – do not delete this text
C<br />
GROWTH<br />
4 GW in 33 target markets by 2013<br />
<strong>Gamesa</strong> sales, 2009-2013 (MWe sold; CAGR 09-13)<br />
Note: MWe sold by destination<br />
North America<br />
479<br />
2009<br />
+15%<br />
>800<br />
2013<br />
Central and<br />
South America<br />
93<br />
2009<br />
+50%<br />
>500<br />
2013<br />
Europe and<br />
RoW<br />
2,078<br />
2009<br />
-20%<br />
>800<br />
2013<br />
Business Plan 2011-2013 – October 7, 2010, London<br />
India<br />
16<br />
2009<br />
+166%<br />
>800<br />
2013<br />
China<br />
479<br />
2009<br />
+20%<br />
>1,000<br />
2013<br />
43<br />
"A4rb_speech" – 20100111 – do not delete this text
C 2a<br />
GROWTH – WTG SALES<br />
Six segments according to scale, geography and<br />
corporate typology<br />
Wind power global segmentation<br />
Regional<br />
utilities<br />
IPPs &<br />
Financial<br />
investors<br />
Global utilities<br />
Developers in<br />
emerging markets<br />
Regional<br />
utilities<br />
IPPs &<br />
Financial<br />
Investors<br />
Developers in<br />
emerging markets<br />
Business Plan 2011-2013 – October 7, 2010, London<br />
India's Tax/<br />
IPP investors<br />
Large Chinese<br />
utilities<br />
44<br />
"A4rb_speech" – 20100111 – do not delete this text
C 2a<br />
GROWTH – WTG SALES<br />
Tailored value proposal :<br />
Global utilities, Regional utilities<br />
GLOBAL<br />
UTILITIES<br />
REGIONAL<br />
UTILITIES<br />
CLIENT NEEDS GAMESA'S OFFER<br />
o Flexible multi-geography<br />
multi-project sourcing<br />
o Joint short and medium<br />
term planning<br />
o Quick capacity build up<br />
o Global geographical<br />
expansion<br />
o Large scale O&M<br />
o Reach renewables targets<br />
o Partnering in the full<br />
value chain (from<br />
greenfield to EPC<br />
construction and plant<br />
operation)<br />
o Localized capacity in main<br />
markets<br />
o Global joint planning<br />
experience at large scale<br />
o Full range of products and<br />
services<br />
o Minimum delivery and<br />
construction lead times<br />
o Full services to minimize CoE<br />
o Localized manufacturing<br />
capacity in all main markets<br />
o Full range of products<br />
maximizing NPV and IRR<br />
o Widest experience in all value<br />
chain activities<br />
o Tailored offering<br />
Business Plan 2011-2013 – October 7, 2010, London<br />
o <strong>Gamesa</strong> can leverage in an<br />
extensive experience along the<br />
value chain with most leading<br />
utilities, both globally and<br />
locally. Examples:<br />
• Leading global Utilities such<br />
as Iberdrola, Enel, RWE,<br />
E.ON, EDPR,..<br />
• Many local utilities (Long<br />
Yuan, Datang, China<br />
Guandong Nuclear, ONE,<br />
Comisión Federal de Energía,<br />
NREA, Union Fenosa/Gas<br />
Natural, etc.)<br />
45<br />
"A4rb_speech" – 20100111 – do not delete this text
C 2a<br />
Tailored value proposal :<br />
IPPs/Financial Investors, Industrial companies<br />
IPPs AND<br />
F<strong>IN</strong>ANCIAL<br />
<strong>IN</strong>VESTORS<br />
DEVELOPERS<br />
<strong>IN</strong><br />
EMERG<strong>IN</strong>G<br />
MARKETS<br />
GROWTH – WTG SALES<br />
CLIENT NEEDS GAMESA'S OFFER<br />
o IRR risk related<br />
o Access to project finance<br />
o General outsourcing of<br />
technical activities<br />
o Monetize value of<br />
development lobby and<br />
local development<br />
capabilities<br />
o Minimize equity<br />
o Upside from asset sale –<br />
not from energy sales<br />
o Full technical support<br />
o Products and services that<br />
maximize IRR<br />
o Support on all value chain<br />
activities including support to<br />
structure financing<br />
o Technical support in EPC, grid<br />
integration, certification, etc.<br />
o Business case certainty –<br />
combining development,<br />
efficient WTGs and wind sale<br />
know-how<br />
o Worldwide networking<br />
allowing access to multiple<br />
larger scale investors<br />
o Complete EPC plus long term<br />
O&M commitments<br />
Business Plan 2011-2013 – October 7, 2010, London<br />
o <strong>Gamesa</strong> is applying the<br />
experience gained with<br />
these segments in the<br />
Spanish market to<br />
global (incl. emerging)<br />
markets<br />
o Significant cross-selling<br />
advantages with<br />
<strong>Gamesa</strong> Energía – these<br />
clients tend to prefer<br />
complete solutions for<br />
some markets<br />
46<br />
"A4rb_speech" – 20100111 – do not delete this text
C 2a<br />
GROWTH – WTG SALES<br />
Tailored value proposal :<br />
Chinese utilities, Indian financial<br />
investors<br />
CH<strong>IN</strong>ESE<br />
UTILITIES<br />
<strong>IN</strong>DIA'S<br />
F<strong>IN</strong>ANCIAL/<br />
TAX<br />
<strong>IN</strong>VESTORS<br />
CLIENT NEEDS GAMESA'S OFFER<br />
o Fulfill demanding<br />
yearly installation<br />
targets<br />
o Joint short term<br />
planning<br />
o Focus on capex<br />
o Long term<br />
relationship<br />
o Full control over<br />
construction and<br />
financing<br />
o Tax-driven returns<br />
o Low execution risk<br />
o Investment volume<br />
quickly adapted to<br />
tax needs<br />
o High performance in<br />
low winds with<br />
contained capex<br />
o Strong complete local presence and<br />
track record with most leading<br />
utilities<br />
o Competitive and local supply chain<br />
(cost & time)<br />
o Performance<br />
o Products adapted to local<br />
requirements (high altitude, low<br />
temperature,…)<br />
o In house development capacity<br />
o Adjusted scope minimizing capex<br />
o Products with extensive trackrecord,<br />
lowest capex per MWh and<br />
reduced running O&M costs<br />
o Competitive pricing and local supply<br />
chain (ramp-up underway)<br />
o In house development experience<br />
with proven sites portfolio<br />
Business Plan 2011-2013 – October 7, 2010, London<br />
o <strong>Gamesa</strong> has already long<br />
standing relationships in<br />
China with national<br />
leaders such as Long<br />
Yuan, Datang, China<br />
Guandong Nuclear, …<br />
o Strong growth in India<br />
reveals successful<br />
approach for Tax-driven<br />
Investors – supported<br />
with local content<br />
manufacturing<br />
47<br />
"A4rb_speech" – 20100111 – do not delete this text
C 2a<br />
GROWTH – WTG SALES<br />
New global commercial organization<br />
New commercial organization: 8 regions<br />
North America<br />
Latin<br />
America<br />
South Cone<br />
Europe South<br />
and RoW<br />
Europe North<br />
India<br />
China<br />
Asia Pacific<br />
Business Plan 2011-2013 – October 7, 2010, London<br />
New commercial model<br />
o More time with and<br />
better understanding of<br />
clients<br />
o One commercial<br />
approach for global<br />
clients<br />
o Increased local<br />
presence: 8 regions and<br />
24 local offices<br />
o Reduced response time<br />
+ agility with customers<br />
o Improved work mode<br />
48<br />
"A4rb_speech" – 20100111 – do not delete this text
C 2a<br />
GROWTH – WTG SALES<br />
First results of the new commercial model<br />
- 10 new markets …<br />
Honduras<br />
Costa Rica<br />
Brazil<br />
Sweden<br />
Romania<br />
Bulgaria<br />
Turkey<br />
Kenya<br />
Business Plan 2011-2013 – October 7, 2010, London<br />
India<br />
Sri Lanka<br />
49<br />
"A4rb_speech" – 20100111 – do not delete this text
C 2a<br />
GROWTH – WTG SALES<br />
…and 20 new clients in the last 12 months<br />
o Aresa<br />
o Drace<br />
o Baja Energy<br />
o Enhol<br />
o Fersa<br />
o Bonny<br />
o Viridian<br />
o Volkswind<br />
o Hubei<br />
o China Guandong Nuclear<br />
o Huadian<br />
Customer base expanded<br />
o Triventus<br />
o VAPAT<br />
o Coopesantos<br />
o ABK<br />
o Italcementi<br />
o Datang<br />
o Mesoamerica<br />
o Renovalia<br />
o Indian private customers<br />
o …<br />
Business Plan 2011-2013 – October 7, 2010, London<br />
50<br />
"A4rb_speech" – 20100111 – do not delete this text
C 2a<br />
GROWTH – WTG SALES<br />
Strong expansion of commercial offering<br />
in the next 3 years<br />
Product range extension, (% MWe sold 2013)<br />
80%<br />
80%<br />
New<br />
products<br />
Current<br />
product range<br />
20%<br />
Business Plan 2011-2013 – October 7, 2010, London<br />
Geographical extension, (% MWe sold 2013)<br />
90%<br />
90%<br />
Domestic<br />
market<br />
10%<br />
International<br />
markets<br />
51<br />
"A4rb_speech" – 20100111 – do not delete this text
C 2a<br />
GROWTH – WTG SALES<br />
<strong>Gamesa</strong> backlog<br />
<strong>Gamesa</strong> backlog (in MW as of 01/10/2010)<br />
BACKLOG (inc. long term<br />
framework agreements)<br />
600<br />
2010<br />
1,500<br />
2011<br />
1,200-1,500<br />
per yr.<br />
Beyond<br />
2012<br />
7,500<br />
Total<br />
Note: Backlog with concrete visibility, w/o including conditional orders<br />
GAMESA<br />
BACKLOG<br />
Business Plan 2011-2013 – October 7, 2010, London<br />
CURRENT FIRM ORDER BACKLOG<br />
for 2010 for 2011<br />
152<br />
Sep. 2009<br />
719<br />
Sep. 2010<br />
52<br />
"A4rb_speech" – 20100111 – do not delete this text
C 2a<br />
GROWTH – WTG SALES<br />
Synergies of combined wind farm<br />
and wind turbine sales<br />
Why <strong>Gamesa</strong> Energía – synergies…<br />
... for the development business ... for the OEM business<br />
o Better project planning due to<br />
turbine knowledge (existing and<br />
future products)<br />
o Stronger balance sheet<br />
o Better brand image towards clients,<br />
banks and administration<br />
o Leverage on supply chain related<br />
investments and job creation to<br />
secure tender awarding<br />
o Ability to provide EPC solutions to<br />
project buyers<br />
GAMESA<br />
SYNERGIES<br />
Business Plan 2011-2013 – October 7, 2010, London<br />
o More feedback for product design<br />
and improvement (efficiency,<br />
O&M, environmental issues,<br />
permitting issues, …)<br />
o Improved visibility of order book<br />
o Good value added product for<br />
customers willing to enter the<br />
industry (start buying projects, then<br />
buying WTG for own developments)<br />
o Project development as a low cost<br />
tool to enter new markets<br />
o Better know-how on grid<br />
connection and civil works<br />
implications on the turbine<br />
53<br />
"A4rb_speech" – 20100111 – do not delete this text
C 2b<br />
<strong>Gamesa</strong> Energía's capabilities – in the top 6, with<br />
close relationship with 6 out of 9 operators<br />
Wind power ranking by installed capacity, YE2009 (GW)<br />
10.4<br />
GROWTH – W<strong>IN</strong>D PROJECTS DEVELOPMENT<br />
6.7<br />
6.2<br />
6.2<br />
Source: BTM Consult ApS – 2009; Companies web sites;<br />
GWEC; Roland Berger Strategy Consultants<br />
4.5<br />
Long<br />
Yuan<br />
4.0 (1)<br />
<strong>Gamesa</strong><br />
Energía<br />
3.0<br />
Datang<br />
(1) 3,578MW installed and 355 under construction. Projects developed by <strong>Gamesa</strong> and sold to third parties<br />
Business Plan 2011-2013 – October 7, 2010, London<br />
2.9<br />
2.7<br />
2.1<br />
1.9<br />
54<br />
"A4rb_speech" – 20100111 – do not delete this text
C 2b<br />
GROWTH – W<strong>IN</strong>D PROJECTS DEVELOPMENT<br />
Deliveries of 700 MW p.a. until 2013<br />
<strong>Gamesa</strong> Energía's deliveries and joint agreements, 2010-2013 (MW)<br />
USA EUROPE + LATAM CH<strong>IN</strong>A<br />
50<br />
2010<br />
c. 200<br />
2013<br />
250<br />
2010<br />
c. 200<br />
2013<br />
Business Plan 2011-2013 – October 7, 2010, London<br />
150<br />
c. 300<br />
2010 2013<br />
55<br />
"A4rb_speech" – 20100111 – do not delete this text
C 2b<br />
GROWTH – W<strong>IN</strong>D PROJECTS DEVELOPMENT<br />
<strong>Gamesa</strong> Energía expanding in all relevant markets<br />
<strong>Gamesa</strong> Energía's globalization – approach per region<br />
USA EUROPE CH<strong>IN</strong>A<br />
o Accelerate development in<br />
areas of high energy<br />
consumption (higher energy<br />
prices)<br />
o Selective project acquisition<br />
to speed up development<br />
o Approach utilities wanting to<br />
purchase projects to own<br />
and operate (no need for<br />
PPA)<br />
o Start construction of feasible<br />
projects during 2010<br />
RoW<br />
o Selected acquisition of<br />
projects to complete and sell<br />
o Leverage on <strong>Gamesa</strong>’s track<br />
record and technical strength<br />
to provide EPC solutions<br />
o Offer projects to new IPP’s<br />
(e.g. IKEA)<br />
o Sign up for long term<br />
relationships with local<br />
utilities (e.g. Edison)<br />
o Open up local offices together with Commercial and strengthen position via local developers<br />
(Joint Ventures/Acquisitions)<br />
o Leverage on commercial relationship with global IPPs to offer bundled projects<br />
o Help local banks to get support from European banks with project finance experience<br />
Business Plan 2011-2013 – October 7, 2010, London<br />
o Offer projects as a tool to<br />
accelerate build up of a<br />
sizeable installed base<br />
o Increase turbine demand by<br />
selling projects developed by<br />
<strong>Gamesa</strong><br />
o Continue talks to foreign<br />
investors to measure the<br />
value of the project without<br />
CDM<br />
o WF fully funded by<br />
customers (up to 25% equity<br />
from <strong>Gamesa</strong>)<br />
56<br />
"A4rb_speech" – 20100111 – do not delete this text
C 2b<br />
GROWTH – W<strong>IN</strong>D PROJECTS DEVELOPMENT<br />
New business model from pure greenfield to<br />
project development<br />
<strong>Gamesa</strong> Energía's value chain<br />
VALUE<br />
Greenfield<br />
development<br />
option<br />
Early stage<br />
+ Dev.<br />
contract<br />
Early stage<br />
sponsoring<br />
DEVELOPMENT<br />
RISK<br />
PLA<br />
purchase<br />
PLA<br />
purchase<br />
BE<strong>IN</strong>G LOST<br />
TO LOCAL<br />
DEVELOPERS<br />
Buy Build<br />
& Sell<br />
back<br />
Coinvestment<br />
EPC<br />
differed<br />
payment<br />
… speeding up growth in emerging<br />
markets and new clients<br />
NEW E&T<br />
UNIT FOCUS<br />
WF under<br />
construction<br />
CONSTRUCTION RISK COMMERCIAL<br />
RISK<br />
WF in<br />
operations<br />
Business Plan 2011-2013 – October 7, 2010, London<br />
t<br />
POTENTIAL CLIENTS<br />
o Utilities with<br />
growth needs in<br />
new markets<br />
(mostly emerging<br />
markets)<br />
o IPPs from small<br />
developers or large<br />
industrials that need<br />
financing, know-how,<br />
risk sharing<br />
o IPPs from financial<br />
players that look for<br />
returns and know-how<br />
57<br />
"A4rb_speech" – 20100111 – do not delete this text
C 2b<br />
GROWTH – W<strong>IN</strong>D PROJECTS DEVELOPMENT<br />
<strong>Gamesa</strong> Energía's pipeline – 22 GW in total over<br />
10% highly confident<br />
<strong>Gamesa</strong> Energia's pipeline by June 2010 – per geography (GW)<br />
Europe<br />
2.2<br />
11.9<br />
9.0<br />
Probable<br />
USA<br />
0.7<br />
China<br />
7.8<br />
3.4<br />
4.1<br />
0.2<br />
Likely<br />
2.4<br />
1.3<br />
0.3 0.8<br />
Highly confident<br />
Business Plan 2011-2013 – October 7, 2010, London<br />
22.1<br />
13.8<br />
5.6<br />
2.7<br />
Total<br />
58<br />
"A4rb_speech" – 20100111 – do not delete this text
C 2b<br />
<strong>Gamesa</strong> Services – 12 GW already contracted, with<br />
strong growth expected in O&M<br />
O&M services potential – Western Europe 1)<br />
23<br />
GROWTH – SERVICES<br />
27<br />
32<br />
38<br />
2005 2006 2007 2008 2009 2010 2011<br />
1) France, Germany, Italy, Spain and UK. Assumes standard 2-year warranty period<br />
45<br />
51<br />
58<br />
Business Plan 2011-2013 – October 7, 2010, London<br />
<strong>Gamesa</strong> serviced fleet, 2009 (average)<br />
18<br />
Total <strong>Gamesa</strong><br />
installed base<br />
12<br />
67%<br />
<strong>Gamesa</strong><br />
Services O&M<br />
Recurrent business,<br />
following the future<br />
growth trend<br />
6<br />
<strong>Gamesa</strong>´s fleet<br />
under clients &<br />
third parties<br />
service<br />
59<br />
"A4rb_speech" – 20100111 – do not delete this text
C 2c<br />
GROWTH – SERVICES<br />
Repair services are gaining relevance<br />
<strong>Gamesa</strong>’s approach to repairs is changing …<br />
o <strong>Gamesa</strong> is developing repair services as a<br />
reaction to new players not related with<br />
wind turbine entering the repair market<br />
o New full maintenance services offered<br />
by <strong>Gamesa</strong> require an additional level of<br />
optimization on repairs<br />
o Additionally, <strong>Gamesa</strong> is creating a<br />
centralized failure analysis centre to<br />
identify root causes of failures, repairing<br />
alternatives and performance improvements<br />
Business Plan 2011-2013 – October 7, 2010, London<br />
… to capture new opportunities<br />
o Increase sales in services through<br />
equipment repairs<br />
o Get closer to exclusivity of clients by<br />
increasing service levels and become the<br />
benchmark in the market<br />
o Increase availability by increasing level of<br />
understanding of failures and improve<br />
component reliability by providing<br />
repair solutions<br />
60<br />
"A4rb_speech" – 20100111 – do not delete this text
Three strategic vectors to achieve<br />
financial targets<br />
1<br />
COST OF ENERGY<br />
3<br />
Business Plan 2011-2013 – October 7, 2010, London<br />
2<br />
GROWTH<br />
EFFICIENCY<br />
61<br />
"A4rb_speech" – 20100111 – do not delete this text
C<br />
1,000 MW production capacity in each key region<br />
3a<br />
SUPPLY CHA<strong>IN</strong><br />
3b<br />
GROWTH – EFFICIENCY<br />
<strong>IN</strong>DUSTRIAL BASE<br />
3c<br />
CONSTRUCTION<br />
AND LOGISTIC<br />
COSTS<br />
3d<br />
STRUCTURE AND<br />
OVERHEADS<br />
o Localization to reduce manufacturing and logistics costs. e.g.<br />
China, India, Brazil<br />
o Material cost reduction through supply chain optimization<br />
o Joint development with manufacturers to improve costeffectiveness<br />
of designs (LM, Ingeteam, Hansen, …)<br />
o Ramp-up capacity in key emerging markets (e.g. India, Brazil)<br />
or large volume regions (China, USA)<br />
o Adjust manufacturing capacity in Spain<br />
o Key advantages from in-house plus outsourcing combination<br />
o Integrated, global logistics model<br />
o Optimized construction processes to reduce construction<br />
times<br />
o Overhead cost reduction: Significantly reduce FTEs/MW<br />
Business Plan 2011-2013 – October 7, 2010, London<br />
OBJECTIVES<br />
o Increase capacity<br />
and production<br />
autonomy in key<br />
emerging markets<br />
o Capacity<br />
adjustment in<br />
Spain (from 2,200<br />
to 1,000 MW)<br />
o Targeted<br />
structure costs<br />
reduction of 15%<br />
per MW by 2013<br />
62<br />
"A4rb_speech" – 20100111 – do not delete this text
C 3a<br />
GROWTH – SUPPLY CHA<strong>IN</strong><br />
Sourcing footprint optimization aimed at cost<br />
competitiveness<br />
<strong>Gamesa</strong> – sourcing footprint, 2010<br />
o Globalization of sales<br />
footprint increases<br />
current supply chain<br />
costs<br />
o Increasingly larger<br />
import duties in target<br />
countries<br />
o Regulatory support<br />
linked to local content<br />
requirements<br />
o New opportunities<br />
from cost competitive<br />
LCC suppliers<br />
Globalization of sourcing footprint by …<br />
– leveraging global suppliers with local presence<br />
– developing new local suppliers<br />
– helping current supplier base to<br />
internationalize ensuring that they follow<br />
<strong>Gamesa</strong>'s global footprint<br />
… without affecting quality and product performance<br />
negatively<br />
Business Plan 2011-2013 – October 7, 2010, London<br />
63<br />
"A4rb_speech" – 20100111 – do not delete this text
C 3a<br />
GROWTH – SUPPLY CHA<strong>IN</strong><br />
Localization success in China and USA –<br />
Accelerating footprint in India and Brazil<br />
CH<strong>IN</strong>A – Fast localization for G8x<br />
43%<br />
2009<br />
Fast localization achieved by combining<br />
development of:<br />
o Local suppliers<br />
+95%<br />
Scope of supply in China: Nacelle and Blades<br />
84%<br />
2010<br />
o Global suppliers with local presence<br />
o Domestic suppliers moving to China<br />
2010<br />
2011<br />
2012<br />
Business Plan 2011-2013 – October 7, 2010, London<br />
<strong>IN</strong>DIA – Localization on track<br />
o Nacelles<br />
o Towers<br />
o Gearbox<br />
o Generator<br />
o Blades<br />
BRAZIL – +60% local content by 2012<br />
64<br />
"A4rb_speech" – 20100111 – do not delete this text
C 3a<br />
GROWTH – SUPPLY CHA<strong>IN</strong><br />
Cost of materials – three optimization levers<br />
Technical levers Operational levers Sourcing levers<br />
o Simplified specifications and<br />
shift to functional<br />
specifications<br />
o Find substitutes<br />
o Design to cost/Modify to cost<br />
o Design for manufacturing<br />
and assembly<br />
o Involve suppliers in product<br />
development<br />
Via cross-functional work<br />
with technology<br />
o Support suppliers<br />
sophisticate their<br />
manufacturing processes<br />
(microanalysis)<br />
o Support suppliers optimizing<br />
materials cost<br />
o Streamline product and<br />
delivery process<br />
o Establish follow-up and<br />
supplier evaluation process<br />
Via joint work with<br />
suppliers<br />
Business Plan 2011-2013 – October 7, 2010, London<br />
o Negotiate with clear target<br />
price and in-depth<br />
knowledge of supplier<br />
situation based on<br />
• Supplier cost drivers<br />
• Clean sheets<br />
o Explore opportunities in<br />
global/LCC sourcing<br />
Via sophistication of<br />
sourcing tools<br />
65<br />
"A4rb_speech" – 20100111 – do not delete this text
C 3a<br />
GROWTH – SUPPLY CHA<strong>IN</strong><br />
Supply chain optimization generated significant<br />
savings<br />
Material Cost reduction – example, 2008-2010<br />
Cost reduction in product BOM (material costs – Base 100)<br />
100<br />
-17%<br />
90<br />
83<br />
2008 2009 2010<br />
Business Plan 2011-2013 – October 7, 2010, London<br />
66<br />
"A4rb_speech" – 20100111 – do not delete this text
C 3b<br />
Localization following TCO criteria:<br />
towards 1,000 MW capacity in key regions<br />
Effective blade manufacturing capacity 1) , 2009-2013 (MW)<br />
USA EUROPE<br />
South America<br />
c.500<br />
2009<br />
x2<br />
>1,000<br />
2013<br />
CH<strong>IN</strong>A <strong>IN</strong>DIA<br />
c.500<br />
2009<br />
GROWTH – <strong>IN</strong>DUSTRIAL BASE<br />
x2<br />
> 1,000<br />
2013<br />
2,200<br />
2009<br />
-50%<br />
1) Capacity based on workforce size rather than equipment<br />
0<br />
2009<br />
c.1,000<br />
2013<br />
> 800<br />
2013<br />
Business Plan 2011-2013 – October 7, 2010, London<br />
0<br />
2009<br />
c.300<br />
2013<br />
ACTIONS<br />
o Review of TCO for<br />
each component<br />
taking into account:<br />
• Manufacturing<br />
costs<br />
• Transportation<br />
costs<br />
• Import duties<br />
• Non quality costs<br />
• …<br />
o Critical review of any<br />
expansion/upgrade<br />
investment<br />
o Critical review of<br />
diversification plans<br />
67<br />
"A4rb_speech" – 20100111 – do not delete this text
C3 3b 2 <strong>IN</strong>DUSTRIAL GROWTH – <strong>IN</strong>DUSTRIAL BASE BASE<br />
Critical review of internal manufacturing in Spain<br />
European industrial platform capacity adjustment – blades (MW)<br />
2,200<br />
500<br />
Capacity 2009 Capacity Fully<br />
reduction<br />
(G5X, G8X)<br />
> 50%<br />
1,200<br />
depreciated /<br />
phase-out (G90)<br />
500<br />
New investment<br />
(G9X, G10X)<br />
1,000<br />
Capacity 2013<br />
Business Plan 2011-2013 – October 7, 2010, London<br />
o Adjustment of plants<br />
with 14 moulds and c.<br />
2,200 MW<br />
manufacturing capacity<br />
to 1,000 MW which will<br />
be required in the future<br />
o Use of new investments<br />
(G9X, G10X) to optimize<br />
number of plants and<br />
moulds in Spain<br />
o Restructuring costs<br />
2011: EUR c.10 m<br />
68<br />
"A4rb_speech" – 20100111 – do not delete this text
C 3b<br />
GROWTH – <strong>IN</strong>DUSTRIAL BASE<br />
Vertical Integration offers a competitive<br />
advantage…<br />
Competitive advantages from vertical integration<br />
TECHNOLOGY:<br />
o Deep knowledge of design criteria of key<br />
components allows fast implementation of leading<br />
edge technologies into new model designs<br />
(segmented blades, PM generators, medium speed<br />
gearboxes,…)<br />
<strong>IN</strong>DUSTRIAL:<br />
o Deep understanding of cost structure and cost<br />
drivers of key and high value components allows<br />
effective sourcing<br />
SERVICE:<br />
o Experience of key components operative<br />
behavior allows to optimize maintenance and<br />
repair<br />
Business Plan 2011-2013 – October 7, 2010, London<br />
BLADES<br />
GEARBOXES<br />
GENERATORS<br />
POWER ELECTRONICS<br />
CAST<strong>IN</strong>G PARTS<br />
69<br />
"A4rb_speech" – 20100111 – do not delete this text
C 3b<br />
GROWTH – <strong>IN</strong>DUSTRIAL BASE<br />
…while Make & Buy strategy allows large footprint<br />
with low CAPEX<br />
Share of externally sourced components<br />
28%<br />
Blades Gearboxes Generators Casting parts<br />
Power Electronics<br />
50%<br />
2010 2013<br />
35%<br />
53%<br />
2010 2013<br />
12%<br />
2010<br />
31%<br />
2013<br />
• Highly intensive in capital<br />
• Relying on top suppliers for footprint evolution<br />
82%<br />
2010<br />
Business Plan 2011-2013 – October 7, 2010, London<br />
88%<br />
2013<br />
62%<br />
39%<br />
2010 2013<br />
• Not capital intensive<br />
• Valuable know-how<br />
70<br />
"A4rb_speech" – 20100111 – do not delete this text
C 3c<br />
GROWTH – CONSTRUCTION AND LOGISTIC COSTS<br />
Better construction and logistics contribute to<br />
13% cost reduction targets<br />
Construction and Logistic costs – ongoing initiatives<br />
Domestic<br />
transportation<br />
Reorganization<br />
of logistic<br />
centers<br />
Incident<br />
management<br />
o Renegotiation of current contracts<br />
o Increase the suppliers base<br />
o Optimization of resources for<br />
seasonality<br />
o Reorganization of tooling<br />
maintenance:<br />
• Decentralization of basic O&M<br />
operations<br />
• Locate in one of the warehouses<br />
o Renegotiation with suppliers:<br />
• LM: definition of warehousing and<br />
billing conditions<br />
• Windar: optimization of warehouse<br />
space in Avilés<br />
o Traffic department creation (25%<br />
incident reduction)<br />
Business Plan 2011-2013 – October 7, 2010, London<br />
TARGETS<br />
o Overall 13% cost<br />
reduction target<br />
o OTD from 95% to<br />
100%<br />
o Leadtime from 12<br />
to 4 months<br />
71<br />
"A4rb_speech" – 20100111 – do not delete this text
3d<br />
EFFICIENCY – STRUCTURE AND OVERHEADS<br />
15% reduction in overhead cost per MWe by 2013<br />
Structure and overheads efficiency<br />
Strengthening<br />
positioning<br />
in growing<br />
regions …<br />
… while<br />
optimizing<br />
structural cost<br />
Growing markets:<br />
o India<br />
o China<br />
o New regions: i.e. Latin America (Brazil)<br />
Strengthening key areas:<br />
o Technology (80% of 2013 sales from new platforms)<br />
o Services (faster growth than sales)<br />
Europe – actions already in place<br />
o Optimized number of storage centers<br />
o Reduced number of offices<br />
Global shared services<br />
Business Plan 2011-2013 – October 7, 2010, London<br />
TARGETS<br />
EFFICIENT<br />
GROWTH<br />
o Reduce overhead<br />
costs per MWe<br />
sold until 2013<br />
by 15%<br />
o Reduction of<br />
office centers (by<br />
4) and storage<br />
centres (by 3) in<br />
Spain<br />
72<br />
"A4rb_speech" – 20100111 – do not delete this text
D. Financial targets<br />
Business Plan 2011-2013 – october 7, 2010, London<br />
73<br />
"A4rb_speech" – 20100111 – do not delete this text
D F<strong>IN</strong>ANCIAL TARGETS<br />
Guidance Wind Turbine division 2010-2013<br />
GROWTH<br />
PROFITABILITY<br />
SUSTA<strong>IN</strong>ABILITY<br />
MWe sold<br />
CAGR 10-13 MWe sold<br />
EBIT margin<br />
WC/Sales<br />
Annual CAPEX<br />
(EUR m)<br />
Business Plan 2011-2013 – October 7, 2010, London<br />
2010 FCST 2013 FCST<br />
2,400-2,500 c.4,000<br />
>15%<br />
4.5%-5.5% 6%-7%<br />
c.20%<br />
150<br />
c.20%<br />
c.250<br />
<strong>IN</strong>CLUD<strong>IN</strong>G offshore :<br />
EUR 60 m<br />
74<br />
"A4rb_speech" – 20100111 – do not delete this text
D F<strong>IN</strong>ANCIAL TARGETS<br />
Guidance Wind Farm division 2010-2013<br />
GROWTH<br />
PROFITABILITY<br />
SUSTA<strong>IN</strong>ABILITY<br />
MW delivered<br />
(ex-China)<br />
Join promotion<br />
in China<br />
EBIT (EUR m)<br />
Net Debt (EUR m)<br />
Business Plan 2011-2013 – October 7, 2010, London<br />
2010 FCST 2013 FCST<br />
c.300 c.400<br />
150<br />
300<br />
c.0 c.25<br />
c.300 c.500<br />
75<br />
"A4rb_speech" – 20100111 – do not delete this text
D F<strong>IN</strong>ANCIAL TARGETS<br />
Guidance 2010-2013: Roadmap<br />
WTG<br />
Manufacturing<br />
Wind farm<br />
Development &<br />
Sales<br />
WTG<br />
o MWe sold<br />
o EBIT Margin<br />
o WC as % of sales<br />
o CAPEX (EUR m, annual)<br />
W<strong>IN</strong>D FARMS<br />
o MW delivered, ex-China<br />
o Joint promotion China<br />
(MW)<br />
o EBIT (EUR m)<br />
o Net debt (EUR m)<br />
GROUP<br />
o NFD/EBITDA (x)<br />
1) FY 2010 guidance does not include 244 MW delivered to Iberdrola in the 1Q<br />
2) Offshore included: EUR 30 m in 2011, EUR 60 m in 2013<br />
Guidance 2010 Guidance 2011 Guidance 2013<br />
2,400 - 2,500<br />
4.5% - 5.5%<br />
c.20%<br />
150<br />
c.300<br />
c.150<br />
c.0<br />
c.300<br />
Business Plan 2011-2013 – October 7, 2010, London<br />
1)<br />
2,800 - 3,100<br />
4% - 5%<br />
20-25%<br />
250<br />
c.400<br />
c.300<br />
c.20<br />
c.500<br />
CAGR2010-13 ➨15%<br />
6% - 7%<br />
c.20%<br />
250<br />
D F<strong>IN</strong>ANCIAL TARGETS<br />
2011-2013: Supporting double digit<br />
growth with strong investment<br />
Investment in the new industrial base and product platforms supports growth<br />
in 2010-2013 (15% CAGR) and beyond<br />
Detailed TANGIBLE CAPEX and R&D (EUR m)<br />
156<br />
72<br />
128<br />
33<br />
31 40 43 50<br />
53 55 57 55<br />
2008 2009 2010E 2011-2013 Average<br />
Maintenance Tang. CAPEX R&D Growth Tang. CAPEX on new industrial base Offshore<br />
150<br />
5<br />
45<br />
Business Plan 2011-2013 – October 7, 2010, London<br />
250<br />
55<br />
90<br />
Future growth CAPEX linked<br />
to existing industrial base<br />
will be lower<br />
77<br />
"A4rb_speech" – 20100111 – do not delete this text
3,684<br />
5.8<br />
D F<strong>IN</strong>ANCIAL TARGETS<br />
Understanding the margin outlook<br />
3,145<br />
7.2<br />
2011 margin is impacted by non recurrent factors<br />
EBIT 1 / Sales evolution (%) and Sales volume (MW)<br />
+0.3<br />
5 4.8<br />
4.5<br />
2008 2009 2010 E 2011 F Restructuring<br />
impact<br />
1 WTG Division<br />
2,400-2,500<br />
2,800-3,100<br />
2011 F<br />
Normalised<br />
+1.2<br />
+1<br />
Manuf. Ramp Up Fix Cost<br />
Absorption<br />
EBIT mg Restructuring Costs MW sold<br />
Business Plan 2011-2013 – October 7, 2010, London<br />
4,000<br />
6-7<br />
Margin with<br />
normalised<br />
activity<br />
Future margin progression<br />
supported by a fully<br />
established new industrial<br />
and product platform<br />
78<br />
"A4rb_speech" – 20100111 – do not delete this text
E. Conclusion<br />
Business Plan 2011-2013 – october 7, 2010, London<br />
79<br />
"A4rb_speech" – 20100111 – do not delete this text
E CONCLUSION<br />
The industry benchmark for<br />
long term customers relationships<br />
� Industry double digit long-term growth rates secured<br />
���� need to guarantee energy security and contain the effects of climate change<br />
� <strong>Gamesa</strong>´s key strategic vectors: competitive Cost of Energy, top line Growth and<br />
Efficiency support:<br />
� Double digit volume growth<br />
� Return to 2009 margins<br />
� Solid financial position<br />
� Industry leading position by and beyond 2013<br />
(1) <strong>Gamesa</strong> WTG division<br />
� CoE optimization by 20% in 2013 (by 30% in 2015)<br />
� Renewed product range in onshore and offshore<br />
� CAGR 10-13: >15% (1)<br />
� Integral offer along the wind value chain (from development to O&M)<br />
� Global commercial, industrial and technological footprint<br />
� 2013 EBIT Margin: 6%-7% (1)<br />
� Net debt/EBITDA
Questions & Answers<br />
Muchas Gracias<br />
Thank you<br />
谢谢!<br />
谢谢!<br />
Business Plan 2011-2013 – October 7, 2010, London<br />
81<br />
"A4rb_speech" – 20100111 – do not delete this text
Disclaimer<br />
“This material has been prepared by <strong>Gamesa</strong> Corporación Tecnológica, S.A., and is disclosed solely as information.<br />
This material may contain declarations which constitute forward-looking statements, and includes references to our current intentions, beliefs or<br />
expectations regarding future events and trends that may affect our financial condition, earnings and share value.<br />
These forward-looking statements do not constitute a warranty as to future performance and imply risks and uncertainties. Therefore, actual results<br />
may differ materially from those expressed or implied by the forward-looking statements, due to different factors, risks an uncertainties, such as<br />
economical, competitive, regulatory or commercial changes. The potential investor should assume the fact that the value of any investment may rise or<br />
go down, and furthermore, it may not be recovered, partially or completely. Likewise, past performance is not indicative of future results.<br />
The facts, opinions, and forecasts included in this material are furnished as to the date of this document, and are based on the company’s estimations<br />
and on sources believed to be reliable by <strong>Gamesa</strong> Corporación Tecnológica, S.A., but the company does not warrant its completeness, timeliness or<br />
accuracy, and therefore it should not be relied upon as if it were.<br />
Both the information and the conclusions contained in this document are subject to changes without notice. <strong>Gamesa</strong> Corporación Tecnológica, S.A.<br />
undertakes no obligation to update forward-looking statements to reflect events or circumstances that occur after the date the statements were made.<br />
The results and evolution of the company may differ materially from those expressed in this material.<br />
None of the information contained in this document constitutes a recommendation, solicitation or offer to buy or sell any securities, futures, options or<br />
other financial instruments or provide any investment advice or service. This material does not provide any recommendation of investment, or legal, tax<br />
or any other type of advise, and it should not be relied upon to make any investment or decision.<br />
Any and all the decisions taken by any third party as a result of the information, materials or reports contained in this document, are the sole and<br />
exclusive risk and responsibility of that third party, and <strong>Gamesa</strong> Corporación Tecnológica, S.A. shall not be responsible for any damages derived from<br />
the use of this document or its content.<br />
This document has been furnished exclusively as information, and it must not be disclosed, published or distributed, partially or totally, without the prior<br />
written consent of <strong>Gamesa</strong> Corporación Tecnológica, S.A.<br />
The images captured by <strong>Gamesa</strong> in the work environment or at corporate events are solely used for professional purposes to inform third parties about<br />
corporate activities and to illustrate them.<br />
Spanish version for information purposes only. In case of doubt the English version will prevail.”<br />
Business Plan 2011-2013 – October 7, 2010, London<br />
82<br />
"A4rb_speech" – 20100111 – do not delete this text
Business plan 2011-2013


