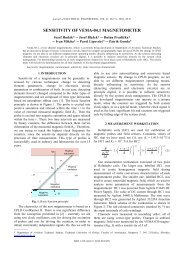
full-paper
full-paper
full-paper

You also want an ePaper? Increase the reach of your titles
YUMPU automatically turns print PDFs into web optimized ePapers that Google loves.
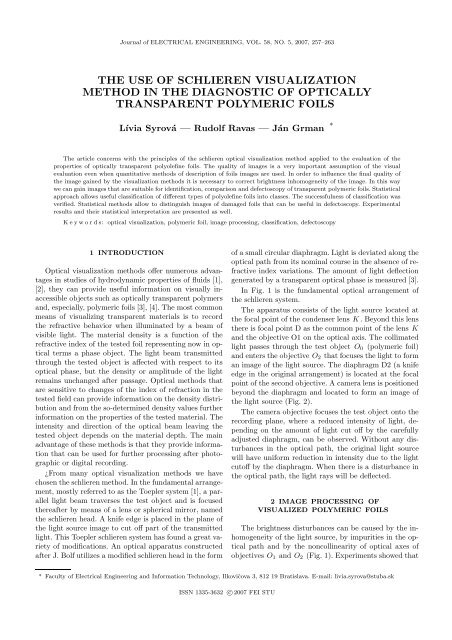
Journal of ELECTRICAL ENGINEERING, VOL. 58, NO. 5, 2007, 257–263<br />
THE USE OF SCHLIEREN VISUALIZATION<br />
METHOD IN THE DIAGNOSTIC OF OPTICALLY<br />
TRANSPARENT POLYMERIC FOILS<br />
Lívia Syrová — Rudolf Ravas — Ján Grman ∗<br />
The article concerns with the principles of the schlieren optical visualization method applied to the evaluation of the<br />
properties of optically transparent polyolefine foils. The quality of images is a very important assumption of the visual<br />
evaluation even when quantitative methods of description of foils images are used. In order to influence the final quality of<br />
the image gained by the visualization methods it is necessary to correct brightness inhomogeneity of the image. In this way<br />
we can gain images that are suitable for identification, comparison and defectoscopy of transparent polymeric foils. Statistical<br />
approach allows useful classification of different types of polyolefine foils into classes. The successfulness of classification was<br />
verified. Statistical methods allow to distinguish images of damaged foils that can be useful in defectoscopy. Experimental<br />
results and their statistical interpretation are presented as well.<br />
K e y w o r d s: optical visualization, polymeric foil, image processing, classification, defectoscopy<br />
1 INTRODUCTION<br />
Optical visualization methods offer numerous advantages<br />
in studies of hydrodynamic properties of fluids [1],<br />
[2], they can provide useful information on visually inaccessible<br />
objects such as optically transparent polymers<br />
and, especially, polymeric foils [3], [4]. The most common<br />
means of visualizing transparent materials is to record<br />
the refractive behavior when illuminated by a beam of<br />
visible light. The material density is a function of the<br />
refractive index of the tested foil representing now in optical<br />
terms a phase object. The light beam transmitted<br />
through the tested object is affected with respect to its<br />
optical phase, but the density or amplitude of the light<br />
remains unchanged after passage. Optical methods that<br />
are sensitive to changes of the index of refraction in the<br />
tested field can provide information on the density distribution<br />
and from the so-determined density values further<br />
information on the properties of the tested material. The<br />
intensity and direction of the optical beam leaving the<br />
tested object depends on the material depth. The main<br />
advantage of these methods is that they provide information<br />
that can be used for further processing after photographic<br />
or digital recording.<br />
¿From many optical visualization methods we have<br />
chosen the schlieren method. In the fundamental arrangement,<br />
mostly referred to as the Toepler system [1], a parallel<br />
light beam traverses the test object and is focused<br />
thereafter by means of a lens or spherical mirror, named<br />
the schlieren head. A knife edge is placed in the plane of<br />
the light source image to cut off part of the transmitted<br />
light. This Toepler schlieren system has found a great variety<br />
of modifications. An optical apparatus constructed<br />
after J. Bolf utilizes a modified schlieren head in the form<br />
of a small circular diaphragm. Light is deviated along the<br />
optical path from its nominal course in the absence of refractive<br />
index variations. The amount of light deflection<br />
generated by a transparent optical phase is measured [3].<br />
In Fig. 1 is the fundamental optical arrangement of<br />
the schlieren system.<br />
The apparatus consists of the light source located at<br />
the focal point of the condenser lens K . Beyond this lens<br />
there is focal point D as the common point of the lens K<br />
and the objective O1 on the optical axis. The collimated<br />
light passes through the test object O0 (polymeric foil)<br />
and enters the objective O2 that focuses the light to form<br />
an image of the light source. The diaphragm D2 (a knife<br />
edge in the original arrangement) is located at the focal<br />
point of the second objective. A camera lens is positioned<br />
beyond the diaphragm and located to form an image of<br />
the light source (Fig. 2).<br />
The camera objective focuses the test object onto the<br />
recording plane, where a reduced intensity of light, depending<br />
on the amount of light cut off by the care<strong>full</strong>y<br />
adjusted diaphragm, can be observed. Without any disturbances<br />
in the optical path, the original light source<br />
will have uniform reduction in intensity due to the light<br />
cutoff by the diaphragm. When there is a disturbance in<br />
the optical path, the light rays will be deflected.<br />
2 IMAGE PROCESSING OF<br />
VISUALIZED POLYMERIC FOILS<br />
The brightness disturbances can be caused by the inhomogeneity<br />
of the light source, by impurities in the optical<br />
path and by the noncollinearity of optical axes of<br />
objectives O1 and O2 (Fig. 1). Experiments showed that<br />
∗ Faculty of Electrical Engineering and Information Technology, Ilkovičova 3, 812 19 Bratislava. E-mail: livia.syrova@stuba.sk<br />
ISSN 1335-3632 c○2007 FEI STU
258 L. Syrová — R. Ravas — J. Grman: THE USE OF SCHLIEREN VISUALIZATION METHOD IN THE DIAGNOSTIC . . .<br />
Fig. 1. The optical arrangement of the schlieren system.<br />
Fig. 2. Schlieren apparatus used for visualization of polymeric foils and detail of digital camera location.<br />
Fig. 3. Examples of images : a) image without tested foil, b) with tested foil , c) image of the same foil after correction.<br />
the last factor had a substantial influence on the homogeneity<br />
of the image obtained by the schlieren apparatus<br />
[5].<br />
For image processing it is necessary to correct the influence<br />
of light source inhomogeneity, the influence of the<br />
optical string and of the sensing device on evaluation of<br />
images gained by optical visualization of polymeric foils.<br />
One of the possibilities is to use a reference image picked<br />
up without presence of the test object. The reference image<br />
can be taken as an image of errors of the whole optical<br />
system on the assumption that we have used a virtual<br />
light source [6]. Correction of brightness errors is necessary<br />
for further image processing by statistical methods.<br />
The brightness correction can be evaluated from [7]<br />
g(i, j) =<br />
c<br />
f(i, j) (1)<br />
fc(i, j)<br />
where f(i, j) are the values of brightness of the tested<br />
foil (Fig. 3.b), fc(i, j) are the values of reference image<br />
brightness in the same point (Fig. 3.a), c is a suitable<br />
chosen constant and g(i, j) is the grey level of resulting<br />
image (Fig. 3.c). In an ideal image of visualized foils the<br />
changes of brightness reflect the changes of the refractive<br />
index of the transparent foil. The refractive index depends<br />
on the density of material through which light beams traverses<br />
and the schlieren system visualizes the changes in<br />
the first derivative of the density. In Figs. 4.a and 4.b are<br />
the sharpened corrected images of two different samples<br />
of a biaxially oriented PP foil (KX40) and in Fig. 4.c is<br />
the sharpened corrected image of a mono oriented PP foil<br />
(AG36) [8].<br />
One can see that different foils have different characteristic<br />
features that are well observed, images of different<br />
foils can be distinguished and on the contrary images<br />
of different samples show some similarity. Features show<br />
some regularity of stochastic nature. One possibility how<br />
to describe the nature of foils images is to use statistical<br />
characteristics. Under the images (Fig. 4) are histograms<br />
of relative occurrences of grey levels corresponding to the<br />
images.
Journal of ELECTRICAL ENGINEERING VOL. 58, NO. 5, 2007 259<br />
Fig. 4. Modified images of foils with histograms a) KX40 sample 1, b) KX40 sample 2, c) AG36.<br />
Fig. 5. 3D-representation of the grey level co-occurrence matrix of foil images for d = 1 and α = 0 ◦ a) KX40, b) AG36.<br />
It can be seen that there are similarities and differences<br />
between histograms in regard to the position and shape.<br />
The attributes of histograms can be numerical characterized<br />
using moments of distribution.<br />
3 STATISTICAL PROPERTIES<br />
The attributes of histograms can be numerical characterized<br />
using moments of distribution as the mean value<br />
of the grey level<br />
m =<br />
L�<br />
xip(xi) (2)<br />
i=1<br />
and centred moments of the distribution of the k th order<br />
µk(x) =<br />
L�<br />
(xi − m) k p(xi) (3)<br />
i=1<br />
or normalized moments of the distribution of the kth order<br />
µk(x)<br />
µkN(x) =<br />
[µ2(x)] (k/2)<br />
(4)<br />
where xi is the value of i-th grey level, p(xi) is the relative<br />
occurrence of this grey level, which can be taken<br />
as the probability of occurrence of grey level and L is<br />
the number of grey levels in the image. The regularity<br />
in structure of the foil can be described by the two- dimensional<br />
autocorrelation function. In order to quantify<br />
properties of foils images it is possible to use the grey<br />
level co-occurrence matrix [7], [9].<br />
We can characterize it as a matrix with elements giving<br />
the occurrence of pairs of grey level in the defined<br />
direction and distance. Such a matrix can reflect the nature<br />
of image structure unlike the characteristics (2) and<br />
(3). Indices of the matrix elements correspond to the grey<br />
level of the pair. The matrix is square and symmetric to<br />
the main diagonal. The number of grey level of the preprocessed<br />
image determinates dimensions of the matrix.<br />
Owing to the discrete character of the image the direction<br />
angles of pairs of pixels is quantized by step 45 ◦ .<br />
The matrix for distance d = 1 and angle α = 0 ◦ can be<br />
expressed by<br />
P(i, j, d, 0) = # � [(k, l), (m, n)] | k = m ,<br />
|l − n| = d, I(k, l) = i , I(m, n) = j � (5)
260 L. Syrová — R. Ravas — J. Grman: THE USE OF SCHLIEREN VISUALIZATION METHOD IN THE DIAGNOSTIC . . .<br />
Fig. 6. a) Projection of patterns of tested foils images to the plane mean value × variance, b) projection of patterns of tested foils images<br />
to the plane mean value × variance (part of graph from Fig. 6.a).<br />
Fig. 7. Projection of patterns of tested foils images to the plane a) (f1,1,90 ×f3,1,90 ) (contrast for d = 1 and α = 90 ◦ , standard deviation<br />
for d = 1 and α = 90 ◦ ), b) (f1,1,45 × f2,1,45 ) (contrast for d = 1 and α = 45 ◦ , entropy for d = 1 and α = 45 ◦ ).<br />
where (m, n) and (k, l) are coordinates of pixels separated<br />
by distance d in the horizontal direction, i, j are<br />
grey levels of such pixels, where symbol # denotes the<br />
number of elements in the set. In order to calculate characteristics<br />
from such a matrix it is more suitable to use<br />
relative occurrences (frequencies) according to (5)<br />
p(i, j, d, α) =<br />
� L−1<br />
i=0<br />
P(i, j, d, α)<br />
� . (6)<br />
L−1<br />
j=0 P(i, j, d, α)<br />
In in Fig. 5, there are 3D representations of a section of<br />
the grey level co-occurrence matrix for two different foil<br />
samples. In [7], [9] are some features computed from the<br />
co-occurrence matrix (6). From the suitable features we<br />
can present contrast<br />
correlation<br />
f2,d,α =<br />
L−1 �<br />
f1,d,α = n 2<br />
� L−1<br />
i=0<br />
n=0<br />
� L−1<br />
j=0<br />
standard deviation<br />
�L−1 L−1<br />
� �<br />
i=0 j=0<br />
�<br />
p(i, j, d, α) , (7)<br />
|i−j|=n<br />
(ij)p(i, j, d, α) − mx,d,αmy,d,α<br />
, (8)<br />
σx,d,ασy,d,α<br />
f3,d,α = σx,d,α , (9)<br />
where the mean values mx,d,α, my,d,α and the standard<br />
deviations σx,d,α, σy,d,α can be computed from (10)<br />
L−1 L−1<br />
mx,d,α = my,d,α =<br />
� �<br />
p(i, j, d, α)<br />
j=0 i=0<br />
�<br />
σ 2 x,d,α =σ 2 L−1<br />
y,d,α = (j − mx,d,α) 2<br />
uniformity of energy<br />
and entropy<br />
j=0<br />
(10)<br />
L−1 �<br />
p(i, j, d, α),<br />
i=0<br />
L−1 � L−1 �<br />
f4,d,α = p 2 (i, j, d, α) (11)<br />
i=0 j=0<br />
L−1 � L−1 �<br />
f5,d,α = − p(i, j, d, α)log2 p(i, j, d, α). (12)<br />
i=0 j=0<br />
4 CLASSIFICATION OF POLYMERIC FOILS<br />
Under classification we understand the procedure of<br />
decision on the assigning a foil sample to the defined class
Journal of ELECTRICAL ENGINEERING VOL. 58, NO. 5, 2007 261<br />
Fig. 8. Clustering of foils patterns in dependence on the 6 th order normalized centred moment.<br />
of foils or to the type of foils based on the processing of<br />
the image of the visualized foil structure. The tool which<br />
allows to assign a foil into classes is called the classifier.<br />
One of possibilities is to use signature oriented classifiers.<br />
Numerical features that are elements of the feature vector<br />
are defined to the specific images. The endpoint of feature<br />
vector is called the pattern of the foil. It is necessary to<br />
find such signatures that allow to cluster patterns of foils<br />
belonging to the same class and simultaneously allow to<br />
separate subspaces of patterns of foils belonging to different<br />
classes. Then it is enough to create discrimination<br />
functions allowing to divide the signature space into disjunctive<br />
subspaces. Each subspace will contain patterns<br />
of only one class of foils in an ideal case. Such rules can be<br />
derived only in simple cases. In more complicated cases<br />
classifiers based on the principle of training such neural<br />
networks must be used. The convenience of statistical<br />
characteristics of foils images for the classification is<br />
demonstrated.<br />
To verify the possibilities of classification of foil images<br />
ten polyolefine foil samples, from which two samples<br />
of the foil are the same, have been gained in the same<br />
condition [5]. We chose the signature vector whose components<br />
were the mean value and the centred moments<br />
of distributions of the 2 nd to the 4 th order. In addition<br />
to the whole images characteristics, we have also assigned<br />
their four disjunctive parts. Figure 6.a shows a projection<br />
of signature vectors of individual classes (classes are individual<br />
types of foil) into the plane defined by the mean<br />
value and the variance. Using a suitable choice of signatures<br />
there is a tendency to the grouping of patterns<br />
of individual classified classes. In Fig. 6.b a detail from<br />
Fig. 6.a is illustrated. Selected signature vector for given<br />
groups of foils allows to create separable clusters in the<br />
space of features that Fig. 6 demonstrates.<br />
Figure 7 exemplifies the tendency to the grouping and<br />
to the separation of patterns of the same classes as used<br />
in the previous case. The features were computed from<br />
the co-occurrence matrix. In order to gain a successful<br />
classification for this set of foils it was necessary to use<br />
a signature vector containing three elements, eg contrast,<br />
standard deviation and correlation [10].<br />
At present a frequently solution of the classification<br />
problem is application of an artificial neural network.<br />
Network topology depends on the number of features, on<br />
the number of classes and on the number of hidden layers<br />
[11]. For the purpose of classification the feed-forward<br />
supervised neural network gives good results. The most<br />
popular is the multilayer perceptron containing one hidden<br />
layer. For experimental purposes the software system<br />
that integrates the software modules necessary to verification<br />
of arranged methods was developed. It is possible<br />
to insert continuously foils samples that are together with<br />
the calculated statistical characteristics into the database<br />
system. From the database of foils samples it is possible<br />
to create different sets determined to the neural network<br />
training and the sets determined to the classifier test. The<br />
system allows to select the structure of the neural network<br />
and the choice of characteristics that are elements of signature<br />
vector. In order to experimentally verify the use<br />
of neural network classifier foils images were taken by a<br />
5-megapixel CCD digital camera. Images of 16 samples<br />
of seven different types of foils were stored into database.<br />
Good results were already achieved in the case of neural<br />
network training with six casually selected samples from<br />
each class. Successfulness of classification was 107 accurate<br />
classified images out of 112 images. Unsuccessfulness<br />
of classification was mostly influenced by the presence of<br />
brightness fluctuation of deformations that are caused by<br />
defects in the foils structure.<br />
5 DEFECTOSCOPY OF POLYMERIC FOILS<br />
The main problem of defectoscopy is to detect or to<br />
locate areas in the tested object, in our case in the polymeric<br />
foils or in the images of foils, which correspond to
262 L. Syrová — R. Ravas — J. Grman: THE USE OF SCHLIEREN VISUALIZATION METHOD IN THE DIAGNOSTIC . . .<br />
Fig. 9. Images of parts of foil KX30D ordered according to the growing value of centred moment of 6 th order.<br />
Fig. 10. Images of parts of foil KX40D ordered according to the growing values of centred moment of 6 th order.<br />
disturbances or inhomogeneities that are present in the<br />
tested material. Images of the foils without defects are<br />
characterized by regularity of the stochastic nature of the<br />
structure. In the case of images with defects the damaged<br />
areas will be characterized by a different structure. One<br />
of the possibilities of defects detection is visual comparison<br />
of images of foils with and without defect to which<br />
<strong>paper</strong>s [4] and [12] pay attention. In order to increase the<br />
effectiveness of comparison it is possible to use other tools<br />
of image processing such as sharpening or equalization of<br />
histograms.<br />
These structures can be described by numerical characteristics<br />
calculated from the histogram of grey level occurrence.<br />
From the tested characteristics the best results<br />
have been achieved using the even order centred moments<br />
of distribution [13]. To verify the possibilities of inhomogeneities<br />
we detected foils images of 16 foil samples from<br />
which 6 had defects. Statistical characteristics calculated<br />
for the whole foil image and for their four parts created by<br />
division of foil image into four parts have been compared.<br />
For illustration there is the graph in Fig. 8 that demonstrates<br />
the values of the normalized moment of 6 th order<br />
for all tested foils and for their parts. One can see that<br />
variance of the values of calculated moment for individual<br />
images and for their parts depends on the homogeneity of<br />
foils images. The maximum variance of values has been<br />
observed for foil KX30D (in Fig. 9 parts of foil image are<br />
ordered according to the growing values of normalized<br />
moment). In Fig. 10 are parts of foil KX40D ordered in<br />
the same way as in Fig. 9.<br />
The experiments showed that detection of anomalous<br />
parts of foil image using normalized centred moments of<br />
even order was suitable for more extensive defects (comparable<br />
with dimension of image). For smaller anomalies<br />
it is suitable to use centred moments according to the<br />
formula (4).<br />
One can see from Fig. 8, that for detection of more extensive<br />
defects it is possible to compare statistical characteristics<br />
calculated from the whole image, which is especially<br />
marked when comparing the values for foils KX30,<br />
KX40 and ON30 (eg foils without defects) with the images<br />
of corresponding foils with defects (KX30D, KX40D<br />
and ON30D). The maximum value of centred moment of<br />
6 th order calculated from the whole image is for KX40D<br />
after that follow centred moment values of foils KX30D<br />
and ON30D. In all mentioned cases values considerably<br />
differ from values calculated for the foils without defects.<br />
6 CONCLUSION<br />
Physical properties of plastic foils are related to their<br />
production. Many foils have scratches most, of them are<br />
derived from the manufacturing processes where the polymeric<br />
film runs over rollers.<br />
The evaluation of the quality of polymeric foils is an<br />
important part of their production. Naturally, the choice<br />
of parameters describing the images of foils depends on<br />
the application. For the purposes of testing we have chosen<br />
samples of foils commonly available on our market,<br />
namely safety window foils (for house and vehicular windows)<br />
and foils used in food industry.<br />
Visual quality assessment allows location of places<br />
with elastic strains marked by variations in the level of<br />
brightness (grade of grey) on pre-processed images. This<br />
method is suitable for on-line evaluation of the quality of<br />
foils in their production. There are samples of tested foils<br />
without and with defects. On some types of foils we have<br />
deliberately created defects for the purpose of visualizing<br />
the area of strain as illustrated in Figs. 9 and 10.<br />
Comparison of several areas of images gives information<br />
on the average segment shade distribution and enables<br />
us to identify larger defects by comparing the his-
Journal of ELECTRICAL ENGINEERING VOL. 58, NO. 5, 2007 263<br />
tograms or using the co-occurrence matrix suitable for<br />
identification of various samples of foils because the shape<br />
of histogram depends on the structure of the foil.<br />
Acknowledgement<br />
The present work is sponsored by the research grant<br />
VEGA 1/3099/06.<br />
References<br />
[1] EMRICH, R. J.: Fluid Dynamics, Academia Press, New York<br />
981, pp. 361–374.<br />
[2] SMITH, A. J.—LIM, T. T.: Flow Visualization, Imperial College<br />
Press, London, 2000, pp. 219–221.<br />
[3] BOLF, J.—BAJCSY, J.—BOLF, P. : J. Electrical Engineering<br />
44 (1993), 244–247.<br />
[4] SYROVÁ, L.: J. Electrical Engineering 51 (2000), 133–137.<br />
[5] RAVAS, R.—SYROVÁ, L.—GRMAN, J.: Measurement Science<br />
Review 3 (2003), 163–167.<br />
[6] GRMAN, J.—RAVAS, R.—SYROVÁ, L. : Use of Optical Visualization<br />
Method for Evaluation of Transparent Polymeric Foils,<br />
In: 11th International DAAAM Symposium “Intelligent Manufacturing<br />
& Automation”, Opatija, Croatia, 2000, pp. 167–168.<br />
[7] SONKA, M.—HLAVAC, V.—BOYLE, R.: Image Processing,<br />
Analysis, and Machine Vision, Brooks/Cole Publishing Company,<br />
Pacific Grove, USA, 1998.<br />
[8] MALINARIČ, S.—KLUVANEC, D.—JAMBRICH, M.: J.<br />
Phys. D: Appl. Phys. 31 (1998), 2104–2108.<br />
[9] HARALICK, R. M.—SHAPIRO, L. G. : Computer and Robot<br />
Vision, Addison-Wesley Publishing Company, New York, 1992,<br />
pp. 457–462.<br />
[10] SYROVÁ, L.—RAVAS, R.—GRMAN, J.: Measurement Science<br />
Review 3 (2003), 139–142.<br />
[11] LIMIN, F. : Neural Netwoks in Computer Intelligence, Mc-<br />
Graw-Hill Companies, New York, 1994.<br />
[12] CASTLE, D. A.—GIBBINS, B.—HAMER, P. S.: Journal of<br />
Forensic Science Society 34 (1994), 61–68.<br />
SLOVART G.T.G.<br />
s.r.o.<br />
GmbH<br />
E X P O R T - I M P O R T<br />
[13] SYROVÁ, L.—RAVAS, R.—GRMAN, J.: Use of Statistical<br />
Approach for Defectoscopy of Visualized Transparent Polymeric<br />
Foils, In 3rd International Conference on Measurement,<br />
Smolenice, Slovakia, 2001, pp. 385–388.<br />
E X P O R T - I M P O R T<br />
of periodicals and of non-periodically<br />
printed matters, books and CD - ROM s<br />
Krupinská 4 PO BOX 152, 852 99 Bratislava 5,Slovakia<br />
tel.: ++ 421 2 638 39 472-3, fax.: ++ 421 2 63 839 485<br />
e-mail: gtg@internet.sk, http://www.slovart-gtg.sk<br />
Received 11 June 2007<br />
Lívia Syrová (Doc, Ing, CSc) was born in Levice, Czechoslovakia.<br />
She graduated from the Faculty of Electrical Engineering<br />
of the Slovak Technical University in Bratislava and<br />
gained her CSc (PhD) degree in electrical engineering. At<br />
present she is Associate Professor at the Department of Measurement<br />
of the Faculty of Electrical Engineering and Information<br />
Technology, Slovak University of Technology, Bratislava.<br />
The main field of her research are methods of technical diagnostics.<br />
Rudolf Ravas (Doc, Ing, CSc) was born in Borsk´y Jur,<br />
Czechoslovakia, on May 29, 1952. He received the Ing (MSc)<br />
degree and the CSc (PhD) degree in electrical engineering<br />
from the Faculty of Electrical Engineering of the Slovak Technical<br />
University in Bratislava, Czechoslovakia, in 1975 and<br />
1983, respectively. From 1975 till 1978 he was with the Research<br />
Institute of Civil Engineering Bratislava. At present he<br />
is Associate professor at the Department of Measurement of<br />
the Faculty of Electrical Engineering and Information Technology,<br />
Slovak University of Technology, Bratislava. The main<br />
field of his interests is the theory of measurement, computer<br />
vision and technical diagnostics.<br />
Ján Grman (Mgr) was born in Topol’čany, Slovakia. He<br />
graduated from the Faculty of Mathematics, Physics and Informatics<br />
of the Comenius University in Bratislava. At present<br />
he is Assistant Professor at the Department of Measurement<br />
of the Faculty of Electrical Engineering and Information Technology<br />
, Slovak University of Technology, Bratislava. The main<br />
field of his research are topics of nondestructive defectoscopy<br />
by eddy-current techniques.<br />
SLOVART<br />
G.T.G.<br />
s.r.o.<br />
GmbH<br />
E X P O R T - I M P O R T