FINAL_PlaceMatters-ChildrensHealth_District_7

Create successful ePaper yourself
Turn your PDF publications into a flip-book with our unique Google optimized e-Paper software.
COUNCIL<br />
DISTRICT<br />
7<br />
RANKING: *<br />
10<br />
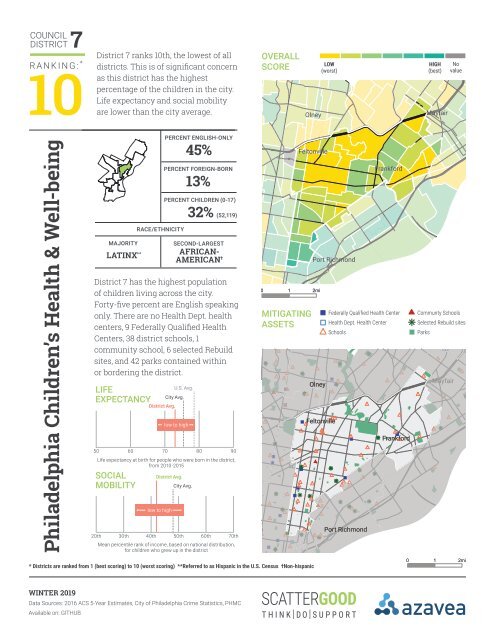
istrict ranks th the lowest of all<br />
districts. his is of significant concern<br />
as this district has the highest<br />
percentage of the children in the city.<br />
Life expectancy and social mobility<br />
are lower than the city average.<br />
OVERALL<br />
SCORE<br />
Olney<br />
LOW<br />
(worst)<br />
HIGH<br />
(best)<br />
Mayfair<br />
No<br />
value<br />
Philadelphia Children’s Health & Well-being<br />
MAJORITY<br />
LATINX **<br />
PERCENT ENGLISH-ONLY<br />
45%<br />
PERCENT FOREIGN-BORN<br />
13%<br />
PERCENT CHILDREN (0-17)<br />
32% (52,119)<br />
SECOND-LARGEST<br />
AFRICAN-<br />
AMERICAN †<br />
<strong>District</strong> 7 has the highest population<br />
of children living across the city.<br />
ortyfive percent are nglish speaking<br />
only. There are no Health Dept. health<br />
centers ederally ualified ealth<br />
Centers, 38 district schools, 1<br />
community school, 6 selected Rebuild<br />
sites and parks contained within<br />
or bordering the district.<br />
LIFE<br />
EXPECTANCY<br />
RACE/ETHNICITY<br />
City Avg.<br />
<strong>District</strong> Avg.<br />
U.S. Avg.<br />
low to high<br />
50 60 70 80 90<br />
Life expectancy at birth for people who were born in the district,<br />
from 2010-2015<br />
SOCIAL<br />
MOBILITY<br />
<strong>District</strong> Avg.<br />
low to high<br />
City Avg.<br />
20th 30th 40th 50th 60th 70th<br />
Mean percentile rank of income, based on national distribution,<br />
for children who grew up in the district<br />
MITIGATING<br />
ASSETS<br />
Feltonville<br />
0 1 2mi<br />
Port Richmond<br />
Olney<br />
Feltonville<br />
Federally Qualified Health Center<br />
Health Dept. Health Center<br />
Schools<br />
Port Richmond<br />
Frankford<br />
Frankford<br />
Communty Schools<br />
Selected Rebuild sites<br />
Parks<br />
Mayfair<br />
* <strong>District</strong>s are ranked from 1 (best scoring) to 10 (worst scoring) **Referred to as Hispanic in the U.S. Census †Non-hispanic<br />
0 1 2mi<br />
WINTER 2019<br />
Data Sources: 2016 ACS 5-Year Estimates, City of Philadelphia Crime Statistics, PHMC<br />
Available on: GITHUB
Philadelphia Children’s Health & Well-being<br />
RISK SCORE<br />
dults eperiencing an dverse hildhood<br />
perience is in the th percentile.<br />
ow educational attainment and family<br />
poverty are in the th and th percentiles.<br />
PERCENTILE<br />
100<br />
80<br />
60<br />
40<br />
20<br />
AVG.<br />
SCORE<br />
82.3<br />
ASSET SCORE<br />
There is high behavioral health and<br />
utiliation. chool quality is below the<br />
th percentile.<br />
PERCENTILE<br />
100<br />
80<br />
60<br />
40<br />
20<br />
AVG.<br />
SCORE<br />
58.7<br />
COUNCIL<br />
DISTRICT<br />
7<br />
RANKING:<br />
10<br />
0<br />
Crime<br />
Educational<br />
Attainment<br />
Poverty Unemployment<br />
ACEs<br />
0<br />
School<br />
Quality<br />
Parks &<br />
Recreation<br />
Food<br />
Access<br />
SNAP<br />
Utilization<br />
Behavioral<br />
Health<br />
Utilization<br />
Risk Score<br />
Asset Score<br />
Lowest Highest Lowest Highest<br />
No<br />
Value<br />
No<br />
Value<br />
MITIGATING ASSETS<br />
<strong>District</strong> 7 Best Score Comparison<br />
Score (<strong>District</strong> #)<br />
School Quality 38.1 82.3 (10)<br />
Park and Recreation Access 44.7 72.9 (5)<br />
Fresh Food Access 54.4 73.4 (1)<br />
SNAP Utilization 77.9 77.9 (7)<br />
Children’s Behavioral Health Services Utilization 78.4 78.4 (7)<br />
0 25 50 75 100<br />
KEY TAKEAWAY<br />
istrict ranked the lowest across the city. lmost every adult living here reported eposure to childhood trauma.<br />
hat said the district has assets to build upon particularly behavioral health and utiliation. t is good that<br />
residents are accessing these services and they should be used to help mitigate the significant risks in this district.<br />
iven that atin comprise the largest ethnic group assets and risks must be considered from a cultural contet.<br />
WINTER 2019<br />
Data Sources: 2016 ACS 5-Year Estimates, City of Philadelphia Crime Statistics, PHMC<br />
For full report, see scattergoodfoundation.org