May 2019 WCN Digital Edition

Create successful ePaper yourself
Turn your PDF publications into a flip-book with our unique Google optimized e-Paper software.
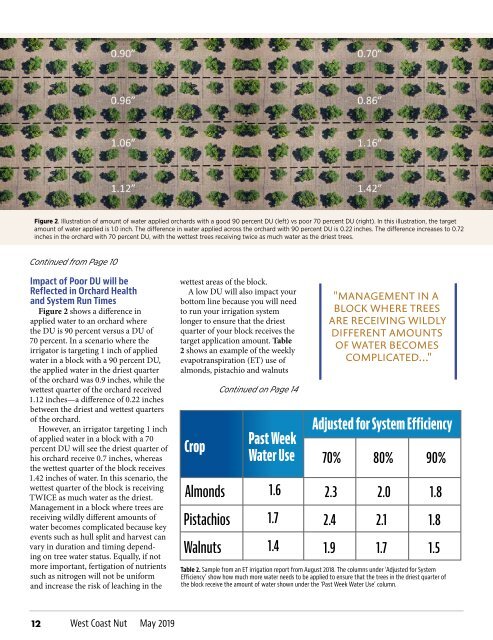
Figure 2. Illustration of amount of water applied orchards with a good 90 percent DU (left) vs poor 70 percent DU (right). In this illustration, the target<br />
amount of water applied is 1.0 inch. The difference in water applied across the orchard with 90 percent DU is 0.22 inches. The difference increases to 0.72<br />
inches in the orchard with 70 percent DU, with the wettest trees receiving twice as much water as the driest trees.<br />
Continued from Page 10<br />
Impact of Poor DU will be<br />
Reflected in Orchard Health<br />
and System Run Times<br />
Figure 2 shows a difference in<br />
applied water to an orchard where<br />
the DU is 90 percent versus a DU of<br />
70 percent. In a scenario where the<br />
irrigator is targeting 1 inch of applied<br />
water in a block with a 90 percent DU,<br />
the applied water in the driest quarter<br />
of the orchard was 0.9 inches, while the<br />
wettest quarter of the orchard received<br />
1.12 inches—a difference of 0.22 inches<br />
between the driest and wettest quarters<br />
of the orchard.<br />
However, an irrigator targeting 1 inch<br />
of applied water in a block with a 70<br />
percent DU will see the driest quarter of<br />
his orchard receive 0.7 inches, whereas<br />
the wettest quarter of the block receives<br />
1.42 inches of water. In this scenario, the<br />
wettest quarter of the block is receiving<br />
TWICE as much water as the driest.<br />
Management in a block where trees are<br />
receiving wildly different amounts of<br />
water becomes complicated because key<br />
events such as hull split and harvest can<br />
vary in duration and timing depending<br />
on tree water status. Equally, if not<br />
more important, fertigation of nutrients<br />
such as nitrogen will not be uniform<br />
and increase the risk of leaching in the<br />
wettest areas of the block.<br />
A low DU will also impact your<br />
bottom line because you will need<br />
to run your irrigation system<br />
longer to ensure that the driest<br />
quarter of your block receives the<br />
target application amount. Table<br />
2 shows an example of the weekly<br />
evapotranspiration (ET) use of<br />
almonds, pistachio and walnuts<br />
Crop<br />
Almonds<br />
Pistachios<br />
Walnuts<br />
Continued on Page 14<br />
Past Week<br />
Water Use<br />
1.6<br />
1.7<br />
1.4<br />
["MANAGEMENT IN A<br />
BLOCK WHERE TREES<br />
ARE RECEIVING WILDLY<br />
DIFFERENT AMOUNTS<br />
OF WATER BECOMES<br />
COMPLICATED..."<br />
Adjusted for System Efficiency<br />
70%<br />
Table 2. Sample from an ET irrigation report from August 2018. The columns under ‘Adjusted for System<br />
Efficiency’ show how much more water needs to be applied to ensure that the trees in the driest quarter of<br />
the block receive the amount of water shown under the ‘Past Week Water Use’ column.<br />
2.3<br />
2.4<br />
1.9<br />
80% 90%<br />
2.0<br />
2.1<br />
1.7<br />
1.8<br />
1.8<br />
1.5<br />
[<br />
12<br />
West Coast Nut <strong>May</strong> <strong>2019</strong>