Assessment of disease and effects on yield - Australasian Plant ...
Assessment of disease and effects on yield - Australasian Plant ...
Assessment of disease and effects on yield - Australasian Plant ...

You also want an ePaper? Increase the reach of your titles
YUMPU automatically turns print PDFs into web optimized ePapers that Google loves.
326 J ohn Brotun <str<strong>on</strong>g>and</str<strong>on</strong>g> Philio Ke ane<br />
Other critical point approaches use observati<strong>on</strong>s <str<strong>on</strong>g>of</str<strong>on</strong>g> <str<strong>on</strong>g>disease</str<strong>on</strong>g>-free periods or<br />
<str<strong>on</strong>g>disease</str<strong>on</strong>g> thresholds to predict crop losses. In the United Kingdom, 75o/o late<br />
blight severity is used as a predictor <str<strong>on</strong>g>of</str<strong>on</strong>g> crop loss in potato. If it occurs in late<br />
July (mid-summer), 5Oo/o loss is predicted, but if it does not occur until mid-<br />
September (early autumn) <strong>on</strong>ly a 4%o loss is predicted.<br />
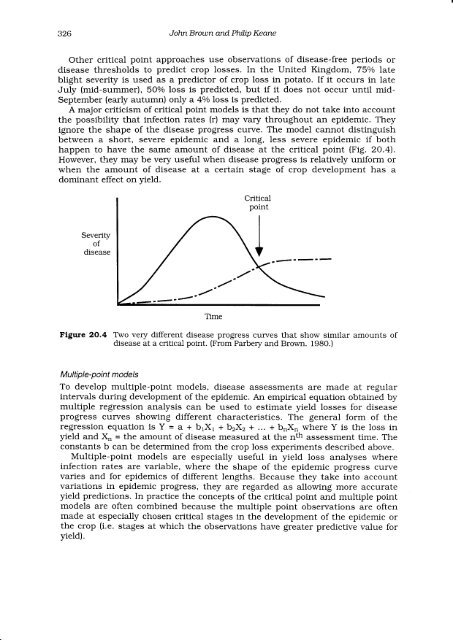
A major criticism <str<strong>on</strong>g>of</str<strong>on</strong>g> critical point models is that they do not take into account<br />
the possibility that infecti<strong>on</strong> rates (r) may vary throughout an epidemic. They<br />
ignore the shape <str<strong>on</strong>g>of</str<strong>on</strong>g> the <str<strong>on</strong>g>disease</str<strong>on</strong>g> progress curve. The model cannot distinguish<br />
between a short, severe epidemic <str<strong>on</strong>g>and</str<strong>on</strong>g> a l<strong>on</strong>g, less severe epidemic if both<br />
happen to have the same amount <str<strong>on</strong>g>of</str<strong>on</strong>g> <str<strong>on</strong>g>disease</str<strong>on</strong>g> at the critical point (Fig. 20.4).<br />
However, they may be very useful when <str<strong>on</strong>g>disease</str<strong>on</strong>g> progress is relatively uniform or<br />
when the amount <str<strong>on</strong>g>of</str<strong>on</strong>g> <str<strong>on</strong>g>disease</str<strong>on</strong>g> at a certain stage <str<strong>on</strong>g>of</str<strong>on</strong>g> crop development has a<br />
dominant effect <strong>on</strong> <strong>yield</strong>.<br />
Severity<br />
<str<strong>on</strong>g>of</str<strong>on</strong>g><br />
<str<strong>on</strong>g>disease</str<strong>on</strong>g><br />
lime<br />
Figure 2O.4 Two very different <str<strong>on</strong>g>disease</str<strong>on</strong>g> progress curves that show similar amounts <str<strong>on</strong>g>of</str<strong>on</strong>g><br />
<str<strong>on</strong>g>disease</str<strong>on</strong>g> at a critical point. (From Parbery <str<strong>on</strong>g>and</str<strong>on</strong>g> Brown. 1980.)<br />
Multiple-point models<br />
To develop multiple-point models, <str<strong>on</strong>g>disease</str<strong>on</strong>g> assessments are made at regular<br />
intervals during development <str<strong>on</strong>g>of</str<strong>on</strong>g> the epidemic. An empirical equati<strong>on</strong> obtained by<br />
multiple regressi<strong>on</strong> analysis can be used to estimate <strong>yield</strong> losses for <str<strong>on</strong>g>disease</str<strong>on</strong>g><br />
progress curves showing different characteristics. The general form <str<strong>on</strong>g>of</str<strong>on</strong>g> the<br />
regressi<strong>on</strong> equati<strong>on</strong> is Y = a + brXl +b2X2 + ... + br,X. where Y is the loss in<br />
<strong>yield</strong> <str<strong>on</strong>g>and</str<strong>on</strong>g> Xr, = the amount <str<strong>on</strong>g>of</str<strong>on</strong>g> <str<strong>on</strong>g>disease</str<strong>on</strong>g> measured at the nft assessment time. The<br />
c<strong>on</strong>stants b can be determined from the crop loss experiments described above.<br />
Multiple-point models are especially useful in <strong>yield</strong> loss analyses where<br />
infecti<strong>on</strong> rates are variable, where the shape <str<strong>on</strong>g>of</str<strong>on</strong>g> the epidemic progress curve<br />
varies <str<strong>on</strong>g>and</str<strong>on</strong>g> for epidemics <str<strong>on</strong>g>of</str<strong>on</strong>g> different lengths. Because they take into account<br />
variati<strong>on</strong>s in epidemic progress, they are regarded as allowing more accurate<br />
<strong>yield</strong> predicti<strong>on</strong>s. In practice the c<strong>on</strong>cepts <str<strong>on</strong>g>of</str<strong>on</strong>g> the critical point <str<strong>on</strong>g>and</str<strong>on</strong>g> multiple point<br />
models are <str<strong>on</strong>g>of</str<strong>on</strong>g>ten combined because the multiple point observati<strong>on</strong>s are <str<strong>on</strong>g>of</str<strong>on</strong>g>ten<br />
made at especially chosen critical stages in the deveiopment <str<strong>on</strong>g>of</str<strong>on</strong>g> the epidemic or<br />
the crop (i.e. stages at which the observati<strong>on</strong>s have greater predictive value for<br />
<strong>yield</strong>).


![[Compatibility Mode].pdf](https://img.yumpu.com/27318716/1/190x135/compatibility-modepdf.jpg?quality=85)