Assessment of disease and effects on yield - Australasian Plant ...
Assessment of disease and effects on yield - Australasian Plant ...
Assessment of disease and effects on yield - Australasian Plant ...

Create successful ePaper yourself
Turn your PDF publications into a flip-book with our unique Google optimized e-Paper software.
20<br />
ASSESSMENT OF DISEASE AND EFFECTS ON YIELD<br />
G<strong>on</strong>tents<br />
John Brown <str<strong>on</strong>g>and</str<strong>on</strong>g> Philip Keane<br />
2O.1 Introducti<strong>on</strong>............... .,.............315<br />
20.2 <str<strong>on</strong>g>Assessment</str<strong>on</strong>g> oJ crop grotuth <str<strong>on</strong>g>and</str<strong>on</strong>g> deueLopment..... ...317<br />
2O. 3 Methods Jor assessing <str<strong>on</strong>g>disease</str<strong>on</strong>g>. incidence <str<strong>on</strong>g>and</str<strong>on</strong>g> seuerttg .,......... 3 1 I<br />
Measurement oJ dtse as e tncidence <str<strong>on</strong>g>and</str<strong>on</strong>g> seueritq .................... 3 1 I<br />
SampLing Jor di"s ease tnctdence <str<strong>on</strong>g>and</str<strong>on</strong>g> s euerity assess ments. . 3 2 3<br />
20.4 <str<strong>on</strong>g>Assessment</str<strong>on</strong>g> oJ crop losses....... ...............324<br />
The experimentaL approach. ..................324<br />
The statistical approacfL.............. ............327<br />
2O.5 PLant <str<strong>on</strong>g>disease</str<strong>on</strong>g> surueAs ............328<br />
20.6 nrrther readtng ......328<br />
20.1 lntroducti<strong>on</strong><br />
<str<strong>on</strong>g>Assessment</str<strong>on</strong>g> or measurement <str<strong>on</strong>g>of</str<strong>on</strong>g> <str<strong>on</strong>g>disease</str<strong>on</strong>g> is the basis <str<strong>on</strong>g>of</str<strong>on</strong>g> epidemiologr which is the<br />
study <str<strong>on</strong>g>of</str<strong>on</strong>g> <str<strong>on</strong>g>disease</str<strong>on</strong>g> at the level <str<strong>on</strong>g>of</str<strong>on</strong>g> populati<strong>on</strong>s <str<strong>on</strong>g>of</str<strong>on</strong>g> pathogens <str<strong>on</strong>g>and</str<strong>on</strong>g> hosts. It is also the<br />
basis <str<strong>on</strong>g>of</str<strong>on</strong>g> the study <str<strong>on</strong>g>of</str<strong>on</strong>g> the <str<strong>on</strong>g>effects</str<strong>on</strong>g> <str<strong>on</strong>g>of</str<strong>on</strong>g> <str<strong>on</strong>g>disease</str<strong>on</strong>g> <strong>on</strong> crop <strong>yield</strong> <str<strong>on</strong>g>and</str<strong>on</strong>g> <str<strong>on</strong>g>of</str<strong>on</strong>g> <str<strong>on</strong>g>disease</str<strong>on</strong>g><br />
forecasting (Chapter l9), which involves the predicti<strong>on</strong> <str<strong>on</strong>g>of</str<strong>on</strong>g> the amount <str<strong>on</strong>g>of</str<strong>on</strong>g> <str<strong>on</strong>g>disease</str<strong>on</strong>g><br />
that is likely to occur at some time in the future.<br />
It is usually not sufficient to determine whether a <str<strong>on</strong>g>disease</str<strong>on</strong>g> is present or<br />
absent. The critical informati<strong>on</strong> required is the amount <str<strong>on</strong>g>of</str<strong>on</strong>g> <str<strong>on</strong>g>disease</str<strong>on</strong>g> that is<br />
present. Disease <str<strong>on</strong>g>of</str<strong>on</strong>g>ten has to exceed a certain threshold before it reduces the<br />
<strong>yield</strong> <str<strong>on</strong>g>of</str<strong>on</strong>g> a crop. Small amounts have little effect <strong>on</strong> <strong>yield</strong> <str<strong>on</strong>g>and</str<strong>on</strong>g> the <str<strong>on</strong>g>disease</str<strong>on</strong>g> may not<br />
be worth c<strong>on</strong>trolling. The amount <str<strong>on</strong>g>of</str<strong>on</strong>g> <str<strong>on</strong>g>disease</str<strong>on</strong>g> is measured as the proporti<strong>on</strong> <str<strong>on</strong>g>of</str<strong>on</strong>g> the<br />
crop populati<strong>on</strong> (counted as individual plants or branches or leaves etc.) that is<br />
infected (<str<strong>on</strong>g>disease</str<strong>on</strong>g> incidence) or the proporti<strong>on</strong> <str<strong>on</strong>g>of</str<strong>on</strong>g> the area <str<strong>on</strong>g>of</str<strong>on</strong>g> a plant or plant<br />
organ (e.g. leaf area) that is affected (<str<strong>on</strong>g>disease</str<strong>on</strong>g> severity). In some cases, the<br />
proporti<strong>on</strong> <str<strong>on</strong>g>of</str<strong>on</strong>g> leaves or branches infected may provide a measure <str<strong>on</strong>g>of</str<strong>on</strong>g> <str<strong>on</strong>g>disease</str<strong>on</strong>g><br />
severity.<br />
Although it is known that plant <str<strong>on</strong>g>disease</str<strong>on</strong>g>s reduce crop <strong>yield</strong>s compared to <strong>yield</strong>s<br />
that could be expected in the absence <str<strong>on</strong>g>of</str<strong>on</strong>g> <str<strong>on</strong>g>disease</str<strong>on</strong>g>, it is usually difficult to obtain<br />
accurate quantitative estimates <str<strong>on</strong>g>of</str<strong>on</strong>g> <strong>yield</strong> reducti<strong>on</strong>s caused by specific <str<strong>on</strong>g>disease</str<strong>on</strong>g>s.<br />
Many <str<strong>on</strong>g>disease</str<strong>on</strong>g>s occur <strong>on</strong> senescing tissue which may not have been c<strong>on</strong>tributing<br />
much to <strong>yield</strong>. <strong>Plant</strong>s are capable <str<strong>on</strong>g>of</str<strong>on</strong>g> compensating for loss <str<strong>on</strong>g>of</str<strong>on</strong>g> a certain amount <str<strong>on</strong>g>of</str<strong>on</strong>g><br />
leaf area, especially in crowded crop populati<strong>on</strong>s. The <strong>on</strong>ly <str<strong>on</strong>g>disease</str<strong>on</strong>g>s where the<br />
effect <strong>on</strong> <strong>yield</strong> is relatively easy to measure are those that kill entire trees in<br />
orchards or plantati<strong>on</strong>s (e.g. phy'tophthora root or collar rot <str<strong>on</strong>g>of</str<strong>on</strong>g> citrus or apple),<br />
<str<strong>on</strong>g>and</str<strong>on</strong>g> those that destroy the actual harvested product, either just before harvest<br />
(e.g. the smuts, which destroy cereal grain, <str<strong>on</strong>g>and</str<strong>on</strong>g> fruit rots such as cocoa pod rot<br />
caused by Phgtophthora palmiuora) or after harvest (all postharvest rots <str<strong>on</strong>g>of</str<strong>on</strong>g> fruits<br />
<str<strong>on</strong>g>and</str<strong>on</strong>g> vegetables).<br />
Reduced <strong>yield</strong>s caused by pests <str<strong>on</strong>g>and</str<strong>on</strong>g> <str<strong>on</strong>g>disease</str<strong>on</strong>g>s are comm<strong>on</strong>ly referred to as<br />
'crop losses', although some pathologists prefer to think <str<strong>on</strong>g>of</str<strong>on</strong>g> <str<strong>on</strong>g>disease</str<strong>on</strong>g> as a '<strong>yield</strong>
316 John Brotun <str<strong>on</strong>g>and</str<strong>on</strong>g> Philip Keane<br />
limiting' factor or a 'c<strong>on</strong>straint <strong>on</strong> <strong>yield</strong>' rather than as a cause <str<strong>on</strong>g>of</str<strong>on</strong>g> 'crop loss',<br />
c<strong>on</strong>tending that you cannot lose what you never had in the first place. Viewed in<br />
this way, the impact <str<strong>on</strong>g>of</str<strong>on</strong>g> <str<strong>on</strong>g>disease</str<strong>on</strong>g> is expressed more directly as the increase in<br />
<strong>yield</strong> when it is c<strong>on</strong>trolled rather than as the preventi<strong>on</strong> <str<strong>on</strong>g>of</str<strong>on</strong>g> a 'crop loss'.<br />
However, 'crop loss' is a useful shorth<str<strong>on</strong>g>and</str<strong>on</strong>g> way <str<strong>on</strong>g>of</str<strong>on</strong>g> expressing the impact <str<strong>on</strong>g>of</str<strong>on</strong>g> a<br />
<str<strong>on</strong>g>disease</str<strong>on</strong>g> <str<strong>on</strong>g>and</str<strong>on</strong>g> it is certainly <strong>on</strong>e that farmers underst<str<strong>on</strong>g>and</str<strong>on</strong>g> when they compare their<br />
<strong>yield</strong>s in <strong>on</strong>e year in the presence <str<strong>on</strong>g>of</str<strong>on</strong>g> <str<strong>on</strong>g>disease</str<strong>on</strong>g> with their <strong>yield</strong>s in previous years<br />
in the absence <str<strong>on</strong>g>of</str<strong>on</strong>g> <str<strong>on</strong>g>disease</str<strong>on</strong>g>.<br />
Disease <str<strong>on</strong>g>and</str<strong>on</strong>g> crop loss assessments are necessary before the ec<strong>on</strong>omic impact<br />
<str<strong>on</strong>g>of</str<strong>on</strong>g> a <str<strong>on</strong>g>disease</str<strong>on</strong>g> <str<strong>on</strong>g>and</str<strong>on</strong>g> the benefit <str<strong>on</strong>g>of</str<strong>on</strong>g> particular c<strong>on</strong>trol strategies can be determined.<br />
Ideally, this knowledge is required before much effort is expended <strong>on</strong> studying a<br />
particular <str<strong>on</strong>g>disease</str<strong>on</strong>g>. In reality, most <str<strong>on</strong>g>disease</str<strong>on</strong>g>s have been studied because people<br />
sensed that they were causing <strong>yield</strong> losses <str<strong>on</strong>g>and</str<strong>on</strong>g> therefore required study <str<strong>on</strong>g>and</str<strong>on</strong>g> the<br />
development <str<strong>on</strong>g>of</str<strong>on</strong>g> c<strong>on</strong>trol measures. The ec<strong>on</strong>omic advantage <str<strong>on</strong>g>of</str<strong>on</strong>g> any c<strong>on</strong>trol method<br />
has to be determined. It is no use implementing a c<strong>on</strong>trol measure that costs the<br />
farmer more than it returns in increased <strong>yield</strong>. Often in the past the ec<strong>on</strong>omic<br />
value <str<strong>on</strong>g>of</str<strong>on</strong>g> c<strong>on</strong>trol measures was based <strong>on</strong> vague qualitative assessments, but for a<br />
more accurate measurement <str<strong>on</strong>g>of</str<strong>on</strong>g> ec<strong>on</strong>omic advantage, <str<strong>on</strong>g>disease</str<strong>on</strong>g> assessments have<br />
to be quantitative. The growth <str<strong>on</strong>g>of</str<strong>on</strong>g> the crop, its <strong>yield</strong> potential, the development <str<strong>on</strong>g>of</str<strong>on</strong>g><br />
the <str<strong>on</strong>g>disease</str<strong>on</strong>g> <str<strong>on</strong>g>and</str<strong>on</strong>g> its impact <strong>on</strong> <strong>yield</strong> all have to be measured as a basis for<br />
predicting the impact <strong>on</strong> <strong>yield</strong> <str<strong>on</strong>g>of</str<strong>on</strong>g> particular levels <str<strong>on</strong>g>of</str<strong>on</strong>g> <str<strong>on</strong>g>disease</str<strong>on</strong>g>. This informati<strong>on</strong><br />
can be combined with predicti<strong>on</strong>s <str<strong>on</strong>g>of</str<strong>on</strong>g> likely <str<strong>on</strong>g>disease</str<strong>on</strong>g> levels in deciding whether<br />
implementati<strong>on</strong> <str<strong>on</strong>g>of</str<strong>on</strong>g> c<strong>on</strong>trol measures is warranted.<br />
The ec<strong>on</strong>omic advantage <str<strong>on</strong>g>of</str<strong>on</strong>g> any c<strong>on</strong>trol strategy can be estimated by applying<br />
the following formula:<br />
r \<br />
Ec<strong>on</strong>omic Expected return if lExpected return if Cost <str<strong>on</strong>g>of</str<strong>on</strong>g> I<br />
advantage <str<strong>on</strong>g>of</str<strong>on</strong>g> = <str<strong>on</strong>g>disease</str<strong>on</strong>g> is lthe <str<strong>on</strong>g>disease</str<strong>on</strong>g> is left + c<strong>on</strong>trol I<br />
<str<strong>on</strong>g>disease</str<strong>on</strong>g> c<strong>on</strong>trol ($) c<strong>on</strong>trolled ($) | unc<strong>on</strong>trolled ($) treatment ($)l<br />
\ - )<br />
The ec<strong>on</strong>omic advantage <str<strong>on</strong>g>of</str<strong>on</strong>g> c<strong>on</strong>trol is clearly affected by the difference<br />
between the ec<strong>on</strong>omic return if the <str<strong>on</strong>g>disease</str<strong>on</strong>g> is c<strong>on</strong>trolled <str<strong>on</strong>g>and</str<strong>on</strong>g> the return if it is<br />
not, which is determined by the 'crop loss' caused by the <str<strong>on</strong>g>disease</str<strong>on</strong>g>, the<br />
measurement <str<strong>on</strong>g>of</str<strong>on</strong>g> which is the main c<strong>on</strong>cerrr <str<strong>on</strong>g>of</str<strong>on</strong>g> this chapter. However, this is also<br />
determined by the ec<strong>on</strong>omic value <str<strong>on</strong>g>of</str<strong>on</strong>g> the crop. A crop like c<str<strong>on</strong>g>of</str<strong>on</strong>g>fee, cocoa,<br />
macadamia nuts or a vegetable with a very high value per unit weight <str<strong>on</strong>g>of</str<strong>on</strong>g><br />
harvested product, will be able to sustain a greater expenditure <strong>on</strong> <str<strong>on</strong>g>disease</str<strong>on</strong>g><br />
c<strong>on</strong>trol than a relatively low value producti<strong>on</strong> system such as a pasture. The<br />
<strong>yield</strong> potential <str<strong>on</strong>g>of</str<strong>on</strong>g> a crop <str<strong>on</strong>g>and</str<strong>on</strong>g> hence the ec<strong>on</strong>omic return if <str<strong>on</strong>g>disease</str<strong>on</strong>g> is c<strong>on</strong>trolled<br />
also determines the amount <str<strong>on</strong>g>of</str<strong>on</strong>g> expenditure <strong>on</strong> <str<strong>on</strong>g>disease</str<strong>on</strong>g> c<strong>on</strong>trol that can be<br />
sustained. Australian wheat farmers producing an average <str<strong>on</strong>g>of</str<strong>on</strong>g> about 2 t<strong>on</strong>nes per<br />
hectare under c<strong>on</strong>diti<strong>on</strong>s <str<strong>on</strong>g>of</str<strong>on</strong>g> water <str<strong>on</strong>g>and</str<strong>on</strong>g> nutrient deficit can spend less to c<strong>on</strong>trol<br />
stripe rust (Puccinta striif,ornis) than European farmers who produce an average<br />
<str<strong>on</strong>g>of</str<strong>on</strong>g> about B t<strong>on</strong>nes per hectare under more favourable envir<strong>on</strong>mental c<strong>on</strong>diti<strong>on</strong>s.<br />
It is obvious therefore, that decisi<strong>on</strong>s based <strong>on</strong> <str<strong>on</strong>g>disease</str<strong>on</strong>g> assessment data are<br />
critical in the ec<strong>on</strong>omy <str<strong>on</strong>g>of</str<strong>on</strong>g> any farm. Furthermore, from the nati<strong>on</strong>al st<str<strong>on</strong>g>and</str<strong>on</strong>g>point,<br />
<str<strong>on</strong>g>disease</str<strong>on</strong>g> assessment informati<strong>on</strong> is fundamental for the predicti<strong>on</strong> <str<strong>on</strong>g>of</str<strong>on</strong>g> crop <strong>yield</strong>s<br />
as a basis for the smooth running <str<strong>on</strong>g>of</str<strong>on</strong>g> markets <str<strong>on</strong>g>and</str<strong>on</strong>g> financial planning. It also<br />
enables problem areas to be recognised <str<strong>on</strong>g>and</str<strong>on</strong>g> permits priorities for future<br />
research <str<strong>on</strong>g>and</str<strong>on</strong>g> development to be placed <strong>on</strong> a sound ec<strong>on</strong>omic basis.<br />
Much <str<strong>on</strong>g>of</str<strong>on</strong>g> the published work <strong>on</strong> <str<strong>on</strong>g>disease</str<strong>on</strong>g> assessment <str<strong>on</strong>g>and</str<strong>on</strong>g> crop losses has been<br />
qualitative rather than quantitative. This has led to <str<strong>on</strong>g>disease</str<strong>on</strong>g> incidence being<br />
described in vague terms such as 'severe', 'debilitating', 'mild' or '<str<strong>on</strong>g>of</str<strong>on</strong>g> little
20. <str<strong>on</strong>g>Assessment</str<strong>on</strong>g> oJ <str<strong>on</strong>g>disease</str<strong>on</strong>g> <str<strong>on</strong>g>and</str<strong>on</strong>g>. <str<strong>on</strong>g>effects</str<strong>on</strong>g> <strong>on</strong> gield 317<br />
c<strong>on</strong>sequence'. Qualitative assessment <str<strong>on</strong>g>of</str<strong>on</strong>g> <str<strong>on</strong>g>disease</str<strong>on</strong>g> provides inaccurate <str<strong>on</strong>g>and</str<strong>on</strong>g> <str<strong>on</strong>g>of</str<strong>on</strong>g>ten<br />
misleading data. It does not enable comparis<strong>on</strong>s to be made between the results<br />
<str<strong>on</strong>g>of</str<strong>on</strong>g> different workers or between results obtained from different seas<strong>on</strong>s or<br />
locati<strong>on</strong>s.<br />
Quantitative assessments <str<strong>on</strong>g>of</str<strong>on</strong>g> <str<strong>on</strong>g>disease</str<strong>on</strong>g> are based largely <strong>on</strong> comparis<strong>on</strong>s<br />
between the <strong>yield</strong>s obtained from <str<strong>on</strong>g>disease</str<strong>on</strong>g>d or damaged crops <str<strong>on</strong>g>and</str<strong>on</strong>g> those obtained<br />
from healthy or undamaged crops. Comparis<strong>on</strong>s can be made between <str<strong>on</strong>g>disease</str<strong>on</strong>g>d<br />
<str<strong>on</strong>g>and</str<strong>on</strong>g> <str<strong>on</strong>g>disease</str<strong>on</strong>g>-free plants in the same crop or between <str<strong>on</strong>g>disease</str<strong>on</strong>g>d <str<strong>on</strong>g>and</str<strong>on</strong>g> <str<strong>on</strong>g>disease</str<strong>on</strong>g>-free<br />
plants or crops grown in different locati<strong>on</strong>s, provided that the locati<strong>on</strong>s have<br />
similar envir<strong>on</strong>mental c<strong>on</strong>diti<strong>on</strong>s.<br />
One major difficulty associated with <str<strong>on</strong>g>disease</str<strong>on</strong>g> assessment is the rarity in nature<br />
<str<strong>on</strong>g>of</str<strong>on</strong>g> a '<strong>on</strong>e cause-<strong>on</strong>e <str<strong>on</strong>g>disease</str<strong>on</strong>g>' situati<strong>on</strong>. Under field c<strong>on</strong>diti<strong>on</strong>s, plant growth <str<strong>on</strong>g>and</str<strong>on</strong>g><br />
<strong>yield</strong> are influenced by many factors including nutrients, rainfall, insects, weeds<br />
<str<strong>on</strong>g>and</str<strong>on</strong>g> pathogens. It is difficult, therefore, to determine the relative importance <str<strong>on</strong>g>of</str<strong>on</strong>g><br />
different factors in limiting <strong>yield</strong>. There are <str<strong>on</strong>g>of</str<strong>on</strong>g>ten complex interacti<strong>on</strong>s between<br />
the c<strong>on</strong>straints <strong>on</strong> <strong>yield</strong>. For example, the impact <str<strong>on</strong>g>of</str<strong>on</strong>g> a root rotting pathogen will<br />
be much greater in a drought year than a wet year, or in an infertile soil than a<br />
fertile <strong>on</strong>e. The impact <str<strong>on</strong>g>of</str<strong>on</strong>g> foliar pathogens (e.g. rusts <str<strong>on</strong>g>and</str<strong>on</strong>g> powdery mildews) that<br />
disrupt the plant cuticle <str<strong>on</strong>g>and</str<strong>on</strong>g> so affect the water relati<strong>on</strong>s <str<strong>on</strong>g>of</str<strong>on</strong>g> a plant, will be<br />
greater in a dry than in a wet year.<br />
The assessment <str<strong>on</strong>g>of</str<strong>on</strong>g> plant <str<strong>on</strong>g>disease</str<strong>on</strong>g>s <str<strong>on</strong>g>and</str<strong>on</strong>g> their <str<strong>on</strong>g>effects</str<strong>on</strong>g> <strong>on</strong> <strong>yield</strong> normally involves<br />
five distinct processes: (i) developing a descriptive growth stage key for the<br />
particular crop species in questi<strong>on</strong>, (ii) developing methods to assess the<br />
incidence <str<strong>on</strong>g>and</str<strong>on</strong>g> severity <str<strong>on</strong>g>of</str<strong>on</strong>g> <str<strong>on</strong>g>disease</str<strong>on</strong>g>, (iii) developing statistically sound methods <str<strong>on</strong>g>of</str<strong>on</strong>g><br />
sampling crop populati<strong>on</strong>s for assessment <str<strong>on</strong>g>of</str<strong>on</strong>g> the amount <str<strong>on</strong>g>of</str<strong>on</strong>g> <str<strong>on</strong>g>disease</str<strong>on</strong>g>, (iv)<br />
estimating the negative impact <str<strong>on</strong>g>of</str<strong>on</strong>g> particular levels <str<strong>on</strong>g>of</str<strong>on</strong>g> the <str<strong>on</strong>g>disease</str<strong>on</strong>g> <strong>on</strong> crop <strong>yield</strong><br />
<str<strong>on</strong>g>and</str<strong>on</strong>g> quality <str<strong>on</strong>g>and</str<strong>on</strong>g> (v) evaluating the ec<strong>on</strong>omic benefit from various methods<br />
available for reducinA the amount <str<strong>on</strong>g>of</str<strong>on</strong>g> <str<strong>on</strong>g>disease</str<strong>on</strong>g>.<br />
20.2 <str<strong>on</strong>g>Assessment</str<strong>on</strong>g> <str<strong>on</strong>g>of</str<strong>on</strong>g> crop growth <str<strong>on</strong>g>and</str<strong>on</strong>g> development<br />
While plant pathology tends to c<strong>on</strong>centrate <strong>on</strong> the <str<strong>on</strong>g>disease</str<strong>on</strong>g>d plant, it should be<br />
realised that to underst<str<strong>on</strong>g>and</str<strong>on</strong>g> the impact <str<strong>on</strong>g>of</str<strong>on</strong>g> a <str<strong>on</strong>g>disease</str<strong>on</strong>g> fully it is necessary to<br />
underst<str<strong>on</strong>g>and</str<strong>on</strong>g> the growth, development <str<strong>on</strong>g>and</str<strong>on</strong>g> physiology <str<strong>on</strong>g>of</str<strong>on</strong>g> the healthy plant.<br />
One <str<strong>on</strong>g>of</str<strong>on</strong>g> the first steps in quantitative <str<strong>on</strong>g>disease</str<strong>on</strong>g> assessment is to obtain or<br />
develop a key that describes the growth <str<strong>on</strong>g>and</str<strong>on</strong>g> development <str<strong>on</strong>g>of</str<strong>on</strong>g> <str<strong>on</strong>g>disease</str<strong>on</strong>g>-free plants<br />
during the growing seas<strong>on</strong>. In annual plants, the keys describe development<br />
from the time <str<strong>on</strong>g>of</str<strong>on</strong>g> sowing or planting until harvest. In perennial species such as<br />
tree crops, variati<strong>on</strong>s in growth patterns between seas<strong>on</strong>s are described, <str<strong>on</strong>g>of</str<strong>on</strong>g>ten<br />
beginning with bud burst in spring. In tropical perennial crops the starting point<br />
is more difficult to determine since growth <str<strong>on</strong>g>of</str<strong>on</strong>g>ten occurs throughout the year. It is<br />
therefore <str<strong>on</strong>g>of</str<strong>on</strong>g>ten necessary to nominate a more arbitrary starting point (e.8. a<br />
parlicular growth flush at the beginning <str<strong>on</strong>g>of</str<strong>on</strong>g> the wet seas<strong>on</strong>).<br />
Detailed drawings or photographs are needed to show such characteristics as<br />
the structure <str<strong>on</strong>g>of</str<strong>on</strong>g> the canopy at various stages <str<strong>on</strong>g>of</str<strong>on</strong>g> crop growth, the formati<strong>on</strong> <str<strong>on</strong>g>of</str<strong>on</strong>g><br />
new leaves <str<strong>on</strong>g>and</str<strong>on</strong>g> the senescence <str<strong>on</strong>g>of</str<strong>on</strong>g> older leaves, the development <str<strong>on</strong>g>of</str<strong>on</strong>g> reproductive<br />
structures <str<strong>on</strong>g>and</str<strong>on</strong>g> different stages in the formati<strong>on</strong> <str<strong>on</strong>g>of</str<strong>on</strong>g> grain or other harvested<br />
products. Detailed informati<strong>on</strong> <strong>on</strong> the development <str<strong>on</strong>g>of</str<strong>on</strong>g> healthy plants is needed<br />
before the <str<strong>on</strong>g>effects</str<strong>on</strong>g> <str<strong>on</strong>g>of</str<strong>on</strong>g> <str<strong>on</strong>g>disease</str<strong>on</strong>g> <strong>on</strong> crop growth <str<strong>on</strong>g>and</str<strong>on</strong>g> development can be assessed.<br />
For example, it is important to distinguish between normal senescence <str<strong>on</strong>g>of</str<strong>on</strong>g> leaves<br />
<str<strong>on</strong>g>and</str<strong>on</strong>g> damage caused by parasites. Some parasitic fungi develop mainly <strong>on</strong><br />
senescing leaves <str<strong>on</strong>g>and</str<strong>on</strong>g> so their impact <strong>on</strong> <strong>yield</strong> is probably small. They may just<br />
be speeding up the process <str<strong>on</strong>g>of</str<strong>on</strong>g> decay <str<strong>on</strong>g>of</str<strong>on</strong>g> senescent leaves.
318 John Brotun a nd Philto Keane<br />
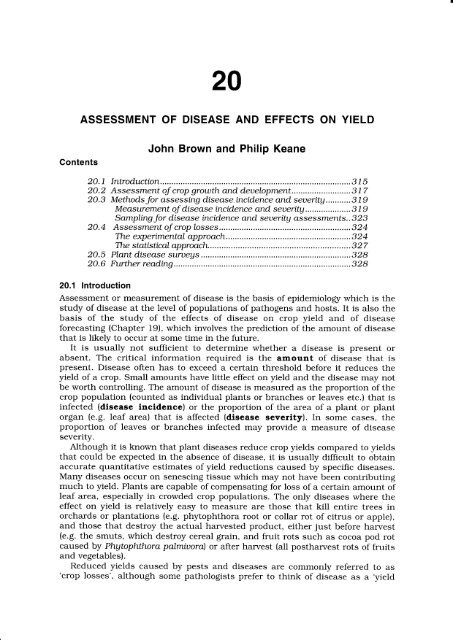
Descriptive <str<strong>on</strong>g>and</str<strong>on</strong>g> pictorial growth stage keys have been developed for a number<br />
<str<strong>on</strong>g>of</str<strong>on</strong>g> crops including wheat, oats, barley <str<strong>on</strong>g>and</str<strong>on</strong>g> rye (Fig. 20.1), rnaize, rice, tobacco,<br />
cott<strong>on</strong>, legumes, broad beans (Vicia Jaba), black currants <str<strong>on</strong>g>and</str<strong>on</strong>g> lVarcissus <str<strong>on</strong>g>and</str<strong>on</strong>g><br />
Chrysanthemum flowers. With some species, such as wheat, several different<br />
growth stage keys are in use. It is helpful if st<str<strong>on</strong>g>and</str<strong>on</strong>g>ardised growth stage keys are<br />
used around the world, enabling ready comparis<strong>on</strong> <str<strong>on</strong>g>of</str<strong>on</strong>g> results from different<br />
countries. However, with many crops that have been little studied, it may be<br />
necessary for investigators to c<strong>on</strong>struct their own keys.<br />
GROWTH STAGES<br />
IN CEREALS<br />
STEM EXTENSION<br />
STAGE<br />
7<br />
sac<strong>on</strong>d<br />
nodc<br />
visiblc<br />
ligulc ot<br />
STAGElost<br />
lcsl<br />
n<br />
lqst lcoi<br />
JUst<br />
vi sr bl?<br />
Grovth Stage<br />
1 One shoot (number <str<strong>on</strong>g>of</str<strong>on</strong>g> leaves can be added).<br />
2 Beginning <str<strong>on</strong>g>of</str<strong>on</strong>g> tillering.<br />
3 Tillers formed, leaves <str<strong>on</strong>g>of</str<strong>on</strong>g>ten twisted spirally. In some varieties <str<strong>on</strong>g>of</str<strong>on</strong>g> winter wheats,<br />
plants may be 'creeping' or prostrate.<br />
4 Beginning <str<strong>on</strong>g>of</str<strong>on</strong>g> the erecti<strong>on</strong> <str<strong>on</strong>g>of</str<strong>on</strong>g> the pseudo-stem, leaf sheaths beginning to<br />
lengthen.<br />
5 Pseudo-stem (formed by sheaths <str<strong>on</strong>g>of</str<strong>on</strong>g> leaves) str<strong>on</strong>gly erected.<br />
6 First node <str<strong>on</strong>g>of</str<strong>on</strong>g> stem visible at base <str<strong>on</strong>g>of</str<strong>on</strong>g> shoot.<br />
7 Sec<strong>on</strong>d node <str<strong>on</strong>g>of</str<strong>on</strong>g> stem formed, nexl-to-last leaf just visible.<br />
8 t ast leaf visible, but still rolled up, spike beginning to swell.<br />
9 Ligule <str<strong>on</strong>g>of</str<strong>on</strong>g> last leaf just visible.<br />
I0 Sheath <str<strong>on</strong>g>of</str<strong>on</strong>g> last leaf completely grown out, spike swollen but not yet visible.<br />
10. 1 First spikes just visible (awns just showing in barley, spike escaping through<br />
split <str<strong>on</strong>g>of</str<strong>on</strong>g> sheath in wheat or oats).<br />
IO.2 Quarter <str<strong>on</strong>g>of</str<strong>on</strong>g> heading process completed.<br />
10.4 Three-quarters <str<strong>on</strong>g>of</str<strong>on</strong>g> heading process completed.<br />
10.5 All spikes out <str<strong>on</strong>g>of</str<strong>on</strong>g> sheath.<br />
10.5.1 Beginning <str<strong>on</strong>g>of</str<strong>on</strong>g> flowering (wheat).<br />
f 0.5.2 Flowering complete to top <str<strong>on</strong>g>of</str<strong>on</strong>g> spike.<br />
10.5.3 Flowering over at base <str<strong>on</strong>g>of</str<strong>on</strong>g> spike.<br />
10.5.4 Flowering over, kernel watery ripe.<br />
l1.l Millcy ripe.<br />
ll.2 Mealy ripe, c<strong>on</strong>tents <str<strong>on</strong>g>of</str<strong>on</strong>g> kernel s<str<strong>on</strong>g>of</str<strong>on</strong>g>t but dry.<br />
f 1.3 Kernel hard (difficult to divide by thumb-nail).<br />
11.4 Ripe for cutting. straw dead.<br />
Figure 2O.1 The Feekes scale for describing growth stages <str<strong>on</strong>g>of</str<strong>on</strong>g> cereals. (From Large, 1954.<br />
Crown copyright is reproduced with the permissi<strong>on</strong> <str<strong>on</strong>g>of</str<strong>on</strong>g> the C<strong>on</strong>troller <str<strong>on</strong>g>of</str<strong>on</strong>g> Her<br />
Maj esty's Stati<strong>on</strong>ary Office. )<br />
\r+<br />
STAGE<br />
9<br />
ju:!<br />
vtstDtc<br />
\<br />
I<br />
rl
20. <str<strong>on</strong>g>Assessment</str<strong>on</strong>g> oJ <str<strong>on</strong>g>disease</str<strong>on</strong>g> <str<strong>on</strong>g>and</str<strong>on</strong>g> <str<strong>on</strong>g>effects</str<strong>on</strong>g> <strong>on</strong> gietd<br />
20.3 Methods for assessing <str<strong>on</strong>g>disease</str<strong>on</strong>g> incidence <str<strong>on</strong>g>and</str<strong>on</strong>g> severity<br />
Disease assessment methods should (i) provide objective measurements so that<br />
results obtained by different workers, from different locati<strong>on</strong>s <str<strong>on</strong>g>and</str<strong>on</strong>g> from different<br />
seas<strong>on</strong>s are comparable, (ii) be simple <str<strong>on</strong>g>and</str<strong>on</strong>g> quick to use, (iii) be related to an<br />
identifiable growth stage <str<strong>on</strong>g>of</str<strong>on</strong>g> the crop <str<strong>on</strong>g>and</str<strong>on</strong>g> (iv) provide an adequate sample <str<strong>on</strong>g>of</str<strong>on</strong>g> the<br />
entire area <str<strong>on</strong>g>of</str<strong>on</strong>g> crop to which the assessment refers.<br />
Thus, <str<strong>on</strong>g>disease</str<strong>on</strong>g> assessment <str<strong>on</strong>g>of</str<strong>on</strong>g> a crop encompasses two main aspectsassessment<br />
<str<strong>on</strong>g>of</str<strong>on</strong>g> <str<strong>on</strong>g>disease</str<strong>on</strong>g> in samples from the crop <str<strong>on</strong>g>and</str<strong>on</strong>g> adequate sampling from the<br />
whole crop.<br />
Measurement <str<strong>on</strong>g>of</str<strong>on</strong>g> <str<strong>on</strong>g>disease</str<strong>on</strong>g> incidence <str<strong>on</strong>g>and</str<strong>on</strong>g> severity<br />
319<br />
Whether or not <str<strong>on</strong>g>disease</str<strong>on</strong>g> incidence or severity or both should be measured will<br />
depend <strong>on</strong> the <str<strong>on</strong>g>disease</str<strong>on</strong>g>, the particular epidemiological circumstances <str<strong>on</strong>g>and</str<strong>on</strong>g> the<br />
reas<strong>on</strong> for undertaking the <str<strong>on</strong>g>disease</str<strong>on</strong>g> assessment. With systemic <str<strong>on</strong>g>disease</str<strong>on</strong>g>s (e.g.<br />
many virus <str<strong>on</strong>g>disease</str<strong>on</strong>g>s) or root <str<strong>on</strong>g>disease</str<strong>on</strong>g>s (e.g. phytophthora root rots) that infect<br />
<str<strong>on</strong>g>and</str<strong>on</strong>g> kill whole plants or when the <str<strong>on</strong>g>disease</str<strong>on</strong>g> causes similar amounts <str<strong>on</strong>g>of</str<strong>on</strong>g> damage <strong>on</strong><br />
plants within a crop, the <str<strong>on</strong>g>disease</str<strong>on</strong>g> incidence, expressed as the percentage <str<strong>on</strong>g>of</str<strong>on</strong>g><br />
plants showing symptoms or damage, may suffice. At low levels <str<strong>on</strong>g>of</str<strong>on</strong>g> <str<strong>on</strong>g>disease</str<strong>on</strong>g> there<br />
is <str<strong>on</strong>g>of</str<strong>on</strong>g>ten a linear relati<strong>on</strong>ship between incidence <str<strong>on</strong>g>and</str<strong>on</strong>g> severity, <str<strong>on</strong>g>and</str<strong>on</strong>g> so it is<br />
sufficient to measure incidence. However, at high levels <str<strong>on</strong>g>of</str<strong>on</strong>g> <str<strong>on</strong>g>disease</str<strong>on</strong>g> there is <str<strong>on</strong>g>of</str<strong>on</strong>g>ten<br />
not a simple, c<strong>on</strong>sistent relati<strong>on</strong>ship between incidence <str<strong>on</strong>g>and</str<strong>on</strong>g> severity. Many<br />
<str<strong>on</strong>g>disease</str<strong>on</strong>g>s cause different levels <str<strong>on</strong>g>of</str<strong>on</strong>g> damage <strong>on</strong> different plants within a crop. In<br />
such situati<strong>on</strong>s it is necessary to assess <str<strong>on</strong>g>disease</str<strong>on</strong>g> severity. The impact <str<strong>on</strong>g>of</str<strong>on</strong>g> a<br />
<str<strong>on</strong>g>disease</str<strong>on</strong>g> <strong>on</strong> <strong>yield</strong> is <str<strong>on</strong>g>of</str<strong>on</strong>g>ten determined by the extent <str<strong>on</strong>g>of</str<strong>on</strong>g> <str<strong>on</strong>g>disease</str<strong>on</strong>g> <strong>on</strong> the nearly<br />
mature plant (e.g. <strong>on</strong> the flag leaf <str<strong>on</strong>g>and</str<strong>on</strong>g> head <str<strong>on</strong>g>of</str<strong>on</strong>g> cereals). At this stage, <str<strong>on</strong>g>disease</str<strong>on</strong>g><br />
severity is usually a better predictor <str<strong>on</strong>g>of</str<strong>on</strong>g> crop loss than <str<strong>on</strong>g>disease</str<strong>on</strong>g> incidence. Thus,<br />
for most crop loss assessments, severity is required.<br />
Measurement <str<strong>on</strong>g>of</str<strong>on</strong>g> <str<strong>on</strong>g>disease</str<strong>on</strong>g> severity is more difficult <str<strong>on</strong>g>and</str<strong>on</strong>g> error-pr<strong>on</strong>e than<br />
measurement <str<strong>on</strong>g>of</str<strong>on</strong>g> <str<strong>on</strong>g>disease</str<strong>on</strong>g> incidence. Disease incidence is based <strong>on</strong> counting<br />
infected <str<strong>on</strong>g>and</str<strong>on</strong>g> uninfected units <str<strong>on</strong>g>of</str<strong>on</strong>g> the crop (whole plants for systemic <str<strong>on</strong>g>disease</str<strong>on</strong>g>s,<br />
inflorescences for smuts, leaves for leaf spots <str<strong>on</strong>g>and</str<strong>on</strong>g> rusts etc.). From these counts<br />
the proporti<strong>on</strong> <str<strong>on</strong>g>of</str<strong>on</strong>g> units infected is calculated. An example was given in Chapter<br />
19 <str<strong>on</strong>g>of</str<strong>on</strong>g> the measurement <str<strong>on</strong>g>of</str<strong>on</strong>g> the incidence <str<strong>on</strong>g>of</str<strong>on</strong>g> blister blight <str<strong>on</strong>g>of</str<strong>on</strong>g> tea as a basis for<br />
forecasting the amount <str<strong>on</strong>g>of</str<strong>on</strong>g> <str<strong>on</strong>g>disease</str<strong>on</strong>g> likely to occur 2-3 weeks later. The main<br />
problem in determining <str<strong>on</strong>g>disease</str<strong>on</strong>g> incidence is establishing the extent <str<strong>on</strong>g>of</str<strong>on</strong>g> sampling<br />
that is required to adequately represent the crop.<br />
Determining <str<strong>on</strong>g>disease</str<strong>on</strong>g> severity <str<strong>on</strong>g>of</str<strong>on</strong>g>ten requires estimating the proporti<strong>on</strong> <str<strong>on</strong>g>of</str<strong>on</strong>g> the<br />
total photosynthetic area <str<strong>on</strong>g>of</str<strong>on</strong>g> the crop that is <str<strong>on</strong>g>disease</str<strong>on</strong>g>d which is <str<strong>on</strong>g>of</str<strong>on</strong>g>ten called the<br />
'proporti<strong>on</strong><br />
<str<strong>on</strong>g>of</str<strong>on</strong>g> leaf area affected'. This measurement is much less precise <str<strong>on</strong>g>and</str<strong>on</strong>g><br />
less c<strong>on</strong>trollable than measurements based <strong>on</strong> counting individual plants.<br />
Disease severity assessment relies <strong>on</strong> visual judgments which tend to be<br />
deceptive <str<strong>on</strong>g>and</str<strong>on</strong>g> to vary greatly from pers<strong>on</strong> to pers<strong>on</strong>. The human eye tends to<br />
detect grades <str<strong>on</strong>g>of</str<strong>on</strong>g> <str<strong>on</strong>g>disease</str<strong>on</strong>g> severity in logarithmic steps (5ol0, IOo/o, 2Oo/o, 4Oo/o,<br />
BOo/o) rather than in the uniform, arithmetic steps (5o/o, lOo/o, I5o/o, 2oo/o, 25o/o<br />
etc.) by which we like to express quantities. Accordingly, various modificati<strong>on</strong>s <str<strong>on</strong>g>of</str<strong>on</strong>g><br />
percentage scales have been proposed to take into account this fact <str<strong>on</strong>g>and</str<strong>on</strong>g> allow<br />
more accurate measurement <str<strong>on</strong>g>of</str<strong>on</strong>g> <str<strong>on</strong>g>disease</str<strong>on</strong>g> severity. Moreover, when less than 5Oolo<br />
<str<strong>on</strong>g>of</str<strong>on</strong>g> the tissue is <str<strong>on</strong>g>disease</str<strong>on</strong>g>d or damaged, the eye tends to focus <strong>on</strong> or estimate the<br />
proporti<strong>on</strong> <str<strong>on</strong>g>of</str<strong>on</strong>g> <str<strong>on</strong>g>disease</str<strong>on</strong>g>d area, but when more than 50% <str<strong>on</strong>g>of</str<strong>on</strong>g> tissue is damaged the<br />
eye tends to focus <strong>on</strong> or estimate the proporti<strong>on</strong> <str<strong>on</strong>g>of</str<strong>on</strong>g> healthy tissue.<br />
The most comm<strong>on</strong> method <str<strong>on</strong>g>of</str<strong>on</strong>g> estimating <str<strong>on</strong>g>disease</str<strong>on</strong>g> severity is the use <str<strong>on</strong>g>of</str<strong>on</strong>g> a set <str<strong>on</strong>g>of</str<strong>on</strong>g><br />
diagrams (<str<strong>on</strong>g>disease</str<strong>on</strong>g> assessment keys) <str<strong>on</strong>g>of</str<strong>on</strong>g> a crop (comm<strong>on</strong>ly leaves, but it could
320 John Brousn <str<strong>on</strong>g>and</str<strong>on</strong>g> Philtp Keane<br />
involve inflorescences, fruits or whole plants) showing different <str<strong>on</strong>g>disease</str<strong>on</strong>g><br />
severities as blackened areas. Severity scales are adjusted to take into account<br />
the above c<strong>on</strong>cepts <str<strong>on</strong>g>of</str<strong>on</strong>g> visual percepti<strong>on</strong>. Samples <str<strong>on</strong>g>of</str<strong>on</strong>g> the crop are then compared<br />
with these diagrams to allow an assessment <str<strong>on</strong>g>of</str<strong>on</strong>g> severity. A <str<strong>on</strong>g>disease</str<strong>on</strong>g> index for a<br />
crop can be obtained by summing the individual <str<strong>on</strong>g>disease</str<strong>on</strong>g> assessments <str<strong>on</strong>g>and</str<strong>on</strong>g> then<br />
dividing this by the number <str<strong>on</strong>g>of</str<strong>on</strong>g> plants assessed.<br />
For comm<strong>on</strong> <str<strong>on</strong>g>disease</str<strong>on</strong>g>s it is helpful to use published keys to st<str<strong>on</strong>g>and</str<strong>on</strong>g>ardise<br />
measurements around the world. However, in some cases such as for new<br />
<str<strong>on</strong>g>disease</str<strong>on</strong>g>s or in particular circumstances it may be necessary to develop <strong>on</strong>e's own<br />
key. To produce a <str<strong>on</strong>g>disease</str<strong>on</strong>g> assessment key, the development <str<strong>on</strong>g>of</str<strong>on</strong>g> <str<strong>on</strong>g>disease</str<strong>on</strong>g> over the<br />
whole <str<strong>on</strong>g>disease</str<strong>on</strong>g> cycle <str<strong>on</strong>g>and</str<strong>on</strong>g> at different stages <str<strong>on</strong>g>of</str<strong>on</strong>g> plant growth must be studied.<br />
Drawings <str<strong>on</strong>g>and</str<strong>on</strong>g> measurements <str<strong>on</strong>g>of</str<strong>on</strong>g> the <str<strong>on</strong>g>disease</str<strong>on</strong>g>d plant at various stages <str<strong>on</strong>g>of</str<strong>on</strong>g><br />
development are required <str<strong>on</strong>g>and</str<strong>on</strong>g> the various parts <str<strong>on</strong>g>of</str<strong>on</strong>g> the plant that are damaged<br />
must be analysed. This informati<strong>on</strong> is used to develop prototype st<str<strong>on</strong>g>and</str<strong>on</strong>g>ard<br />
diagrams which may involve photographing or tracing symptoms <strong>on</strong>to paper <str<strong>on</strong>g>and</str<strong>on</strong>g><br />
accurately measuring the proporti<strong>on</strong> <str<strong>on</strong>g>of</str<strong>on</strong>g> the tissue <str<strong>on</strong>g>disease</str<strong>on</strong>g>d. Alternatively, the<br />
area <str<strong>on</strong>g>of</str<strong>on</strong>g> leaves <str<strong>on</strong>g>and</str<strong>on</strong>g> the area <str<strong>on</strong>g>of</str<strong>on</strong>g> <str<strong>on</strong>g>disease</str<strong>on</strong>g> can be measured using an electr<strong>on</strong>ic 'leaf<br />
area meter' or a video camera <str<strong>on</strong>g>and</str<strong>on</strong>g> image analysing equipment c<strong>on</strong>nected to a<br />
computer. Eventually, the key is simplified to enable rapid <str<strong>on</strong>g>and</str<strong>on</strong>g> accurate<br />
measurement <str<strong>on</strong>g>of</str<strong>on</strong>g> the <str<strong>on</strong>g>disease</str<strong>on</strong>g> under field c<strong>on</strong>diti<strong>on</strong>s. For crop loss assessments,<br />
the key has to be set so that it measures the <str<strong>on</strong>g>disease</str<strong>on</strong>g> at the stages <str<strong>on</strong>g>of</str<strong>on</strong>g> crop<br />
development that are critical for <strong>yield</strong>. The scale then has to be tested in the<br />
field in an objective way. For example, a researcher may assess a range <str<strong>on</strong>g>of</str<strong>on</strong>g><br />
<str<strong>on</strong>g>disease</str<strong>on</strong>g>d samples with the key <str<strong>on</strong>g>and</str<strong>on</strong>g> then compare the results with objective<br />
measurements in the laboratory <str<strong>on</strong>g>of</str<strong>on</strong>g> the same samples. Some examples <str<strong>on</strong>g>of</str<strong>on</strong>g><br />
descriptive <str<strong>on</strong>g>and</str<strong>on</strong>g> pictorial <str<strong>on</strong>g>disease</str<strong>on</strong>g> assessment keys are shown in Tables 20.1 <str<strong>on</strong>g>and</str<strong>on</strong>g><br />
2O.2 <str<strong>on</strong>g>and</str<strong>on</strong>g> in Figure 2O.2.<br />
Table 20.1 Key for the assessment <str<strong>on</strong>g>of</str<strong>on</strong>g> leaf mould <str<strong>on</strong>g>of</str<strong>on</strong>g> tomato caused by Fulvia fulva. (From<br />
Beaum<strong>on</strong>t, 1954.)<br />
o/o Severity Symptoms<br />
0.1<br />
I<br />
5<br />
10<br />
25<br />
50<br />
75<br />
90<br />
roo<br />
Lesi<strong>on</strong>s found with difficulty, <str<strong>on</strong>g>and</str<strong>on</strong>g> <strong>on</strong> less than <strong>on</strong>e plant in fifty.<br />
l,esi<strong>on</strong>s <strong>on</strong> most plants, but <strong>on</strong>ly <strong>on</strong> a few leaves.<br />
Lesi<strong>on</strong>s <strong>on</strong> every plant, <str<strong>on</strong>g>and</str<strong>on</strong>g> <strong>on</strong> most leaves except the young <strong>on</strong>es, but <strong>on</strong>ly<br />
about two to ten spots per leaf.<br />
All except the youngest leaves affected, with ten to fifty spots per leaf.<br />
All except the youngest leaves affected, but with about three-quarters <str<strong>on</strong>g>of</str<strong>on</strong>g><br />
the leaf area green, although lowest leaves may be severely attacked.<br />
All leaves affected. Most <str<strong>on</strong>g>of</str<strong>on</strong>g> the middle leaves showing <strong>on</strong>ly half their area<br />
green.<br />
All leaves affected. Most <str<strong>on</strong>g>of</str<strong>on</strong>g> the middle leaves show <strong>on</strong>ly <strong>on</strong>e-quarter <str<strong>on</strong>g>of</str<strong>on</strong>g> the<br />
leaf green, giving a grey appearance to the crop as a whole.<br />
Very little green visible <strong>on</strong> middle <str<strong>on</strong>g>and</str<strong>on</strong>g> lower leaves, but youngest leaves<br />
show green.<br />
All leaves completely covered with the lesi<strong>on</strong>s.<br />
The development <str<strong>on</strong>g>of</str<strong>on</strong>g> a key <str<strong>on</strong>g>and</str<strong>on</strong>g> its field testing is actually a way <str<strong>on</strong>g>of</str<strong>on</strong>g> training a<br />
researcher's eye to recognise the various <str<strong>on</strong>g>disease</str<strong>on</strong>g> severity categories. Eventually<br />
a highly trained observer will c<strong>on</strong>duct the whole assessment by eye. However,<br />
even highly trained observers need to st<str<strong>on</strong>g>and</str<strong>on</strong>g>ardise or calibrate their visual<br />
assessments by regular comparis<strong>on</strong> with objective measurements. For example,<br />
people differ greatly in their ability to accurately assess percent leaf area<br />
<str<strong>on</strong>g>disease</str<strong>on</strong>g>d. Some people tend to overestimate, others to underestimate, <str<strong>on</strong>g>and</str<strong>on</strong>g> others
20. <str<strong>on</strong>g>Assessment</str<strong>on</strong>g> oJ <str<strong>on</strong>g>disease</str<strong>on</strong>g> <str<strong>on</strong>g>and</str<strong>on</strong>g>. elfects <strong>on</strong> gield 321<br />
to overestimate at low <str<strong>on</strong>g>disease</str<strong>on</strong>g> levels <str<strong>on</strong>g>and</str<strong>on</strong>g> underestimate at high levels. Regular<br />
objective testing allows statistical c<strong>on</strong>fidence intervals to be established for a<br />
particular observer under particular c<strong>on</strong>diti<strong>on</strong>s. Programs have been developed<br />
for computer-assisted training <str<strong>on</strong>g>of</str<strong>on</strong>g> observers in <str<strong>on</strong>g>disease</str<strong>on</strong>g> severity assessment. The<br />
computer program develops diagrams <str<strong>on</strong>g>of</str<strong>on</strong>g> a <str<strong>on</strong>g>disease</str<strong>on</strong>g>d leaf with different severity<br />
levels. The observer estimates the severities, the program then compares their<br />
performance with the known severity <str<strong>on</strong>g>and</str<strong>on</strong>g> gives them feedback <strong>on</strong> the extent <str<strong>on</strong>g>of</str<strong>on</strong>g><br />
their errors, allowing further training <str<strong>on</strong>g>of</str<strong>on</strong>g> their visual percepti<strong>on</strong>.<br />
Table 2O.2 Key for the assessment <str<strong>on</strong>g>of</str<strong>on</strong>g> late blight <str<strong>on</strong>g>of</str<strong>on</strong>g> potato caused by Phytophthora infestans.<br />
(After British Mycological Society, 1948.)<br />
o/o Severity Symptoms<br />
o<br />
o.l<br />
I<br />
5<br />
25<br />
50<br />
75<br />
95<br />
roo<br />
Disease not seen in field.<br />
Only a few plants affected here <str<strong>on</strong>g>and</str<strong>on</strong>g> there. Up to <strong>on</strong>e or two spots in 10.8 m<br />
radius.<br />
Up to ten spots per plant or general light spotting.<br />
About fifty spots per plant, or up to <strong>on</strong>e leaflet in ten attacked.<br />
Nearly every plant with lesi<strong>on</strong>s; plants still retaining normal form; fields<br />
may smell <str<strong>on</strong>g>of</str<strong>on</strong>g> blight but look green although every plant affected.<br />
Every plant affected <str<strong>on</strong>g>and</str<strong>on</strong>g> about half <str<strong>on</strong>g>of</str<strong>on</strong>g> the leaf area destroyed by blight; field<br />
looks green flecked with brown.<br />
About three-quarters <str<strong>on</strong>g>of</str<strong>on</strong>g> the leaf area destroyed by blight; field looks neither<br />
predominanfly brown or green. In some varieties the youngest leaves<br />
escape infecti<strong>on</strong> so that the green is more c<strong>on</strong>spicuous.<br />
Only a few leaves left green, but stems green.<br />
All leaves dead, stems dead or dying.<br />
Because different assessors vary in their assessments, if two people are<br />
required to carry out a <str<strong>on</strong>g>disease</str<strong>on</strong>g> assessment each observer should do hatf the<br />
number <str<strong>on</strong>g>of</str<strong>on</strong>g> replicates so that any error due to the different observers appears in<br />
the error mean square <str<strong>on</strong>g>of</str<strong>on</strong>g> the analysis <str<strong>on</strong>g>of</str<strong>on</strong>g> variance.<br />
<str<strong>on</strong>g>Assessment</str<strong>on</strong>g> <str<strong>on</strong>g>of</str<strong>on</strong>g> severity <str<strong>on</strong>g>of</str<strong>on</strong>g> leaf <str<strong>on</strong>g>disease</str<strong>on</strong>g> <strong>on</strong> eucalypt saplings has involved use <str<strong>on</strong>g>of</str<strong>on</strong>g><br />
diagrams to represent the whole tree. The diagrams show the extent <str<strong>on</strong>g>of</str<strong>on</strong>g> <str<strong>on</strong>g>disease</str<strong>on</strong>g><br />
<strong>on</strong> middle <str<strong>on</strong>g>and</str<strong>on</strong>g> upper branches <str<strong>on</strong>g>and</str<strong>on</strong>g> the extent <str<strong>on</strong>g>of</str<strong>on</strong>g> abnormal leaf loss <strong>on</strong> lower<br />
branches. They have been used to measure the degree <str<strong>on</strong>g>of</str<strong>on</strong>g> resistance <str<strong>on</strong>g>of</str<strong>on</strong>g> various<br />
provenances <str<strong>on</strong>g>of</str<strong>on</strong>g> eucalypts, but assessments <str<strong>on</strong>g>of</str<strong>on</strong>g> <str<strong>on</strong>g>disease</str<strong>on</strong>g> <strong>on</strong> whole plants are more<br />
pr<strong>on</strong>e to error than assessments <strong>on</strong> samples <str<strong>on</strong>g>of</str<strong>on</strong>g> single branches or single leaves.<br />
For example, assessments <str<strong>on</strong>g>of</str<strong>on</strong>g> whole trees can be greatly affected by the quality <str<strong>on</strong>g>of</str<strong>on</strong>g><br />
the light <str<strong>on</strong>g>and</str<strong>on</strong>g> the degree <str<strong>on</strong>g>of</str<strong>on</strong>g> shading <str<strong>on</strong>g>of</str<strong>on</strong>g> <strong>on</strong>e tree by another. Bright sunlight can<br />
obscure the extent <str<strong>on</strong>g>of</str<strong>on</strong>g> <str<strong>on</strong>g>disease</str<strong>on</strong>g> <str<strong>on</strong>g>and</str<strong>on</strong>g> result in a different assessment from <strong>on</strong>e d<strong>on</strong>e<br />
<strong>on</strong> an overcast day.<br />
Root <str<strong>on</strong>g>disease</str<strong>on</strong>g>s are <str<strong>on</strong>g>of</str<strong>on</strong>g>ten assessed using an arbitrary scale such as the O to 5<br />
scale <str<strong>on</strong>g>of</str<strong>on</strong>g> Greenhalgh <str<strong>on</strong>g>and</str<strong>on</strong>g> Lucas (1984) for root rot <str<strong>on</strong>g>of</str<strong>on</strong>g> subterranean clover, where:<br />
O= healthy roots (no visible lesi<strong>on</strong>s <strong>on</strong> roots)<br />
l= sli€iht lateral root rot (less than IOo/o <str<strong>on</strong>g>of</str<strong>on</strong>g> lateral root tips necrotic)<br />
2= moderately severe lateral root rot (lO-5O% <str<strong>on</strong>g>of</str<strong>on</strong>g> lateral root tips necrotic) or<br />
slight tap root rot (tip <str<strong>on</strong>g>of</str<strong>on</strong>g> tap root rotted ) or both<br />
3= sev€r€ lateral root rot (greater than 500/o <str<strong>on</strong>g>of</str<strong>on</strong>g> lateral root tips necrotic) or<br />
moderately severe tap root rot (5-30% <str<strong>on</strong>g>of</str<strong>on</strong>g> tap root rotten from tip) or both<br />
4= sev€r€ tap root rot (greater than 3Oo/o <str<strong>on</strong>g>of</str<strong>on</strong>g> tap root necrotic with healthy<br />
laterals above lesi<strong>on</strong> or lesi<strong>on</strong> girdling tap root immediately below<br />
hypocotyl)<br />
5= tap <str<strong>on</strong>g>and</str<strong>on</strong>g> lateral roots completely rotted or plant dead.
322 John Brotun <str<strong>on</strong>g>and</str<strong>on</strong>g> PhiLip Keane<br />
- + )<br />
t r -<br />
'l*i<br />
s<br />
L@/o<br />
L@/o<br />
fI}<br />
i:'*- -;<br />
\ a --r/ l2o/o<br />
$.B<br />
.<br />
'a<br />
c<br />
25o/o<br />
5@/o<br />
d$/o 75o/o<br />
Figure 2O.2 Disease assessment keys. {A) Comm<strong>on</strong> scab <str<strong>on</strong>g>of</str<strong>on</strong>g> potatoes caused by<br />
Streptomgces scabres. (From James 1971.) (B) Mycosphaerella leaf <str<strong>on</strong>g>disease</str<strong>on</strong>g>s <str<strong>on</strong>g>of</str<strong>on</strong>g><br />
eucalypts. (From Carnegie et al. 1994.) (C) phytophthora blight<br />
(P. coLocasise) <str<strong>on</strong>g>of</str<strong>on</strong>g> taro (Colocasta esculenta). (From Gollifer<str<strong>on</strong>g>and</str<strong>on</strong>g> Brown, 1974.)<br />
Infected root systems can be surface steriiised <str<strong>on</strong>g>and</str<strong>on</strong>g> plated <strong>on</strong>to selective<br />
media, which allow the pathogen to grow out <str<strong>on</strong>g>of</str<strong>on</strong>g> the regi<strong>on</strong> <str<strong>on</strong>g>of</str<strong>on</strong>g> the root that is<br />
infected. The proporti<strong>on</strong> <str<strong>on</strong>g>of</str<strong>on</strong>g> the root system infected can then be measured.
2O. Assess mert oJ <str<strong>on</strong>g>disease</str<strong>on</strong>g> <str<strong>on</strong>g>and</str<strong>on</strong>g> <str<strong>on</strong>g>effects</str<strong>on</strong>g> <strong>on</strong> gield<br />
Some workers have used electr<strong>on</strong>ic root length measuring devices to determine<br />
the extent <str<strong>on</strong>g>of</str<strong>on</strong>g> root loss in infected, compared with uninfected, root systems.<br />
Disease incidence can be also assessed using remote sensing techniques. For<br />
example, the incidence <str<strong>on</strong>g>of</str<strong>on</strong>g> rusts such as Puccinia graminis in cereal crops has<br />
been measured using spore traps to determine the quantity <str<strong>on</strong>g>of</str<strong>on</strong>g> spores arising<br />
from the <str<strong>on</strong>g>disease</str<strong>on</strong>g>d crop. This method assumes that spore producti<strong>on</strong> is directly<br />
related to the amount <str<strong>on</strong>g>of</str<strong>on</strong>g> <str<strong>on</strong>g>disease</str<strong>on</strong>g> in the crop. This is not always so (see the<br />
example <str<strong>on</strong>g>of</str<strong>on</strong>g> tea blister blight in Chapter I9). It has the advantage that the <str<strong>on</strong>g>disease</str<strong>on</strong>g><br />
assessment is made without actually walking into the crop, a practice that may<br />
alter the rate <str<strong>on</strong>g>of</str<strong>on</strong>g> spread <str<strong>on</strong>g>of</str<strong>on</strong>g> <str<strong>on</strong>g>disease</str<strong>on</strong>g> due to the disturbance resulting from<br />
intrusi<strong>on</strong> into the crop. Other remote sensing techniques include the use <str<strong>on</strong>g>of</str<strong>on</strong>g><br />
electr<strong>on</strong>ic scanners <str<strong>on</strong>g>and</str<strong>on</strong>g> other instruments to produce quantitative estimates <str<strong>on</strong>g>of</str<strong>on</strong>g><br />
<str<strong>on</strong>g>disease</str<strong>on</strong>g> incidence from data <strong>on</strong> infrared (IR) aerial photographs. Such IR<br />
photographs can be taken from either aircraft or satellites. Methods have even<br />
been developed to take <str<strong>on</strong>g>disease</str<strong>on</strong>g> assessment photographs from radio-c<strong>on</strong>trolled,<br />
model aircraft.<br />
Video cameras <str<strong>on</strong>g>and</str<strong>on</strong>g> image analysis can be used to objectively measure <str<strong>on</strong>g>disease</str<strong>on</strong>g><br />
severity in the field, but to date these methods are too cumbersome <str<strong>on</strong>g>and</str<strong>on</strong>g> time<br />
c<strong>on</strong>suming to replace the trained human eye in all except experimental<br />
assessments.<br />
Finer measurements <str<strong>on</strong>g>of</str<strong>on</strong>g> <str<strong>on</strong>g>disease</str<strong>on</strong>g> severity not <strong>on</strong>ly enable more accurate<br />
assessment <str<strong>on</strong>g>of</str<strong>on</strong>g> the impact <str<strong>on</strong>g>of</str<strong>on</strong>g> <str<strong>on</strong>g>disease</str<strong>on</strong>g> <strong>on</strong> <strong>yield</strong> but also enable better assessment<br />
<str<strong>on</strong>g>of</str<strong>on</strong>g> the effect <str<strong>on</strong>g>of</str<strong>on</strong>g> quantitative resistance <str<strong>on</strong>g>and</str<strong>on</strong>g> other c<strong>on</strong>trol measures. It is likely<br />
that in the past much useful resistance was discarded from breeding programs<br />
because the small amount <str<strong>on</strong>g>of</str<strong>on</strong>g> resistance it c<strong>on</strong>tributed was not assessable using<br />
broad-brush assessment methods. It is now appreciated that even small<br />
amounts <str<strong>on</strong>g>of</str<strong>on</strong>g> resistance may be important in <str<strong>on</strong>g>disease</str<strong>on</strong>g> c<strong>on</strong>trol in combinati<strong>on</strong> with<br />
other c<strong>on</strong>trol measures <str<strong>on</strong>g>and</str<strong>on</strong>g> that even small amounts <str<strong>on</strong>g>of</str<strong>on</strong>g> partial resistance may be<br />
useful in combinati<strong>on</strong> with other sources <str<strong>on</strong>g>of</str<strong>on</strong>g> resistance in breeding programs.<br />
Sampling for <str<strong>on</strong>g>disease</str<strong>on</strong>g> incidence <str<strong>on</strong>g>and</str<strong>on</strong>g> severity assessmenfs<br />
Most <str<strong>on</strong>g>of</str<strong>on</strong>g> the <str<strong>on</strong>g>disease</str<strong>on</strong>g> assessment methods referred to above are applied to<br />
samples taken from the whole crop or plantati<strong>on</strong> area. Therefore, a major<br />
limitati<strong>on</strong> in the overall assessment <str<strong>on</strong>g>of</str<strong>on</strong>g> <str<strong>on</strong>g>disease</str<strong>on</strong>g> is the sampling method. The<br />
<str<strong>on</strong>g>disease</str<strong>on</strong>g> assessment will <strong>on</strong>ly be accurate if the sampling method enables<br />
accurate extrapolati<strong>on</strong> to the entire crop.<br />
Samples <str<strong>on</strong>g>of</str<strong>on</strong>g> crop units (plants, leaves, inflorescences etc.) can be taken at<br />
r<str<strong>on</strong>g>and</str<strong>on</strong>g>om from a field (e.g. by following a set <str<strong>on</strong>g>of</str<strong>on</strong>g> r<str<strong>on</strong>g>and</str<strong>on</strong>g>om number coordinates, or a<br />
r<str<strong>on</strong>g>and</str<strong>on</strong>g>omly chosen number <str<strong>on</strong>g>of</str<strong>on</strong>g> paces across the field) or in a predetermined way<br />
(e.g. by walking across a diag<strong>on</strong>al or in a 'W or diam<strong>on</strong>d pattern across the field<br />
<str<strong>on</strong>g>and</str<strong>on</strong>g> taking a sample every lO paces). R<str<strong>on</strong>g>and</str<strong>on</strong>g>om sampling is preferred by<br />
biometricians. There are programs available for portable computers that indicate<br />
the r<str<strong>on</strong>g>and</str<strong>on</strong>g>om number <str<strong>on</strong>g>of</str<strong>on</strong>g> paces for sampling during a 'walk pattern' through a field.<br />
Alternatively, st<str<strong>on</strong>g>and</str<strong>on</strong>g>ard quadrats can be placed at r<str<strong>on</strong>g>and</str<strong>on</strong>g>om in a field <str<strong>on</strong>g>and</str<strong>on</strong>g> all<br />
plants within each quadrat assessed. In experimental plots <str<strong>on</strong>g>of</str<strong>on</strong>g>ten a part <str<strong>on</strong>g>of</str<strong>on</strong>g> each<br />
plot is assessed for <str<strong>on</strong>g>disease</str<strong>on</strong>g>. Because <str<strong>on</strong>g>of</str<strong>on</strong>g> the influence <str<strong>on</strong>g>of</str<strong>on</strong>g> 'edge <str<strong>on</strong>g>effects</str<strong>on</strong>g>', taking a<br />
few samples from the edges <str<strong>on</strong>g>of</str<strong>on</strong>g> fields is never sufficient to accurately reflect the<br />
<str<strong>on</strong>g>disease</str<strong>on</strong>g> situati<strong>on</strong> throughout the field. This is a problem in sampling leaf <str<strong>on</strong>g>disease</str<strong>on</strong>g><br />
in eucalypt forests. Often the best view <str<strong>on</strong>g>of</str<strong>on</strong>g> the <str<strong>on</strong>g>disease</str<strong>on</strong>g> in the foliage is from<br />
roadsides where the edge <str<strong>on</strong>g>of</str<strong>on</strong>g> the forest is exposed. However, this may not reflect<br />
the occurrence <str<strong>on</strong>g>of</str<strong>on</strong>g> <str<strong>on</strong>g>disease</str<strong>on</strong>g> in the bulk <str<strong>on</strong>g>of</str<strong>on</strong>g> the forest.
J ohn Broun <str<strong>on</strong>g>and</str<strong>on</strong>g> Philip Keane<br />
The intensity <str<strong>on</strong>g>of</str<strong>on</strong>g> sampling should be determined for each <str<strong>on</strong>g>disease</str<strong>on</strong>g> situati<strong>on</strong>. It<br />
will depend <strong>on</strong> the uniformity <str<strong>on</strong>g>of</str<strong>on</strong>g> <str<strong>on</strong>g>disease</str<strong>on</strong>g> in a plant populati<strong>on</strong>. A <str<strong>on</strong>g>disease</str<strong>on</strong>g> spread<br />
uniformly throughout a crop will require fewer samples for accurate assessment<br />
than <strong>on</strong>e with a patchy distributi<strong>on</strong> through the crop. It is possible when<br />
developing the methodologr for studying a particular <str<strong>on</strong>g>disease</str<strong>on</strong>g>, to sample a certain<br />
number <str<strong>on</strong>g>of</str<strong>on</strong>g> times at each <str<strong>on</strong>g>of</str<strong>on</strong>g> progressively increasing levels <str<strong>on</strong>g>of</str<strong>on</strong>g> sampling intensity.<br />
The st<str<strong>on</strong>g>and</str<strong>on</strong>g>ard error <str<strong>on</strong>g>of</str<strong>on</strong>g> the mean <str<strong>on</strong>g>disease</str<strong>on</strong>g> incidence or severity at each sampling<br />
intensity can then be plotted against the sampling intensity. The optimum<br />
sampling intensity is determined as the <strong>on</strong>e at which the st<str<strong>on</strong>g>and</str<strong>on</strong>g>ard error first<br />
falls to a low level which is maintained even at much higher sampling intensities<br />
(Figure 20.3). It is a waste <str<strong>on</strong>g>of</str<strong>on</strong>g> time taking a larger number <str<strong>on</strong>g>of</str<strong>on</strong>g> samples if they do<br />
not greatly reduce the st<str<strong>on</strong>g>and</str<strong>on</strong>g>ard error <str<strong>on</strong>g>of</str<strong>on</strong>g> the assessments.<br />
St<str<strong>on</strong>g>and</str<strong>on</strong>g>ard<br />
EITOT<br />
Sampling intensity<br />
Figure 2O.3 Plot <str<strong>on</strong>g>of</str<strong>on</strong>g> st<str<strong>on</strong>g>and</str<strong>on</strong>g>ard error <str<strong>on</strong>g>of</str<strong>on</strong>g> mean <str<strong>on</strong>g>disease</str<strong>on</strong>g> assessment measurements against<br />
sampling intensity, showing the point at which the st<str<strong>on</strong>g>and</str<strong>on</strong>g>ard error declines<br />
to a relatively stable low level (approximately the optimum sampling<br />
intensitv).<br />
20.4 <str<strong>on</strong>g>Assessment</str<strong>on</strong>g> <str<strong>on</strong>g>of</str<strong>on</strong>g> crop losses<br />
Having determined the amount <str<strong>on</strong>g>of</str<strong>on</strong>g> <str<strong>on</strong>g>disease</str<strong>on</strong>g> in relati<strong>on</strong> to the growth pattern <str<strong>on</strong>g>of</str<strong>on</strong>g> a<br />
crop, the next step is to determine the effect <str<strong>on</strong>g>of</str<strong>on</strong>g> different levels <str<strong>on</strong>g>of</str<strong>on</strong>g> <str<strong>on</strong>g>disease</str<strong>on</strong>g> <strong>on</strong><br />
<strong>yield</strong> <str<strong>on</strong>g>of</str<strong>on</strong>g> the crop. The two main approaches used to relate <str<strong>on</strong>g>disease</str<strong>on</strong>g> intensity to<br />
crop losses are the experimental <str<strong>on</strong>g>and</str<strong>on</strong>g> the statistical.<br />
The experimental approach<br />
The experimental approach to crop loss assessment usually involves setting up<br />
experiments in which the level <str<strong>on</strong>g>of</str<strong>on</strong>g> <str<strong>on</strong>g>disease</str<strong>on</strong>g> in a crop is c<strong>on</strong>trolled using different<br />
levels <str<strong>on</strong>g>of</str<strong>on</strong>g> inoculati<strong>on</strong> or treatments with biocides (fungicides, nematicides,<br />
bactericides). Often, an intensive spraying schedule is used to hold <str<strong>on</strong>g>disease</str<strong>on</strong>g> to a<br />
level close to zero, which allows the potential <strong>yield</strong> <str<strong>on</strong>g>of</str<strong>on</strong>g> the crop in the absence <str<strong>on</strong>g>of</str<strong>on</strong>g><br />
<str<strong>on</strong>g>disease</str<strong>on</strong>g> to be determined. A reduced spray treatment may allow development <str<strong>on</strong>g>of</str<strong>on</strong>g><br />
a moderate <str<strong>on</strong>g>disease</str<strong>on</strong>g> severity, while withholding <str<strong>on</strong>g>of</str<strong>on</strong>g> treatment may allow<br />
development <str<strong>on</strong>g>of</str<strong>on</strong>g> a severe epidemic. This allows a comparis<strong>on</strong> <str<strong>on</strong>g>of</str<strong>on</strong>g> epidemic<br />
progress <str<strong>on</strong>g>and</str<strong>on</strong>g> <strong>yield</strong>s in the plots. From this a relati<strong>on</strong>ship between <str<strong>on</strong>g>disease</str<strong>on</strong>g><br />
parameters <str<strong>on</strong>g>and</str<strong>on</strong>g> <strong>yield</strong> can be determined, allowing predicti<strong>on</strong> <str<strong>on</strong>g>of</str<strong>on</strong>g> crop loss based<br />
<strong>on</strong> certain <str<strong>on</strong>g>disease</str<strong>on</strong>g> intensities at certain periods <str<strong>on</strong>g>of</str<strong>on</strong>g> crop growth. The value <str<strong>on</strong>g>of</str<strong>on</strong>g> this
2O. <str<strong>on</strong>g>Assessment</str<strong>on</strong>g> oJ <str<strong>on</strong>g>disease</str<strong>on</strong>g> <str<strong>on</strong>g>and</str<strong>on</strong>g> <str<strong>on</strong>g>effects</str<strong>on</strong>g> <strong>on</strong> gield 325<br />
method depends <strong>on</strong> the assumpti<strong>on</strong> that the biocide treatment itself has no<br />
direct effect <strong>on</strong> <strong>yield</strong>. In some cases this assumpti<strong>on</strong> is not valid. For example,<br />
sprays <str<strong>on</strong>g>of</str<strong>on</strong>g> copper-based fungicides used to c<strong>on</strong>trol c<str<strong>on</strong>g>of</str<strong>on</strong>g>fee rust <str<strong>on</strong>g>of</str<strong>on</strong>g>ten have a direct<br />
't<strong>on</strong>ic' effect <strong>on</strong> <strong>yield</strong> <str<strong>on</strong>g>of</str<strong>on</strong>g> c<str<strong>on</strong>g>of</str<strong>on</strong>g>fee, quite apart from any indirect effect they may have<br />
through c<strong>on</strong>trol <str<strong>on</strong>g>of</str<strong>on</strong>g> rust. In these studies it is important to determine the effect <str<strong>on</strong>g>of</str<strong>on</strong>g><br />
a biocide <strong>on</strong> <strong>yield</strong> in the absence <str<strong>on</strong>g>of</str<strong>on</strong>g> <str<strong>on</strong>g>disease</str<strong>on</strong>g>.<br />
A comparis<strong>on</strong> between epidemic progress <str<strong>on</strong>g>and</str<strong>on</strong>g> <strong>yield</strong>s can also be obtained<br />
from experiments using susceptible <str<strong>on</strong>g>and</str<strong>on</strong>g> resistant cultivars <str<strong>on</strong>g>of</str<strong>on</strong>g> the same plant<br />
species. The value <str<strong>on</strong>g>of</str<strong>on</strong>g> this method is dependent up<strong>on</strong> the susceptible <str<strong>on</strong>g>and</str<strong>on</strong>g><br />
resistant cultivars having similar <strong>yield</strong> potentials in the absence <str<strong>on</strong>g>of</str<strong>on</strong>g> <str<strong>on</strong>g>disease</str<strong>on</strong>g>.<br />
Again, this has to be determined under <str<strong>on</strong>g>disease</str<strong>on</strong>g>-free c<strong>on</strong>diti<strong>on</strong>s. Near isogenic<br />
lines <str<strong>on</strong>g>of</str<strong>on</strong>g> a crop, which are genetically similar except for the presence <str<strong>on</strong>g>of</str<strong>on</strong>g> a specific<br />
gene for resistance, are sometimes used to investigate the <str<strong>on</strong>g>effects</str<strong>on</strong>g> <str<strong>on</strong>g>of</str<strong>on</strong>g> <str<strong>on</strong>g>disease</str<strong>on</strong>g> <strong>on</strong><br />
growth <str<strong>on</strong>g>and</str<strong>on</strong>g> <strong>yield</strong>.<br />
Before undertaking experiments to determine the <str<strong>on</strong>g>effects</str<strong>on</strong>g> <str<strong>on</strong>g>of</str<strong>on</strong>g> <str<strong>on</strong>g>disease</str<strong>on</strong>g> <strong>on</strong> crop<br />
<strong>yield</strong>s, careful c<strong>on</strong>siderati<strong>on</strong> should be given to experimental design, including<br />
the shape <str<strong>on</strong>g>and</str<strong>on</strong>g> size <str<strong>on</strong>g>of</str<strong>on</strong>g> plots, interplot interference, paired-plot versus multipleplot<br />
treatments <str<strong>on</strong>g>and</str<strong>on</strong>g> so <strong>on</strong>. The harvesting methods used in experiments tend to<br />
be more efficient than those used in commercial farming practice. C<strong>on</strong>sequently,<br />
allowances should be made for this when applying data to commercial situati<strong>on</strong>s.<br />
Any method used in <str<strong>on</strong>g>disease</str<strong>on</strong>g> assessment should provide data that can be<br />
analysed statistically, particularly by regressi<strong>on</strong> analysis. A comm<strong>on</strong> approach is<br />
to determine regressi<strong>on</strong> relati<strong>on</strong>ships between certain measurements <str<strong>on</strong>g>of</str<strong>on</strong>g> <str<strong>on</strong>g>disease</str<strong>on</strong>g><br />
(plotted <strong>on</strong> the X axis) <str<strong>on</strong>g>and</str<strong>on</strong>g> <strong>yield</strong> (plotted <strong>on</strong> the Y axis). From these studies,<br />
mathematical models can be developed that express relati<strong>on</strong>ships between<br />
<str<strong>on</strong>g>disease</str<strong>on</strong>g> intensity <str<strong>on</strong>g>and</str<strong>on</strong>g> crop losses. The aim with these models is to reduce the<br />
usually complex relati<strong>on</strong>ship between <str<strong>on</strong>g>disease</str<strong>on</strong>g> intensity <str<strong>on</strong>g>and</str<strong>on</strong>g> <strong>yield</strong> to a simple<br />
relati<strong>on</strong>ship that can be applied in farmers' fields to enable predicti<strong>on</strong> <str<strong>on</strong>g>of</str<strong>on</strong>g> crop<br />
losses. Crop loss assessments are <str<strong>on</strong>g>of</str<strong>on</strong>g>ten combined with the predicti<strong>on</strong> <str<strong>on</strong>g>of</str<strong>on</strong>g> <str<strong>on</strong>g>disease</str<strong>on</strong>g><br />
levels in determining whether c<strong>on</strong>trol measures are required. Three main types<br />
<str<strong>on</strong>g>of</str<strong>on</strong>g> <str<strong>on</strong>g>disease</str<strong>on</strong>g> assessment have been used to develop crop loss models-<str<strong>on</strong>g>disease</str<strong>on</strong>g> at a<br />
critical point in crop development, <str<strong>on</strong>g>disease</str<strong>on</strong>g> at multiple points during crop<br />
development <str<strong>on</strong>g>and</str<strong>on</strong>g> <str<strong>on</strong>g>disease</str<strong>on</strong>g> throughout crop development as measured by the area<br />
under the <str<strong>on</strong>g>disease</str<strong>on</strong>g> progress curve.<br />
Critical-point models<br />
Critical point or single point models are based <strong>on</strong> a <str<strong>on</strong>g>disease</str<strong>on</strong>g> assessment that is<br />
made at a given time in the plant's life (the critical point) <str<strong>on</strong>g>and</str<strong>on</strong>g> then related to <strong>yield</strong><br />
loss. Relati<strong>on</strong>ships between the amount <str<strong>on</strong>g>of</str<strong>on</strong>g> <str<strong>on</strong>g>disease</str<strong>on</strong>g> <str<strong>on</strong>g>and</str<strong>on</strong>g> percentage loss in <strong>yield</strong><br />
are usually expressed in the form <str<strong>on</strong>g>of</str<strong>on</strong>g> linear regressi<strong>on</strong> equati<strong>on</strong>s where the<br />
independent variable is <str<strong>on</strong>g>disease</str<strong>on</strong>g> intensity (X) at the particular stage <str<strong>on</strong>g>of</str<strong>on</strong>g> crop<br />
development <str<strong>on</strong>g>and</str<strong>on</strong>g> the percentage loss in <strong>yield</strong> (Y) is the dependent variable. For<br />
example, the mean percentage reducti<strong>on</strong> <str<strong>on</strong>g>of</str<strong>on</strong>g> grain <strong>yield</strong> attributable to powdery<br />
mildew in spring barley <str<strong>on</strong>g>and</str<strong>on</strong>g> oats in the United Kingdom can be expressed as<br />
Y = 2.518 where X is the percentage <str<strong>on</strong>g>of</str<strong>on</strong>g> mildew at the lO.5 stage <str<strong>on</strong>g>of</str<strong>on</strong>g> plant growth<br />
(see Fig. 2O.l). Thus, if 25o/o <str<strong>on</strong>g>of</str<strong>on</strong>g> the plant is covered with mildew at the 1O.5<br />
stage <str<strong>on</strong>g>of</str<strong>on</strong>g> plant growth, <strong>on</strong>e might expect a <strong>yield</strong> reducti<strong>on</strong> <str<strong>on</strong>g>of</str<strong>on</strong>g> 12.5o/o. Similarly,<br />
loss in <strong>yield</strong> due to rice blast in Japan can be estimated by the equati<strong>on</strong><br />
Y = O.57X where X is the percentage <str<strong>on</strong>g>of</str<strong>on</strong>g> blasted necks (culm regi<strong>on</strong> immediately<br />
below the inflorescence) at 3O days after heading. In these examples, the <str<strong>on</strong>g>disease</str<strong>on</strong>g><br />
severity was measured at a specific stage <str<strong>on</strong>g>of</str<strong>on</strong>g> plant growth (the critical point).
326 J ohn Brotun <str<strong>on</strong>g>and</str<strong>on</strong>g> Philio Ke ane<br />
Other critical point approaches use observati<strong>on</strong>s <str<strong>on</strong>g>of</str<strong>on</strong>g> <str<strong>on</strong>g>disease</str<strong>on</strong>g>-free periods or<br />
<str<strong>on</strong>g>disease</str<strong>on</strong>g> thresholds to predict crop losses. In the United Kingdom, 75o/o late<br />
blight severity is used as a predictor <str<strong>on</strong>g>of</str<strong>on</strong>g> crop loss in potato. If it occurs in late<br />
July (mid-summer), 5Oo/o loss is predicted, but if it does not occur until mid-<br />
September (early autumn) <strong>on</strong>ly a 4%o loss is predicted.<br />
A major criticism <str<strong>on</strong>g>of</str<strong>on</strong>g> critical point models is that they do not take into account<br />
the possibility that infecti<strong>on</strong> rates (r) may vary throughout an epidemic. They<br />
ignore the shape <str<strong>on</strong>g>of</str<strong>on</strong>g> the <str<strong>on</strong>g>disease</str<strong>on</strong>g> progress curve. The model cannot distinguish<br />
between a short, severe epidemic <str<strong>on</strong>g>and</str<strong>on</strong>g> a l<strong>on</strong>g, less severe epidemic if both<br />
happen to have the same amount <str<strong>on</strong>g>of</str<strong>on</strong>g> <str<strong>on</strong>g>disease</str<strong>on</strong>g> at the critical point (Fig. 20.4).<br />
However, they may be very useful when <str<strong>on</strong>g>disease</str<strong>on</strong>g> progress is relatively uniform or<br />
when the amount <str<strong>on</strong>g>of</str<strong>on</strong>g> <str<strong>on</strong>g>disease</str<strong>on</strong>g> at a certain stage <str<strong>on</strong>g>of</str<strong>on</strong>g> crop development has a<br />
dominant effect <strong>on</strong> <strong>yield</strong>.<br />
Severity<br />
<str<strong>on</strong>g>of</str<strong>on</strong>g><br />
<str<strong>on</strong>g>disease</str<strong>on</strong>g><br />
lime<br />
Figure 2O.4 Two very different <str<strong>on</strong>g>disease</str<strong>on</strong>g> progress curves that show similar amounts <str<strong>on</strong>g>of</str<strong>on</strong>g><br />
<str<strong>on</strong>g>disease</str<strong>on</strong>g> at a critical point. (From Parbery <str<strong>on</strong>g>and</str<strong>on</strong>g> Brown. 1980.)<br />
Multiple-point models<br />
To develop multiple-point models, <str<strong>on</strong>g>disease</str<strong>on</strong>g> assessments are made at regular<br />
intervals during development <str<strong>on</strong>g>of</str<strong>on</strong>g> the epidemic. An empirical equati<strong>on</strong> obtained by<br />
multiple regressi<strong>on</strong> analysis can be used to estimate <strong>yield</strong> losses for <str<strong>on</strong>g>disease</str<strong>on</strong>g><br />
progress curves showing different characteristics. The general form <str<strong>on</strong>g>of</str<strong>on</strong>g> the<br />
regressi<strong>on</strong> equati<strong>on</strong> is Y = a + brXl +b2X2 + ... + br,X. where Y is the loss in<br />
<strong>yield</strong> <str<strong>on</strong>g>and</str<strong>on</strong>g> Xr, = the amount <str<strong>on</strong>g>of</str<strong>on</strong>g> <str<strong>on</strong>g>disease</str<strong>on</strong>g> measured at the nft assessment time. The<br />
c<strong>on</strong>stants b can be determined from the crop loss experiments described above.<br />
Multiple-point models are especially useful in <strong>yield</strong> loss analyses where<br />
infecti<strong>on</strong> rates are variable, where the shape <str<strong>on</strong>g>of</str<strong>on</strong>g> the epidemic progress curve<br />
varies <str<strong>on</strong>g>and</str<strong>on</strong>g> for epidemics <str<strong>on</strong>g>of</str<strong>on</strong>g> different lengths. Because they take into account<br />
variati<strong>on</strong>s in epidemic progress, they are regarded as allowing more accurate<br />
<strong>yield</strong> predicti<strong>on</strong>s. In practice the c<strong>on</strong>cepts <str<strong>on</strong>g>of</str<strong>on</strong>g> the critical point <str<strong>on</strong>g>and</str<strong>on</strong>g> multiple point<br />
models are <str<strong>on</strong>g>of</str<strong>on</strong>g>ten combined because the multiple point observati<strong>on</strong>s are <str<strong>on</strong>g>of</str<strong>on</strong>g>ten<br />
made at especially chosen critical stages in the deveiopment <str<strong>on</strong>g>of</str<strong>on</strong>g> the epidemic or<br />
the crop (i.e. stages at which the observati<strong>on</strong>s have greater predictive value for<br />
<strong>yield</strong>).
Area under <str<strong>on</strong>g>disease</str<strong>on</strong>g> progress curves<br />
2O. <str<strong>on</strong>g>Assessment</str<strong>on</strong>g> oJ <str<strong>on</strong>g>disease</str<strong>on</strong>g> <str<strong>on</strong>g>and</str<strong>on</strong>g> <str<strong>on</strong>g>effects</str<strong>on</strong>g> <strong>on</strong> gteld. 327<br />
The relati<strong>on</strong>ship between <str<strong>on</strong>g>disease</str<strong>on</strong>g> <str<strong>on</strong>g>and</str<strong>on</strong>g> <strong>yield</strong> loss can be determined by studying<br />
the area under the <str<strong>on</strong>g>disease</str<strong>on</strong>g> progress curve (AUDPC). This is based <strong>on</strong> similar<br />
logic to the multiple point model except that it involves integrati<strong>on</strong> <str<strong>on</strong>g>of</str<strong>on</strong>g> the entire<br />
<str<strong>on</strong>g>disease</str<strong>on</strong>g> progress curye. The model assumes that <strong>yield</strong> loss is proporti<strong>on</strong>al to the<br />
amount <str<strong>on</strong>g>of</str<strong>on</strong>g> <str<strong>on</strong>g>disease</str<strong>on</strong>g> <str<strong>on</strong>g>and</str<strong>on</strong>g> that <strong>yield</strong> reducti<strong>on</strong> is proporti<strong>on</strong>al to the durati<strong>on</strong> <str<strong>on</strong>g>of</str<strong>on</strong>g> the<br />
<str<strong>on</strong>g>disease</str<strong>on</strong>g>. Compared with the critical point model it has the advantage that it can<br />
distinguish between two epidemics with different areas under the curve but<br />
which have the sarne percentage severity at a critical time (Fig. 20.4). The main<br />
disadvantage <str<strong>on</strong>g>of</str<strong>on</strong>g> the model is that it does not differentiate severity <str<strong>on</strong>g>of</str<strong>on</strong>g> <str<strong>on</strong>g>disease</str<strong>on</strong>g><br />
relative to time. James (1974) pointed out that when the model was applied to<br />
potato blight epidemics, it could not distinguish between epidemics which<br />
commenced at different stages in the plant's growth but which showed similar<br />
areas under the <str<strong>on</strong>g>disease</str<strong>on</strong>g> progress curve (Fig. 20.5). He found that early light<br />
infecti<strong>on</strong>s caused greater <strong>yield</strong> reducti<strong>on</strong>s than late, severe infecti<strong>on</strong>s even<br />
though the areas under the <str<strong>on</strong>g>disease</str<strong>on</strong>g> progress curve were the same. This problem<br />
could readily be overcome by inclusi<strong>on</strong> in the model <str<strong>on</strong>g>of</str<strong>on</strong>g> a factor which relates<br />
AUDPC to particular stages <str<strong>on</strong>g>of</str<strong>on</strong>g> crop development.<br />
Severity<br />
<str<strong>on</strong>g>of</str<strong>on</strong>g><br />
<str<strong>on</strong>g>disease</str<strong>on</strong>g><br />
Figure 2O.5 Trwo very different <str<strong>on</strong>g>disease</str<strong>on</strong>g> progress curves that show similar areas under the<br />
<str<strong>on</strong>g>disease</str<strong>on</strong>g> progress curve. {From Parbery <str<strong>on</strong>g>and</str<strong>on</strong>g> Brown. 1980.)<br />
The statistical approach<br />
Time<br />
This approach to <str<strong>on</strong>g>disease</str<strong>on</strong>g> assessment involves statistical analysis <str<strong>on</strong>g>of</str<strong>on</strong>g> <strong>yield</strong>s under<br />
different levels <str<strong>on</strong>g>of</str<strong>on</strong>g> <str<strong>on</strong>g>disease</str<strong>on</strong>g> that occur naturally in the field. The methods used<br />
include: (i) comparis<strong>on</strong>s <str<strong>on</strong>g>of</str<strong>on</strong>g> <strong>yield</strong>s obtained from crops in seas<strong>on</strong>s with different<br />
<str<strong>on</strong>g>disease</str<strong>on</strong>g> intensities, (ii) comparis<strong>on</strong>s <str<strong>on</strong>g>of</str<strong>on</strong>g> expected (based <strong>on</strong>, for example,<br />
experience under <str<strong>on</strong>g>disease</str<strong>on</strong>g> free c<strong>on</strong>diti<strong>on</strong>s <strong>on</strong> experimental stati<strong>on</strong>s) <str<strong>on</strong>g>and</str<strong>on</strong>g> actual<br />
<strong>yield</strong>s, (iii) comparis<strong>on</strong>s <str<strong>on</strong>g>of</str<strong>on</strong>g> the <strong>yield</strong>s <str<strong>on</strong>g>of</str<strong>on</strong>g> a particular crop with the average <strong>yield</strong><br />
for the regi<strong>on</strong> <str<strong>on</strong>g>and</str<strong>on</strong>g> (iv) comparis<strong>on</strong>s <str<strong>on</strong>g>of</str<strong>on</strong>g> epidemic progress <str<strong>on</strong>g>and</str<strong>on</strong>g> <strong>yield</strong> parameters<br />
between crops or porti<strong>on</strong>s <str<strong>on</strong>g>of</str<strong>on</strong>g> a crop showing different levels <str<strong>on</strong>g>of</str<strong>on</strong>g> infecti<strong>on</strong> or<br />
damage. These comparis<strong>on</strong>s can be very useful because they are based <strong>on</strong> the<br />
real cropping situati<strong>on</strong> in the field rather than <strong>on</strong> experimental plots, which <str<strong>on</strong>g>of</str<strong>on</strong>g>ten<br />
$ive artificially high <strong>yield</strong>s. However, account has to be taken <str<strong>on</strong>g>of</str<strong>on</strong>g> the fact that in<br />
the field many other factors besides <str<strong>on</strong>g>disease</str<strong>on</strong>g> will affect the <strong>yield</strong>. Using statistical<br />
analysis <str<strong>on</strong>g>of</str<strong>on</strong>g> natural <str<strong>on</strong>g>disease</str<strong>on</strong>g> epidemics, critical point, multiple point <str<strong>on</strong>g>and</str<strong>on</strong>g> AUDpC<br />
models relating crop loss to epidemic development can also be determined.
328 John Brotun <str<strong>on</strong>g>and</str<strong>on</strong>g> Philio Keane<br />
20.5 <strong>Plant</strong> <str<strong>on</strong>g>disease</str<strong>on</strong>g> surveys<br />
Another statistical approach to assessment <str<strong>on</strong>g>of</str<strong>on</strong>g> crop loss involves the use <str<strong>on</strong>g>of</str<strong>on</strong>g><br />
questi<strong>on</strong>naires to assess <str<strong>on</strong>g>disease</str<strong>on</strong>g> (<str<strong>on</strong>g>and</str<strong>on</strong>g> pest) incidence or severity. Results <str<strong>on</strong>g>of</str<strong>on</strong>g><br />
farmers' assessments <str<strong>on</strong>g>of</str<strong>on</strong>g> <str<strong>on</strong>g>disease</str<strong>on</strong>g> can be related to the <strong>yield</strong>s eventually obtained.<br />
Appraisals <str<strong>on</strong>g>of</str<strong>on</strong>g> <str<strong>on</strong>g>disease</str<strong>on</strong>g> <str<strong>on</strong>g>and</str<strong>on</strong>g> <strong>yield</strong>-loss are <str<strong>on</strong>g>of</str<strong>on</strong>g>ten <str<strong>on</strong>g>of</str<strong>on</strong>g> limited value because <str<strong>on</strong>g>of</str<strong>on</strong>g> the<br />
difficulty <str<strong>on</strong>g>of</str<strong>on</strong>g> obtaining informati<strong>on</strong> c<strong>on</strong>cerning the prevalence <str<strong>on</strong>g>and</str<strong>on</strong>g> severity <str<strong>on</strong>g>of</str<strong>on</strong>g><br />
<str<strong>on</strong>g>disease</str<strong>on</strong>g>s over large areas. For this reas<strong>on</strong> there is a special need for an<br />
increased use <str<strong>on</strong>g>of</str<strong>on</strong>g> plant <str<strong>on</strong>g>disease</str<strong>on</strong>g> surveys. The informati<strong>on</strong> obtained from plant<br />
<str<strong>on</strong>g>disease</str<strong>on</strong>g> surveys enables the relative importance <str<strong>on</strong>g>of</str<strong>on</strong>g> different <str<strong>on</strong>g>disease</str<strong>on</strong>g>s to be<br />
determined, which in turn enables rati<strong>on</strong>al allocati<strong>on</strong> <str<strong>on</strong>g>of</str<strong>on</strong>g> resources for research<br />
as well as c<strong>on</strong>trol <str<strong>on</strong>g>and</str<strong>on</strong>g> eradicati<strong>on</strong> programs.<br />
Disease surveys are also necessary to establish: (i) the geographic distributi<strong>on</strong><br />
<str<strong>on</strong>g>of</str<strong>on</strong>g> pests, pathogens <str<strong>on</strong>g>and</str<strong>on</strong>g> their various pathotypes, (ii) the rate <str<strong>on</strong>g>of</str<strong>on</strong>g> spread <str<strong>on</strong>g>of</str<strong>on</strong>g> newly<br />
introduced pests <str<strong>on</strong>g>and</str<strong>on</strong>g> pathogens,<br />
<str<strong>on</strong>g>and</str<strong>on</strong>g> pests <str<strong>on</strong>g>and</str<strong>on</strong>g> (M<br />
(iii) the presence <str<strong>on</strong>g>of</str<strong>on</strong>g> other hosts <str<strong>on</strong>g>of</str<strong>on</strong>g> pathogens<br />
'breakdowns'in<br />
<str<strong>on</strong>g>disease</str<strong>on</strong>g> resistance used in crop plants.<br />
20.6 Fufther reading<br />
American Phytopathological Society (1964). Symposium <strong>on</strong> plant <str<strong>on</strong>g>disease</str<strong>on</strong>g> losses.<br />
Phgtopathologg 54, 1 305- r 3 I 9.<br />
Beaum<strong>on</strong>t, A. (1954). Tomato leaf mould: spraying trials in Lancashire <str<strong>on</strong>g>and</str<strong>on</strong>g> Yorkshire,<br />
1949-1952. <strong>Plant</strong> Pathologg 3, 2I-35.<br />
British Mycological Society (1948). The measurement <str<strong>on</strong>g>of</str<strong>on</strong>g> potato blight. Transacti<strong>on</strong>s oJ the<br />
Bnhsh Mgcologtcal Societg 31, 140-141.<br />
Calpouzos, L., Roelfs, A.P., Mads<strong>on</strong>, M.E., Martin, F.B., Welsh, J.R. <str<strong>on</strong>g>and</str<strong>on</strong>g> Wilcoxs<strong>on</strong>, R.D.<br />
(1976). A netu model to measure gield Losses cantsed bg stem rust in spring tuheat.<br />
Technical Bulletin 307, Agricultural Experimental Stati<strong>on</strong>, University <str<strong>on</strong>g>of</str<strong>on</strong>g> Minnesota.<br />
Carls<strong>on</strong>, G.A. <str<strong>on</strong>g>and</str<strong>on</strong>g> Main, E.B. (1976). Ec<strong>on</strong>omics <str<strong>on</strong>g>of</str<strong>on</strong>g> <str<strong>on</strong>g>disease</str<strong>on</strong>g>-loss manaqement. Annuc"l<br />
Reuieus oJ Phgtopathologa A, 38 f -403.<br />
Carnegie, A.J., Keane, P.J., Ades, P.K. <str<strong>on</strong>g>and</str<strong>on</strong>g> Smith, I.W. (1994). Variati<strong>on</strong> in susceptibility <str<strong>on</strong>g>of</str<strong>on</strong>g><br />
Eucatgpttts globulus provenances to Mycosphaerella leaf <str<strong>on</strong>g>disease</str<strong>on</strong>g> . Canadian Journal oJ<br />
Forest Research 24, 17 5I-I7 57 .<br />
Chester, K.S. (1950). <strong>Plant</strong> <str<strong>on</strong>g>disease</str<strong>on</strong>g> losses: their appraisal <str<strong>on</strong>g>and</str<strong>on</strong>g> interpretati<strong>on</strong>. <strong>Plant</strong>Disease<br />
Reporter Supplement 193, 189-362.<br />
Chiarappa, L. (ed.) (1971). Crop loss assessmentmethods. tr.A.O. manual<strong>on</strong>the eualuatt<strong>on</strong><br />
<str<strong>on</strong>g>and</str<strong>on</strong>g> preuenti<strong>on</strong> oJ losses bg pests, <str<strong>on</strong>g>disease</str<strong>on</strong>g> <str<strong>on</strong>g>and</str<strong>on</strong>g> useeds. Food <str<strong>on</strong>g>and</str<strong>on</strong>g> Agricultural<br />
Organizati<strong>on</strong> <str<strong>on</strong>g>of</str<strong>on</strong>g> the United Nati<strong>on</strong>s. Supplement I (1973), Unipublicati<strong>on</strong>s<br />
Incorporated, New York; Supplement 2 (1977), Unipublicati<strong>on</strong>s Incorporated, New<br />
York.<br />
Close, R.C., Gaunt, R.E., Harvey, I.C., McCully, A.J., S<str<strong>on</strong>g>and</str<strong>on</strong>g>ers<strong>on</strong>, F.R. <str<strong>on</strong>g>and</str<strong>on</strong>g> Teng, P.S. (1977).<br />
EpidemioLogg <str<strong>on</strong>g>and</str<strong>on</strong>g> Crop lnss <str<strong>on</strong>g>Assessment</str<strong>on</strong>g>. Proceedings <str<strong>on</strong>g>of</str<strong>on</strong>g> Australian <strong>Plant</strong> Pathologr<br />
Society Workshop, Lincoln College, August, 1977.<br />
Gollifer, D.J. <str<strong>on</strong>g>and</str<strong>on</strong>g> Brown, J.F. (1974). Phytophthora leaf blight <str<strong>on</strong>g>of</str<strong>on</strong>g> Colocasiaesculentain the<br />
British Solom<strong>on</strong> Isl<str<strong>on</strong>g>and</str<strong>on</strong>g>s. Papua Neu; Guinea Agrtcultural Journal2s, 6-f l.<br />
Greenhalgh, F.C. <str<strong>on</strong>g>and</str<strong>on</strong>g> Lucas, S.E. (1984). Effect <str<strong>on</strong>g>of</str<strong>on</strong>g> soil pasteurisati<strong>on</strong> <strong>on</strong> damping-<str<strong>on</strong>g>of</str<strong>on</strong>g>f <str<strong>on</strong>g>and</str<strong>on</strong>g><br />
root rot <str<strong>on</strong>g>of</str<strong>on</strong>g> subterranean clover caused by Fi.rsanum aDenaceum <str<strong>on</strong>g>and</str<strong>on</strong>g> Pgtlium spp. Soil<br />
Biologg <str<strong>on</strong>g>and</str<strong>on</strong>g> BiochemlshU 16, 87-88.<br />
James, C. (1971). Amotnual oJassessmentkegsJor plant<str<strong>on</strong>g>disease</str<strong>on</strong>g>s. Canada Department <str<strong>on</strong>g>of</str<strong>on</strong>g><br />
Agriculture Publicati<strong>on</strong> No. 1458.<br />
James, W.C. (f 974). <str<strong>on</strong>g>Assessment</str<strong>on</strong>g> <str<strong>on</strong>g>of</str<strong>on</strong>g> plant <str<strong>on</strong>g>disease</str<strong>on</strong>g>s <str<strong>on</strong>g>and</str<strong>on</strong>g> losses. Annual Reuieu-t <str<strong>on</strong>g>of</str<strong>on</strong>g><br />
Phgtopathotogg L2, 27 48.
20. <str<strong>on</strong>g>Assessment</str<strong>on</strong>g> oJ <str<strong>on</strong>g>disease</str<strong>on</strong>g> <str<strong>on</strong>g>and</str<strong>on</strong>g>. <str<strong>on</strong>g>effects</str<strong>on</strong>g> <strong>on</strong> gield 329<br />
Katsube, T. <str<strong>on</strong>g>and</str<strong>on</strong>g> Koshimizu, Y. (1970). Influence <str<strong>on</strong>g>of</str<strong>on</strong>g> blast <str<strong>on</strong>g>disease</str<strong>on</strong>g> <strong>on</strong> hawest in rice plant. l:<br />
Effect <str<strong>on</strong>g>of</str<strong>on</strong>g> panicle infecti<strong>on</strong> <strong>on</strong> <strong>yield</strong> comp<strong>on</strong>ents <str<strong>on</strong>g>and</str<strong>on</strong>g> quality. Bulletin oJ Tohoku<br />
Nati<strong>on</strong>aL Agricultural Expertmentat Stati<strong>on</strong> 39, 55-96.<br />
Kranz, J. (ed.) (1974). Epidemics <str<strong>on</strong>g>of</str<strong>on</strong>g> plant <str<strong>on</strong>g>disease</str<strong>on</strong>g>s: mathematical. analgsts <str<strong>on</strong>g>and</str<strong>on</strong>g> modeling.<br />
Chapman <str<strong>on</strong>g>and</str<strong>on</strong>g> Hall Limited, L<strong>on</strong>d<strong>on</strong>.<br />
I{ranz, J. (1988). Measuring plant <str<strong>on</strong>g>disease</str<strong>on</strong>g>, in J. Ikanz <str<strong>on</strong>g>and</str<strong>on</strong>g> J. Rotem (eds), Expertmental"<br />
techni4ues in plant <str<strong>on</strong>g>disease</str<strong>on</strong>g> epidemioLogg. Springer-Verlag, Berlin.<br />
Large, E.C. (1952). The interpretati<strong>on</strong> <str<strong>on</strong>g>of</str<strong>on</strong>g> progress curves for potato blight <str<strong>on</strong>g>and</str<strong>on</strong>g> other plant<br />
<str<strong>on</strong>g>disease</str<strong>on</strong>g>s. Ptant Pathologa I, l0g-f f 7.<br />
Large, E.C. (f954). Growth stages in cereals, illustrati<strong>on</strong> <str<strong>on</strong>g>of</str<strong>on</strong>g> the Feekes scale. Pl.ant<br />
Pathologg g, l2Ll29.<br />
Large, E.C. (f 966). Measuring plant <str<strong>on</strong>g>disease</str<strong>on</strong>g>. Annual"Reutetu oJPhgtopathologg 4,9-28.<br />
Manuat oJ plant grotuth stages <str<strong>on</strong>g>and</str<strong>on</strong>g> <str<strong>on</strong>g>disease</str<strong>on</strong>g> assessment kegs. Ministry <str<strong>on</strong>g>of</str<strong>on</strong>g> Agriculture,<br />
Fisheries <str<strong>on</strong>g>and</str<strong>on</strong>g> Food, Harpenden <strong>Plant</strong> Pathologr Laboratory, 1976.<br />
Parbery, I.H. <str<strong>on</strong>g>and</str<strong>on</strong>g> Brown, J.F. (1980). Disease assessment <str<strong>on</strong>g>and</str<strong>on</strong>g> losses, rnJ. F. Brown (ed.),<br />
Ptant protectr<strong>on</strong> pp. 303-314. Australian Vice-Chancellors' Committee, Canberra.<br />
Scott, P.R. <str<strong>on</strong>g>and</str<strong>on</strong>g> Bainbridge, A. (1978). Ptant <str<strong>on</strong>g>disease</str<strong>on</strong>g> epidemiology. Blackwell Scientific<br />
Publicati<strong>on</strong>s, Oxford.<br />
Teng, P.S. <str<strong>on</strong>g>and</str<strong>on</strong>g> Johns<strong>on</strong>, K.B. (1988). Analysis <str<strong>on</strong>g>of</str<strong>on</strong>g> epidemiological comp<strong>on</strong>ents in <strong>yield</strong> loss<br />
assessment in J. Kranz <str<strong>on</strong>g>and</str<strong>on</strong>g> J. Rotem (eds), Expertmental techniques tn plant dtsease<br />
epidemtology. Springer-Verlag, Berlin.<br />
Teng, P.S., Blackie, M.J. <str<strong>on</strong>g>and</str<strong>on</strong>g> Close, R.C. (1978). Simulati<strong>on</strong> modelling <str<strong>on</strong>g>of</str<strong>on</strong>g> plant <str<strong>on</strong>g>disease</str<strong>on</strong>g>s to<br />
rati<strong>on</strong>alize fungicide use. Outlook <strong>on</strong> Agriculture 9, 27 3-27 7 .<br />
Van der Plank, J.L. (1963) . <strong>Plant</strong> drseases; epidemirs <str<strong>on</strong>g>and</str<strong>on</strong>g>. c<strong>on</strong>troL Academic Press, New York<br />
<str<strong>on</strong>g>and</str<strong>on</strong>g> L<strong>on</strong>d<strong>on</strong>.<br />
Wallace, H.R. (1978). The diagnosis <str<strong>on</strong>g>of</str<strong>on</strong>g> plant <str<strong>on</strong>g>disease</str<strong>on</strong>g>s <str<strong>on</strong>g>of</str<strong>on</strong>g> complex etiology. AnnualReuieu oJ<br />
Phgtopathologg 16, 37 9-402.<br />
Wheeler, B.E.J. (1969). Anintrodncti<strong>on</strong>to plant <str<strong>on</strong>g>disease</str<strong>on</strong>g>s. John Wiley <str<strong>on</strong>g>and</str<strong>on</strong>g> S<strong>on</strong>s, L<strong>on</strong>d<strong>on</strong>.<br />
Zadoks, J.C. {1972). Methodology <str<strong>on</strong>g>of</str<strong>on</strong>g> epidemiological research. Annual Reui"etu oJ<br />
Phgtopathologg lO, 253-27 6.<br />
Zadoks, J.C. (1985). On the c<strong>on</strong>ceptual basis <str<strong>on</strong>g>of</str<strong>on</strong>g> crop loss assessment: the threshold<br />
theory. Anmtc.L Reui.ew oJ Phg topattrcLog<br />
U 29' 45547 3.<br />
Zadoks, J.C., Chang, T. T. <str<strong>on</strong>g>and</str<strong>on</strong>g> K<strong>on</strong>zak, C.F. (1974). A decimal code for the growth stages <str<strong>on</strong>g>of</str<strong>on</strong>g><br />
cereals. Weed Research L4, 41542I.


![[Compatibility Mode].pdf](https://img.yumpu.com/27318716/1/190x135/compatibility-modepdf.jpg?quality=85)