Assessment of disease and effects on yield - Australasian Plant ...
Assessment of disease and effects on yield - Australasian Plant ...
Assessment of disease and effects on yield - Australasian Plant ...

You also want an ePaper? Increase the reach of your titles
YUMPU automatically turns print PDFs into web optimized ePapers that Google loves.
320 John Brousn <str<strong>on</strong>g>and</str<strong>on</strong>g> Philtp Keane<br />
involve inflorescences, fruits or whole plants) showing different <str<strong>on</strong>g>disease</str<strong>on</strong>g><br />
severities as blackened areas. Severity scales are adjusted to take into account<br />
the above c<strong>on</strong>cepts <str<strong>on</strong>g>of</str<strong>on</strong>g> visual percepti<strong>on</strong>. Samples <str<strong>on</strong>g>of</str<strong>on</strong>g> the crop are then compared<br />
with these diagrams to allow an assessment <str<strong>on</strong>g>of</str<strong>on</strong>g> severity. A <str<strong>on</strong>g>disease</str<strong>on</strong>g> index for a<br />
crop can be obtained by summing the individual <str<strong>on</strong>g>disease</str<strong>on</strong>g> assessments <str<strong>on</strong>g>and</str<strong>on</strong>g> then<br />
dividing this by the number <str<strong>on</strong>g>of</str<strong>on</strong>g> plants assessed.<br />
For comm<strong>on</strong> <str<strong>on</strong>g>disease</str<strong>on</strong>g>s it is helpful to use published keys to st<str<strong>on</strong>g>and</str<strong>on</strong>g>ardise<br />
measurements around the world. However, in some cases such as for new<br />
<str<strong>on</strong>g>disease</str<strong>on</strong>g>s or in particular circumstances it may be necessary to develop <strong>on</strong>e's own<br />
key. To produce a <str<strong>on</strong>g>disease</str<strong>on</strong>g> assessment key, the development <str<strong>on</strong>g>of</str<strong>on</strong>g> <str<strong>on</strong>g>disease</str<strong>on</strong>g> over the<br />
whole <str<strong>on</strong>g>disease</str<strong>on</strong>g> cycle <str<strong>on</strong>g>and</str<strong>on</strong>g> at different stages <str<strong>on</strong>g>of</str<strong>on</strong>g> plant growth must be studied.<br />
Drawings <str<strong>on</strong>g>and</str<strong>on</strong>g> measurements <str<strong>on</strong>g>of</str<strong>on</strong>g> the <str<strong>on</strong>g>disease</str<strong>on</strong>g>d plant at various stages <str<strong>on</strong>g>of</str<strong>on</strong>g><br />
development are required <str<strong>on</strong>g>and</str<strong>on</strong>g> the various parts <str<strong>on</strong>g>of</str<strong>on</strong>g> the plant that are damaged<br />
must be analysed. This informati<strong>on</strong> is used to develop prototype st<str<strong>on</strong>g>and</str<strong>on</strong>g>ard<br />
diagrams which may involve photographing or tracing symptoms <strong>on</strong>to paper <str<strong>on</strong>g>and</str<strong>on</strong>g><br />
accurately measuring the proporti<strong>on</strong> <str<strong>on</strong>g>of</str<strong>on</strong>g> the tissue <str<strong>on</strong>g>disease</str<strong>on</strong>g>d. Alternatively, the<br />
area <str<strong>on</strong>g>of</str<strong>on</strong>g> leaves <str<strong>on</strong>g>and</str<strong>on</strong>g> the area <str<strong>on</strong>g>of</str<strong>on</strong>g> <str<strong>on</strong>g>disease</str<strong>on</strong>g> can be measured using an electr<strong>on</strong>ic 'leaf<br />
area meter' or a video camera <str<strong>on</strong>g>and</str<strong>on</strong>g> image analysing equipment c<strong>on</strong>nected to a<br />
computer. Eventually, the key is simplified to enable rapid <str<strong>on</strong>g>and</str<strong>on</strong>g> accurate<br />
measurement <str<strong>on</strong>g>of</str<strong>on</strong>g> the <str<strong>on</strong>g>disease</str<strong>on</strong>g> under field c<strong>on</strong>diti<strong>on</strong>s. For crop loss assessments,<br />
the key has to be set so that it measures the <str<strong>on</strong>g>disease</str<strong>on</strong>g> at the stages <str<strong>on</strong>g>of</str<strong>on</strong>g> crop<br />
development that are critical for <strong>yield</strong>. The scale then has to be tested in the<br />
field in an objective way. For example, a researcher may assess a range <str<strong>on</strong>g>of</str<strong>on</strong>g><br />
<str<strong>on</strong>g>disease</str<strong>on</strong>g>d samples with the key <str<strong>on</strong>g>and</str<strong>on</strong>g> then compare the results with objective<br />
measurements in the laboratory <str<strong>on</strong>g>of</str<strong>on</strong>g> the same samples. Some examples <str<strong>on</strong>g>of</str<strong>on</strong>g><br />
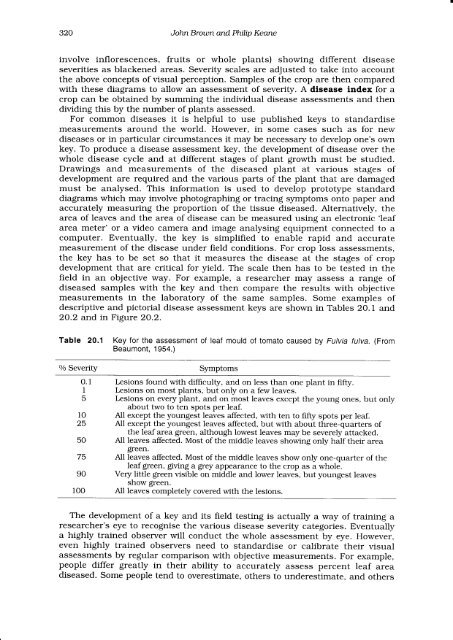
descriptive <str<strong>on</strong>g>and</str<strong>on</strong>g> pictorial <str<strong>on</strong>g>disease</str<strong>on</strong>g> assessment keys are shown in Tables 20.1 <str<strong>on</strong>g>and</str<strong>on</strong>g><br />
2O.2 <str<strong>on</strong>g>and</str<strong>on</strong>g> in Figure 2O.2.<br />
Table 20.1 Key for the assessment <str<strong>on</strong>g>of</str<strong>on</strong>g> leaf mould <str<strong>on</strong>g>of</str<strong>on</strong>g> tomato caused by Fulvia fulva. (From<br />
Beaum<strong>on</strong>t, 1954.)<br />
o/o Severity Symptoms<br />
0.1<br />
I<br />
5<br />
10<br />
25<br />
50<br />
75<br />
90<br />
roo<br />
Lesi<strong>on</strong>s found with difficulty, <str<strong>on</strong>g>and</str<strong>on</strong>g> <strong>on</strong> less than <strong>on</strong>e plant in fifty.<br />
l,esi<strong>on</strong>s <strong>on</strong> most plants, but <strong>on</strong>ly <strong>on</strong> a few leaves.<br />
Lesi<strong>on</strong>s <strong>on</strong> every plant, <str<strong>on</strong>g>and</str<strong>on</strong>g> <strong>on</strong> most leaves except the young <strong>on</strong>es, but <strong>on</strong>ly<br />
about two to ten spots per leaf.<br />
All except the youngest leaves affected, with ten to fifty spots per leaf.<br />
All except the youngest leaves affected, but with about three-quarters <str<strong>on</strong>g>of</str<strong>on</strong>g><br />
the leaf area green, although lowest leaves may be severely attacked.<br />
All leaves affected. Most <str<strong>on</strong>g>of</str<strong>on</strong>g> the middle leaves showing <strong>on</strong>ly half their area<br />
green.<br />
All leaves affected. Most <str<strong>on</strong>g>of</str<strong>on</strong>g> the middle leaves show <strong>on</strong>ly <strong>on</strong>e-quarter <str<strong>on</strong>g>of</str<strong>on</strong>g> the<br />
leaf green, giving a grey appearance to the crop as a whole.<br />
Very little green visible <strong>on</strong> middle <str<strong>on</strong>g>and</str<strong>on</strong>g> lower leaves, but youngest leaves<br />
show green.<br />
All leaves completely covered with the lesi<strong>on</strong>s.<br />
The development <str<strong>on</strong>g>of</str<strong>on</strong>g> a key <str<strong>on</strong>g>and</str<strong>on</strong>g> its field testing is actually a way <str<strong>on</strong>g>of</str<strong>on</strong>g> training a<br />
researcher's eye to recognise the various <str<strong>on</strong>g>disease</str<strong>on</strong>g> severity categories. Eventually<br />
a highly trained observer will c<strong>on</strong>duct the whole assessment by eye. However,<br />
even highly trained observers need to st<str<strong>on</strong>g>and</str<strong>on</strong>g>ardise or calibrate their visual<br />
assessments by regular comparis<strong>on</strong> with objective measurements. For example,<br />
people differ greatly in their ability to accurately assess percent leaf area<br />
<str<strong>on</strong>g>disease</str<strong>on</strong>g>d. Some people tend to overestimate, others to underestimate, <str<strong>on</strong>g>and</str<strong>on</strong>g> others


![[Compatibility Mode].pdf](https://img.yumpu.com/27318716/1/190x135/compatibility-modepdf.jpg?quality=85)