Burgenland (State of) - Burgenland.at
Burgenland (State of) - Burgenland.at
Burgenland (State of) - Burgenland.at

Create successful ePaper yourself
Turn your PDF publications into a flip-book with our unique Google optimized e-Paper software.
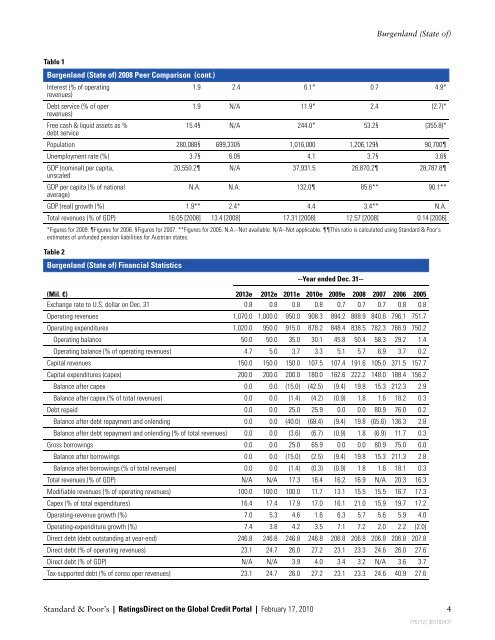
Table 1<br />
<strong>Burgenland</strong> (<strong>St<strong>at</strong>e</strong> <strong>of</strong>) 2008 Peer Comparison (cont.)<br />
Interest (% <strong>of</strong> oper<strong>at</strong>ing<br />
revenues)<br />
Debt service (% <strong>of</strong> oper<br />
revenues)<br />
Free cash & liquid assets as %<br />
debt service<br />
1.9 2.4 6.1* 0.7 4.9*<br />
1.9 N/A 11.9* 2.4 (2.7)*<br />
15.4§ N/A 244.0* 53.2§ (355.8)*<br />
Popul<strong>at</strong>ion 280,088§ 699,330§ 1,016,000 1,206,129§ 90,700¶<br />
Unemployment r<strong>at</strong>e (%) 3.7§ 6.0§ 4.1 3.7§ 3.6§<br />
GDP (nominal) per capita,<br />
unscaled<br />
GDP per capita (% <strong>of</strong> n<strong>at</strong>ional<br />
average)<br />
20,550.2¶ N/A 37,931.5 26,870.2¶ 28,787.8¶<br />
N.A. N.A. 132.0¶ 85.6** 90.1**<br />
GDP (real) growth (%) 1.9** 2.4* 4.4 3.4** N.A.<br />
Total revenues (% <strong>of</strong> GDP) 16.05 [2008] 13.4 [2008] 17.31 [2008] 12.57 [2008] 0.14 [2006]<br />
*Figures for 2009. ¶Figures for 2006. §Figures for 2007. **Figures for 2005. N.A.--Not available. N/A--Not applicable. ¶¶This r<strong>at</strong>io is calcul<strong>at</strong>ed using Standard & Poor's<br />
estim<strong>at</strong>es <strong>of</strong> unfunded pension liabilities for Austrian st<strong>at</strong>es.<br />
Table 2<br />
<strong>Burgenland</strong> (<strong>St<strong>at</strong>e</strong> <strong>of</strong>) Financial St<strong>at</strong>istics<br />
--Year ended Dec. 31--<br />
<strong>Burgenland</strong> (<strong>St<strong>at</strong>e</strong> <strong>of</strong>)<br />
(Mil. €) 2013e 2012e 2011e 2010e 2009e 2008 2007 2006 2005<br />
Exchange r<strong>at</strong>e to U.S. dollar on Dec. 31 0.8 0.8 0.8 0.8 0.7 0.7 0.7 0.8 0.8<br />
Oper<strong>at</strong>ing revenues 1,070.0 1,000.0 950.0 908.3 894.2 888.9 840.6 796.1 751.7<br />
Oper<strong>at</strong>ing expenditures 1,020.0 950.0 915.0 878.2 848.4 838.5 782.3 766.9 750.2<br />
Oper<strong>at</strong>ing balance 50.0 50.0 35.0 30.1 45.8 50.4 58.3 29.2 1.4<br />
Oper<strong>at</strong>ing balance (% <strong>of</strong> oper<strong>at</strong>ing revenues) 4.7 5.0 3.7 3.3 5.1 5.7 6.9 3.7 0.2<br />
Capital revenues 150.0 150.0 150.0 107.5 107.4 191.6 105.0 371.5 157.7<br />
Capital expenditures (capex) 200.0 200.0 200.0 180.0 162.6 222.2 148.0 188.4 156.2<br />
Balance after capex 0.0 0.0 (15.0) (42.5) (9.4) 19.8 15.3 212.3 2.9<br />
Balance after capex (% <strong>of</strong> total revenues) 0.0 0.0 (1.4) (4.2) (0.9) 1.8 1.6 18.2 0.3<br />
Debt repaid 0.0 0.0 25.0 25.9 0.0 0.0 80.9 76.0 0.2<br />
Balance after debt repayment and onlending 0.0 0.0 (40.0) (68.4) (9.4) 19.8 (65.6) 136.3 2.8<br />
Balance after debt repayment and onlending (% <strong>of</strong> total revenues) 0.0 0.0 (3.6) (6.7) (0.9) 1.8 (6.9) 11.7 0.3<br />
Gross borrowings 0.0 0.0 25.0 65.9 0.0 0.0 80.9 75.0 0.0<br />
Balance after borrowings 0.0 0.0 (15.0) (2.5) (9.4) 19.8 15.3 211.3 2.8<br />
Balance after borrowings (% <strong>of</strong> total revenues) 0.0 0.0 (1.4) (0.3) (0.9) 1.8 1.6 18.1 0.3<br />
Total revenues (% <strong>of</strong> GDP) N/A N/A 17.3 16.4 16.2 16.9 N/A 20.3 16.3<br />
Modifiable revenues (% <strong>of</strong> oper<strong>at</strong>ing revenues) 100.0 100.0 100.0 11.7 13.1 15.5 15.5 16.7 17.3<br />
Capex (% <strong>of</strong> total expenditures) 16.4 17.4 17.9 17.0 16.1 21.0 15.9 19.7 17.2<br />
Oper<strong>at</strong>ing-revenue growth (%) 7.0 5.3 4.6 1.6 6.3 5.7 5.6 5.9 4.0<br />
Oper<strong>at</strong>ing-expenditure growth (%) 7.4 3.8 4.2 3.5 7.1 7.2 2.0 2.2 (2.0)<br />
Direct debt (debt outstanding <strong>at</strong> year-end) 246.8 246.8 246.8 246.8 206.8 206.8 206.8 206.8 207.8<br />
Direct debt (% <strong>of</strong> oper<strong>at</strong>ing revenues) 23.1 24.7 26.0 27.2 23.1 23.3 24.6 26.0 27.6<br />
Direct debt (% <strong>of</strong> GDP) N/A N/A 3.9 4.0 3.4 3.2 N/A 3.6 3.7<br />
Tax-supported debt (% <strong>of</strong> conso oper revenues) 23.1 24.7 26.0 27.2 23.1 23.3 24.6 40.9 27.6<br />
Standard & Poor’s | R<strong>at</strong>ingsDirect on the Global Credit Portal | February 17, 2010 4<br />
775772 | 301102431