MolExplorer
MolExplorer
MolExplorer
Create successful ePaper yourself
Turn your PDF publications into a flip-book with our unique Google optimized e-Paper software.
Lasertechnik &<br />
Werkstoffkunde<br />
HITRAN Conference 2006<br />
Terahertz Spectroscopy<br />
I. Motivation<br />
4<br />
HELMUT SCHMIDT<br />
UNIVERSITÄT<br />
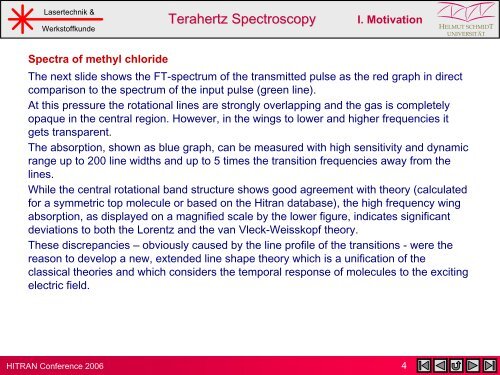
Spectra of methyl chloride<br />
The next slide shows the FT-spectrum of the transmitted pulse as the red graph in direct<br />
comparison to the spectrum of the input pulse (green line).<br />
At this pressure the rotational lines are strongly overlapping and the gas is completely<br />
opaque in the central region. However, in the wings to lower and higher frequencies it<br />
gets transparent.<br />
The absorption, shown as blue graph, can be measured with high sensitivity and dynamic<br />
range up to 200 line widths and up to 5 times the transition frequencies away from the<br />
lines.<br />
While the central rotational band structure shows good agreement with theory (calculated<br />
for a symmetric top molecule or based on the Hitran database), the high frequency wing<br />
absorption, as displayed on a magnified scale by the lower figure, indicates significant<br />
deviations to both the Lorentz and the van Vleck-Weisskopf theory.<br />
These discrepancies – obviously caused by the line profile of the transitions - were the<br />
reason to develop a new, extended line shape theory which is a unification of the<br />
classical theories and which considers the temporal response of molecules to the exciting<br />
electric field.


