MolExplorer
MolExplorer
MolExplorer

Create successful ePaper yourself
Turn your PDF publications into a flip-book with our unique Google optimized e-Paper software.
Lasertechnik &<br />
Werkstoffkunde<br />
HITRAN Conference 2006<br />
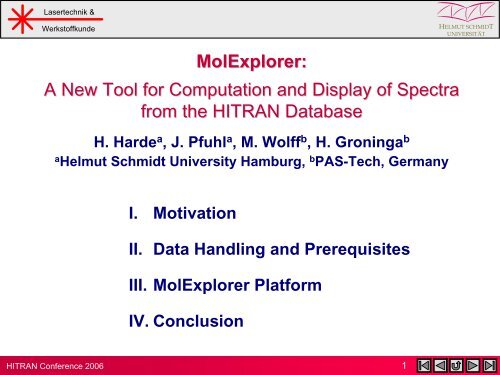
<strong>MolExplorer</strong>:<br />
<strong>MolExplorer</strong>:<br />
A New Tool for Computation and Display of Spectra<br />
from the HITRAN Database<br />
H. Harde a , J. Pfuhl a , M. Wolff b , H. Groninga b<br />
a Helmut Schmidt University Hamburg, b PAS-Tech, Germany<br />
I. Motivation<br />
II. Data Handling and Prerequisites<br />
III. <strong>MolExplorer</strong> Platform<br />
IV. Conclusion<br />
1<br />
HELMUT SCHMIDT<br />
UNIVERSITÄT
Lasertechnik &<br />
Werkstoffkunde<br />
HITRAN Conference 2006<br />
I. Motivation<br />
2<br />
HELMUT SCHMIDT<br />
UNIVERSITÄT<br />
Introduction<br />
In this talk a platform for the calculation and display of spectra is presented using the main<br />
features of the Hitran database.<br />
This platform is called <strong>MolExplorer</strong>.<br />
The talk starts with two spectroscopic examples which gave the motivation to develop<br />
such platform, then the data handling and necessary prerequisites are described, before<br />
demonstrating how the <strong>MolExplorer</strong> works and can be used.<br />
Terahertz Spectroscopy<br />
Since 1990 the Hamburg group has a close cooperation with Prof. D. Grischkowsky<br />
(Oklahoma State University) to study coherence and response phenomena in gases in the<br />
far infrared with fs THz pulses.<br />
Such input pulses are completely reshaped, attenuated and delayed when transmitting a<br />
gas cell, in this case filled with 2 atm of methyl chloride. From the Fourier transform of<br />
these pulses the absorption and dispersion of the gas is calculated over a spectral range<br />
of several THz.
Lasertechnik &<br />
Werkstoffkunde<br />
Electric Field Amplitude<br />
HITRAN Conference 2006<br />
Femtosecond Terahertz Spectroscopy I. Motivation<br />
input pulse<br />
transmitted pulse<br />
0 10 20 30 40 50<br />
Time (ps)<br />
3<br />
HELMUT SCHMIDT<br />
UNIVERSITÄT<br />
through 2 atm CH 3 Cl<br />
cell length: 22.5 cm
Lasertechnik &<br />
Werkstoffkunde<br />
HITRAN Conference 2006<br />
Terahertz Spectroscopy<br />
I. Motivation<br />
4<br />
HELMUT SCHMIDT<br />
UNIVERSITÄT<br />
Spectra of methyl chloride<br />
The next slide shows the FT-spectrum of the transmitted pulse as the red graph in direct<br />
comparison to the spectrum of the input pulse (green line).<br />
At this pressure the rotational lines are strongly overlapping and the gas is completely<br />
opaque in the central region. However, in the wings to lower and higher frequencies it<br />
gets transparent.<br />
The absorption, shown as blue graph, can be measured with high sensitivity and dynamic<br />
range up to 200 line widths and up to 5 times the transition frequencies away from the<br />
lines.<br />
While the central rotational band structure shows good agreement with theory (calculated<br />
for a symmetric top molecule or based on the Hitran database), the high frequency wing<br />
absorption, as displayed on a magnified scale by the lower figure, indicates significant<br />
deviations to both the Lorentz and the van Vleck-Weisskopf theory.<br />
These discrepancies – obviously caused by the line profile of the transitions - were the<br />
reason to develop a new, extended line shape theory which is a unification of the<br />
classical theories and which considers the temporal response of molecules to the exciting<br />
electric field.
Spectral Amplitude<br />
Lasertechnik &<br />
Werkstoffkunde<br />
0.4<br />
0.2<br />
0.0<br />
Absorption αL/2<br />
HITRAN Conference 2006<br />
Terahertz Spectroscopy<br />
Reference<br />
M easu r em en t<br />
0 1 2 3 4 5<br />
Frequency (THz)<br />
2<br />
1<br />
Absorption<br />
0<br />
1.6 2.0<br />
Frequency (THz)<br />
2.4<br />
40<br />
30<br />
20<br />
10<br />
0<br />
Absorption αL/2<br />
vVW<br />
I. Motivation<br />
measurement<br />
Lorentz<br />
5<br />
HELMUT SCHMIDT<br />
UNIVERSITÄT<br />
Molecular response theory<br />
H. Harde, A. Cheville, D. Grischkowsky<br />
Phys. Rev. Lett. 74, 1307 (1995)<br />
J. Phys. Chem. A 101, 3646 (1997)<br />
J. Opt. Soc. Am. B 14, 3282 (1997)
Lasertechnik &<br />
Werkstoffkunde<br />
HITRAN Conference 2006<br />
Photoacoustic Spectroscopy<br />
Photoacoustic spectroscopy in the NIR<br />
I. Motivation<br />
A second branch of spectroscopic investigations attends to the development of gas<br />
sensors for environmental or medical applications, based on photoacoustic spectroscopy<br />
with semiconductor lasers in the near infrared.<br />
The next slide gives an example for measuring the concentration of 13 CO 2 in the<br />
respiration of a patient. This concentration is increasing, when this person suffers from<br />
stomach ulcer and has drunk an isotope marked cocktail of urea. In the presence of the<br />
bacteria helicobacter pylori the urea is metabolized and an increasing concentration of<br />
13 CO2 is found in the breath, which is detected by means of the photoacoustic set-up.<br />
6<br />
HELMUT SCHMIDT<br />
UNIVERSITÄT<br />
CO2 measurement<br />
An example of a photo-acoustically measured spectrum - in this case 100% CO2 -is<br />
shown in slide 8. The semiconductor laser was modulated via the injection current and the<br />
wavelength was tuned by the temperature over a wavelength range of 3.8 nm.
Lasertechnik &<br />
Werkstoffkunde<br />
H. Pylori<br />
HITRAN Conference 2006<br />
13 C-Urea<br />
H 2 0<br />
13 13 C O CO2<br />
Urease + 2 NH3 NH 2<br />
Photoacoustic Spectroscopy<br />
13 CO2<br />
Lock-in<br />
I. Motivation<br />
Laser Controller<br />
7<br />
M<br />
HELMUT SCHMIDT<br />
UNIVERSITÄT<br />
SL
Lasertechnik &<br />
Werkstoffkunde<br />
Photoacoustic Signal (mV)<br />
200<br />
150<br />
100<br />
50<br />
0<br />
HITRAN Conference 2006<br />
Measurement of 100% CO 2<br />
15 20 25 30<br />
Temperature (°C)<br />
2.0413 2.0423 2.0432 2.0441 2.0451<br />
Wavelength (µm)<br />
I. Motivation<br />
8<br />
HELMUT SCHMIDT<br />
UNIVERSITÄT
Lasertechnik &<br />
Werkstoffkunde<br />
HITRAN Conference 2006<br />
II. Data Handling and Prerequisites<br />
9<br />
HELMUT SCHMIDT<br />
UNIVERSITÄT<br />
Decision<br />
For both applications the Hitran database is extremely helpful for the analysis of these<br />
data and the identification of individual spectral components. However, as everyone<br />
knows, it is a stony way to prepare the data in a manner, that one gets spectra which can<br />
directly be compared with measured data or used for simulations of the measurements.<br />
Because of the lack of adequate programs which might help to generate and plot such<br />
spectra, an own program platform was developed, which we call the <strong>MolExplorer</strong> and<br />
which runs under Windows on a standard PC. This program calculates and displays the<br />
spectra based on the Hitran database, and in the latest version also allows to directly<br />
compare these spectra with measurements.<br />
Block diagram<br />
The <strong>MolExplorer</strong> uses the Hitran04.par file, which for faster program access is stored on<br />
the hard drive of the computer. From this file an index file was generated which contains<br />
the addresses of all lines and molecules stored in the Hitran04.par file.<br />
Specifying a molecule, its isotopologue and spectral range of interest, the program<br />
contacts the index file, reads the addresses for this isotope and with this information<br />
retrieves the data from the Hitran04.par file (see next slide).<br />
To perform a calculation with these data the concentration or partial pressure of the gas, a<br />
buffer gas pressure and temperature have to be entered.<br />
The calculated spectrum is displayed on the screen, can be sent to a printer or can be<br />
stored on a separate file for treatment with an external plot program.
Lasertechnik &<br />
Werkstoffkunde<br />
molecule<br />
isotopologue<br />
spectral range<br />
HITRAN Conference 2006<br />
II. Data Handling and Prerequisites<br />
Hitran04 Index<br />
Program<br />
Hitran04.par<br />
Plot File<br />
10<br />
HELMUT SCHMIDT<br />
UNIVERSITÄT<br />
partial pressure<br />
buffer gas pressure<br />
temperature
Lasertechnik &<br />
Werkstoffkunde<br />
HITRAN Conference 2006<br />
III. <strong>MolExplorer</strong> Platform<br />
<strong>MolExplorer</strong> Platform<br />
The program platform consists of a graphical user interface and the display area.<br />
From this window all operations of the <strong>MolExplorer</strong> are controlled. The lower right part<br />
contains the input fields for the gases, the zoom control and logarithmic display function<br />
for the spectrum. At the left hand side are found all other control elements necessary for<br />
a compilation.<br />
The handling and the main features of the program are demonstrated for a quite simple<br />
example, the hydrofluoric acid.<br />
11<br />
HELMUT SCHMIDT<br />
UNIVERSITÄT<br />
Selection of the gas<br />
The control panel contains 10 fields provided to select molecules by clicking to a dropdown<br />
menu. The molecules then appear in alphabetic order and can be selected from this<br />
list. Up to 10 different gases can be activated in this way for a computation.<br />
With the choice of the molecule also the adjacent fields for the isotope and partial<br />
pressure are set to natural mixture and 1 hPa as the default parameters. In this case only<br />
one isotopologue exists, so this appears in the field.<br />
Notice: For best reproduction of the screen shots (following slides) use<br />
Full Screen for monitors with 1024x768 pixels resolution and<br />
106 % magnification for 1280x768 pixels resolution.
Lasertechnik &<br />
Werkstoffkunde<br />
HITRAN Conference 2006<br />
12<br />
HELMUT SCHMIDT<br />
UNIVERSITÄT
Lasertechnik &<br />
Werkstoffkunde<br />
HITRAN Conference 2006<br />
III. <strong>MolExplorer</strong><br />
13<br />
HELMUT SCHMIDT<br />
UNIVERSITÄT<br />
Spectral range<br />
For any calculation of a spectrum the start and stop values have to be determined. The<br />
abscissa can be chosen in wavenumbers, in frequencies or wavelengths. A click on the<br />
respective radio button opens a sub-window to key in these values.<br />
To get a survey over the spectrum the start is set to 0 and the stop to 8.000 cm-1 . A click<br />
on the Check button starts the retrieval of HF lines, and in this spectral region<br />
84 from 107 lines in the data base are found.<br />
Spectral line intensity<br />
With the display modus set to Spectral Intensity the <strong>MolExplorer</strong> displays the spectral line<br />
intensities, similar to the Hawks program.<br />
To identify also weak lines the ordinate can be changed to a logarithmic scale (see next<br />
slide) by clicking on the respective check-box. The lower red lines represent those<br />
transitions, for which the line intensities are more than 3 orders of magnitude smaller<br />
than the strongest transitions.
Lasertechnik &<br />
Werkstoffkunde<br />
HITRAN Conference 2006<br />
14<br />
HELMUT SCHMIDT<br />
UNIVERSITÄT
Lasertechnik &<br />
Werkstoffkunde<br />
HITRAN Conference 2006<br />
III. <strong>MolExplorer</strong><br />
15<br />
HELMUT SCHMIDT<br />
UNIVERSITÄT<br />
Cursor Operation<br />
To observe some part of the spectrum in more detail and at an increased resolution new<br />
start and stop values can be typed into the sub-window or the spectral interval can be<br />
pre-elected with the cursor, which is moved to the desired start position (within the<br />
graphic screen) and the left mouse button is pressed. A vertical line (magenta colour)<br />
shows up and indicates this position. The exact start wavenumber is also displayed by<br />
the cursor’s x-coordinate in the left part of the control panel. Moving the mouse to the<br />
right and marking the stop position in the same way, the spectral interval is defined.<br />
A further click to this interval activates the plot over the desired range on the magnified<br />
scale.<br />
Linear scale: In the linear modus for the y-axis the cursor display function can also be<br />
used to determine the line strength by moving the cursor to the top of a line (see next<br />
slide).
Lasertechnik &<br />
Werkstoffkunde<br />
HITRAN Conference 2006<br />
16<br />
HELMUT SCHMIDT<br />
UNIVERSITÄT
Lasertechnik &<br />
Werkstoffkunde<br />
HITRAN Conference 2006<br />
III. <strong>MolExplorer</strong><br />
Absorption Coefficient<br />
For the calculation of the absorption spectrum the pressure and temperature of the gas<br />
have to be specified, which are set to the default values (1 hPa, 296 K). And the display<br />
modus has to be changed to Absorption Coefficient.<br />
The displayed spectrum (next slide), showing the P- and R-branch of the fundamental<br />
ro-vibronic band structure, looks similar to the previous case, but is no longer a pure<br />
line spectrum, as this can be foreseen from the slightly broadened lines, which still<br />
appear quantized due to the limited pixel number of the screen.<br />
Absorption<br />
The program also displays the absorption of the gas, which is found by multiplying the<br />
absorption coefficient with the propagation length of the radiation. The path length is set<br />
in the lower window in units of cm.<br />
Transmission<br />
And the respective transmission is displayed when selecting the transmission modus.<br />
17<br />
HELMUT SCHMIDT<br />
UNIVERSITÄT
Lasertechnik &<br />
Werkstoffkunde<br />
HITRAN Conference 2006<br />
18<br />
HELMUT SCHMIDT<br />
UNIVERSITÄT
Lasertechnik &<br />
Werkstoffkunde<br />
HITRAN Conference 2006<br />
III. <strong>MolExplorer</strong><br />
19<br />
HELMUT SCHMIDT<br />
UNIVERSITÄT<br />
Line Shapes<br />
On a further magnified scale the true line shape and width of an individual transition can<br />
be identified, which under these conditions is determined by a Gaussian due to Doppler<br />
broadening. This width is about 0.01 cm-1 and is at least 5x larger than any self-pressure<br />
broadening. At 200 hPa the opposite situation is found, now collisional broadening is at<br />
least 5x larger than Doppler broadening, and the program automatically switches to a<br />
pure Lorentzian shape.<br />
For pressures somewhere between, the program uses a Voigt profile as a convolution of<br />
a Gaussian and Lorentzian (see next slide).<br />
Air broadening<br />
If HF is considered in air, in addition to the partial pressure a buffer gas pressure has to<br />
be specified. It accounts for the surrounding air pressure with a default value of 1013<br />
hPa.<br />
Now, besides Doppler and self-pressure broadening also foreign gas broadening exists<br />
and is automatically included in the calculation.<br />
Concentration<br />
Sometimes it may be advantageous not to specify the partial pressure, but the<br />
concentration of the gas. The display is converted to ppm by clicking on the respective<br />
radio button. This option is favourably used when small pollutions in the atmosphere or<br />
in another buffer gas are considered.
Lasertechnik &<br />
Werkstoffkunde<br />
HITRAN Conference 2006<br />
20<br />
HELMUT SCHMIDT<br />
UNIVERSITÄT
Lasertechnik &<br />
Werkstoffkunde<br />
Marker function<br />
HITRAN Conference 2006<br />
III. <strong>MolExplorer</strong><br />
21<br />
HELMUT SCHMIDT<br />
UNIVERSITÄT<br />
Under regular atmospheric conditions the HF molecule interferes with spectra of other<br />
pollutants in the atmosphere. At least water vapor with a typical partial pressure in air of<br />
about 5 hPa (or 5000 ppm) has to be examined on its superposition with HF lines. To<br />
restrict the retrieval to the most prominent isotopologue 161, only this isotope is selected<br />
from the drop down menu. For the spectral range 0 – 8000 cm-1 more than 20.000 water<br />
lines of this isotope are identified.<br />
Already at this concentration and more than ever at lower HF concentrations it is hard to<br />
identify the different species. Therefore, a marker function can be activated, which is<br />
extremely helpful to distinguish between different gases or isotopes.<br />
Each line position is indicated by a marker which carries the colour of the respective<br />
gas, and the marker length (or height) is identical with the maximum absorption of an<br />
individual line – slightly dependent on the line shape function.
Lasertechnik &<br />
Werkstoffkunde<br />
HITRAN Conference 2006<br />
22<br />
HELMUT SCHMIDT<br />
UNIVERSITÄT
Lasertechnik &<br />
Werkstoffkunde<br />
Line positions<br />
HITRAN Conference 2006<br />
III. <strong>MolExplorer</strong><br />
A further display modus, called Line Positions, shows a pure line spectrum, identical<br />
with the marker function. This is quite helpful to get a rapid survey over the spectrum.<br />
Similar to the spectral line intensities each line position reflects the transition frequency,<br />
but the line height directly represents the maximum absorption coefficient at the center<br />
of the transition in [cm-1 ].<br />
The next figure displays the P- and R-branch of the fundamental ro-vibronic HF<br />
structure together with the interfering water lines in this modus.<br />
23<br />
HELMUT SCHMIDT<br />
UNIVERSITÄT
Lasertechnik &<br />
Werkstoffkunde<br />
HITRAN Conference 2006<br />
24<br />
HELMUT SCHMIDT<br />
UNIVERSITÄT
Lasertechnik &<br />
Werkstoffkunde<br />
Line Parameter<br />
HITRAN Conference 2006<br />
III. <strong>MolExplorer</strong><br />
While the two gases can well be distinguished by the coloured markers, it may be of<br />
interest to get more specific information on an individual line.<br />
This is easily accomplished by moving the cursor to the desired line and marking it by a<br />
double click with the left mouse button. Then a vertical line appears for 1 s and<br />
indicates, which line was marked and identified, before the graphic screen changes to a<br />
white field, in which all data stored in the HITRAN04 database of this line are listed.<br />
25<br />
HELMUT SCHMIDT<br />
UNIVERSITÄT
Lasertechnik &<br />
Werkstoffkunde<br />
HITRAN Conference 2006<br />
26<br />
HELMUT SCHMIDT<br />
UNIVERSITÄT
Lasertechnik &<br />
Werkstoffkunde<br />
Parameter Files<br />
HITRAN Conference 2006<br />
III. <strong>MolExplorer</strong><br />
The parameters used to calculate a spectrum can be stored on a parameter file, which<br />
contains all necessary information like the molecules, isotope choice, the partial and<br />
buffer gas pressure, or the spectral range and the display modus. A click on the button<br />
Write Parfile opens a sub-window, and allows to save this file.<br />
This or any other parameter set can be called for further checks or recurring use, when<br />
clicking on the button Read Parfile.<br />
Printer<br />
For fast inspection or preliminary documentation the spectrum as viewed on the monitor<br />
can be printed on a standard printer. Before starting the print it can be checked by the<br />
Page View function. In addition to the spectrum the most important data used for the<br />
calculation are listed.<br />
27<br />
HELMUT SCHMIDT<br />
UNIVERSITÄT<br />
Data Export<br />
For high quality data representation the spectrum may be stored on a file, which then is<br />
further processed by an external plot program. This file may consist of up to 32768 data<br />
points and can be automatically processed, e.g., by a table calculation program like Xact<br />
or Excel (see next slide) for the graphic representation of the data.
Lasertechnik &<br />
Werkstoffkunde<br />
HITRAN Conference 2006<br />
28<br />
HELMUT SCHMIDT<br />
UNIVERSITÄT
Lasertechnik &<br />
Werkstoffkunde<br />
CO 2 breath test<br />
HITRAN Conference 2006<br />
Analysis of PAS-Measurement<br />
PAS Measurement<br />
III. <strong>MolExplorer</strong><br />
Having demonstrated the most important features of the <strong>MolExplorer</strong>, this program is<br />
applied to analyse the earlier shown CO 2 -measurement.<br />
For the 13 CO 2 breath test it is necessary to measure small changes in the concentration<br />
of this isotopologue of the order of a few thousandths and this in relation to the overall<br />
concentration of CO 2 , which in the respiration is about 4.5%.<br />
An interesting spectral range for such type of measurement is the NIR at 2 µm, where<br />
semiconductor lasers with sufficient output power and good beam quality are available.<br />
To identify the 13 CO 2 lines in the spectrum, it is advantageous to select and calculate the<br />
spectrum for the most frequent isotopes individually, together with water vapor.<br />
29<br />
HELMUT SCHMIDT<br />
UNIVERSITÄT<br />
As long as the natural mixture of a gas is used, the specified pressure represents the<br />
sum over all isotopologues of the molecule, weighted with their natural abundances. In<br />
the case of individual isotopes it represents the partial pressure. To compute this<br />
pressure in relation to the abundance, the button NA (next to the pressure entrance field)<br />
has to be pressed and the pressure is multiplied by the abundance of this isotope.<br />
The next slide shows the CO 2 -band structure together with water from 1.9 – 2.1 µm. The<br />
weaker 636-lines (red) are laying in a spectral range, where the 626-lines are almost<br />
vanishing or have comparable strength, while water is almost negligible.
Lasertechnik &<br />
Werkstoffkunde<br />
HITRAN Conference 2006<br />
30<br />
HELMUT SCHMIDT<br />
UNIVERSITÄT
Lasertechnik &<br />
Werkstoffkunde<br />
Comparison with measurement<br />
HITRAN Conference 2006<br />
Analysis of PAS-Measurement<br />
PAS Measurement III. <strong>MolExplorer</strong><br />
31<br />
HELMUT SCHMIDT<br />
UNIVERSITÄT<br />
Further magnification of this spectral range indeed indicates that this is an interesting<br />
range to measure the 636-concentration and to use the 626-isotope as a reference.<br />
The latest version of the <strong>MolExplorer</strong> allows a direct comparison of a measurement with<br />
a calculated spectrum.<br />
The next slide shows the photoacoustic CO2 measurement as red graph together with<br />
the simulated spectrum (white line).<br />
In this way any discrepancies in the line position, the shape, width, intensity or missing<br />
features are easily identified.<br />
The photoacoustic measurement deviates in the observed peak intensities, while the line<br />
positions are in excellent agreement with the calculated absorption spectrum. The<br />
intensity variations may be explained by a transition dependent energy transfer to<br />
generate an acoustic wave, when part of the excitation energy is converted into internal<br />
degrees of freedom.<br />
This example demonstrates how beneficial the database can be used for the<br />
interpretation of a measured spectrum and the identification of individual isotopic lines.
Lasertechnik &<br />
Werkstoffkunde<br />
HITRAN Conference 2006<br />
32<br />
HELMUT SCHMIDT<br />
UNIVERSITÄT
Lasertechnik &<br />
Werkstoffkunde<br />
Line shape investigations in the THz range<br />
HITRAN Conference 2006<br />
Line Shape Investigations III. <strong>MolExplorer</strong><br />
33<br />
HELMUT SCHMIDT<br />
UNIVERSITÄT<br />
In the mm- and THz-range the line width of a transition caused by collisions can be<br />
comparable to the transition frequency of a line. Then the line shape can no longer be<br />
described by a standard Lorentzian, but is much better approximated by a shape derived<br />
from molecular response theory (see slide 5). This theory introduces a finite time, the<br />
response time, which molecules require to come into thermal equilibrium with an external<br />
field in the presence of molecular collisions. It is a unification of the classical collision<br />
theories of Lorentz and van Vleck-Weisskopf, where the response time τC acts as a<br />
control parameter, which for large values (typically > 10 ps) already well reproduces a<br />
Lorentzian and for τC = 0 gives a van Vleck-Weisskopf line shape.<br />
A click on the check box Response Time activates the generalized line shape calculation.<br />
The next slide shows two calculated spectra of methyl chloride which simulate the<br />
measurement of slide 5 applying a response time of 10 ps (blue curve) and τC = 0 (white<br />
graph). The markers indicate the line positions and strengths of the two isotopologues.<br />
At 10 ps or more the response of the molecules is already too slow to follow any faster<br />
oscillations on this scale, and a pure Lorentzian is approximated with the response theory.<br />
An infinitely fast response is given for τC = 0 , which represents the v.Vleck-Weisskopf<br />
case. Comparison with the Lorentzian shows significantly higher absorption in the high<br />
frequency wings of the rotational lines.
Lasertechnik &<br />
Werkstoffkunde<br />
HITRAN Conference 2006<br />
τ C = 0<br />
τ C = 10 ps<br />
34<br />
HELMUT SCHMIDT<br />
UNIVERSITÄT
Lasertechnik &<br />
Werkstoffkunde<br />
Fit to methyl chloride measurement<br />
HITRAN Conference 2006<br />
Line Shape Investigations III. <strong>MolExplorer</strong><br />
35<br />
HELMUT SCHMIDT<br />
UNIVERSITÄT<br />
A fit of the simulated spectrum to the measurement then allows to determine the<br />
response time. More distinctly is this wing absorption observed in transmission.<br />
The following slide shows the measured transmittance as the red graph and the<br />
calculation (white curve) for τC = 400 fs. Additionally depicted is the van Vleck-Weisskopf<br />
case (τC = 0) as the blue graph. The red and green lines again represent the line<br />
positions and strengths of the two isotopologues.<br />
Spikes at very low frequencies in the measured data are caused by the very weak and<br />
noisy THz signal at these frequencies.<br />
Since in THz spectroscopy electric field amplitudes and not intensities are measured, the<br />
calculated transmission has to be corrected by a factor of one half. Therefore the real<br />
path length was divided by two.<br />
This example again demonstrates, how the Hitran database together with the new tool,<br />
the <strong>MolExplorer</strong>, can favourably be applied for the interpretation and understanding of<br />
complex spectral data.
Lasertechnik &<br />
Werkstoffkunde<br />
HITRAN Conference 2006<br />
τ C = 400 fs<br />
measurement<br />
τ C = 0<br />
36<br />
HELMUT SCHMIDT<br />
UNIVERSITÄT
Lasertechnik &<br />
Werkstoffkunde<br />
HITRAN Conference 2006<br />
IV. Conclusion<br />
• New tool for calculation and display of spectra from the HITRAN<br />
database<br />
• Allows plots over a wide spectral range as well as with highest<br />
resolution for all relevant gases in the atmosphere<br />
• Different gases or isotopologues can be distinguished by colored<br />
markers<br />
• Five display modes: spectral line intensity, line position with the peak<br />
absorption coefficient, absorption, absorption coefficient and<br />
transmission<br />
• Automatic choice of the line profile, dependent on the broadening<br />
mechanism<br />
• Direct comparison and fit to measurements<br />
• Line shape investigations based on the molecular response theory<br />
37<br />
HELMUT SCHMIDT<br />
UNIVERSITÄT
Lasertechnik &<br />
Werkstoffkunde<br />
Persons interested in the <strong>MolExplorer</strong> may contact<br />
Hermann Harde<br />
Helmut Schmidt Universität<br />
Holstenhofweg 85, 22043 Hamburg, Germany<br />
Email: harde@hsu-hh.de<br />
or<br />
PAS-Tech GmbH<br />
HITRAN Conference 2006<br />
IV. Conclusion<br />
Bahnhofstrasse 3, 19246 Zarrentin, Germany<br />
Email: molexplorer@pas-tech.com<br />
38<br />
HELMUT SCHMIDT<br />
UNIVERSITÄT