THAILAND HUMAN DEVELOPMENT REPORT 2003
THAILAND HUMAN DEVELOPMENT REPORT 2003
THAILAND HUMAN DEVELOPMENT REPORT 2003

Create successful ePaper yourself
Turn your PDF publications into a flip-book with our unique Google optimized e-Paper software.
<strong>THAILAND</strong><br />
<strong>HUMAN</strong><br />
<strong>DEVELOPMENT</strong><br />
<strong>REPORT</strong> <strong>2003</strong><br />
��<br />
��
<strong>THAILAND</strong> <strong>HUMAN</strong> <strong>DEVELOPMENT</strong> <strong>REPORT</strong> <strong>2003</strong>
<strong>THAILAND</strong><br />
<strong>HUMAN</strong><br />
<strong>DEVELOPMENT</strong><br />
<strong>REPORT</strong> <strong>2003</strong><br />
United Nations Development Programme
ii<br />
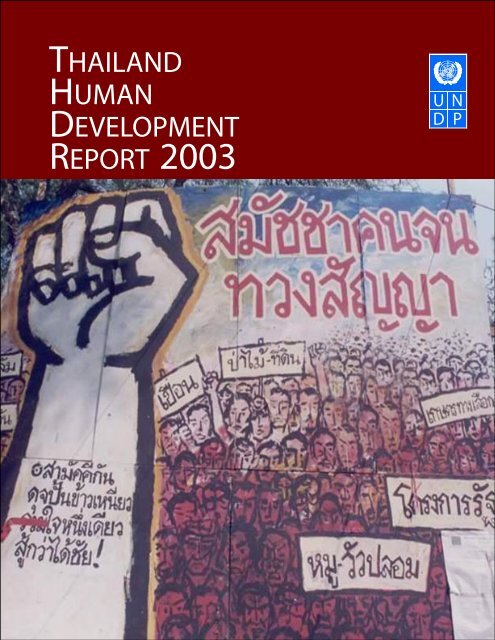
The cover photo shows a huge stage poster of the Assembly of the Poor (AOP)’s rally in<br />
front of the Government House that says “Assembly of the Poor follows up on the<br />
(Government’s) promises”. On the wrist is written “United like sticky rice, together as<br />
one for the victory”. The placards mention various problems and issues that AOP have<br />
campaigned for or against, e.g. dams, forest-land, alternative agriculture, state’s<br />
projects, fake pigs-cows.<br />
Photo credit: Friends of the People (FOP)<br />
��<br />
� �<br />
Copyright © <strong>2003</strong><br />
United Nations Development Programme<br />
Rajdamnern Nok Avenue<br />
Bangkok 10200<br />
Thailand<br />
Tel: (66-2) 2882130<br />
Fax: (66-2) 2800556<br />
E-mail: registry.th@undp.org<br />
Web site: www.undp.or.th<br />
ISBN: 974-91116-5-6<br />
<strong>THAILAND</strong> <strong>HUMAN</strong> <strong>DEVELOPMENT</strong> <strong>REPORT</strong> <strong>2003</strong>
His Excellency Thaksin Shinawatra<br />
Prime Minister of Thailand<br />
It is my pleasure and honour to introduce the second UNDP National Human Development<br />
Report of Thailand.<br />
At the beginning of the new millennium, all nations are eager to focus on poverty<br />
alleviation in its broadest sense, not just from an economic and technical perspective as<br />
tended to be the case during most of the 20 th century. UNDP’s focus on “human<br />
development” provides an excellent framework for this broader approach and matches<br />
well with Thailand’s own “people-centred approach” to development.<br />
Globalization has tended to divert attention from this broader perspective, focusing too<br />
often exclusively on economic growth and its attendant opportunities. While such<br />
employment creation is indispensable to poverty reduction, it is not sufficient in itself.<br />
Yes, it provides opportunities but it also threatens traditional values. As a result, local<br />
communities feel a compelling need to balance these global forces with greater control<br />
over their lives, seeking inner strength through community empowerment.<br />
In Thailand, itself engaged in a powerful process of democratization, this dialectic –<br />
between the global and the local – has been steadily growing, especially in the past two<br />
decades. We understand the need to reconcile these sometimes-conflicting forces, and<br />
the deeply felt need of people to assert their own interests and values. We know that<br />
values and wisdom of all sorts exist in the Thai community and that these must be<br />
harnessed for the greater benefit of our society.<br />
The challenge is how best to accomplish this and I believe that this report provides many<br />
useful insights. It is clear that community empowerment in Thailand means evolving<br />
an entirely new enabling environment for rights and accountability, indeed, a whole new<br />
way of thinking. “The challenges of today’s problems, and tomorrow’s cannot be met with<br />
yesterday’s solutions, suitable as they may have been to yesterday’s problems.” This kind of<br />
development is long-term work to which the Thai government is actively committed,<br />
inspired by His Majesty the King’s advice on self-reliance and sufficiency economy.<br />
I have no doubt that many organizations will be moved and inspired by this particular<br />
Report. I believe it will assist understanding of the issue and create an opportunity for us<br />
all to support and promote community empowerment both as a means to, and as an end<br />
of human development.<br />
FOREWORD FROM THE PRIME MINISTER<br />
FOREWORD<br />
(Thaksin Shinawatra)<br />
Prime Minister of Thailand<br />
iii
iv<br />
PREFACE<br />
Dr. Sippanondha Ketudat<br />
Former Chairperson, the National Economic and Social Development Board<br />
Chairperson, Thailand Human Development Report <strong>2003</strong> Review Board<br />
I was honoured and delighted to have the privilege of serving as Chairperson of the<br />
Thailand Human Development Report for the second time.<br />
Like all sequels, the challenge of the second issue is to be at least as good, if not better,<br />
than the first. The task is therefore not easier, but more difficult. But I must say that the<br />
difficulty in producing this Report far exceeded my expectation.<br />
This, I hope, says something about this Report. It is a product of much expectation<br />
exasperation, hard work, long-hours of debate, zigged-zagged and patchy progress,<br />
play-by-ear plans, several revisions, contention and compromise. In many ways, it reflects<br />
the state of play in community empowerment as well as other developments in Thailand<br />
right now.<br />
As Chairperson of the Review Board, I shared the stewardship of this Report by<br />
negotiating and balancing among different viewpoints, while ensuring that the Report<br />
can fairly represents community empowerment in Thailand.<br />
As a Thai citizen who has served in the academic, public, private, and civil society sectors,<br />
I actively shared my ideas and experiences, and was heartened to observe that, while<br />
there were many points of divergence both at the philosophical and practical levels, some<br />
fundamentals have been unequivocally established, at least among the diverse groups<br />
engaged in the drafting process.<br />
Among these fundamentals is the general agreement that the changing complexities and<br />
needs of our society far exceed the skills and capacity of any government, and that the<br />
solutions often lie where the source of the problems were thought to lie – i.e. the people,<br />
especially rural communities.<br />
These people, in spite of poverty and deprivation, have demonstrated that they have the<br />
capacity to overcome adversities, especially structural and institutional barriers; to stand<br />
on their own; to challenge the conventional practice with their local wisdom; and to<br />
extend a helping hand to their peers.<br />
It is a revelation that is crucially important to the future of this country. It is my hope that<br />
the UNDP Report contributes to this empowering process by echoing different perceptions,<br />
ideas, stories, suggestions, and sharing them widely within and outside the country.<br />
Finally, I hope that the Thailand Human Development Report <strong>2003</strong> will be read, discussed,<br />
challenged and enjoyed by all, including the communities – some of whom have<br />
contributed their valuable time in making it possible.<br />
Dr. Sippanondha Ketudat<br />
<strong>THAILAND</strong> <strong>HUMAN</strong> <strong>DEVELOPMENT</strong> <strong>REPORT</strong> <strong>2003</strong>
Mr. J.K. Robert England<br />
Resident Coordinator, United Nations System in Thailand<br />
Resident Representative, United Nations Development Programme, Thailand<br />
This is the second time that the UNDP is releasing a Thailand Human Development Report.<br />
This second Thailand Report joins a diverse family of such reports worldwide – prepared at<br />
the national, sub-national and regional levels – which complement our global flagship<br />
publication. Each such report seeks to throw light upon a particular dimension of<br />
development, as seen from the vantage point of human – or people-centred-development.<br />
UNDP has been supporting Thailand’s development efforts since 1955, almost five<br />
decades of close and productive partnership. As elsewhere, our work always has as its<br />
primary goal the promotion of sustainable human development of the sort that springs<br />
from national priorities and is shaped by the special circumstances and local needs of<br />
Thailand itself. We are fortunate in that Thailand is widely regarded as a remarkable<br />
development success story, and we hope our work has contributed in a modest way to<br />
this success. Certainly, we ourselves have benefited immensely from the many lessons<br />
learned through pioneering development initiatives undertaken by public, private, and<br />
community organizations in this vibrant country.<br />
Thailand is a fertile and exciting ground for community empowerment experiences, an<br />
important dimension of the development process in many countries. In this country, the<br />
government, the private sector, academia and the communities themselves have all been<br />
actively involved in this dynamic process. They have variously engaged in studies and<br />
research, piloting exercises, comparing experiences, discovering best practices, learning<br />
and re-learning the meaning of community and community empowerment, documenting<br />
and sharing knowledge, institutionalizing changes to facilitate community empowerment.<br />
It was for this reason that UNDP Thailand decided two years ago to make “community<br />
empowerment” the focus of the second Thailand Human Development Report. In doing<br />
so, we decided to follow the cardinal rule of community empowerment: “the process is as<br />
important as the result”. The process of making a community empowerment report<br />
should also be empowering for the communities. Put another way, a report about this<br />
subject would be hollow if it were not founded on the views and experiences of<br />
communities themselves.<br />
In the making of this Report, UNDP Thailand therefore provided a continuous forum for<br />
an active exchange of ideas and experiences. Contributors ranged from policy-makers,<br />
public officials, civil society leaders, academics, non-governmental development workers,<br />
and last but not least, community leaders from various regions.<br />
It was a difficult, but very enriching experience. We were impressed by the diversity of<br />
ideas; the breath and depth of the debate; the spiritual and cultural underpinning of<br />
the Thai experience; and the passionate account of bitter but inspirational struggles for<br />
self-empowerment of community leaders over the last several decades. If the process of<br />
preparing this Report was an especially challenging experience, it was precisely because<br />
there is so much energy in the community empowerment sub-culture of Thailand.<br />
We hope this is captured in the Report itself.<br />
PREFACE FROM MR. J.K. ROBERT ENGLAND<br />
PREFACE<br />
v
vi<br />
Community empowerment through the making of the<br />
Community Empowerment Report<br />
Community empowerment through the making of this Report took place through:<br />
The participation of 4 community leaders not only in the preparation of Chapter 1 but<br />
also in the regular meetings of the Review Board.<br />
Community’s ownership of chapter 1 “The Communities’ View”. This chapter presents<br />
community voices echoed through regional community forums, dialogues recorded and<br />
transcribed and compiled by regional coordinators and advisors, and communities’ own<br />
writings.<br />
Review of other chapters at the regional community forums.<br />
Participation of 2 community leaders in editorial meetings.<br />
The Report’s editing style that places the community’s view at the heart of the Report,<br />
and aligns other chapters around it.<br />
While so much has been accomplished in this area, the challenge is still formidable. One of<br />
the most important challenges is to negotiate between the force of globalization and<br />
localization, and to ensure that the communities have viable options and the capacity to<br />
exercise them in this increasingly globalized world. This should certainly not be seen as<br />
necessarily in conflict: the communities themselves clearly wished to participate in and<br />
benefit from the economic opportunities that globalization can foster. However, they do<br />
not wish their own culture and priorities to be swept aside in the process.<br />
Another important challenge is that of decentralization. This dramatic shift in political<br />
power in Thailand, hastened by and largely on course since the 1997 Constitution,<br />
represents another critical opportunity and challenge for community empowerment. If<br />
carried out effectively, it will move the locus of decision-making as well as accountability<br />
closer to the communities wherever possible, thus balancing the often impersonal forces<br />
of globalization. However, such a change needs careful management and capacity<br />
enabling/building at the local level, if it is not to fall short of expectations and risk<br />
consequent reversal.<br />
But, I think the communities should be permitted to speak for themselves in this Report,<br />
and in the Kingdom. And I hope that this Report illuminates this dimension of development<br />
and contributes to a broad discussion on this score.<br />
Mr. J.K. Robert England<br />
<strong>THAILAND</strong> <strong>HUMAN</strong> <strong>DEVELOPMENT</strong> <strong>REPORT</strong> <strong>2003</strong>
ACKNOWLEDGEMENTS<br />
UNDP Thailand wishes to convey its profound gratitude to a number of individuals and<br />
institutions for making their valuable contribution to this Report.<br />
First and foremost, UNDP is indebted to Dr. Sippanondha Ketudat, Chairperson of the<br />
Review Board, who chaired 8 review board meetings, joined several consultative sessions<br />
in Bangkok and upcountry, reviewed and provided valuable comments on the various<br />
drafts. Through his initiative and strong support, the drafting process became an<br />
empowering experience for all involved.<br />
UNDP also wishes to thank NESDB for its interest and enthusiastic collaboration in this<br />
exploration of community empowerment, as well as its engagement in the preparation of<br />
the Human Achievement Index (HAI) as a public policy instrument.<br />
The Review Board itself was an active and engaged group of individuals and institutes.<br />
A full list of the Board’s membership follows these individual acknowledgements. At the<br />
meetings, the most prominent were the community representatives and their advisors,<br />
namely Khun Johni Odochao, Khun Jaidee Sawangarom, Khun Pranee Noanchan, Khun Viboon<br />
Khemchalerm, MR. Dr. Akin Rabibhadana, Dr. Chayan Vaddhanaphuti, Dr. Ken Kampe and Khun<br />
Nisakorn Rabibhadana. This team was responsible for enriching the discussion by bringing<br />
stories, voices, poems, lyrics and songs from communities in the four regions to the Report,<br />
and the Review Board.<br />
Among the most hard-working and hardest-hit were the contributors to the various<br />
chapters and the draft translation namely Dr. Chartchai Na Chiangmai, Dr. Kanitta<br />
Kanjanarangsrinon and Khun Weeraboon Wisartsakul, Dr. Apichai Puntasen and Dr.<br />
Patamawadee Pochanukul Suzuki, Khun Sunantha Natenuj, and Dr. Chanida C. Bamford. They<br />
produced draft after draft for review and comments, and endured the creative tensions<br />
with grace and good spirit.<br />
Efforts of various contributors would have gone to waste had it not been for the ingenuity<br />
of the principal editor – Dr. Chris Baker – who gave real meaning to the saying “the whole<br />
is larger than the sum of its parts”. He was the main architect of the structure, style and<br />
analysis of the report. Credit also goes to contributing editors, namely Dr. Jafar Javan<br />
and Dr. Apichai Puntasen, as well as Khun Pranee and Khun Jaidee – two community<br />
representatives who participated in the editorial meetings.<br />
The Report also benefits considerably from top-notched expertise around the world.<br />
Prof. Robert Chambers gave valuable comments on the participatory drafting process.<br />
Dr. Charles Myers provided technical overview of the HAI. Mr. Marc-Andre Franche provided<br />
feedbacks in the initial phase, while Ms. Saraswathi Memon, Ms. Sarah Burd-Sharps and<br />
Ms. Cherie Hart volunteered comments to the near-final draft.<br />
Last but not least, credit is due to many UNDP Thailand staff, who contributed to the process,<br />
including Khun Punnipa Ruangtorsak, Khun Walaitat Worakul, Dr. Ampai Harakunarak, Khun<br />
Tongta Temboonkiat, Khun Sirisupa Kulthanan and Mr. Håkan Björkman. However, special<br />
thanks should go to Mr. Alvaro Rodriguez who provided support and guidance throughout<br />
and to Khun Parichart Siwaraksa, who not only contributed greatly to the substance of the<br />
Report but managed the process through 30 turbulent and argumentative months, during<br />
which she never lost her cool or her belief in the value of the end product.<br />
ACKNOWLEDGEMENTS vii
viii<br />
Institutions:<br />
Institutions, individuals and community representatives<br />
on the Review Board<br />
Office of the National Economic and Social Development Board (represented by Khun Boonyong<br />
Vechamesri, Khun Komol Chobchuenchom, Dr. Witit Rachatatanun, Khun Suwanee Khamman, Khun<br />
Waranya Teokul, Khun Suladda Sirilerkpipat, Khun Aratip Archaviboonyobol, Dr. Priyanut Piboolsrawut,<br />
Khun Chitti Chuenyong, Khun Somsri Luangmanirut, Khun Araya Ma-In, Khun Phichai Likitvarakul, Khun<br />
Suchart Jaturongchaisatit, Khun Nipa Kittiruangchan, Khun Thammarong Jaratdamrongwat, Khun<br />
Artisuda Nanakorn, Khun Nareeta Supradist)<br />
National Statistical Office (represented by Khun Eaimchan Premyothin, Khun Chintana Pejaranonda,<br />
Dr. Rossarin Gray, Khun Preeya Mithranon, Khun Neramit Dhanasakdi)<br />
Ministry of Interior (represented by Khun Chachaval Kittinophadol, Khun Siwa Sirisoawaluk)<br />
Department of Local Administration (repesented by Khun Anan Chaiyasak)<br />
Community Development Department (represented by Khun Chadej Insawang, Khun Weera<br />
Kongkaeow, Dr. Chamnan Wattanasiri, Khun Pranee Ratanawan)<br />
Ministry of Agriculture and Cooperatives (represented by Dr. Amphon Kittamphon, Khun Apakakorn<br />
Chandarasrivongs, Khun Kongtat Janchai, Khun Ramarin Dissarapong)<br />
UNICEF (represented by Mr. Gamini Abeysekera, Dr. Sauwalak Kittiprapas)<br />
UNFPA (represented by Dr. Sheila Macrae, Dr. Pornchai Suchitta)<br />
Individuals:<br />
Khun Paiboon Wattanasiritham (Community Organizations Development Institute)<br />
Dr. Chuachan Chongsatityoo (National Education Reform Office)<br />
Dr. Vicharn Panich (Thailand Research Fund)<br />
Dr. Amara Pongsapich (Social Research Institute, Chulalongkorn University)<br />
Dr. Seri Pongpit (Village Foundation)<br />
Dr. Sa-nguan Nittayaramphong (Local Development Institute)<br />
Dr. Niphon Puapongsakorn (Thailand Development Research Institute)<br />
Dr. Pawadee Tongu-thai (Thammasat University)<br />
Dr. Chartchai Na Chiangmai (National Institute of Development Administration)<br />
Dr. Silaporn Buasai (Thailand Research Fund)<br />
Dr. Tossaporn Sirisamphand (King Prajadhipok’s Institute)<br />
Dr. Sittinat Praputnitisan (Chiangmai University)<br />
Community representatives and advisors:<br />
Khun Johni Odochao (from the North)<br />
Khun Jaidee Sawang-arom (from the South)<br />
Khun Pranee Noanchan (from the Northeast)<br />
Khun Viboon Khemchalerm (from the Central Plain)<br />
MR. Dr. Akin Rabibhadana<br />
Dr. Chayan Vaddhanaphuti<br />
Dr. Ken Kampe<br />
Khun Nisakorn Rabibhadana<br />
<strong>THAILAND</strong> <strong>HUMAN</strong> <strong>DEVELOPMENT</strong> <strong>REPORT</strong> <strong>2003</strong>
x<br />
Empowerment is<br />
both a means and<br />
an end of human<br />
development.<br />
OVERVIEW<br />
THE POWER OF EMPOWERMENT<br />
Human development is about improving people’s lives. It means more than increasing<br />
incomes or national wealth. It aims to expand the capability of people to live long,<br />
healthy and creative lives, to acquire knowledge, to have access to the resources needed<br />
for a decent standard of living, and to enjoy dignity, self-respect, and the respect of<br />
others.<br />
Many people in the world deserve better lives than they live today. Few would disagree<br />
with that. But suppose we change the statement a little. Many people have the right to<br />
better lives than they live today. That’s a much more powerful idea. It’s the result of<br />
joining together the idea of human development and the commitment to human rights.<br />
As the Human Development Report 2000 stated: “Human rights express the bold idea that all<br />
people have claims to social arrangements that protect them from the worst abuses and<br />
deprivations – and that secure the freedom for a life of dignity”. This approach makes<br />
development into a right which people can claim, rather than a gift bestowed by others.<br />
It’s an idea which empowers people to claim the right to development. That is why the<br />
thematic section of this Thailand Human Development Report is about empowerment.<br />
There’s a second reason. We assume we know what a “better life” means – higher<br />
income, greater security, better health, longer lives, fuller knowledge. The Human Development<br />
Indices in Part II of this Report measure how well these goals are being<br />
achieved. But in reality each person or each group of people has a perception of what<br />
a “better life” means. This perception may change over time. So the first step in<br />
What is Community and What Communities?<br />
Community is experience, feeling, relationships. It is not defined by<br />
geography or by official rules. It is something which people feel they<br />
belong to. It is a network of relationships. It can be big or small. It can<br />
change over time. It can strengthen or decay.<br />
Each community is unique. Some may be very egalitarian. Others not.<br />
Some may work by consensus. Others not. Some may be dominated by<br />
“influential” people. Others not. The variety is huge and defies generalization.<br />
The community stories which appear in the following chapters come mostly<br />
from villages and provincial towns. This reflects Thailand’s demography.<br />
The capital is the country’s only large city, and three-quarters of people live<br />
in the villages and provincial towns. But it is also a deliberate choice.<br />
There are also important urban communities but their characteristics, their<br />
problems, their organizational networks, and their relationships with<br />
government are rather different. They deserve separate treatment. This<br />
Report focuses on the communities of the rural area and provincial towns.<br />
empowerment is letting people determine<br />
their own development goals. Empowerment<br />
is both a means and an end of<br />
human development.<br />
Part II of this Report contains maps and<br />
tables showing some key indicators of<br />
human development in Thailand. The<br />
Human Achievement Index (HAI) is a<br />
summary of all these measures. It has a<br />
striking pattern. The provinces with the<br />
highest scores are mostly grouped close<br />
to the capital city of Bangkok. Those with<br />
the lowest scores are mostly along the<br />
borders, at the farthest distance from the<br />
capital. The pattern is far from exact and<br />
uniform. But it tells a story. In the past,<br />
power has been very centralized in the<br />
national capital. The progress of human<br />
development has tended to reflect the<br />
pattern of power. The empowerment of<br />
people is a way to reverse this trend.<br />
<strong>THAILAND</strong> <strong>HUMAN</strong> <strong>DEVELOPMENT</strong> <strong>REPORT</strong> <strong>2003</strong>
But why community empowerment? On a world scale, globalization has increased<br />
inequities – of livelihood, access to power, access to resources, and ability to maintain<br />
stocks of social and cultural capital. This has the effect of eroding the fruit of the state’s<br />
policies to advance the goals of human development. As a result, communities everywhere<br />
have looked more to their inner strengths in order to negotiate their own<br />
accommodation with the forces of globalization. Demands for community rights have<br />
increased – especially over natural resources. And governments, development workers,<br />
and international agencies have increasingly looked to communities to replace or supplement<br />
the work of government bureaucracies. Community empowerment is emerging<br />
both from the bottom up, and the top down.<br />
The demand for grassroots development in many parts of the world has been made on<br />
behalf of communities. One place where this demand has been heard loudly and long is<br />
Thailand.<br />
<strong>THAILAND</strong> AND COMMUNITY<br />
In Thailand over the last two decades, the role of the community has become an<br />
important part of both social theory and development work. At least three different sets<br />
of actors have contributed to this trend. First and foremost, local communities themselves<br />
have led the way. In some cases they have realized their own potential to create<br />
new forms of social, economic, and human capital in the locality. In other cases, they<br />
have demanded shifts in the power structure to allow themselves greater control over<br />
natural and human resources. Second, a growing number of NGOs, development workers,<br />
social activists, and academics have given support and assistance to projects to<br />
strengthen communities in a variety of different ways. Third, several government<br />
departments, donors, businesses, and international development agencies have promoted<br />
community-based schemes. This trend has accelerated since the 1997 economic crisis.<br />
In the view of Thailand’s community activists, the community is much more than an<br />
institution which can help deliver development. Rather the community itself embodies<br />
social values which contribute to the well-being which is the goal of human development.<br />
In particular, communities provide a link to tradition and culture; they facilitate<br />
participation; and they foster close social relations which are the basis for providing social<br />
protection.<br />
This is captured by two of the maps in Part II. Map 6 shows that family and community<br />
life is weakest in the relatively developed areas in and around the national capital, and<br />
strongest in some of the poorer areas in the periphery. Community participation in Map<br />
8 shows a similar pattern (though with different regional variation). These maps suggest<br />
how building and maintaining strong communities is one strategy through which people<br />
combat the bias of centralization. The cases presented in chapter 1 show how this is<br />
being done.<br />
But communities are not isolated. They are part of a broader economy and society, and<br />
subject to the authority of government at different levels. They cannot provide all their<br />
own needs, and hence have an interest in how decisions are made on the public goods<br />
which they require. In the past, such decisions tended to be made top-down. But<br />
communities do not deal with government authorities on equal terms. In some cases,<br />
government agencies have ignored or sacrificed the interests of local communities on<br />
behalf of a “national interest” which may not have been well-defined. Community<br />
empowerment is thus also about the ability of people to demand public goods and to<br />
defend their rights within a wider political arena. Some of the cases in chapter 1 show<br />
how communities have mobilized for these purposes.<br />
OVERVIEW<br />
xi
xii<br />
Thailand’s experience with community empowerment is uniquely important because it<br />
has been growing over at least two decades, because it involves a range of different<br />
actors, and because there is an active and sometimes passionate debate about the<br />
community, its role, and its future. The Thai case is interesting because it is so varied and<br />
so vibrant.<br />
WRITING EMPOWERMENT<br />
The commitment to produce this Report began within UNDP, among professional development<br />
workers. But it quickly became obvious to those involved that the production of<br />
a report on the theme of community empowerment ought to empower communities as<br />
part of the process. Hence the method of producing the report was radically revised.<br />
Four representatives of local communities were included on the Review Board overseeing<br />
the project. Community members were added to the editorial team. Community forums<br />
were convened to express ideas and to select local writers to draft sections of the report.<br />
Drafts (in Thai) were submitted to review by community representatives.<br />
The report is thus the result of a dialogue between development professionals and<br />
consultants on one side, and community representatives and sympathetic organizations<br />
on the other. It would be wrong to present this as a smooth and easy process. Rather, it<br />
revealed very considerable gaps in understanding and hence took much longer than<br />
expected to complete. It would be wrong too to expect the resulting report to present a<br />
single, homogenous, and neatly logical view. The aim of the report is to explore<br />
community empowerment in the Thai context, including the diversity of experience and<br />
the conflict of views.<br />
EXPLORING DIVERSITY<br />
The term “explore” is important. The objective of the report is not to provide an<br />
operational definition of community empowerment or to prescribe formulas of how<br />
it works in practice. Empowerment has been defined within UNDP as “the ability<br />
of people to gain understanding and control over personal, social, economic, and political<br />
forces in order to take action to improve their life situation”. But this is a definition of<br />
“what” rather than “how”. The English term “empowerment” is something of a paradox. It<br />
suggests there is an agent (the government? the development specialist?) who is<br />
somehow making the community more powerful in some way. But this action itself is a<br />
display of power on the part of the agent. Not surprisingly, Thai community representatives<br />
who were involved in producing this Report rejected Thai translations which made<br />
this paradox explicit. They preferred forms which translate as “regain community power”<br />
or “revive community authority”. Their definitions clearly shifted the right to empowerment<br />
away from any outside agent to the community itself.<br />
One important conclusion of this exploration is that diversity is an intrinsic characteristic<br />
of local communities, and that embracing this diversity is a precondition for community<br />
empowerment. Each community has its own uniqueness. Each community has its own<br />
problems and its own capacity (or lack of ) to confront those problems. When we move<br />
from national policy to a community focus, we move from the unified to the diverse.<br />
A second important conclusion is that community empowerment is neither easy nor<br />
uncontroversial. By definition, it implies a shift in power relations – sometimes within<br />
communities, more often between the community and power-holders in the outside world.<br />
<strong>THAILAND</strong> <strong>HUMAN</strong> <strong>DEVELOPMENT</strong> <strong>REPORT</strong> <strong>2003</strong>
Often this entails a struggle. How far such struggles are justified, and to what extent they<br />
should alter the power relations on a general basis, is a matter of debate. In many of the<br />
examples of community empowerment in Thailand presented below there has been a<br />
high degree of cooperation and agreement between the parties involved – between<br />
communities and their various components, and government in its various components.<br />
However in some cases there has been disagreement and contest, on a fairly large scale.<br />
These cases may be in the minority but they are important because they pinpoint the<br />
areas where there is not yet a consensus. One of the objectives of this report is to identify<br />
these areas and suggest routes towards a solution.<br />
In sum, this Report is an exploration which seeks to uncover diversity and reveal debate<br />
rather than lay down definitions, prescriptions, formulae, road maps, or quick guides. It is<br />
hoped that by reviewing not only records of success but also points of confrontation and<br />
areas of misunderstanding it will contribute to a process of learning and consensus<br />
building by all parties concerned.<br />
PLAN OF THE <strong>REPORT</strong><br />
PART I: COMMUNITY EMPOWERMENT AND <strong>HUMAN</strong> <strong>DEVELOPMENT</strong><br />
1: THE COMMUNITIES’ VIEW<br />
This is the foundation chapter in which people from local communities themselves<br />
describe how they have struggled to gain power to improve their lives and prospects. It<br />
includes case studies compiled by communities from all regions of Thailand. The chapter<br />
concludes that communities have a clear idea of community empowerment as a learning<br />
process with three key strategies.<br />
2: THE NEW INSTITUTIONAL CONTEXT FOR COMMUNITY EMPOWERMENT<br />
This chapter begins by looking briefly at the history of communities in Thailand, highlighting<br />
how much they were disempowered by the political and economic changes<br />
which arrived rapidly from the 1950s onwards. It then looks at the forces which returned<br />
community empowerment to the national agenda in the 1990s and which have begun to<br />
change the institutional environment. It reviews the major changes in the institutional<br />
context brought about by the 1997 constitution, the Eighth and Ninth Plans, the decentralization<br />
to local government, and education reform. Finally, it questions how far these<br />
changes facilitate community empowerment and what further reforms are necessary.<br />
3: PROMOTING COMMUNITY EMPOWERMENT<br />
Community empowerment takes place within a broader, national context. This chapter<br />
looks at the development of community-based approaches as a learning process on a<br />
national scale. It starts by reviewing some early examples of community schemes and<br />
cooperation between communities and outside agencies. Then it traces how government<br />
agencies have funded research to understand community dynamics, resulting in the<br />
gradual adoption of bottom-up community-based planning techniques. Finally the<br />
chapter reviews the rapid expansion of community-based initiatives in response to the<br />
1997 crisis, especially projects inspired by H.M. the King’s “Sufficiency Economy”, and<br />
projects supported by the Social Investment Fund.<br />
OVERVIEW<br />
xiii
xiv<br />
4: COMMUNITY EMPOWERMENT AT THE CROSSROADS<br />
This chapter brings together conclusions from the three preceding chapters. Empowerment<br />
has become an important concept in development strategy as a result of<br />
the marriage of human development with human rights. Community members and<br />
activists in Thailand reached a similar conclusion as a result of the confrontation with a<br />
centralized state and top-down development. While recent institutional changes have<br />
facilitated empowerment, there are still considerable barriers of conservative opposition<br />
and bureaucratic inertia. Learning from successful local projects need to be disseminated.<br />
Democratic decentralization must be helped to succeed. The institutional weaknesses in<br />
systems for claiming rights must be overcome. The final part of the chapter suggests<br />
ways that various actors – communities, government, development organizations – can<br />
assist community empowerment in the pursuit of human development goals, and what<br />
changes in national policy-making are needed to promote community empowerment as a<br />
means and end of human development.<br />
PART II: MEASURING <strong>HUMAN</strong> <strong>DEVELOPMENT</strong><br />
5: <strong>HUMAN</strong> <strong>DEVELOPMENT</strong> INDICES<br />
This chapter introduces a new composite index – “Human Achievement Index” (HAI)<br />
which is an adaptation of UNDP’s global Human Development Index (HDI). HAI compares<br />
the state of human development in 76 provinces of Thailand by using 8 components of<br />
human development indicators, namely health, education, employment, income, housing<br />
and living conditions, family and community life, transportation and communication, and<br />
participation. In this chapter, HAI, HDI and GDI are presented at both the regional and<br />
provincial levels, confirming a pattern of inequities and uneven development that<br />
deserves immediate and long-term policy action.<br />
<strong>THAILAND</strong> <strong>HUMAN</strong> <strong>DEVELOPMENT</strong> <strong>REPORT</strong> <strong>2003</strong>
FOREWORD FROM THE PRIME MINISTER iii<br />
PREFACE FROM DR. SIPPANONDHA KETUDAT iv<br />
PREFACE FROM MR. J.K. ROBERT ENGLAND v<br />
ACKNOWLEDGEMENTS vii<br />
OVERVIEW x<br />
PART I: COMMUNITY EMPOWERMENT AND <strong>HUMAN</strong> <strong>DEVELOPMENT</strong><br />
CHAPTER 1: The Communities’ view 3<br />
Introduction: Writing this Chapter 3<br />
Confronting Development in Thailand’s Ricebowl: Learning Self-Reliance 3<br />
Community Learning: The Bank of Life Network 9<br />
Negotiating Cooperation to Clean a River 11<br />
Building Networks: The People Live, the Canal Lives 12<br />
Rediscovering Local Knowledge in the Highlands 15<br />
Expanding Social Space to Reclaim the Mun River 20<br />
Conclusion: Strategies of Empowerment 25<br />
CHAPTER 2: The new institutional context for community<br />
empowerment 27<br />
Centralization and Top-down Development 27<br />
Community Histories and Institutional Change 29<br />
The age of abundance 29<br />
The coming of development 29<br />
New ideas and organizations 30<br />
Boom, crisis, and reform 31<br />
Institutional Shifts I: The 1997 Constitution 36<br />
New rights for the community 36<br />
New directives for greater participation 37<br />
New institutions for democracy 37<br />
Institutional Shifts II: The Eighth and Ninth Plans 38<br />
Eighth Plan: people-centred development 38<br />
Ninth Plan: sufficiency economy 38<br />
CONTENTS<br />
CONTENTS xv
xvi<br />
CONTENTS<br />
Institutional Shifts III: Democratic Decentralization 40<br />
From centralization to contractors’ councils 40<br />
Emergence of the TAO 40<br />
Institutional Shifts IV: Education Reform 41<br />
Critiquing the system 41<br />
From critique to reform 41<br />
Education reform and the community 42<br />
Problems and Issues 42<br />
The 1997 Constitution’s unfinished business 43<br />
Ninth Plan: sufficiency economy vs. growth 44<br />
Decentralization: patronage or participation? 44<br />
Education reform: a long struggle? 45<br />
Conclusion 46<br />
CHAPTER 3: Promoting Community Empowerment 47<br />
A Learning Process on a National Scale 47<br />
Community Schemes for Empowerment 48<br />
Savings and credit 48<br />
Protecting the environment 48<br />
Communities and Outside Agencies 49<br />
Business and community 49<br />
Community, NGO, international agencies and government 50<br />
Understanding Community Empowerment 51<br />
Researching the community 51<br />
Learning and planning 52<br />
Planning for Community Empowerment 53<br />
New problem-solving paradigm 53<br />
Exercises in community planning 53<br />
Community-based Crisis Relief 56<br />
“Sufficiency Economy” projects 56<br />
Community participation 57<br />
Social Investment Fund (SIF) 57<br />
Thai Rak Thai government’s village projects 59<br />
Conclusion 61<br />
<strong>THAILAND</strong> <strong>HUMAN</strong> <strong>DEVELOPMENT</strong> <strong>REPORT</strong> <strong>2003</strong>
CHAPTER 4: Community Empowerment at the Crossroads 63<br />
CONTENTS<br />
Why Empowerment? 63<br />
Human development and human rights 63<br />
Why Community? 64<br />
Development and disempowerment 64<br />
Civil society and community 65<br />
Empowerment as a learning process 65<br />
CONTENTS<br />
What is Empowerment? 66<br />
1. Building their community power to solve problems<br />
independently 67<br />
2. Building their community power to negotiate cooperation<br />
with outside agencies 67<br />
3. Building their community power and networks to claim<br />
and protect community rights 68<br />
Enhancing Community Empowerment 69<br />
1. Solving problems internally: accelerating learning from<br />
experience 69<br />
2. Negotiating cooperation with outside agencies:<br />
making decentralization work 70<br />
3. Claiming community rights: improving the institutions 72<br />
Building an Enabling Environment for Community Empowerment 72<br />
Maintaining the momentum of political reform 73<br />
Ensuring the provision of public goods is responsive to people’s needs 74<br />
Reforming the public sector for empowerment 74<br />
Reforming education for empowerment 74<br />
Putting judicial reform on the national agenda 75<br />
Refocusing on poverty alleviation through empowerment 75<br />
Tackling gender bias 75<br />
Managing the environment 76<br />
Managing globalization for empowerment 77<br />
Concluding Remarks: Looking Ahead 77<br />
Varieties of empowerment 77<br />
Community and globalization 78<br />
Empowerment as learning process 78<br />
Community empowerment in social context 79<br />
Opportunity and risk 79<br />
xvii
xviii<br />
CONTENTS<br />
PART II: MEASURING <strong>HUMAN</strong> <strong>DEVELOPMENT</strong><br />
CHAPTER 5: Human Development Indices 83<br />
Introduction to Human Achievement Index (HAI) 83<br />
HAI characteristics 84<br />
HAI concept and structure 84<br />
HAI methodology 84<br />
Data sources 88<br />
Gender disaggregated data 88<br />
HAI’s eight indices 89<br />
1. Health Index 89<br />
2. Education Index 91<br />
3. Employment Index 94<br />
4. Income Index 96<br />
5. Housing and Living Conditions Index 98<br />
6. Family and Community Life Index 100<br />
7. Transportation and Communication Index 102<br />
8. Participation Index 104<br />
Composite HAI 106<br />
Human Development Index (HDI) 112<br />
Gender-related Development Index (GDI) 112<br />
A Regional overview: HAI, HDI, GDI 114<br />
Conclusion 115<br />
STATISTICAL ANNEX<br />
Technical notes on HDI and GDI 119<br />
Data sources 122<br />
Data tables 126<br />
<strong>THAILAND</strong> <strong>HUMAN</strong> <strong>DEVELOPMENT</strong> <strong>REPORT</strong> <strong>2003</strong>
PART I<br />
COMMUNITY EMPOWERMENT AND<br />
<strong>HUMAN</strong> <strong>DEVELOPMENT</strong>
2<br />
<strong>THAILAND</strong> <strong>HUMAN</strong> <strong>DEVELOPMENT</strong> <strong>REPORT</strong> <strong>2003</strong>
The strength of people and communities<br />
at the grassroots is the<br />
strength of the nation.<br />
– Wibun Khemchaloem<br />
INTRODUCTION:<br />
WRITING THIS CHAPTER<br />
There’s a Thai saying, “Speaking is easy,<br />
doing is difficult”. There’s also a more<br />
mischievous variant, “Speaking is easy,<br />
listening is difficult”. A first step towards<br />
empowering communities is to listen to<br />
them, and let them tell us what they<br />
think empowerment means, how it can<br />
be achieved, and how it is sometimes<br />
impeded.<br />
This chapter presents community voices<br />
from all over Thailand. This is how the<br />
chapter was written:<br />
four coordinators who work with<br />
communities in different regions of<br />
Thailand identified groups of villagers<br />
to participate in the project<br />
“Speaking is easy, listening is difficult”. Let them tell us what they<br />
think empowerment means.<br />
THE COMMUNITIES’ VIEW<br />
CHAPTER<br />
THE COMMUNITIES’ VIEW<br />
forums were held where the community<br />
representatives were encouraged<br />
to tell how they had learned to<br />
grapple with their own problems<br />
the dialogues were recorded, transcribed,<br />
then compiled into a report<br />
by the coordinator<br />
these reports were edited down for<br />
length and readability; the “voice” in<br />
each of the accounts below is a<br />
synthesis of several people in the<br />
community<br />
We present these histories and opinions<br />
here with no introduction. We will come<br />
back to summarize and interpret them<br />
briefly at the end of the chapter, and<br />
then more fully in chapter 4. But to start<br />
off, the difficult but necessary task is to<br />
listen.<br />
CONFRONTING<br />
<strong>DEVELOPMENT</strong> IN<br />
<strong>THAILAND</strong>’S RICEBOWL:<br />
LEARNING SELF-RELIANCE<br />
Photo credit: Dr. Ken Kampe<br />
In my village we used to<br />
grow rice, and go into the<br />
forest to hunt animals and<br />
collect things to sell. Families<br />
and kin were close. People<br />
helped one another. Villagers<br />
didn’t know much about<br />
money. But since development<br />
came, we have new<br />
crops. The community<br />
started to change. People began<br />
to think differently. Even<br />
I changed. My parents told<br />
me to work hard and make<br />
money. I followed along.<br />
1<br />
3
4<br />
Thailand’s Central Plain is<br />
naturally very fertile. Five rivers<br />
flow down from the hills – the<br />
Phetchburi, Thajin, Mae Klong,<br />
Chaophraya, and Bang Pakong.<br />
For centuries they have bought<br />
down sediment which formed<br />
a fertile delta. The kings built<br />
canals criss-crossing the delta.<br />
These canals were meant as<br />
highways, but they also at-<br />
tracted settlement. More and more people came. But even in the memory of<br />
people living today, it was not too crowded. There was more than enough for<br />
everyone. But the changes over the last “development” generation have been<br />
massive. The economy and ecology were dramatically altered. People are still<br />
grappling with the resulting impact on their own lives. This section comes<br />
from the experience of many Central Plain villagers who have been inspired<br />
by the self-reliance teachings of Headman Wibun Khemchaloem.<br />
Photo credit: Energy for<br />
Environment Foundation<br />
Then BAAC 1 began to offer loans.<br />
From then, relationships in the community<br />
started to change. We used<br />
to exchange labour among families.<br />
Now we hire people. In the past the<br />
family all ate from the same pot.<br />
Now they eat from the same food<br />
vendor.<br />
– Nikon Kaeokham,<br />
Chachoengsao province<br />
Before, you wouldn’t think of rice<br />
without fish and vegetables too. If<br />
we went to plough a field, we’d<br />
collect vegetables from the ponds<br />
and eat them right there. Now these<br />
kind of vegetables have all gone.<br />
– Udom Klipmalai,<br />
Ayutthaya province<br />
Back then we lived off<br />
nature. We grew rice by<br />
broadcast. We could live<br />
because we did not worship<br />
money. We’d barter among<br />
ourselves for coconut, sugar,<br />
beans, vegetable – all of<br />
which were easy to find<br />
around here. We had plenty<br />
of rice to trade for other<br />
1 The Bank of Agriculture and Agricultural<br />
Cooperatives, the government’s<br />
bank for rural lending.<br />
things at the local market. Boats<br />
came there with vegetables and<br />
fruits to trade. At that time, there<br />
was no pressure. With some effort,<br />
we could produce enough to eat and<br />
barter.<br />
– Sivilai Klipmalai, Ayutthaya province<br />
The ways of life of those days are not<br />
forgotten. They are part of our culture.<br />
We had enough. Nobody went hungry.<br />
And nobody wanted to grab more than<br />
they needed, because there was always<br />
enough to go around – for ourselves and<br />
our children. It was a good life.<br />
Around 1961 the government set out a<br />
new course of development. We can<br />
remember the time because there was a<br />
famous song about Headman Li calling<br />
villagers to a meeting to learn about the<br />
new policy. It’s a funny song because<br />
both Headman Li and the villagers can’t<br />
understand the new policy. It’s written in<br />
city language they don’t understand. But<br />
it’s a sad song too, because it pinpoints<br />
the time when we ceased to control our<br />
own lives. People from outside came to<br />
tell us what to do. Our own knowledge<br />
and old ways were no longer good<br />
enough. And even if we did not understand<br />
the new ideas and new orders, we<br />
had to follow them.<br />
With development, many things got<br />
better – schools, health care, electricity,<br />
roads. But having enough to survive was<br />
no longer enough. We wanted more so<br />
we could trade. More trade, more profit,<br />
Photo credit: UNDP Thailand<br />
<strong>THAILAND</strong> <strong>HUMAN</strong> <strong>DEVELOPMENT</strong> <strong>REPORT</strong> <strong>2003</strong>
more money, more savings, more power.<br />
Money became more important than real<br />
value. We let slip things like relationship,<br />
unity, and our own old wisdom. You can’t<br />
estimate the value of such things. And<br />
we sold the very things that have made<br />
us rich and secure in the past – the<br />
natural resources around us.<br />
The first plan began in 1961. The<br />
government introduced new rice<br />
strains and had a competition on<br />
yields. Our family won. I’ve still got<br />
the trophy. But overall there was not<br />
so much change, not so much impact<br />
from this first plan. I was even a little<br />
resentful that other places were<br />
already more developed, while we<br />
were still using buffaloes. Then under<br />
the second plan, people started<br />
to plant a second crop. The kamnan 2<br />
did it first. He bought a tractor and<br />
new rice seeds. It was only possible<br />
along the canal where there was<br />
enough water. Others went and<br />
bought the seeds too, but they failed<br />
because there was not enough water.<br />
Who advised us to start a second<br />
crop? It’s something we ask ourselves.<br />
We were attracted by money.<br />
The second crop made a profit. But<br />
before long the price dropped and<br />
we got into debt.<br />
– Udom Klipmalai, Ayutthaya province<br />
Many farmers mortgaged their land to the<br />
moneylenders and local traders. And lost<br />
it. Many people went off to clear new<br />
land in the forest. Families went by the<br />
truck load. The forest was cut down for<br />
big plantations of cassava, maize, and<br />
soybean.<br />
The other way out for the landless was to<br />
go to the city, and work on construction<br />
sites. After the forest was closed, 3 this<br />
was the only way out. Besides, by that<br />
time, industry had begun to grow. Many<br />
2 The head of a group of villages or sub-district<br />
(tambon), chosen from among the village<br />
heads.<br />
3 In 1989, government revoked all logging concessions<br />
and tried to prevent further destruction<br />
of forest.<br />
THE COMMUNITIES’ VIEW<br />
Headman Li<br />
In 1961, Headman Li banged the meeting drum, and the villagers<br />
came to the meeting,<br />
To the meeting at Headman Li’s house.<br />
I, Headman Li, will now inform you what this meeting is all about.<br />
The authorities have ordered villagers to raise ducks and sukon.<br />
Grandpa Si with the shaky head asked: “What’s this sukon?”<br />
Headman Li answered like a shot,<br />
“A sukon, yes, it’s just an ordinary puppy, a puppy, an ordinary puppy.”<br />
In fact, sukon meant a pig, in the formal Sanskritized Thai which officials<br />
liked to use but which villagers (at that time) had never heard. This<br />
misunderstanding so beautifully typified the reality of top-down development<br />
that the song became a huge hit.<br />
young people went to work in the factories.<br />
And the industrial areas started to<br />
spread out from the cities.<br />
Up to 1982, even though we had<br />
drought years, people still had little<br />
or no debts. After that they grew<br />
steadily. From 1987, land started to<br />
change hands. Then after the factories<br />
appeared, the youngsters went to<br />
work there. There was nobody to<br />
plough because only a youngster can<br />
do it. So people left the land idle and<br />
waited for their kids to send them<br />
money. Parents couldn’t criticize their<br />
kids because they depended on them.<br />
This created another kind of problem.<br />
The factories brought many changes.<br />
Land was left idle. Kids bought<br />
vehicles and got into accidents.<br />
Towns sprung up around the factories<br />
with casinos, snooker, karaoke. From<br />
that time, money was everything. The<br />
family started to break up. The old<br />
warmth was gone. In 1987-91, the<br />
price of land soared. People said<br />
farmers ought to be happy, but they<br />
didn’t understand. In an agricultural<br />
country, if land prices soar, before<br />
long there’ll be trouble; the country<br />
will hit a crisis.<br />
– Udom Klipmalai, Ayutthaya province<br />
When the natural resources are used up<br />
and destroyed, then the communities are<br />
weakened.<br />
5
6<br />
Headman Wibun Khemchaloem has become a living example of self-reliance.<br />
At first he was caught up in the trend towards commercial farming. He had a<br />
large farm and he produced for the market. But bit by bit he got into debt, and<br />
eventually he lost most of his land. He decided to use the small plot that<br />
remained to provide as much as possible for his own needs. He gave up growing<br />
maize, cassava, and soybean for the market. Instead he grew just enough rice for<br />
his own needs, and divided up the rest of the plot for fruit trees, a vegetable<br />
garden, a fish pond, and some animals. He found that he could survive even on a<br />
small plot. He grew what he ate, and ate what he grew. That became his motto.<br />
And he found that he was much happier than before when he was a big<br />
commercial farmer. Headman Wibun’s story spread. Journalists wrote about his<br />
success. People came to look at his farm. Organizations invited him to come and<br />
give them advice. He was asked to explain his ideas in a television series. Now<br />
he spends a lot of his time advising communities on planning for self-reliance.<br />
Development made people lose their<br />
confidence in themselves. We’re told our<br />
old ways and our old knowledge aren’t<br />
good enough any more. The local wisdom<br />
and the knowledge passed down<br />
from generation to generation are being<br />
destroyed. The knowledge of dharma 4<br />
which teaches us to rely on ourselves is<br />
also being lost. The education system<br />
actually helps destroy the old knowledge.<br />
Education has been designed to produce<br />
people for industry. Learning has become<br />
something that is bought and sold.<br />
Education is an investment and investors<br />
want to get a return on their money.<br />
So people who go through schools<br />
just end up like cogs in the industrial<br />
machine – sometimes without even realizing<br />
it.<br />
Our capability is actually going down<br />
because our self-confidence is ebbing<br />
away. In the end we won’t know anything.<br />
We have to start relearning things<br />
so we can strengthen our communities.<br />
We have to think how the community<br />
can regain its self-confidence to tackle<br />
problems, and rely on itself rather than<br />
waiting for help and sympathy from<br />
others.<br />
I didn’t come to this decision by<br />
choice. I simply had nobody else to<br />
rely on so I decided to rely on myself.<br />
4 Buddhist teachings.<br />
– Wibun Khemchaloem<br />
Other farmers don’t need to wait<br />
until they are in such dire straits as<br />
I was. They should act now. Selfreliance<br />
is easy to preach but difficult<br />
to do. But it’s worth the effort. We<br />
have to survive, but with dignity too.<br />
The first stage is to make a plan.<br />
When we define the problems we<br />
face, we find some can be solved<br />
within the family, but others can be<br />
solved only within the community as<br />
a whole.<br />
The second stage is to look for the<br />
information we need for making<br />
decisions and reducing the risk of<br />
failure. For some information, we<br />
need to look outside the community.<br />
We have to go looking for new<br />
information and be prepared to test<br />
and experiment. These are the main<br />
areas to cover.<br />
1. Rice is the staple of the region<br />
so this has to be the starting point.<br />
We tend to think of rice as just rice.<br />
But there are over 30,000 different<br />
strains to choose, and over 2,000<br />
ways to use the plant, not only<br />
the cooked grain but the husk,<br />
bran, stalk, leaf, flower, and root.<br />
Photo credit: Dr. Ken Kampe<br />
“Bai-see” – is a merit making ceremony to honour<br />
the Goddess of Rice.<br />
<strong>THAILAND</strong> <strong>HUMAN</strong> <strong>DEVELOPMENT</strong> <strong>REPORT</strong> <strong>2003</strong>
2. Other food can come from many<br />
different places. We can plant<br />
crops. We can gather many<br />
things from the forest, from the<br />
edges of the fields, from ponds.<br />
We can preserve foods in various<br />
ways.<br />
3. Sickness is a fact of life. Some<br />
ailments we should prepare to<br />
cope with on our own. Others<br />
are more complex and we have<br />
to organize ways to deal with<br />
them at the community level.<br />
4. We need tools and equipment,<br />
and a lot of these we can easily<br />
find from nature around us –<br />
fabrics, dyes, wood for tools and<br />
furniture. Beyond these basics,<br />
we should develop our abilities<br />
to make things rather than simply<br />
buying them.<br />
5. The land is important. We need<br />
to understand natural ways to<br />
increase its fertility so that we<br />
can live in harmony with the<br />
land.<br />
These are the basic principles. Once<br />
these are understood, the next stage<br />
is developing the community<br />
through participation to create a<br />
common learning process.<br />
If a community can develop its<br />
capacity to learn as a process with a<br />
definite direction, then the community<br />
will recover the confidence to<br />
develop its own strength and capability.<br />
Bit by bit we can rebuild from<br />
the community, to the society of the<br />
THE COMMUNITIES’ VIEW<br />
Wibun Khemchaloem<br />
Photo credit: Dr. Ken Kampe<br />
Central region, and then the nation.<br />
The strength of people and<br />
communities at the grassroots is<br />
the strength of the nation.<br />
– Wibun Khemchaloem<br />
The villagers in Tha Kradan subdistrict<br />
are an example of Headman<br />
Wibun’s ideas in practice. They<br />
started by making a survey which<br />
showed that the 168 households had<br />
an average income from rice, maize,<br />
soybean, and sesame of 45,000 Baht 5<br />
a year, but expenses of 75,000 Baht a<br />
year. As much as 72 per cent of the<br />
expenses were inputs like fertilizer, chemicals,<br />
and gasoline that had to be bought<br />
from outside the community. We knew<br />
that raising the income would be difficult.<br />
We had to find another way.<br />
The learning process began with the foundation<br />
of a savings fund. It was a way to<br />
get people to join together, exchange<br />
knowledge, and understand one another’s<br />
problems. After a year, villagers realized<br />
that one important problem was that<br />
some people did not have enough rice to<br />
eat and so had to devote some of their<br />
time to earning wages. The solution was<br />
to set up a rice welfare fund. There’s<br />
an old belief that you shouldn’t sell your<br />
old stock of rice until the new crop is<br />
harvested. The villagers who kept to this<br />
belief had stocks which they put in this<br />
welfare fund.<br />
Next was a scheme to preserve and<br />
manage the community forest. We had to<br />
relearn old wisdom about the value of<br />
food and medicinal plants from the forest.<br />
Then we had a fish scheme – a ban on<br />
fishing during the breeding season – and<br />
now the overall catch is much larger. We<br />
had to think up new customs. For instance,<br />
having a merit-making ceremony<br />
for fish that have been poisoned, and<br />
planting twenty trees whenever a child<br />
is born. Also we made a point of using<br />
organic fertilizer, raising buffaloes to<br />
reduce production costs and restore the<br />
environmental balance, thinking up ways<br />
5 At the time of writing, US$ 1 is approximately<br />
42 Baht.<br />
7
8<br />
to process and preserve agricultural produce,<br />
and making things to replace items<br />
purchased from outside like detergent,<br />
shampoo, toothpaste, and drinking water.<br />
In July 1996 I had the chance to<br />
stay at Headman Wibun’s place.<br />
We talked about many things. He<br />
advised me to review my income<br />
and spending. So I started keeping<br />
accounts. When I added things up<br />
after one year, I understood why I<br />
was in debt. Our little family eats<br />
three times a day for 365 days a year<br />
at 20 baht a time, which works out as<br />
21,990 baht for the year. How many<br />
rai6 of maize do we have to grow to<br />
pay for that? And we haven’t started<br />
talking about tobacco, alcohol, school<br />
fees, and other outgoings.<br />
So I stopped growing maize, and<br />
planted vegetables and trees. I grew<br />
everything I ate, and ate everything I<br />
grew. With 40 to 50 rai of maize I<br />
couldn’t stay out of debt, but with<br />
only a little land we had enough to<br />
eat. At the beginning, my wife argued<br />
against it, and so did the friends I<br />
used to drink with. But when I grew<br />
papaya, they came to buy them from<br />
me. In 1997, I gave up drinking and<br />
smoking and encouraged my friends<br />
to form a group to think about<br />
developing the village. We drew up a<br />
plan. We knew it had two possible<br />
outcomes – survive or die. But we<br />
also knew that if we didn’t follow<br />
a plan, there was only one possible<br />
outcome. So, no choice. The government<br />
has lots of projects for us to do.<br />
But it has never had a project to help<br />
us think about what to do.<br />
– Liam Butjantha,<br />
Chachoengsao province<br />
A strong community does not arise just<br />
like that. It starts from learning, from<br />
analysing ourselves so we understand the<br />
source of our problems, so we realize the<br />
value and the wisdom of all sorts that<br />
exists in the community. Then we can<br />
fine-tune that wisdom for today’s world<br />
6 A rai is 0.16 hectare.<br />
in order to solve very basic problems.<br />
Sustainable agriculture is the foundation.<br />
It provides enough to live. It must fit in<br />
with the environment and resources which<br />
are the common property of the community.<br />
It should not harm our health but<br />
rather strengthen it. Once we have<br />
enough for ourselves then we can think<br />
about selling what’s left over. But we<br />
should not be selling raw materials. We<br />
should find ways to develop products by<br />
setting up family industries or community<br />
industries. We need to save up our own<br />
capital so that we rely as little as possible<br />
on outside capital. We should have our<br />
own system of community welfare.<br />
It starts from asking ourselves how we<br />
want to manage our lives, and how we<br />
can join together as a community or<br />
locality. We have to learn and be creative<br />
to make systems that are right for the<br />
community.<br />
I started discussing with friends and<br />
relatives. At first nobody believed<br />
me because there was no concrete<br />
result. Now it’s easier. A member of<br />
our savings group had a motorcycle<br />
accident. I went and paid the medical<br />
bill from our welfare fund. That<br />
made people believe that a youngster<br />
like me could do things. No<br />
need to wait until the oboto7 gets<br />
set up. We’ve been waiting for ages<br />
already. Our group just decided to<br />
do it. We’d make mistakes but we<br />
could put them right. We have to<br />
focus on the main problem: how to<br />
make everyone self-reliant. We have<br />
to eat every day but we don’t have<br />
income every day. So I realized we<br />
had to build a secure foundation by<br />
first reducing expenses as much as<br />
possible.<br />
I once asked a waitress why she<br />
worked in a restaurant. She said she<br />
didn’t want to work in the fields. She<br />
was afraid of worms and centipedes.<br />
I thought of my own daughter. If we<br />
7 Oboto is the Thai abbreviation for the Tambon<br />
(sub-district) Administrative Organization<br />
(TAO). This new level of local government is<br />
considered in chapter 2.<br />
<strong>THAILAND</strong> <strong>HUMAN</strong> <strong>DEVELOPMENT</strong> <strong>REPORT</strong> <strong>2003</strong>
don’t know how to manage our<br />
children, then they will turn out like<br />
that. I can’t abandon farming because<br />
it’s my livelihood. But we need<br />
to create the conditions which will<br />
allow us to survive. As a family and<br />
as a nation, we need to plan ahead.<br />
I’ve come to realize the value of our<br />
natural resources. I’m beginning to<br />
understand how to manage things<br />
and I’m not afraid of problems. Also,<br />
I’m not ashamed of having been a<br />
buffalo boy because now buffaloes<br />
are even more expensive than cars.<br />
Besides, they don’t need petrol or<br />
repairs. Nature has taught me to be<br />
smart and strong. Otherwise I<br />
couldn’t survive.<br />
– Nikon Kaeokham,<br />
Chachoengsao province<br />
Community empowerment starts with<br />
learning and especially with learning<br />
about ourselves. We have to look at<br />
ourselves and our communities, research<br />
the origin of our problems, rediscover the<br />
old wisdom in the community. Reviving<br />
local wisdom is a way to start a learning<br />
process in the community, to trigger a<br />
movement for change towards selfreliance,<br />
survival with dignity, and<br />
independent decision-making. The three<br />
basics are people, natural resources, and<br />
wisdom or local knowledge. The three<br />
aspects of the learning process are: knowing<br />
how to know, knowing how to use<br />
existing knowledge, and knowing how to<br />
relate with nature. Local knowledge from<br />
the past gives us the confidence that the<br />
available natural resources can support<br />
our livelihood, build society, and preserve<br />
local culture. With this confidence we can<br />
begin to learn new things too. This is<br />
community empowerment.<br />
COMMUNITY LEARNING:<br />
THE BANK OF LIFE NETWORK<br />
We didn’t have money, but had<br />
everything else. We bartered. Later<br />
on, we had to sell, to take loans. We<br />
were all in debt, but did not know<br />
what to do.<br />
– U-taphao community member<br />
THE COMMUNITIES’ VIEW<br />
We used to grow rice, vegetables, and<br />
fruit. We rarely used money. Each household<br />
had two pigs, two cows, and nine or<br />
ten chickens. We used to travel by canal<br />
to the market where we bartered our<br />
banana leaves, fish, sugar cane, sugar-palm<br />
nuts, pomelo, and orange for honey,<br />
shrimp paste, betel nuts, and other goods.<br />
Then development came. We abandoned<br />
the canal and travelled by road. We abandoned<br />
the rice fields and looked for jobs<br />
in the town. At the annual Chak Phra 8<br />
festival we used to carry the Buddha<br />
image along the canal by boat. By 1976,<br />
it went by road.<br />
Villagers left the community. Prices went<br />
up. Soon we had to take loans from local<br />
lenders, then from banks. We all had<br />
debts, but did not know what to do.<br />
BAAC lent money, not knowledge. People<br />
here had never seen sums like 30,000<br />
baht. They mortgaged their land and got<br />
guarantors. Smart people took advantage<br />
of others. A few got rich while others<br />
became poor. The government was<br />
wrong in doing this.<br />
The key to solving<br />
these problems was<br />
to work together.<br />
The savings group<br />
was the idea of a<br />
monk, Than9 Thong,<br />
and some villagers.<br />
Than Thong came<br />
up with the name<br />
the “Bank of Life”,<br />
meaning we entrusted<br />
our life to<br />
the group. Than<br />
Thong was highly<br />
respected because<br />
he strictly observed<br />
Than Thong initiated the “Bank of Life”.<br />
Lord Buddha’s<br />
teaching. He was also a development<br />
monk who drew the community into the<br />
temple. He used Buddha’s Five Precepts<br />
and the principle of honesty as the<br />
group’s code of conduct.<br />
8 A festival in which the Buddha image is taken<br />
out of the temple and paraded around the<br />
community.<br />
9 “Than” is a title of respect.<br />
Khu Tao is a community<br />
on the U-taphao canal<br />
outside Hat Yai, one of the<br />
main towns of the south.<br />
The rapid growth of Hat<br />
Yai has transformed the<br />
surrounding area. The<br />
“Bank of Life” is a savings<br />
group started in Khu<br />
Tao in October 1984. The<br />
story is told by the monk<br />
and villagers who initiated<br />
and manage the scheme.<br />
Photo credit: “Bank of Life” savings group<br />
9
10<br />
The bank charges a fee or interest on loans, pays no dividends, but offers medical and other welfare to<br />
community members.<br />
At first, the group had eighteen members,<br />
each contributing one baht a day. Many<br />
people didn’t understand how this could<br />
help people. But later others joined the<br />
group. Then there were suspicions that<br />
Than Thong would hand the money over<br />
to the abbot. If the original eighteen<br />
hadn’t been patient, the group would<br />
never have got this far. But now it’s a<br />
success.<br />
So many people wanted to borrow that<br />
the funds were not enough. At first we<br />
drew lots to decide who would get a<br />
loan. But all the members agreed that<br />
was not fair. Someone who really needed<br />
the money might not get it. This was<br />
solved by having all would-be borrowers<br />
discuss together and decide who needed<br />
the money most. This system encourages<br />
people to care about one another and to<br />
share problems. Members cannot take<br />
out new loans until they repay old ones.<br />
Exemptions are made when schools open<br />
and the people need money for school<br />
fees. The key principle of the Bank of Life<br />
is sharing: “You know my problems and I<br />
know yours. So, we understand each<br />
other”. Every member is equal, has one<br />
share, and pays the same amount each<br />
day. If a small number of people held a<br />
lot of shares, they could bully the others.<br />
The bank charges a fee or interest on<br />
loans, but pays no dividends. At first we<br />
used the income for making merit and<br />
donating to the temple. Now we provide<br />
welfare benefits to members for funeral<br />
Photo credit: “Bank of Life” savings group<br />
expenses, medical care, emergency loans,<br />
disaster relief, scholarships, and school<br />
lunches. Everyone gets the same welfare.<br />
Starting with 18 in 1984, the Bank’s<br />
membership is now about 900. Longtime<br />
members can borrow more. Now<br />
the Bank of Life has three locations,<br />
all in a wat (Buddhist temple), each<br />
managed independently by a committee.<br />
At each wat there is a Dharma Forum<br />
where people meet to discuss community<br />
problems. Monthly meetings rotate<br />
around the three temples.<br />
When the Bank had become well established,<br />
it got more funds from the<br />
government’s SIF 10 scheme and from the<br />
Songkhla Rural Village Rehabilitation Association.<br />
This has enabled the Bank to<br />
expand its operation, not only to help<br />
more people, but also to strengthen the<br />
community’s capacity to cope with the<br />
changing world. The Bank has started a<br />
fund to promote skills that disappeared<br />
from the villages, such as producing sugar,<br />
making products woven from banana<br />
fibre, and making thong muan, a famous<br />
local snack. These products use raw<br />
materials available in the community.<br />
Through the Bank of Life we have learned<br />
how to be more self-reliant.<br />
10 The Social Investment Fund was an crisis<br />
mitigation strategy begun in 1998 and<br />
funded mainly by the World Bank. It is<br />
reviewed in chapter 3.<br />
<strong>THAILAND</strong> <strong>HUMAN</strong> <strong>DEVELOPMENT</strong> <strong>REPORT</strong> <strong>2003</strong>
NEGOTIATING COOPERATION<br />
TO CLEAN A RIVER<br />
In the past, we just went to the canal<br />
bank and caught shrimp. Just like<br />
that. No need even to go down into<br />
the water and get wet.<br />
– Fisherman,<br />
Samut Sakhon province<br />
The Chaophraya and all the other rivers<br />
are now so polluted you cannot use them<br />
for drinking or washing. As for the fish<br />
and shellfish we used to eat, over 90<br />
per cent of the species have disappeared.<br />
Even the fish in the local markets all<br />
come from fish farms. River fish are just<br />
myths and dreams. Only the rich can<br />
afford them. As for the great biodiversity<br />
of this region, it’s just too sad.<br />
This all came from the development of<br />
industry from the first plan 11 onwards.<br />
Factories, big and small, are scattered<br />
along all five rivers. They spill waste and<br />
pollution into the rivers without thinking.<br />
The towns around the factories also<br />
create garbage. Nature has to suffer everything.<br />
The pollution along the coastal strip<br />
is critical. The Thajin river is bad all<br />
year long. The creeks leading to the<br />
coast are black with filth, and no fish,<br />
prawns, or shellfish can survive. The<br />
polluted water comes from the factories<br />
which release untreated waste<br />
into the river – power stations, semiconductor<br />
plants, textile factories, and<br />
industries of all sorts. It’s getting<br />
worse. Every river is polluted, and so<br />
the whole coastline is polluted.<br />
There’s a law about treating water,<br />
but the factories don’t follow it,<br />
and the officials don’t do their duty<br />
honestly. If there’s going to be an<br />
inspection, they warn in advance. In<br />
short, there’s corruption.<br />
11 The first development plan covered the years<br />
1961-66.<br />
THE COMMUNITIES’ VIEW<br />
In the past, along the coast of the Gulf of Thailand and up the river estuaries<br />
were mangroves. Many fish, crab, shrimps, and shellfish lived in the mangroves.<br />
People have lived around these river mouths, and along the banks of<br />
the rivers, for a long time. They grew rice and many other crops. They fished<br />
and collected many things from the mangroves. But in recent decades, these<br />
areas and the peoples who depend on them for livelihood have been<br />
threatened by industrial pollution. This section comes from the experience of<br />
villagers around the estuary of the Thajin river to the west of Bangkok.<br />
We can’t live the way we did. We can<br />
fish for no more than four months in<br />
the year. This year we have been out<br />
to sea for only ten days.<br />
When the water turns tea-coloured,<br />
everything dies. Only the bones are<br />
left. You have to go out to sea for ten<br />
miles before you see any sign of life.<br />
In the past we fishermen were happy.<br />
Even ate in restaurants and hotels.<br />
Now in our village, only 10 per cent<br />
have their head about water, and the<br />
other 90 per cent are in debt.<br />
We have formed the Thajin River<br />
Conservation Club and are taking<br />
matters into our own<br />
hands because we’ve<br />
had enough. From<br />
now on water released<br />
into the river must be<br />
treated first. If not,<br />
we’ll blockade a road.<br />
We have to raise people’s<br />
awareness about<br />
keeping the river clean<br />
by not throwing garbage,<br />
bottles, cans, and<br />
old lubricating oil in it.<br />
Once the river is<br />
clean again, we must<br />
continue to look after<br />
it.<br />
We work in cooperation<br />
with government<br />
agencies. We’re not<br />
attacking them. We<br />
are just telling them<br />
that the villagers<br />
have these problems<br />
and these requests.<br />
Tomorrow we’re going<br />
to talk to the gas<br />
Photo credit: Bangkok Post<br />
A villager uses a dip net to remove dead fish, bred in<br />
floating baskets, died from pollution in the river.<br />
11
12<br />
The Samrong canal links<br />
the Songkhla lake, the<br />
largest lake in the South,<br />
to the Gulf of Thailand.<br />
Five slum communities,<br />
including Kaoseng, settled<br />
along its banks. Like<br />
many slum communities<br />
they had no rights to<br />
land, found it difficult to<br />
get public services, and<br />
faced constant threat of<br />
eviction. They were also<br />
accused of polluting the<br />
canal. Their lives changed<br />
when they realized that<br />
this accusation was not<br />
an unfair burden, but a<br />
factories. We’ll tell them we don’t<br />
want to cause them problems but<br />
rather to help them. We’ll ask them<br />
to prevent gas-impregnated water<br />
pouring into the river when it rains.<br />
We’ll ask them how they treat the<br />
water and what it contains. Then<br />
we’ll visit the acid factories and the<br />
dyeing works. But it starts with<br />
ourselves. We’ve been collecting the<br />
water hyacinth 12 for four months and<br />
using it to make fertilizer and food<br />
for wild boar and ostrich farms.<br />
Solutions have to be effective. We<br />
have to find ways to monitor the<br />
discharges. We’ve identified ten<br />
points along the river where we<br />
check the water. If the water is still<br />
okay at the first point, then we go to<br />
the second. If it is not okay at the<br />
second, then we pinpoint who is the<br />
cause of the problem. There aren’t<br />
many factories between the two<br />
points. This sort of monitoring is the<br />
way to deal with people who are not<br />
environmentally conscious or who<br />
simply break the law. We can tell<br />
them: we know you’re doing it.<br />
– Fisherman, Samut Sakhon province<br />
BUILDING NETWORKS:<br />
THE PEOPLE LIVE,<br />
THE CANAL LIVES<br />
I told our people that we<br />
lived on the canal, so we<br />
have to take care of it. If<br />
we let government agencies<br />
do it, they will kick us<br />
out. They think we are responsible<br />
for the pollution.<br />
A big elephant dies, the<br />
government doesn’t smell<br />
a thing. A goat dies, they<br />
say it stinks.<br />
– Jaidee Sawang-arom,<br />
Kaoseng community leader<br />
source of power. 12 A fast-growing water plant<br />
which tends to block waterways.<br />
Photo credit: “Samrong canal” community<br />
Samrong canal before the clean-up.<br />
Samrong canal used to be clean and<br />
clear. Pollution started only ten years<br />
ago. The communities along the<br />
canal are not the only culprits. The<br />
factories are responsible too. But the<br />
blame gets put on the communities.<br />
– Jaidee Sawang-arom<br />
It used to be easy to catch black tiger<br />
prawns in the canal. The pollution began<br />
in 1986 when factories discharged untreated<br />
water into the canal. Now there<br />
are no fish. The city people accuse us.<br />
We might be responsible for 20 per cent<br />
of the problem, but no more. There are<br />
many sources of pollution – factories,<br />
municipal drainage, lubricant oil, water<br />
running off the street. Still, they put all<br />
the blame on us because we are slum<br />
squatters.<br />
Samrong community cleaned up the canal.<br />
<strong>THAILAND</strong> <strong>HUMAN</strong> <strong>DEVELOPMENT</strong> <strong>REPORT</strong> <strong>2003</strong><br />
Photo credit: “Samrong canal” community
Samrong canal after the clean-up.<br />
City people look down on us. They<br />
believe slum dwellers cause all sorts of<br />
problems – drugs, gambling, and crime.<br />
Some communities were ordered to<br />
leave, but they refused. Some have been<br />
removed to make way for commercial<br />
development. We are seen as an obstacle.<br />
If the land is vacant, it’s easier for the<br />
authorities to develop the area. But we<br />
believe that the people and the canal can<br />
live together.<br />
In the past, the government would tell<br />
the slum communities what to do and we<br />
would follow without question. Then the<br />
NGOs came and gave advice, especially<br />
the Housing Development Foundation.<br />
We had been deaf and blind for a long<br />
time. So they were like eye-drops and<br />
ear-drops. We began to see and hear<br />
better. We believed we could control our<br />
own lives. The NGOs did not make<br />
decisions for us; they were just our consultants.<br />
In the old days, we could never<br />
have done this. As soon as we got<br />
together, we were strong. Government<br />
agencies did not like us to be strong<br />
because they thought we would oppose<br />
their ideas. That was wrong. In fact, coming<br />
together just made us smarter.<br />
In 1990, we started by setting up a<br />
savings group to provide some security to<br />
the communities that were always in danger<br />
of eviction. It’s difficult to set up<br />
savings groups in urban communities because<br />
people come from different places.<br />
THE COMMUNITIES’ VIEW<br />
But the authorities weren’t going to help<br />
us, so we had to go it alone. Five groups<br />
started by 1991, and now there are ten.<br />
They give loans to members and use the<br />
income for health, education, housing, and<br />
other welfare.<br />
The savings groups were just the start of<br />
getting together. Once we had this<br />
organization, other projects were easier.<br />
We started a Child Development Centre<br />
for pre-school. This is important because<br />
slum kids easily get looked down on<br />
when they first go to school. We got<br />
money from SIF to help the poor, elderly,<br />
abandoned children, and people with HIV/<br />
AIDS. We got money from the National<br />
Housing Authority to build walkways,<br />
piped water, electricity, and drainage but<br />
somehow the budget was cancelled. But<br />
we got some money from elsewhere to<br />
build drains.<br />
Mostly we dug the drains ourselves,<br />
but we also had to cross a municipal<br />
road. We wrote to the municipality<br />
to give us permission and to help us<br />
with a back-hoe for two or three<br />
days. We wrote twice but got no<br />
answer. We went to see a councillor<br />
but he said no back-hoe was available.<br />
Then we went to see the<br />
mayor. He was shocked. He had not<br />
been informed. He sent a back-hoe<br />
immediately and we finished the<br />
work in three days.<br />
– Kaoseng resident<br />
Photo credit: “Samrong canal” community<br />
13
14<br />
The idea to clean up the canal came up<br />
in our savings group discussions. At first<br />
each community wanted just to develop<br />
itself. But we wanted to show the<br />
authorities we were not polluters. So we<br />
set up a joint task force. We planted trees<br />
along the canal. We organized seminars<br />
and invited the relevant officials. We<br />
asked business people for help. Most<br />
refused but a few understood and still<br />
support us. We asked NGOs for help.<br />
They found some boats to collect garbage<br />
out of the canal.<br />
In the dry season, the canal got blocked<br />
by sandbar. The water went stagnant<br />
and garbage collects on the bar. People<br />
blamed us for the garbage and pollution,<br />
but really it came from upstream.<br />
Before the monsoon season, we got<br />
together to dig out the sand, otherwise<br />
the houses along the canal would be<br />
flooded. We also cleared up the garbage.<br />
But next dry season, the canal was<br />
blocked again, and the garbage and water<br />
hyacinth piled up. Again we were the<br />
scapegoat. But in fact there was even a<br />
fire in the canal because someone<br />
discharged a lot of oil into it.<br />
We discussed with our NGO friends how<br />
to prevent the pollution. We wrote a<br />
proposal requesting UN support to build<br />
a wooden fence along the banks of the<br />
canal. We also came up with a scheme<br />
to stop the sandbar forming each year.<br />
While we were working on this, some<br />
people saw us from the bridge and<br />
notified the municipality that we were<br />
encroaching on the canal. The Governor 13<br />
ordered the arrest of the community<br />
leaders.<br />
But we did not let them arrest us. We<br />
went to see the Governor ourselves. We<br />
told him that we had good intentions.<br />
We had not consulted the authorities first<br />
because they didn’t seem to care about<br />
13 The Governor is the official head of a<br />
province’s administration, appointed by the<br />
Ministry of Interior.<br />
the canal. They never acknowledged that<br />
factories polluted the canal but always<br />
blamed it on the people. Officials at the<br />
provincial, district, and municipality offices<br />
accepted bribes from the factories. The<br />
factories claimed they treated waste water<br />
before discharging it. But treatment costs<br />
a lot of money. We took the Governor to<br />
see where they discharged the water at<br />
night. How could we prevent that? If we<br />
were not careful, we might be gunned<br />
down. We asked why the Governor did<br />
not take any action. He told us that he<br />
had talked to the factory owners but<br />
nothing happened.<br />
Our discussion with the Governor was<br />
fruitful. He offered to help us. We asked<br />
for 10 million baht. The provincial office<br />
drafted a project proposal on behalf of<br />
the people to dredge the canal and<br />
develop nearby communities. When the<br />
budget was approved, we were very<br />
happy. At that time we thought the<br />
authorities would take care of the factories,<br />
and we would handle the garbage<br />
problem. But then they told us to relocate<br />
101 of our houses. We did not<br />
accept that. We felt that if the canal<br />
could live, so should the people.<br />
We made a survey of all the houses<br />
along the canal. This helped us use facts<br />
and figures to negotiate with the authorities.<br />
Our survey found that only fortyfour<br />
houses needed to be shifted a<br />
little. There was no need to relocate<br />
them. In the end we agreed to move<br />
some houses a bit to make room for a<br />
dredger.<br />
The Department of Social Welfare gave<br />
us two boats to collect garbage. Now<br />
each community looks after its own<br />
section. People upstream still throw their<br />
garbage in the canal but we have built a<br />
barricade to catch it and we clean this<br />
occasionally. Now the canal water is<br />
green and clear.<br />
Government agencies began to understand<br />
us. The provincial clerk even said<br />
his work on the Samrong canal made him<br />
famous and got him promoted to deputy<br />
<strong>THAILAND</strong> <strong>HUMAN</strong> <strong>DEVELOPMENT</strong> <strong>REPORT</strong> <strong>2003</strong>
governor in only one year. He admitted<br />
that he used to think in a bureaucratic<br />
way. He thought the area should be<br />
cleared of houses. Now he sees that he<br />
needs cooperation from the canal people.<br />
After several years of working together,<br />
we think many government officials are<br />
good. They’re not all bad.<br />
Recently we had a ceremony to celebrate<br />
ten years of the rehabilitation project.<br />
Many important people attended. But the<br />
canal is still not as clean as it should be.<br />
Recently a TV programme showed the<br />
factories illegally discharging waste. We<br />
cannot stop them. Only the government<br />
can. But it won’t.<br />
We cannot look after the canal on our<br />
own. The government and the people of<br />
Songkhla need to see the importance.<br />
After all the canal doesn’t belong to the<br />
communities on its banks but to the<br />
people of Songkhla as a whole.<br />
REDISCOVERING LOCAL<br />
KNOWLEDGE IN THE<br />
HIGHLANDS<br />
We want this group to be an example<br />
for the lowlanders to see and<br />
accept that hill people can live with<br />
the forest without destroying it.<br />
– Khun Ta Villager<br />
The north of Thailand is an area of<br />
narrow valleys separated by hill ranges.<br />
One way to see the region is as a<br />
number of different river basins. Each<br />
river starts up on the watershed, falls<br />
down the hill slopes, and emerges onto<br />
the valley floor. Along each basin there<br />
are settlements of different peoples, and<br />
they all in different ways depend on the<br />
river. This section is about one such<br />
river basin – of the Mae Wang, a<br />
tributary of the Ping river in Chiang<br />
Mai province. On the upper slopes,<br />
there are Hmong villages. Further down<br />
are Karen. And on the valley floor are<br />
northern Thai. The story is told by Karen<br />
and Hmong communities in the basin.<br />
THE COMMUNITIES’ VIEW<br />
We Karen have lived in the hills around<br />
here for at least 200 years and maybe<br />
much longer. Back some seven or eight<br />
generations, for instance, a Karen elder<br />
bought a piece of land in Khun Ta village<br />
from the Chiang Mai ruler and paid with<br />
musical instruments, cloth, and a Karen<br />
blanket. There are several stories like this.<br />
Once a map was drawn on leather to<br />
define the area, but it was buried with a<br />
leader when he died.<br />
We have always lived very close to nature.<br />
There’s a Karen saying, “On land we can<br />
smell wild animals, in water we can smell<br />
fish”. We have many traditions which<br />
teach us how to live with nature. Another<br />
saying runs: “We drink from streams, we<br />
must protect streams. We eat from the<br />
forest, we must protect the forest”.<br />
We have always had good relations with<br />
people in the lowlands.<br />
Twenty or so years ago, when a<br />
highlander had some business in the<br />
lowlands, he’d go down and stay in a<br />
lowlander’s home. And if they came<br />
up here, they would stay with us.<br />
We traded and bartered with one<br />
another.<br />
– Huai Somboi village history14 In the old days of opium cultivation, often<br />
Karen and lowlanders cultivated it jointly.<br />
If we had a bad rice harvest, we would go<br />
down the hill and work for rice. If they<br />
had a bad harvest, they would come up<br />
the hill and work for rice.<br />
We Hmong used to live in China. We<br />
have come south over a long period.<br />
According to Headman Kaet who has<br />
done research on the history, groups of<br />
Hmong started coming into the hills here<br />
around 1844. Now we are found in<br />
thirteen provinces. We live in the highland<br />
areas. We grew rice, corn, vegetables,<br />
sugar, yams, and chillis. We kept horses,<br />
cows, sheep, and pigs. Mostly we<br />
14 The villages contributing to this project were<br />
encouraged to compile their village histories,<br />
mainly from the memories of the elders.<br />
15
16<br />
produced for our own use. We had<br />
customs to limit and control what we<br />
produce so that we can live in harmony<br />
with the hills.<br />
Since 1960 we have had to deal with<br />
many new outside forces. The security<br />
forces came into the hills to fight communists.<br />
The government set out a plan to<br />
convert us into Thai citizens which meant<br />
abandoning our own traditions. Soon the<br />
government relaxed and just wanted us<br />
to learn Thai and show loyalty. But<br />
getting official Thai citizenship – an ID<br />
card – became more important.<br />
A Highlanders’ meeting on obtaining Thai citizenship.<br />
Since 1981, the area has come under many<br />
projects to replace opium cultivation with<br />
new crops. The army, the UN, the Thai-<br />
Norway project, and the government have<br />
all been involved. They told us that our<br />
shifting cultivation was destroying the<br />
forest, and that opium was creating<br />
problems for the society and nation. The<br />
projects gave us fertilizers and pesticides<br />
to grow new crops such as coffee, lychees,<br />
cabbages, and Chinese pears.<br />
We got many benefits. We could send<br />
children to school. We got access to health<br />
care. But not everything was good. People<br />
became more selfish. We depended more<br />
on the outside for new goods. Some<br />
people got Thai citizenship but others<br />
didn’t. After the opium eradication<br />
projects ended, some of the supporting<br />
agencies departed. Soon after, we were<br />
criticized for growing things which were<br />
not appropriate for the hills, and for using<br />
too much fertilizer and chemicals.<br />
Photo credit: UNDP Thailand<br />
Planting the crops which these<br />
projects supported was not a good<br />
solution for the villagers, because<br />
after a time it created new problems,<br />
and we were criticized for using too<br />
much chemicals and creating all sorts<br />
of problems for the lowlanders down<br />
below. We began to think that the<br />
problems did not come from what we<br />
Hmong did ourselves, but from what<br />
outsiders encouraged us to do. But as<br />
the problem came down on our<br />
heads, we’d have to find the solution.<br />
– Hmong villager<br />
At that time we were being told to<br />
do many new things. We didn’t<br />
know what was wrong or right. The<br />
outsiders told us this and that. They<br />
brought the fertilizer and chemicals.<br />
It went on like this until the villagers<br />
were forgetting their own crops and<br />
getting interested only in money.<br />
– Joni Odochao, Karen elder<br />
In the early 1990s, the pressure on the<br />
Karen increased. Around then there were<br />
many forest fires. Also loggers were very<br />
active. And the forestry department<br />
began to define more areas as national<br />
parks where nobody was allowed to live.<br />
The biggest shock came on 12 August<br />
1990 when the forestry officials arrested<br />
twenty-two villagers for trespassing on<br />
national park land. The villagers had been<br />
living on that land for generations. But<br />
the forestry department had decided<br />
to apply the strict letter of the forest<br />
conservation law. Since then, there have<br />
been many such incidents, not only<br />
around here but all over the hills.<br />
We were being blamed for destroying<br />
the forest, and we couldn’t allow<br />
this to go on unchecked. We lived<br />
on the hills and we looked after the<br />
forest according to Karen customs.<br />
But the society didn’t know this and<br />
didn’t understand.<br />
– Khun Ta village history<br />
The Highland Conservation Group<br />
was formed in 1992 because the<br />
outside pressure was very strong.<br />
We could see that we would have to<br />
<strong>THAILAND</strong> <strong>HUMAN</strong> <strong>DEVELOPMENT</strong> <strong>REPORT</strong> <strong>2003</strong>
protect ourselves. We would have to<br />
stop doing certain things which were<br />
judged as too much. And we would<br />
have to do more of the things which<br />
were seen as appropriate. That was<br />
the way to survive. So we formed<br />
the group.<br />
– Huai Somboi village history<br />
The Karen leaders from all the villages<br />
in the area, totalling 777 households, held<br />
a meeting to discuss various problems.<br />
This led to the establishment of the<br />
Chomthong Highland Conservation Group.<br />
The first president was a village teacher.<br />
He invited many organizations to become<br />
advisers to the group including the Regional<br />
Centre for Social Development at<br />
Chiang Mai University. The Group created<br />
a travelling forum to explain the objectives<br />
to villages around the area.<br />
The conservation group started in<br />
1992 on the encouragement of<br />
Teacher Kam. It became more effective<br />
after IMPECT 15 donated funds<br />
because it’s difficult to do anything<br />
without some funds. In 1993 we had<br />
many activities including tree ordination<br />
and local sports events. We got<br />
housewives and children involved too.<br />
– Khun Ta villager<br />
We knew that we had the knowledge and<br />
traditions to preserve the forest. But we<br />
were no longer isolated. We were part of<br />
a bigger society. Many people in that<br />
society had been taught to believe that<br />
we were destroying the forests with<br />
opium, slash-and-burn, chemicals, and<br />
cabbages. Just having the knowledge to<br />
preserve the forest was no longer enough.<br />
We had to persuade others in society that<br />
we had that knowledge. And to do that,<br />
we had to pool our resources with other<br />
Karen, other groups in the hills, and with<br />
our friends in the lowlands.<br />
15 The Inter Mountain Peoples Education and<br />
Culture in Thailand Association was established<br />
in 1992 by elders of the Karen,<br />
Iumien, Hmong, Lisu, Lahu and Akha. Its<br />
main objective is to revitalise and apply<br />
indigenous knowledge in all areas of development,<br />
including natural resource and<br />
biodiversity management.<br />
THE COMMUNITIES’ VIEW<br />
In addition to the other problems, in 1993<br />
there was a drought which caused more<br />
forest fires, and problems with people<br />
taking oil and bark from pine trees for sale.<br />
A forum was held at Mae Manao temple<br />
including our own highland representatives,<br />
lowland leaders, the forestry department,<br />
other government organizations,<br />
and some NGOs. The forum decided that<br />
each group should rehabilitate the forest<br />
in its own area. Then on 14 October 1993,<br />
Karen and Hmong met and formed the<br />
Mae Wang River Basin Network.<br />
We got together all the village heads<br />
in the Mae Wang basin. Before, the<br />
forestry officials used to give us training<br />
about fire prevention and control.<br />
The villagers realized we could<br />
organize this ourselves. In 1992 or<br />
1993 we cut the first firebreak.<br />
– Sewa Odochao<br />
We Karen have always divided up the<br />
forest into different areas. The areas that<br />
are crucial for collecting water are defined<br />
as conservation forest. Then there is<br />
sacred forest which again must be preserved.<br />
Then there are village woodlots<br />
which can be used for grazing and collecting<br />
forest products under strict rules.<br />
Then there is useable forest which can be<br />
used for cultivation under a rotation which<br />
always allows the forest to regenerate.<br />
To help others to understand this classification,<br />
we have now made maps, just<br />
like those the government offices use. We<br />
have put up signs to mark different areas.<br />
We have made a model of the whole<br />
basin with the different forest areas<br />
clearly marked, so outsiders can understand.<br />
We defined some areas as nonhunting<br />
areas to preserve the wildlife. We<br />
planted more trees in our conservation<br />
areas. We started cutting firebreaks. In<br />
the dry season we organized guards to<br />
watch for forest fires. We held village<br />
meetings and put up posters. And we<br />
held ceremonies to ordain 16 trees.<br />
16 Traditionally every Thai man spends some<br />
time in the Buddhist monkhood. At the<br />
ordination ceremony, his head is shaved and<br />
he puts on the distinctive ochre-coloured<br />
robe of a monk.<br />
17
Tree ordination – Karen’s belief about the spirits in the forest.<br />
The monk chanted some prayers and wrapped the tree<br />
with ochre-coloured cloth to preserve the forest.<br />
18<br />
Joni Odochao<br />
Photo credit: Dr. Ken Kampe<br />
The first time it was just a simple<br />
ordination. The monk chanted some<br />
prayers and wrapped the tree<br />
with yellow cloth. The villagers did<br />
not participate. But after that we<br />
began to incorporate our own village<br />
ceremonies too.<br />
– Sewa Odochao<br />
We Karen have beliefs about this and<br />
that spirit in the forest. Then the<br />
environmental trend came up. We<br />
had seen trees wrapped with yellow<br />
cloth along the roadside in the lowlands.<br />
These trees were not touched<br />
when the road was widened. We<br />
thought we could adapt this idea. I<br />
heard that Phra Kru (monk) Manat<br />
had ordained trees in 1985. In our<br />
village we had a lot of Buddhists. I<br />
saw it would be useful to do the<br />
ordination here too. We mixed our<br />
own customs in with the ordination.<br />
These customs are in the blood of<br />
the Karen. But if we just followed<br />
our own beliefs, it would not be<br />
broad enough – it wouldn’t make the<br />
society outside understand. So we<br />
used the Buddhist ceremony. It was<br />
like developing our own ceremonies.<br />
Also, our ceremonies are just done in<br />
the village or the household. We had<br />
never done such a thing for the<br />
whole river basin.<br />
– Joni Odochao<br />
Photo credit: Friends of the People (FOP)<br />
The first ceremony<br />
in 1993 was just a<br />
small affair. Then in<br />
1994 several villages<br />
got together to do<br />
it on a larger scale.<br />
We asked a forestry<br />
official to preside.<br />
The monks distributed<br />
the yellow<br />
cloth to the village<br />
representatives, who<br />
then went home<br />
and organized local<br />
ceremonies in each<br />
village. Altogether<br />
we ordained a million<br />
trees.<br />
Then we heard that the forestry department<br />
was planning to plant 50 million<br />
trees to honour the 50 th anniversary of<br />
the King’s reign in 1996. We decided to<br />
ordain 50 million trees for the anniversary.<br />
It was a big event. Many officials and<br />
foreigners came. The whole basin was<br />
involved. We used Buddhist, Karen, and<br />
Hmong ceremonies.<br />
Each time we did the ordination we<br />
became clearer about what we were<br />
doing. After the 50 million tree ordination,<br />
each village went back and<br />
held an ordination in its own forest<br />
area, and defined a conservation<br />
forest area.<br />
– Sewa Odochao<br />
We adjusted some of our rituals so they<br />
are easier to understand, and we invited<br />
others to take part. We have also written<br />
our beliefs and rules down in books, such<br />
as The Seven Layers of the Forest, by Joni<br />
Odochao.<br />
Now we are encouraging the next<br />
generation in the village to know<br />
their own culture, by getting the<br />
elders to pass on their knowledge.<br />
We want to put it in the curriculum<br />
of the school and the kindergarten.<br />
– Khun Ta villager<br />
<strong>THAILAND</strong> <strong>HUMAN</strong> <strong>DEVELOPMENT</strong> <strong>REPORT</strong> <strong>2003</strong>
Still there were some problems in getting<br />
different groups to understand one<br />
another. For instance, along the Mae<br />
Wang river there are several different<br />
communities all of whom depend on the<br />
same river for water. Sometimes there<br />
are misunderstandings. In 1994, different<br />
groups got together to discuss the<br />
problems created by the government’s<br />
establishment of new national parks.<br />
They jointly organized meetings with district<br />
officials. Then when the SIF fund<br />
became available in 1998, the different<br />
groups formed a Mae Wang Network of<br />
eighteen different communities to pool<br />
their efforts in planting trees, cutting fire<br />
breaks, and sharing knowledge. There are<br />
difficulties in bringing these different<br />
groups together. But now there are<br />
monthly meetings so problems can be<br />
aired and jointly solved.<br />
By 1994 we were talking among ourselves<br />
that we couldn’t solve all the<br />
problems within the villages. Then<br />
the NGOs got together and created<br />
NFN [the Northern Farmers Network].<br />
We joined the NFN’s protest march<br />
to Lamphun. 17 At first I didn’t agree<br />
with protest marches. But little by<br />
little I realized they have a point.<br />
– Joni Odochao<br />
In 1992-93 we Hmong had a lot of<br />
problems with forest fires. Some hardline<br />
environmental groups claimed we were<br />
destroying the watershed. They came and<br />
fenced off some land. In October 1993,<br />
Hmong leaders from all over the north<br />
met and formed the Hmong Network.<br />
Several smaller sub-networks were also<br />
established. But at first it was not so<br />
effective. Many people could not see<br />
why we needed this organization. Much<br />
of its time was taken up with efforts to<br />
preserve Hmong culture.<br />
17 The Northern Farmers Network includes<br />
many local groups from both highland and<br />
lowland areas along with academics and<br />
NGOs. It works on many issues, but has<br />
concentrated especially on efforts to pass a<br />
community forestry bill. In 1994 it organized<br />
a march from Chiang Mai to Lamphun to<br />
highlight problems over issues of debt,<br />
nationality, land rights, and access to forests.<br />
THE COMMUNITIES’ VIEW<br />
But in 1998 a forest fire broke out on Doi<br />
Inthanon 18 and again the Hmong were<br />
blamed. People said we grew too many<br />
lychee trees. In July 1998, another big<br />
meeting was held covering all the<br />
communities in and around Chiang Mai<br />
province. The meeting discussed how to<br />
revive Hmong folk wisdom for preserving<br />
the forest. Fourteen villages joined the<br />
network, and gradually it expanded to<br />
thirty-one. We began to make maps and<br />
models of conservation areas, to plant<br />
trees in the watershed areas, to cut fire<br />
breaks, to organize fire watches, to cut<br />
down usage of fertilizer, chemicals and<br />
water, and to revive our traditional ways.<br />
A big Hmong new year celebration was<br />
held in the Chiang Mai sports stadium.<br />
During the ceremony a silver mouthorgan<br />
was presented to the King as a<br />
token of the Hmong’s loyalty to the<br />
nation as Thai citizens.<br />
We also send representatives whenever<br />
there is a public event which allows us to<br />
explain these things. For example we<br />
went to give a presentation on the<br />
Hmong way to conserve and manage<br />
forests, through such rituals as Dong<br />
Cheng when we worship sacred trees.<br />
For a time, our Karen communities lost<br />
the power which they used to have. We<br />
became much more a part of a bigger<br />
society, and we had to accept that. We<br />
were told our old ways were just superstitions<br />
and outdated nonsense. We were<br />
told to grow this and not grow that. But<br />
somehow whatever we did, it wasn’t right.<br />
Eventually we came back to the idea that<br />
maybe our old ways were right after all.<br />
That was the beginning of getting our<br />
power back.<br />
But we had to change too. We had to<br />
learn. We had to be very disciplined. We<br />
had to make sure other people could<br />
understand us. We had to write books,<br />
attend seminars, draw maps, and make<br />
models. We had to build networks – first<br />
18 Doi Inthanon is the highest mountain in<br />
Thailand and very popular as a tourist<br />
destination.<br />
19
20<br />
The Mun is the biggest<br />
river in the northeast. Its<br />
fish have always been a<br />
major source of protein<br />
for the region’s people.<br />
Around 1990, the Electricity<br />
Generating Authority<br />
of Thailand (EGAT) gained<br />
approval to build a small<br />
hydroelectric dam close<br />
to where the Mun joins<br />
with the Mekong river.<br />
Protests against this dam<br />
began soon after and<br />
have continued until<br />
today. The story is told by<br />
the fishing communities<br />
who lived around the site<br />
of the dam.<br />
with our neighbours, then with others in<br />
the same river basin, and then further<br />
afield. We had to invent new organizations<br />
like watershed conservation groups<br />
and basin networks. We had to adjust our<br />
ceremonies for honouring and preserving<br />
the forest so that outsiders would understand.<br />
In short, we not only had to revive our<br />
local knowledge and culture but also<br />
reinvent it so that the community could<br />
recover its pride. But still there are big<br />
limits on how much we really feel empowered.<br />
The government must accept<br />
the community rights to manage natural<br />
resources in the 1997 constitution.<br />
EXPANDING SOCIAL SPACE<br />
TO RECLAIM THE MUN RIVER<br />
We know that the thing which has<br />
made us poor is not that we’re idle<br />
and don’t want to work. We’re poor<br />
because of “development”. Because<br />
the development that took place<br />
destroyed the natural resources we<br />
depended on. We live with nature –<br />
with water, land, forest. When this<br />
valuable property is seized or destroyed,<br />
it’s like our own breath is<br />
seized or destroyed.<br />
– Mun river villager<br />
Mun river communities use a variety of fishing equipments.<br />
Photo credit: Friends of the People (FOP)<br />
A big catch after the opening of the sluice gate.<br />
The Mun river has fed the people in the<br />
region for centuries. Every year, many fish<br />
swim up from the Mekong river to breed<br />
in the Mun. It has a rocky bed with little<br />
caves and crevices where the fish live and<br />
lay eggs. There are lots of insects and<br />
weeds for the fish to feed. There have<br />
always been fishing communities who<br />
exchange fish for rice with the local<br />
farmers.<br />
Our life depends on the river, on<br />
what’s in the water. We have peace<br />
and contentment when we have fish.<br />
So our tradition is to protect the<br />
river, appreciate its value, give it respect<br />
like the mother who gives us<br />
life. Every year we join in ceremonies<br />
to pay our respects to the river, and<br />
to apologize for any harm we have<br />
done. We only take from the river<br />
what we need. We use equipment<br />
we know won’t destroy the stocks.<br />
We pass this knowledge down from<br />
generation to generation. This is a<br />
way of life that is sustainable. Our<br />
families have always been close and<br />
warm.<br />
– Mun river villager<br />
<strong>THAILAND</strong> <strong>HUMAN</strong> <strong>DEVELOPMENT</strong> <strong>REPORT</strong> <strong>2003</strong><br />
Photo credit: Friends of the People (FOP)
The river was our bank. Whenever we<br />
needed money or food we just took our<br />
fishing equipment to the river. Some<br />
people had children in school so they had<br />
to catch more to make extra money.<br />
Many people here “sold fish to buy their<br />
children’s education”. Some children grew<br />
up to be government officials.<br />
There is a legend that the fish in the Mun<br />
river would never be depleted. Before<br />
they came to the human world, the fish<br />
swore they would sacrifice themselves for<br />
humans and would never let us starve.<br />
But there is another prophecy that “all the<br />
fish and crabs will one day return to<br />
Vientiane; nothing will be left but frogs,<br />
which will also leave in the following<br />
year”.<br />
When EGAT 19 started the Pak Mun 20 dam<br />
project in 1990, we knew nothing about<br />
it. We did not have a chance to participate<br />
in the decision-making. We learned<br />
19 The Electricity Generating Authority of<br />
20<br />
Thailand.<br />
Named because the dam is near the mouth<br />
(pak) of the Mun river.<br />
THE COMMUNITIES’ VIEW<br />
Photo credit: Friends of the People (FOP)<br />
from the tambon chief and the village<br />
headman that the dam would make it<br />
possible to grow rice twice a year, bring<br />
lots of fish, and produce electricity.<br />
They put up posters before the construction.<br />
Only a handful of people<br />
knew that the fish would be gone.<br />
They told us that the dam would<br />
bring fish all year round. They would<br />
also introduce some expensive fish in<br />
the area.<br />
– Mun river villager<br />
They said that electricity was important<br />
for economic growth. When we<br />
had the dam, our lives would be<br />
better. Farming and fishing would be<br />
better.<br />
– Mun river villager<br />
Some villagers were invited to visit other<br />
dams, but were shown only the positive<br />
side. We were fed with loads of information<br />
to make us accept the project.<br />
People who sided with the project were<br />
treated very well. They went on trips and<br />
workshops and were given good food<br />
and even money sometimes. Asphalt<br />
roads were built to the villages as a first<br />
sign of the progress that the dam would<br />
bring.<br />
Some people began to have doubts. They<br />
knew what happened at another dam<br />
built some years ago just 20 kilometres<br />
away. We started demanding information,<br />
especially about the impact, about the<br />
resettlement plan. We talked to people<br />
who were victims of this other dam. Their<br />
communities were relocated to places<br />
where the soil was rocky and infertile.<br />
People could not adjust to the new way<br />
of life. Some left for the city. Some sold<br />
their buffaloes. Nobody seemed to care<br />
what happened to them.<br />
At first just a few people came together,<br />
discussed issues, and searched for solutions.<br />
We passed on our concerns to<br />
others by word of mouth. We walked<br />
from village to village to talk with people.<br />
We used our network of relatives. And<br />
we were scared. We had never interfered<br />
with the authorities’ work in the past. But<br />
we had to overcome our fear to protect<br />
our river and our livelihood.<br />
21
22<br />
We used various methods to win acceptance<br />
from the public. We distributed<br />
pamphlets and organized meetings but it<br />
was difficult because the authorities tried<br />
to obstruct us. We approached local<br />
officials. We went to see local politicians.<br />
We gathered at the provincial office to<br />
submit our petition asking for a review of<br />
the project. But nothing happened. We<br />
asked to speak with the people in charge<br />
so we could tell them what would<br />
happen if they blocked the river. We<br />
organized some protests.<br />
We got nowhere. We weren’t allowed<br />
access to information. Not one local MP<br />
raised a hand to help us. Some people<br />
were arrested, and others were beaten –<br />
even elderly people. Thugs from other<br />
villages came to intimidate and hurt us.<br />
The community split into those for and<br />
against the dam. This conflict didn’t start<br />
within the community. It was brought from<br />
outside by people with power and money.<br />
When development<br />
arrived so did conflict,<br />
even within<br />
families. Villagers<br />
who used to support<br />
one other and live<br />
happily together had<br />
different ideas. Some<br />
wanted to protect<br />
their land and the<br />
natural surroundings<br />
while others wanted<br />
money. Some sold<br />
their land to speculators.<br />
– Mun river villager<br />
Then they started construction. When<br />
they dynamited the rapids we thought<br />
the Laotian army was invading. We knew<br />
the fish would disappear.<br />
We came to understand that the society<br />
was being fed bad information through<br />
the media. We had to expand our<br />
alliance beyond the local communities.<br />
We had to explain our problems to<br />
other people. We started going out<br />
to talk to people about our lives.<br />
This made us learn how to explain<br />
ourselves clearly. We felt we were<br />
being treated unfairly and taken<br />
advantage of. We gradually became<br />
more confident in our ability to talk<br />
to journalists, academics, NGOs,<br />
environmentalists, and fair-minded<br />
people from here and overseas.<br />
– Mun river villager<br />
After some protests, they gave us some<br />
compensation for the three years when<br />
we could not fish because of the construction.<br />
But they said there would be<br />
even more fish when the dam was<br />
complete. They would stock the area<br />
above the dam. They were building a fish<br />
ladder so fish could still swim up from the<br />
Mekong to breed.<br />
But when the dam was completed in<br />
1994, many types of fish disappeared. We<br />
could not fish downstream from the dam<br />
Fish ladder at Pak Mun Dam.<br />
because strong currents damaged our<br />
equipment. We could not fish upstream<br />
because fish could not jump the fish<br />
ladder. People found they itched after<br />
bathing in the river. Sediment filled the<br />
cataracts. The river bank was covered by<br />
water hyacinth and giant weed.<br />
There used to be plenty of fish, crabs,<br />
natural cataracts, and food sources.<br />
But these things are gone. We can<br />
no longer fish. We have no chance<br />
<strong>THAILAND</strong> <strong>HUMAN</strong> <strong>DEVELOPMENT</strong> <strong>REPORT</strong> <strong>2003</strong><br />
Photo credit: The Nation
to teach our children and grandchildren<br />
our heritage. Our culture and<br />
tradition has been swallowed just like<br />
the crabs and fish. This has created<br />
devastation, anger, hatred, and conflict.<br />
People will kill each other. How<br />
will our future generations live? How<br />
do we make the world understand<br />
about this destructiveness? Where is<br />
our old community and old way of<br />
life? Why did it disappear, and who<br />
has done this to us?<br />
– Mun river villager<br />
In 1995, we formed an alliance with those<br />
affected by dams all over the country,<br />
along with farmers, fishermen, and slumdwellers<br />
affected by other government<br />
projects. These groups came together under<br />
the Assembly of the Poor. 21 Through<br />
these networks, we learned that a large<br />
number of people were unfairly affected<br />
by “development”. These people also lost<br />
their livelihoods and their rightful access<br />
to natural resources. We came to realize<br />
that we could not rely on the bureaucracy.<br />
It was slow and never understood<br />
us. We had to prepare ourselves to<br />
negotiate with the government. We had<br />
to present our data well so that the<br />
government did not rely solely on the<br />
bureaucracy’s data. We organized activities<br />
in the villages, at the dam site, at<br />
the provincial offices, and around Government<br />
House. We practised non-violence<br />
and had to endure misunderstanding,<br />
criticisms, false accusations, distortion.<br />
Government still wouldn’t listen to us.<br />
Finally we came up with a new way<br />
to make the society understand our<br />
problems. We went back to the site<br />
of our old community, which had<br />
been taken over as part of the dam<br />
construction and which had been<br />
21 The Assembly of the Poor was formed in<br />
December 1995 as an alliance of local networks<br />
all over the country. It compiled the<br />
demands of all these groups into one<br />
agenda, and brought representatives of all<br />
the local groups to Bangkok to present the<br />
agenda to government.<br />
THE COMMUNITIES’ VIEW<br />
A Pak Mun protester at the Democracy Monument in Bangkok.<br />
dynamited. We set up a new community<br />
and called it muban mae mun<br />
man yuen, Sustainable Mun Village.<br />
Villagers from other affected places<br />
came to join us. Villagers have no<br />
way to oppose state power except<br />
solidarity, resolution, endurance, and<br />
discipline.<br />
– Mun river villager<br />
At first we had been asking for compensation.<br />
After all, that was what other protests<br />
demanded. But in a brainstorming<br />
session, we came to realize that what we<br />
really wanted was to have the river back.<br />
So we asked that the dam gates be<br />
opened so that fish could swim up from<br />
the Mekong river to spawn as they used<br />
to. We also demanded the rehabilitation<br />
of the cataracts and islets that were<br />
destroyed during the construction.<br />
More and more groups came out to<br />
support us, both in Thailand and around<br />
the world. But still the authorities would<br />
not budge. We started a second Sustainable<br />
Mun Village at the electricity plant,<br />
but the dam staff got angry. We came to<br />
Bangkok to see the prime minister but<br />
many were arrested for climbing over the<br />
Government House fence. Finally the<br />
government agreed to open the dam<br />
gates for four months as an experiment.<br />
Photo credit: Bangkok Post<br />
23
24<br />
The World Commission on Dams 22 made<br />
a study that concluded the dam should<br />
not have been built. When a new government<br />
came in, we went to Bangkok again.<br />
This time they agreed to open the gates<br />
for a year.<br />
The islets reappeared. The cataracts came<br />
back. We caught fish again. For us, it was<br />
just like opening a bank again. Our community<br />
slowly came back to life. People<br />
forgot old conflicts. Our kids came back<br />
from the city and began learning how to<br />
fish again. We didn’t need to worry<br />
where the next meal was coming from. If<br />
the gates could stay open, nature would<br />
heal itself.<br />
Government asked two universities to do<br />
research to help decide whether the gates<br />
should be opened or closed. But why<br />
should only academics do research?<br />
Fish came back. Nature came back.<br />
And our life came back too. We realized<br />
we had to make a record. If<br />
others did the research, it would<br />
never be complete and correct. City<br />
people don’t know about rivers, fish<br />
and rapids like we do. They would<br />
have to ask us for the information<br />
anyway. So better to do it ourselves.<br />
– Mun river villagers in the research project<br />
We chose the eighteen most knowledgeable<br />
fishermen along the river. An NGO<br />
gave some help with writing. First we<br />
had to make a list of all fish and plants<br />
that used to thrive in the Mun. The list<br />
had 265 fish species. Then we recorded<br />
all that were found after the gates were<br />
opened. So far we have found 145 local<br />
fish and around 50 types of plant have<br />
22 The World Commission of Dams was established<br />
at the instigation of the World Bank<br />
to review dam projects all over the world.<br />
Pak Mun was one of its case studies. This<br />
case study concluded: “if all the benefits and<br />
costs were adequately assessed, it is unlikely<br />
that the project would have been built<br />
in the current context”. WCD Case Study:<br />
Pak Mun Dam in Mekong Basin, Thailand,<br />
September 2000, xi.<br />
come back. We call this “grassroots village<br />
research”. We will present it to the<br />
government.<br />
But we also know the struggle is not yet<br />
over. We have to find other ways of making<br />
our community stronger and more<br />
self-reliant, by reviving the nature around<br />
us. We set up twenty-one groups. One<br />
learnt how to make organic fertilizer. Another<br />
looked at ways to improve our local<br />
forests. And so on. We need to make the<br />
community stronger so we can survive<br />
and continue to demand our rights.<br />
But in June 2002 the dam gates were<br />
closed again. The government committee<br />
recommended the gates be closed for<br />
eight months of the year. It took this<br />
decision before our research was finished,<br />
before even the universities’ research was<br />
finished. Our lives are still uncertain.<br />
After another round of protest and negotiation,<br />
the government confirmed the<br />
decision in early <strong>2003</strong> to close the sluice<br />
gates for eight months of the year.<br />
We have protested against the dam<br />
for many years, but the government<br />
has continued to ignore us. We hope<br />
to go back to the old way of making<br />
a living, to have prawn, shellfish, crab,<br />
and fish in the river to catch and eat.<br />
We hope to fish everyday. So we<br />
would like to see the dam removed<br />
or the gates left open. We don’t<br />
want money. Just give us back<br />
nature the way it was. We will stop<br />
our protest. That would be a beautiful<br />
end to this story.<br />
– Mun river villager<br />
Over the ten years of the protest, we<br />
learnt how a community that had been<br />
torn part and almost crushed could become<br />
strong again. We became much<br />
tighter. We recovered our ability to communicate<br />
and negotiate with the government<br />
to change its development policy.<br />
We are a very peripheral group. But we<br />
learnt how to make the society understand<br />
how development damaged environment<br />
and society. We know we have<br />
to protect the environment and defend<br />
our rights to livelihood. We are proud of<br />
our knowledge about the Mun river. We<br />
<strong>THAILAND</strong> <strong>HUMAN</strong> <strong>DEVELOPMENT</strong> <strong>REPORT</strong> <strong>2003</strong>
are proud we can inform people in<br />
general about the impact of the Pak Mun<br />
dam on the environment, on livelihoods,<br />
and on the fish.<br />
In truth we have power in the community.<br />
For example, just give us one<br />
fishhook and we can catch fish to<br />
eat. A fishhook is power. All our<br />
customs and traditions are power.<br />
– Mun river villager<br />
CONCLUSION: STRATEGIES<br />
OF EMPOWERMENT<br />
The aim of this chapter was to let the<br />
communities tell their own histories, and<br />
recount their own strategies of empowerment.<br />
To conclude, we will note some of<br />
the key themes running through these<br />
accounts.<br />
All of these communities have a sense of<br />
loss as a result of the rapid destruction of<br />
the natural environment on which they<br />
depend for livelihood. In addition, many<br />
have an ambivalent perception of “development”.<br />
They acknowledge they had often<br />
gained significant benefits (education,<br />
health care). But they also feel they have<br />
been pushed around, they have been<br />
asked to “sacrifice” their livelihood, their<br />
local knowledge has been denigrated or<br />
ignored, and the result is a loss of selfconfidence.<br />
In sum, they have lost the<br />
ability to control their own lives. They<br />
feel disempowered.<br />
Communities articulate the reversal of<br />
this process in Thai as kan fuenfu<br />
phalang amnat chumchon (reviving community<br />
power). Whereas “empowerment”<br />
in English is imprecise, the Thai clarifies<br />
that this is the revival or recovery of<br />
something that has been lost.<br />
This idea of revival relates to an image<br />
of the past in which resources were<br />
abundant and communities were strong<br />
because of close ties, discipline, and<br />
social ethics of sharing. In the villagers’<br />
accounts, these two elements – the abundant<br />
resource base and the community<br />
strength – are closely interrelated.<br />
THE COMMUNITIES’ VIEW<br />
Whether this image is realistic or romantic<br />
is of no importance. The memory<br />
expresses a social ideal, and acts as a<br />
guide and inspiration for future action.<br />
Communities see empowerment as a<br />
process of learning. This process begins<br />
from studying their own problems, learning<br />
how to work together as a community,<br />
and reviving local knowledge. This<br />
initial stage then restores the community’s<br />
self-confidence to search for new forms of<br />
knowledge, to build networks beyond the<br />
community, and to deal more effectively<br />
with government and with other forces<br />
in the wider society. The result of this<br />
learning process is a new body of knowledge<br />
which is based on the community’s<br />
morality and which is relevant to practical<br />
everyday experience.<br />
With this body of knowledge, the communities<br />
can confront the consequences<br />
of development. They pursue three<br />
strategies which build on one another in<br />
succession.<br />
1. Building their community’s power<br />
to solve problems independently.<br />
Rebuilding a foundation of greater<br />
self-reliance is seen as a necessary<br />
first step. Self-reliance does not<br />
mean withdrawal or autarky. All<br />
these communities show a strong<br />
sense of having to accept the world.<br />
Rather, it means reducing forms<br />
of dependence which disempower.<br />
In Headman Wibun’s approach, selfreliance<br />
at the household level is a<br />
Photo credit: UNDP Thailand<br />
25
26<br />
strategy to reduce the exposure to<br />
risk, debt, and other forms of dependence.<br />
The Bank of Life extends<br />
the same principle to the community<br />
level by providing not only financial<br />
services but also welfare and a<br />
base for other community projects.<br />
Greater self-reliance also means the<br />
recovery or re-valuation of local<br />
knowledge. The Karen and Hmong<br />
in the highlands resurrect their<br />
knowledge of the forest in order to<br />
reduce their exposure to confusing<br />
and often flawed advice from outside.<br />
Recovering local knowledge is<br />
also the beginning of reviving the<br />
self-confidence to learn, adopt, and<br />
adapt.<br />
2. Building their community power to<br />
negotiate cooperation with outside<br />
agencies. Communities negotiate<br />
with government (and other centres<br />
of political and economic power) to<br />
win recognition, resources, and cooperation.<br />
To succeed in such negotiation,<br />
communities have to create<br />
some social assets with which to bargain.<br />
The Samrong canal communities<br />
reinvented themselves as antipollution<br />
agencies, not only to improve<br />
their immediate environment,<br />
but also to bargain with government<br />
for rights to occupy the canal bank.<br />
Another key strategy for such negotiation<br />
is to expand networks among<br />
neighbouring communities. The<br />
Karen and Hmong in Mae Wang<br />
started by getting neighbouring communities<br />
together and then gradually<br />
expanded the range.<br />
3. Building their community power<br />
and networks to claim and protect<br />
community rights. Communities’<br />
ability to maintain their livelihood<br />
and way of life is limited by the<br />
power of other social forces. To overcome<br />
these barriers, communities<br />
have learnt how to claim rights,<br />
particularly rights of access to natural<br />
resources. To strengthen those<br />
claims, they need the support of<br />
others. By building networks outwards<br />
from the community to the<br />
broader society, the communities can<br />
kayai pun thi tang sangkhom (expand<br />
their space in the society), and try to<br />
overcome the disempowerment of<br />
their status as a minority or subordinate<br />
group. This is done in several<br />
ways. The Mae Wang hill communities<br />
and the Pak Mun fishing communities<br />
expanded their networks beyond<br />
the immediate neighbourhood<br />
to include similar communities elsewhere<br />
in the region and the nation.<br />
They tapped other resources in<br />
Thailand’s growing civil society by<br />
making links with NGOs, sympathetic<br />
academics, and media professionals.<br />
To do so, they had to acquire new<br />
skills, and had to be creative in the<br />
ways they adjusted and represented<br />
their own knowledge and culture.<br />
The hill communities learnt how<br />
to reconceptualize their traditional<br />
claims on natural resources in the<br />
modern language of rights. They<br />
adapted their ceremonies honouring<br />
trees to reflect modern environmental<br />
concerns and couched them in a<br />
Buddhist idiom to appeal to the<br />
wider society. Through these strategies,<br />
these communities were able to<br />
make public their claim of the right<br />
to livelihood, the right to development.<br />
Finally, it is worth noting something which<br />
does not figure in these stories from the<br />
grassroots. First, there is no sign of a<br />
“representative of the people”, of an MP or<br />
elected member of local government.<br />
Second, there is no reference to the use<br />
of legal process. On the basis of these<br />
examples, we would have to conclude<br />
that formal democracy and the legal<br />
system are not effective means of community<br />
empowerment in a direct sense. 23<br />
In the next chapter, we place the communities’<br />
own view of their history into the<br />
wider context of the nation, and then<br />
look at how pressure from communities,<br />
their supporters, and other social forces<br />
have begun to change the institutional<br />
context.<br />
23 The indirect importance of democratization<br />
will be considered in chapter 2.<br />
<strong>THAILAND</strong> <strong>HUMAN</strong> <strong>DEVELOPMENT</strong> <strong>REPORT</strong> <strong>2003</strong>
The democracy we have today is a<br />
forum for those with power and<br />
privilege, for the bankers and industrialists.<br />
It isn’t a forum for the small<br />
farmers, the slum-dwellers, those<br />
with AIDS, and all those many others<br />
who are socially disadvantaged and<br />
deprived.<br />
– Nithi Eiewsriwong24 The late 1990s saw a series of changes<br />
in the institutional context of Thai<br />
government which have the potential to<br />
revolutionize the relations between state<br />
and society. These institutional changes<br />
have great importance for community<br />
empowerment.<br />
This chapter is divided into four sections.<br />
The first sketches the emergence of a<br />
highly centralized state, and its adoption<br />
of top-down development planning from<br />
the 1950s onwards. The second section<br />
sets the history of local communities,<br />
as related in chapter 1, within the larger<br />
context of the nation’s social and economic<br />
change, and shows how a community<br />
voice contributed to the pressure for<br />
institutional change in the 1990s.<br />
The third section examines four main<br />
changes in the institutional context which<br />
have taken place since the mid-1990s<br />
and which have relevance for community<br />
empowerment: the “People’s Constitution”<br />
of 1997; the switch to “people-centred<br />
development” in the Eighth and Ninth<br />
Economic and Social Development Plans;<br />
democratic decentralization; and education<br />
reform.<br />
The fourth section discusses certain ways<br />
in which the potential of these reforms<br />
have not been realized. Although the<br />
environment for community empowerment<br />
has changed significantly, there is<br />
still a great degree of inertia or outright<br />
opposition carried over from Thailand’s<br />
conservative traditions.<br />
CENTRALIZATION AND<br />
TOP-DOWN <strong>DEVELOPMENT</strong><br />
The institutional changes in the 1990s<br />
are remarkable because they represent a<br />
concerted and broad challenge to the<br />
centralized, top-down, and urban-biased<br />
character of Thai government over the<br />
previous century.<br />
The modern Thai state constructed at the<br />
turn of the twentieth century was highly<br />
centralized. The basic administrative<br />
system was adopted from neighbouring<br />
colonial territories, and remained unchanged<br />
even after similar systems had<br />
been swept away by decolonization<br />
elsewhere. 25 The absolute monarchy was<br />
converted into a constitutional monarchy<br />
in 1932, but the administrative frame was<br />
largely untouched. American academics<br />
CHAPTER<br />
THE NEW INSTITUTIONAL CONTEXT FOR<br />
COMMUNITY EMPOWERMENT<br />
24 Nithi Eiewsriwong, Khon Jon and Nayobuy<br />
Kan Tam Hai Jon Kong Rath (The Poor and<br />
the State’s Impoverishment Policy) Thailand<br />
Development Support Committee, 2000.<br />
THE NEW INSTITUTIONAL CONTEXT FOR COMMUNITY EMPOWERMENT<br />
25 Thailand was never formally colonized and<br />
hence experienced no popular movement<br />
against colonial rule and colonial ruling<br />
systems.<br />
2<br />
The democracy<br />
we have today is<br />
a forum for those<br />
with power and<br />
privilege, for the<br />
bankers and<br />
industrialists.<br />
– Nithi Eiewsriwong<br />
27
This concern with<br />
urban growth and<br />
national security<br />
pushed other goals –<br />
such as participation,<br />
environmental<br />
protection, and<br />
equity – to the<br />
sidelines.<br />
28<br />
in the 1960s invented the term “bureaucratic<br />
polity” to describe Thailand’s officialdominated<br />
governmental system. Pressure<br />
for democratic parliaments was<br />
blocked by the rise of military dictatorship<br />
which continued into the Cold War era.<br />
Student protests in 1973-6 prepared the<br />
way for a gradual transition to parliamentary<br />
democracy in the 1980s. But there<br />
was still no significant reform of the<br />
public services. In particular, observers of<br />
rural administration in the 1990s claimed<br />
that the “bureaucratic polity” was as<br />
strong as ever in the provinces. Until very<br />
recently, the Thai state was both very<br />
centralized and undemocratic. A paternal<br />
mentality is etched into the bureaucracy.<br />
This centralized and bureaucratic system<br />
adopted a top-down and urban-biased<br />
approach to economic development. The<br />
first development plan was launched in<br />
1961. This plan and all its successors until<br />
the mid-1990s put the priority on economic<br />
growth achieved primarily through<br />
the development of industry and the<br />
urban economy under private enterprise.<br />
Government’s role was to develop the<br />
basic infrastructure for growth – transport,<br />
energy, irrigation – and to encourage<br />
investors, domestic and foreign, through<br />
promotional packages, strategies to lower<br />
wages, and efforts to boost investor<br />
confidence. In their own terms, these<br />
plans can be considered a signal success.<br />
Thailand achieved an average real growth<br />
rate of 7.5 per cent sustained over<br />
four decades (1957-97). The average<br />
per capita income multiplied seven times.<br />
The proportion classified below the<br />
poverty line fell from 57 per cent (1962/3)<br />
to 6 per cent (1998). Thailand was transformed<br />
from one of the more backward<br />
and agrarian countries of Eastern Asia into<br />
a candidate for Newly Industrializing<br />
Country (NIC) status.<br />
Through the 1960s and 1970s, against the<br />
background of the Indochinese conflict<br />
and internal insurgency, economic policymaking<br />
was also geared to national security.<br />
Economic growth and the creation of<br />
a strong entrepreneurial class were seen<br />
as ways to preempt political conflict.<br />
Business organizations were formed to<br />
influence policy-making, especially the<br />
“Big Three” – the Board of Trade, Thai<br />
Bankers Association, and Federation of<br />
Thai Industries. Businessmen also gained<br />
a voice in the drafting of the five-year<br />
plans. Military rulers and business leaders<br />
became linked in webs of political and<br />
economic influence. From the early<br />
1980s, businessmen dominated the parliaments<br />
and frequently commanded the<br />
economic ministries. Multinational companies,<br />
which entered Thailand in growing<br />
numbers, added to the trend towards<br />
centralization, urban bias, and business<br />
dominance.<br />
This concern with urban growth and<br />
national security pushed other goals –<br />
such as participation, environmental protection,<br />
and equity – to the sidelines. In<br />
1975, at the climax of the Indochinese<br />
war, the government launched a plan to<br />
channel money to the grassroots as a way<br />
to stimulate the economy and spread the<br />
benefits more widely. But once this crisis<br />
passed, government returned to top-down<br />
approaches. In the 1980s, poverty eradication<br />
became a more significant part of<br />
the planning agenda. The Fifth Plan<br />
(1982-86) included a poverty plan which<br />
identified the 12,555 poorest villages for<br />
special treatment inspired by the Basic<br />
Needs approach. But such efforts were<br />
handled by central agencies with little<br />
concession to participation.<br />
Outside development agencies largely<br />
conformed to this pattern of development.<br />
They concentrated on building<br />
the capability of government agencies<br />
and other centralized institutions. They<br />
showed little enthusiasm for working with<br />
local groups or non-governmental organizations.<br />
Development was growth-based, topdown,<br />
industry-led, and urban-biased. The<br />
high rate of growth came at a considerable<br />
cost, particularly in terms of the<br />
destruction of the natural environment,<br />
relocation of people, neglect of agriculture,<br />
and widening of the gap between<br />
rich and poor. In the 1990s, demands<br />
for greater political openness and social<br />
justice challenged both the political<br />
framework and the direction of economic<br />
policy.<br />
<strong>THAILAND</strong> <strong>HUMAN</strong> <strong>DEVELOPMENT</strong> <strong>REPORT</strong> <strong>2003</strong>
COMMUNITY HISTORIES AND<br />
INSTITUTIONAL CHANGE<br />
In many ways Thai communities are<br />
exactly like any other – groups of people<br />
which congregate for survival, defence,<br />
mutual aid, and other social benefits. But<br />
in other ways they are the product of<br />
their special history. The communities’<br />
great sense of loss from the destruction<br />
of the natural environment, which figures<br />
so prominently in the previous chapter, is<br />
best understood in this historical context.<br />
Thai communities experienced an age of<br />
great abundance and freedom which very<br />
abruptly came to an end. The memory of<br />
that era, and the contrast with the era of<br />
“development”, has inspired a community<br />
role in a broader civil society movement<br />
which triggered institutional change in<br />
the 1990s.<br />
The age of abundance<br />
Less than two centuries ago, most of the<br />
space occupied by modern Thailand was<br />
unpopulated. Most people were settled<br />
near a few urban centres and bound by<br />
feudal ties. Over the nineteenth century<br />
these feudal ties broke down, and a newly<br />
free peasantry expanded into large tracts<br />
of unoccupied land. Siam became an<br />
exporter of rice but farmers were only<br />
loosely connected to the market. They<br />
exploited the great abundance and<br />
biodiversity of the environment. They<br />
continued to use local knowledge and<br />
local technology. No outside force –<br />
government or merchant – intruded to<br />
change production systems. Until the<br />
mid-twentieth century, even in the most<br />
advanced central region, communities still<br />
produced primarily for their own use,<br />
and sold only the surplus. They bought<br />
some goods from the expanding market,<br />
but they also retained local crafts like<br />
weaving. As the stories in chapter 1<br />
showed, this period of abundance and<br />
independence lasted long enough to<br />
remain part of the cultural memory down<br />
to the present.<br />
THE NEW INSTITUTIONAL CONTEXT FOR COMMUNITY EMPOWERMENT<br />
As a result of this frontier experience,<br />
most communities are very new. Many<br />
people moved to the new land frontier.<br />
Others migrated from neighbouring countries<br />
voluntarily or forcibly because of war.<br />
Several millions came from China to settle<br />
in towns and villages. The land frontier<br />
continued to expand until the late 1980s.<br />
Over 80 per cent of rural communities<br />
have been founded in the past two<br />
generations. Urban communities are even<br />
newer as the big movements from village<br />
to city have taken place since 1980.<br />
That means very few Thai communities<br />
have a long history in the same place.<br />
There is no strong concept of an “ancestral<br />
village”. But that does not mean<br />
community is not important. Indeed, people<br />
usually move in community groups.<br />
They need to cooperate for defence<br />
and survival. Communities are bound<br />
together by kin ties. In others, people<br />
simply treat their neighbours as if they<br />
were connected by blood. They have<br />
cultural techniques to define and bind<br />
people together – a central village pillar,<br />
village and ancestral spirits, annual festivals<br />
to redefine the community. These<br />
are highly portable. In the north, exceptionally<br />
strong communities are built<br />
around the cooperation needed for irrigation.<br />
In the northeast, strong communities<br />
are created by the sheer difficulties of<br />
survival in a harsh environment.<br />
The coming of development<br />
The communities faced big changes from<br />
the 1950s onwards. Government entered<br />
to develop agriculture for export. It promoted<br />
new technologies of seed, mechanization,<br />
and chemicals in place of local<br />
practice. It advocated monocultures in<br />
place of mixed farming. Villagers were<br />
more tied to the market, and more<br />
vulnerable to its risks.<br />
Local communities were much more<br />
subject to government direction. Government<br />
set up new central offices to<br />
direct economic policy. The bureaucracy<br />
multiplied in size (from 75,000 in<br />
1944 to 250,000 in 1965). Officials were<br />
posted to the villages and local towns.<br />
Thai communities<br />
experienced an age<br />
of great abundance<br />
and freedom which<br />
very abruptly came<br />
to an end.<br />
29
30<br />
Communities were now subordinate to a<br />
new group of people whose difference<br />
from the villagers was symbolized by their<br />
uniforms and their grand new offices.<br />
The communities’ own knowledge was<br />
downgraded by new knowledge issuing<br />
from the government, from schools, and<br />
from radio and TV. Communities became<br />
receivers of knowledge.<br />
This era of development coincided with<br />
the Cold War and the fear that Maoist<br />
communism would infiltrate into Thai<br />
villages. Government imposed a firm grip<br />
on rural society through police, military<br />
units, and informal means. Local leaders<br />
and local organizations were often<br />
crushed. The era of dictatorship and<br />
development cultivated a new breed of<br />
local “godfathers” or “dark influences” –<br />
robber baron capitalists who used links to<br />
the power elite to dominate new commercial<br />
opportunities, legal and illegal.<br />
Community Thinking<br />
Thinking about the role of the community in development practice began<br />
in the late 1970s among pioneers of grassroots development work,<br />
especially Niphot Thianwihan. From his experience with hill communities<br />
and other peripheral groups, Niphot argued that development strategies<br />
which imposed change on villages were wrong-headed. Development,<br />
Niphot argued, should build on the culture, history, and ethics of<br />
the community itself. In the late 1980s a historian, Chatthip Nartsupha,<br />
reviewed writings by Niphot and others, and dubbed it the “community<br />
culture” approach. His article, published in Thai and English, propelled these<br />
ideas into a wider debate.<br />
Although the community approach was fiercely criticized by some for<br />
being romantic and backward-looking, its influence on development<br />
activists grew. Several prominent figures contributed to the debate. Saneh<br />
Chamarik, an academic who retired from the university to run local<br />
development projects, argued that the community was important because<br />
it symbolized important human values of mutual assistance and ethical<br />
conduct. Both Saneh and Prawase Wasi, a medical doctor involved with<br />
health NGOs, associated the community with values found in Buddhism –<br />
especially the restraint of greed. This Buddhist approach argued that<br />
communities should pursue “sufficiency” and “self-reliance”.<br />
In a different direction, Anan Ganjanaphan, an academic active on hill<br />
people’s issues, argued that the “community culture” approach was too<br />
passive, and that self-reliance was impossible for many villagers because<br />
they lacked access to natural resources. He encouraged communities to<br />
adopt the idea of rights in order to defend or recover access to land, forests,<br />
and water. Others like Pitthaya Wongkun and Narong Petprasert promoted<br />
the idea of “community businesses” designed to enhance the well-being of<br />
the community rather than simply make a profit.<br />
The results were very dramatic. Agriculture<br />
expanded rapidly. Population<br />
boomed. The environment was radically<br />
altered, especially by the destruction of<br />
forests and the pollution of waterways.<br />
Many villagers became more prosperous,<br />
but at the same time there was a rising<br />
level of risk. Debt increased. The land<br />
frontier ran out. The income gap<br />
between rich and poor, the cultural gap<br />
between village and city, and the power<br />
gap between bureaucracy and community,<br />
all gaped wider.<br />
New ideas and organizations<br />
Reactions began in the 1970s and<br />
expanded in the 1980s as the Cold War<br />
subsided, the extent of environmental and<br />
social damage became apparent, and as<br />
local people were emboldened to resist.<br />
The first stirrings came around 1970.<br />
“Development” monks encouraged villagers<br />
to organize for self-help. A leading<br />
technocrat, Puey Ungphakorn, founded<br />
a pioneering NGO dedicated to rural<br />
uplift through self-reliance. Local activists<br />
debated whether development policy<br />
should be changed by political activism<br />
(the “political economy approach”) or<br />
independent grassroots work (the “community<br />
culture approach”). Local protests<br />
arose over debt, land tenure, and access<br />
to water.<br />
In 1973, students in the city rebelled<br />
against military rule. Some of the leaders<br />
forged alliances with the emerging rural<br />
activism. But in 1975-6, the army retook<br />
the initiative, the student movement<br />
was crushed, and several rural leaders<br />
were shot. However, the student upsurge<br />
had generated pressure for democracy<br />
which gradually gained successes in the<br />
1980s. The decline of military dictatorship<br />
opened up space for new forms of<br />
political action.<br />
After the experience of 1973-6, many<br />
activists sought ways to change the<br />
development strategy without provoking<br />
violent confrontation. They debated new<br />
approaches to development, formed<br />
NGOs, and sought ways to mobilize<br />
people for change.<br />
<strong>THAILAND</strong> <strong>HUMAN</strong> <strong>DEVELOPMENT</strong> <strong>REPORT</strong> <strong>2003</strong>
Several of these activists seized on the<br />
idea of the community to serve as a<br />
basis for alternatives to the top-down and<br />
destructive policy of development begun<br />
in the 1950s. They argued that development<br />
should begin from the community<br />
upwards, should pay attention to local<br />
wisdom, and should respect local culture<br />
and history in order to rebuild the communities’<br />
self-confidence. These thinkers<br />
were criticized for idealizing the community<br />
and exaggerating its historical<br />
importance. Yet their ideas were powerful<br />
in inspiring a generation of local leaders<br />
and NGO activists.<br />
Boom, crisis, and reform<br />
From the mid-1980s, the Thai economy<br />
went on a rollercoaster ride of boom and<br />
bust. For local communities, this was like<br />
a combination punch. First, the urban<br />
boom downgraded the importance of<br />
agriculture in the national economy,<br />
ripped millions of young people out of<br />
the local communities to work in factories,<br />
intensified the feelings of urban superiority<br />
and rural subordination, and widened<br />
the income gap. Then, the economic bust<br />
of 1997 threw thousands of migrants back<br />
on the support of the village economy,<br />
collapsed agricultural prices, and added<br />
three million people – mostly rural – to<br />
the ranks of the poor.<br />
These rollercoaster years totally changed<br />
the nature of local communities, their<br />
view of themselves, and their role in the<br />
national polity.<br />
The boom years accelerated the decline<br />
of the natural environment with continued<br />
forest destruction and growing<br />
industrial pollution. In addition, the<br />
booming urban economy took increasing<br />
control of natural resources such as land<br />
and water which the communities needed<br />
for survival. Sometimes this was done<br />
through state power (dams, power plants).<br />
Sometimes this happened because of<br />
urban entrepreneurs’ superior ability to<br />
exploit a loose regulatory environment<br />
THE NEW INSTITUTIONAL CONTEXT FOR COMMUNITY EMPOWERMENT<br />
(land grabbing). The destruction of natural<br />
resources and denial of access created<br />
a crisis for many communities, and an<br />
imperative to find new forms of political<br />
action.<br />
The boom years also saw the growth of<br />
“money politics”. Local godfathers transformed<br />
themselves into representatives<br />
of the people. Businessmen dominated<br />
parliament. The formal political system<br />
was useless for expressing community<br />
discontent. Rural people were effectively<br />
excluded from parliament which became<br />
a clearing house for business deals. Many<br />
MPs were businessmen directly involved<br />
in the destruction or seizure of natural<br />
resources. Communities sought alternate<br />
ways to express their views and defend<br />
their livelihood. The number of local<br />
movements multiplied. So did the<br />
number of NGOs.<br />
In the late 1980s, the NGO movement<br />
developed two streams. The first assisted<br />
people’s movements and coordinated<br />
networks and protests. Through the<br />
1990s, the number of rural protests greatly<br />
expanded. The major issues were debt,<br />
access to natural resources, and the<br />
impact of government development<br />
projects. Many new network organizations<br />
were formed such as the Northern<br />
Farmers Network, Association of Smallscale<br />
Farmers of the Northeast, and Network of<br />
Coastal Fishermen. The founding of the<br />
Assembly of the Poor (AOP) in December<br />
1995 was a landmark. The AOP was an<br />
alliance of local communities with grievances<br />
over access to forest, the impact of<br />
dams, and similar issues. Unlike most<br />
farmers’ protests, which generally aimed<br />
to obtain immediate temporary assistance<br />
from the government, the AOP organized<br />
a sustained campaign calling for a longterm<br />
reform agenda. The AOP made a<br />
clear distinction between its constituents<br />
(the local communities) and its alliance<br />
partners (NGOs and academics) in order<br />
to parry accusations that NGOs and<br />
academics were driving AOP’s agenda, not<br />
the people themselves.<br />
The formal political<br />
system was useless<br />
for expressing<br />
community<br />
discontent. Rural<br />
people were<br />
effectively excluded<br />
from parliament<br />
which became a<br />
clearing house for<br />
business deals.<br />
31
32<br />
The second stream of the NGO movement<br />
sought to influence government decisionmaking<br />
at the centre. Several established<br />
figures lent weight to this stream of<br />
the NGO movement, such as Paiboon<br />
Buddhism, Economics,<br />
and Community<br />
In the 1980s, the leading Buddhist<br />
scholar P. A. Payutto (Phra Thammapidok)<br />
wrote about a Buddhist approach to<br />
economics. The aim of economics, as<br />
of all human philosophizing, he argued,<br />
should be “well-being” leading to<br />
contentment. Using Buddhist texts<br />
about the importance of avoiding<br />
greed and excess, he criticized the<br />
acquisitiveness built into the discipline<br />
of economics. In Buddhist economics,<br />
he argued, “in contrast to the classical<br />
economic equation of maximum<br />
consumption leading to maximum<br />
satisfaction, we have moderate or wise<br />
consumption, leading to well-being”.<br />
From this Buddhist approach came<br />
the importance of the concepts of<br />
sufficiency and self-reliance. Sufficiency<br />
(pho yu pho kin) summarizes the<br />
Buddhist concept of moderation as an<br />
antidote to acquisitiveness, by asserting<br />
that well-being can be achieved by<br />
limiting desires rather than expanding<br />
production. Self-reliance (phung ton<br />
eng) expresses the freedom gained by<br />
the lack of any dependence, both<br />
material and mental.<br />
By the 1990s, several thinkers (including<br />
Payutto and Prawase Wasi) had<br />
integrated these concepts into thinking<br />
about the role of the community, by<br />
arguing that the community was the<br />
social unit within which these concepts<br />
could be realized. An economics<br />
professor, Apichai Puntasen, began<br />
teaching a course on Buddhist economics,<br />
and published a large treatise<br />
on the subject which thoroughly<br />
criticized the mainstream discipline,<br />
expanded on Payutto’s use of textual<br />
references to give weight to concepts<br />
of sufficiency and self-reliance, and<br />
offered models of business enterprise<br />
designed for social gain rather than<br />
private profit.<br />
Wattanasiritham who left a banking career<br />
to head the Thai Rural Reconstruction<br />
Movement in 1988. Government responded<br />
by setting up bipartite umbrella<br />
organizations and by gradually drawing<br />
some NGOs into policy making. By the<br />
early 1990s, these NGOs were gaining<br />
access to policy making in areas of health,<br />
education, poverty eradication, and community<br />
development. At the same time,<br />
some senior technocrats became more<br />
concerned about the destruction of the<br />
environment, widening income gap, neglect<br />
of agriculture, and growing signs of<br />
political discontent. In the early 1990s,<br />
leadership of the planning agency passed<br />
from a keen advocate of urban growth to<br />
an enthusiast for rural uplift. The Seventh<br />
Plan (1992-96) tentatively began a shift<br />
towards a more balanced strategy.<br />
Although the two streams of NGOs<br />
pursued different strategies, they cooperated<br />
and exchanged information. Importantly,<br />
both streams – and particularly<br />
those involved in policy-making –<br />
adopted the thinking that the local community<br />
was the important unit for changing<br />
policy-making from a top-down to<br />
bottom-up perspective. The discussion on<br />
the meaning of the community became<br />
much more complex. The importance of<br />
the community was now based not so<br />
much on its history (true or false), but<br />
rather on its ability to symbolize values<br />
which differed from urban capitalism,<br />
and its practical role as a basis for more<br />
equitable policies. The community culture<br />
approach was recognized as too passive.<br />
Leading activists joined the community<br />
idea together with human rights to make<br />
a powerful argument for community<br />
rights – particularly over natural resources.<br />
Other thinkers gave the community idea<br />
more weight by linking it with Buddhist<br />
values.<br />
NGOs also allied with democracy activists<br />
to campaign for constitutional reform.<br />
After a military coup and another bloody<br />
pro-democracy protest in 1991-2, the<br />
combined strength of old and current<br />
student activists, NGO organizations, and<br />
business groups demanded a major<br />
<strong>THAILAND</strong> <strong>HUMAN</strong> <strong>DEVELOPMENT</strong> <strong>REPORT</strong> <strong>2003</strong>
“... In fact, I have often said to such audience as this one that to be a tiger is<br />
not important. The important thing for us is to have a self-supporting economy. A<br />
self-supporting economy means to have enough to survive. About this, I have often<br />
said that a self-sufficient economy does not mean that each family must produce<br />
its own food, weave and sew its own clothes. This is going too far, but I mean that<br />
each village or each district must have relative self-sufficiency. Things that are<br />
produced in surplus can be sold, but should be sold in the same region, not too<br />
far so that the transportation cost is minimized. Doing so might prompt some<br />
distinguished economists to criticize that it is out-of-date. Some other people say<br />
that we must have an economy that involve exchange of goods that is called “trade<br />
economy”, not “self-sufficient economy” which is thought to be unsophisticated.<br />
However, Thailand is a country that is blessed with self-sufficient productivity. ...”<br />
* Revised and translated by His Majesty the King.<br />
Royal Speech*<br />
“... I repeat myself again and again on the subjects of trade, goods consumption,<br />
production, and sale because I think that everyone is concerned with the crisis.<br />
All people – from the have-not to the well-to-do – are in trouble. But if the situation<br />
can change back to an economy that is self-sufficient – it does not have to be a<br />
hundred per cent, or even fifty per cent, but perhaps only twenty-five per cent – it will<br />
be bearable. The remedy will take time; it will not be easy. Usually one is impatient<br />
because one suffers, but if it is done from this moment on, the recovery is possible. ...”<br />
“... Thailand will be able to pull through the crisis better than many other countries<br />
because this land is still a good land to live in, as I said some years ago that this<br />
land is suitable for sustaining life. Anyhow, we must not be extravagant. We must<br />
live within our means and in the right way. ...”<br />
Remarks: An excerpt extracted from the Royal Speech, given to the audience of well-wishers on the occasion of the Royal<br />
Birthday Anniversary at the Dusidalai Hall, Chitralada Villa, Dusit Palace, on Thursday, December 4, 1997.<br />
THE NEW INSTITUTIONAL CONTEXT FOR COMMUNITY EMPOWERMENT<br />
33
34<br />
“... As we are in the “globalization” era, we also have to conform to the world<br />
because, if we do not comply with the existing agreements, they could be<br />
discontented. Why should they be unhappy? It is because they themselves also<br />
have a crisis. As Thailand’s neighboring countries in this region are also facing<br />
crisis, it will be more difficult for us to recover from our own crisis. Furthermore,<br />
it is not only that the countries in this region are affected, even countries that still<br />
seem prosperous will also become entangled. If the problems are not solved in any<br />
corner of the world, other parts of the world will also be affected. We have to strive<br />
to support our people so that they have work to do, and have an income. In this<br />
way, we will be able to surmount the crisis. But the original policy of placing too<br />
much emphasis on the production of industrial goods will not succeed as the local<br />
market has been reduced because the people now have a lower purchasing power. ...”<br />
* Revised and translated by His Majesty the King.<br />
Royal Speech*<br />
“... However, more importantly, the economists say that we must export other<br />
countries, but those countries also have their own difficulties and will not buy our<br />
products. If there are industrial products and there are no buyers, the efforts will<br />
be of no avail. We may be able to produce good quality goods, but many countries<br />
in this region have industries that are of top quality too. This crisis originates from<br />
the fact that there has been an overproduction and no purchasers because nobody<br />
has enough money to buy. Take the car I drove here, the manufacturer still have<br />
cars in stock but they cannot sell them. It is not that there are no buyers, but those<br />
who want a car have no money. If all cars are bought on credit, the company cannot<br />
survive either. That is why they slowed down their production, and they built this<br />
car for me using more than two hundred workers. This is one way to cope with the<br />
crisis. But those who like modern economics would perhaps not appreciate this.<br />
A careful step backwards must be taken; a return to less sophisticated methods<br />
must be made with less advance instruments. However, it is a step backwards in<br />
order to make further progress. If no such action is taken, the crisis will be difficult<br />
to surmount. ...”<br />
Remarks: An excerpt extracted from the Royal Speech, given to the audience of well-wishers on the occasion of the Royal<br />
Birthday Anniversary at the Dusidalai Hall, Chitralada Villa, Dusit Palace, on Thursday, December 4, 1997.<br />
<strong>THAILAND</strong> <strong>HUMAN</strong> <strong>DEVELOPMENT</strong> <strong>REPORT</strong> <strong>2003</strong>
constitutional revision to move Thailand<br />
finally beyond dictatorship. Community<br />
advocates played a part. A network of<br />
461 NGOs submitted a platform of recommendations<br />
to the constitutional drafting<br />
committee. This NGO lobby focused on<br />
five areas: community’s rights of access<br />
to and management of local natural<br />
resources; rights of ethnic minorities to<br />
preserve their language and culture;<br />
government’s duty to pay equitable<br />
compensation to those affected by development<br />
projects; government’s duty to<br />
promote self-reliant agriculture; and<br />
government’s duty to support alternative<br />
local approaches to education. The<br />
“People’s Constitution” was approved in<br />
October 1997.<br />
The economic collapse of 1997 punctured<br />
the faith in the superiority and reliability<br />
of the urban economy, and refocused<br />
attention on the countryside and the rural<br />
community which cushioned the social<br />
shock. The King’s speech in December<br />
1997 (see box) highlighted ideas of sufficiency<br />
and self-reliance, which were<br />
important parts of community thinking, as<br />
strategies to survive the crisis. Debate on<br />
the role of the community was thrust into<br />
the mainstream. In devising anti-crisis<br />
programmes, government chose to rely<br />
more than ever before on local communities,<br />
and often to by-pass its own administrative<br />
channels (see chapter 3). Ideas of<br />
community empowerment gained much<br />
Mainstreaming the Community<br />
In the mid-1990s, community thinking moved from the NGOs and activists to the mainstream.<br />
Many people helped to achieve this shift. But one seemed to represent it in the<br />
public eye. Mo [doctor] Prawase had won the Magsaysay award 26 for his work with health<br />
NGOs in the 1970s. He wrote and spoke often on a modern Buddhist approach to life. In<br />
the late 1980s, he worked with the Local Development Institute which spearheaded the<br />
pressure to gain an NGO role in policy-making. He began to advocate a “holistic” approach<br />
to development which supplanted “growth” with a Buddhist concept of “well-being”<br />
achieved by developing “learning communities”. In the early 1990s, NESDB absorbed this<br />
approach into its plan-making. In 1994, Prawase publicly challenged the prime minister to<br />
initiate reform of the constitution, and lobbied for the inclusion of community concerns. In<br />
1997, he blamed the economic crisis on the misguided approach to development, and<br />
spoke loudly and often on the need to mobilize “social energy” in order to rebuild a “moral<br />
economy” on the basis of learning communities.<br />
THE NEW INSTITUTIONAL CONTEXT FOR COMMUNITY EMPOWERMENT<br />
greater acceptance, not in all ministries,<br />
but certainly in several which had to<br />
mobilize rapidly to counter the social<br />
impact of the crisis.<br />
In sum, over the 1990s the idea that the<br />
community could serve as the basis for<br />
reversing the inequitable top-down development<br />
strategy moved firmly into the<br />
mainstream. The significance of the economic<br />
crisis was not that it stimulated<br />
thinking along these lines. That had been<br />
developing for some time. Rather, in the<br />
crisis such thinking gained a much wider<br />
audience among the urban middle class,<br />
and some government (and international)<br />
agencies adopted a community-based<br />
strategy in devising relief strategies.<br />
By the early 1990s, the combined efforts<br />
of grassroots community protests, prodemocracy<br />
organizations, and sympathetic<br />
technocrats had created powerful pressures<br />
for change in both the political<br />
framework and the orientation of development<br />
policy. Over the late 1990s, the<br />
pressures forced four institutional shifts of<br />
importance for community empowerment.<br />
The first of these was the “People’s Constitution”<br />
promulgated in October 1997.<br />
26 Sometimes dubbed the “Asian Nobel Prize”,<br />
this award, named after a former president<br />
of the Philippines, is given in recognition of<br />
outstanding social contribution.<br />
35
36<br />
The Constitution<br />
enshrines many<br />
rights which are<br />
important for<br />
community<br />
empowerment.<br />
INSTITUTIONAL SHIFTS I:<br />
THE 1997 CONSTITUTION<br />
Previous constitutions had been drafted<br />
with no significant public participation.<br />
The process for the 1997 constitutions<br />
was very different. A total of 19,335<br />
candidates stood at the first stage of elections<br />
of 76 members of the Constitution<br />
Drafting Assembly (CDA) membership.<br />
The CDA set up a publicity committee<br />
which claimed 600,000 people gave their<br />
opinions on the initial proposals, while<br />
over 120,000 attended public hearings<br />
on the final proposals and 87,000 responded<br />
by questionnaire. As already<br />
noted, NGO groups lobbied for community<br />
interests.<br />
New rights for the community<br />
The Constitution enshrines many rights<br />
which are important for community empowerment.<br />
The Chapter on the Rights<br />
and Liberties of the Thai People is much<br />
longer and more wide-ranging than previous<br />
charters. One main result of NGO<br />
lobbying is Section 46 which for the first<br />
time guarantees community rights, including<br />
rights of access to natural resources.<br />
Section 46. Persons so assembling<br />
as to be a traditional community<br />
shall have the right to conserve or<br />
restore their customs, local knowledge,<br />
arts or good culture of their<br />
community and of the nation and<br />
participate in the management, maintenance,<br />
preservation and exploitation<br />
of natural resources and the<br />
environment in a balanced fashion<br />
and persistently as provided by law. 27<br />
A later section expands on the rights of<br />
communities with respect to natural<br />
resources and the environment.<br />
27 All excerpts from the 1997 Constitution are<br />
taken from the official translation by the<br />
Council of State, available at www.krisdika.<br />
go.th/law/text/lawpub/e11102540/text.htm.<br />
Section 56. The right of a person to<br />
give to the State and communities<br />
participation in the preservation and<br />
exploitation of natural resources and<br />
biological diversity and in the protection,<br />
promotion and preservation<br />
of the quality of the environment for<br />
usual and consistent survival in the<br />
environment which is not hazardous<br />
to his or her health and sanitary condition,<br />
welfare or quality of life, shall<br />
be protected, as provided by law.<br />
Any project or activity which may<br />
seriously affect the quality of the<br />
environment shall not be permitted,<br />
unless its impacts on the quality of<br />
the environment have been studied<br />
and evaluated and opinions of an<br />
independent organization, consisting<br />
of representatives from private environmental<br />
organizations and from<br />
higher education institutions providing<br />
studies in the environmental<br />
field, have been obtained prior to the<br />
operation of such project or activity,<br />
as provided by law. The right of a<br />
person to sue a State agency, State<br />
enterprise, local government organization<br />
or other State authority to<br />
perform the duties as provided by<br />
law under paragraph one and paragraph<br />
two shall be protected.<br />
Other sections in this chapter attempt<br />
to empower the individual or community<br />
by specifying the “the right to get access<br />
to public information in possession of a<br />
State agency, State enterprise or local<br />
government organization”, (Section 58);<br />
“the right to receive information, explanation<br />
and reason from a State agency,<br />
State enterprise or local government<br />
organization before permission is given<br />
for the operation of any project or<br />
activity which may affect the quality of<br />
the environment, health and sanitary<br />
conditions, the quality of life or any other<br />
material interest concerning him or her<br />
or a local community and shall have<br />
the right to express his or her opinions<br />
on such matters in accordance with<br />
the public hearing procedure, as provided<br />
by law” (Section 59); and “the<br />
right to participate in the decisionmaking<br />
process of State officials in the<br />
<strong>THAILAND</strong> <strong>HUMAN</strong> <strong>DEVELOPMENT</strong> <strong>REPORT</strong> <strong>2003</strong>
performance of administrative functions<br />
which affect or may affect his or her<br />
rights and liberties, as provided by law”<br />
(Section 60).<br />
New directives for greater<br />
participation<br />
Equally innovative is the Chapter on<br />
“Directive Principles of Fundamental State<br />
Policies” which mandates the state to<br />
strengthen local communities and promote<br />
community participation in national<br />
decision-making.<br />
Section 76. The State shall promote<br />
and encourage public participation in<br />
laying down policies, making decision<br />
on political issues, preparing economic,<br />
social and political development<br />
plans, and inspecting the exercise<br />
of State power at all levels.<br />
Section 78. The State shall decentralize<br />
powers to localities for the<br />
purpose of independence and selfdetermination<br />
of local affairs, develop<br />
local economics, public utilities and<br />
facilities systems and information infrastructure<br />
in the locality thoroughly<br />
and equally throughout the country<br />
as well as develop into a largesized<br />
local government organization<br />
a province ready for such purpose,<br />
having regard to the will of the<br />
people in that province.<br />
Section 79. The State shall promote<br />
and encourage public participation in<br />
the preservation, maintenance and<br />
balanced exploitation of natural resources<br />
and biological diversity and<br />
in the promotion, maintenance and<br />
protection of the quality of the<br />
environment in accordance with the<br />
persistent development principle as<br />
well as the control and elimination<br />
of pollution affecting public health,<br />
sanitary conditions, welfare and quality<br />
of life.<br />
In addition this Chapter contained several<br />
directives to alter the direction of national<br />
economic policy.<br />
THE NEW INSTITUTIONAL CONTEXT FOR COMMUNITY EMPOWERMENT<br />
Section 83. The State shall implement<br />
fair distribution of incomes.<br />
Section 84. The State shall organize<br />
the appropriate system of the holding<br />
and use of land, provide sufficient<br />
water resources for farmers and protect<br />
the interests of farmers in the<br />
production and marketing of agricultural<br />
products to achieve maximum<br />
benefits, and promote the assembling<br />
of farmers with a view to laying<br />
down agricultural plans and protecting<br />
their mutual interests.<br />
Also, for the first time a Thai constitution<br />
mentions human dignity.<br />
Section 4. The human dignity, right<br />
and liberty of the people shall be<br />
protected.<br />
New institutions for democracy<br />
The Constitution also founds several new<br />
institutions designed to act as checks and<br />
balances on the action of administrators<br />
and politicians, and to strengthen the<br />
individual or community in dealing with<br />
the state. These include a strengthened<br />
National Counter Corruption Commission,<br />
new Constitutional Court, Ombudsman,<br />
and Administrative Courts which will hear<br />
cases against government bodies.<br />
Amongst these new institutions, the<br />
Constitution established a National Economic<br />
and Social Council as a means<br />
to increase participation in national development<br />
planning and policy-formulation.<br />
The council is “charged with the duty to<br />
give advice and recommendations to the<br />
Council of Ministers on economic and social<br />
problems” and specifically to review<br />
the five-year plans. Members of the<br />
Council are nominated and selected from<br />
different sectors of society, including<br />
local communities, in a representative and<br />
participatory manner. Even though this<br />
Council has only an advisory function<br />
and no real decision-making authority,<br />
its views and recommendations will be<br />
widely disseminated to the government<br />
and public. The council thus has the<br />
37
38<br />
potential to serve as another channel by<br />
which the people can take part in the<br />
national planning process.<br />
More significant is the National Human<br />
Rights Commission (NHRC). Section 200<br />
of the Constitution prescribes wide<br />
powers:<br />
(1) to examine and report the commission<br />
or omission of acts which<br />
violate human rights or which do not<br />
comply with obligations under international<br />
treaties to which Thailand<br />
is a party, and propose appropriate<br />
remedial measures; (2) to propose to<br />
the National Assembly and the Council<br />
of Ministers policies and recommendations<br />
with regard to the revision<br />
of laws, rules or regulations for<br />
the purpose of promoting and protecting<br />
human rights; (3) to promote<br />
education, researches and the dissemination<br />
of knowledge on human<br />
rights; (4) to prepare an annual report<br />
for the appraisal of situations in<br />
the sphere of human rights in the<br />
country.<br />
The first president of the NHRC, selected<br />
in 2000, is Saneh Chamarik, a senior<br />
academic and long-time social activist<br />
who has written extensively on the<br />
human impact of development and the<br />
importance of the community. Before his<br />
selection to the NHRC, he had launched a<br />
large-scale project of research on issues of<br />
human and community rights throughout<br />
Thailand. Many young activists participated<br />
in the project which covered<br />
labour, slum-dwellers, hill peoples, small<br />
fishermen, community control over forests,<br />
and gender. On his appointment, Saneh<br />
predicted that the NHRC would have to<br />
become involved in “biodiversity issues,<br />
community rights and rights to traditional<br />
lifestyles and local wisdom”.<br />
Finally, the Constitution for the first time<br />
allows citizens to submit a bill for the<br />
consideration of parliament. The bill must<br />
be supported by the signatures of 50,000<br />
eligible voters. The first such bill submitted<br />
was a Community Forest Bill.<br />
INSTITUTIONAL SHIFTS II:<br />
THE EIGHTH AND NINTH<br />
PLANS<br />
Eighth Plan: people-centred<br />
development<br />
The Eighth Plan (1997-2001) marked a<br />
dramatic break from its predecessors,<br />
both in content and creation. The National<br />
Economic and Social Development<br />
Board (NESDB) held nine regional seminars<br />
inviting local NGO leaders, development<br />
workers, academics, businessmen,<br />
community leaders, monks, and bureaucrats.<br />
The results were then summarized<br />
in a tenth national seminar, compiled by<br />
the NGO side into a People’s Development<br />
Plan, and refined by technocrats into the<br />
final version accepted in March 1996.<br />
The Plan aimed to shift “from a growth<br />
orientation to people-centred development”<br />
through “measures to promote selfreliance<br />
in local communities and the<br />
creation of relatively secure community<br />
economies”. A chapter on “Promoting<br />
Popular Participation and Upgrading the<br />
Capabilities of Communities to Play Active<br />
Roles in Local Development” included proposals<br />
for training courses on community<br />
leadership, tax and funding changes to<br />
create community budgets, promotion of<br />
community schools with appropriate curricula,<br />
community management of natural<br />
resources, funding to NGOs to devise<br />
community-based social protection, and<br />
fiscal incentives for businesses to work<br />
with communities.<br />
However, the Eighth Plan was launched<br />
into the storm of the 1997 crisis. Much of<br />
its ambition was blunted by the imperatives<br />
of short-term crisis management.<br />
Ninth Plan: sufficiency<br />
economy<br />
The Ninth Plan (2002-2006) was prepared<br />
after a process of national consultation,<br />
though less extensive than its predecessor.<br />
The Plan retains the commitment<br />
<strong>THAILAND</strong> <strong>HUMAN</strong> <strong>DEVELOPMENT</strong> <strong>REPORT</strong> <strong>2003</strong>
to people-centred development, and<br />
repeats many of the same aspirations of<br />
the Eighth Plan. However, the Plan is also<br />
formulated with much greater sensitivity<br />
to the influence of the outside world,<br />
especially to the impact of free trade, the<br />
trend to regional economic groupings, the<br />
consequences of financial liberalization,<br />
and the impact of new technologies. The<br />
Plan is also heavily focused on restoring<br />
economic growth after the 1997 crisis,<br />
largely by marshalling national resources<br />
to improve Thailand’s competitiveness in<br />
the world economy.<br />
The Plan attempts to balance the aspirations<br />
for people-centred development<br />
with the realities of recovering from<br />
the nation’s worst-ever economic crisis<br />
within the context of globalization. The<br />
Plan adopts H.M. the King’s “philosophy<br />
of sufficiency economy” as “the guiding<br />
principle of national development and<br />
management”.<br />
Philosophy of<br />
Sufficiency Economy<br />
The principle of sufficiency economy<br />
implies moderation in all human endeavour.<br />
If practised, the philosophy will<br />
lead to a Thai society that is developed,<br />
economically, socially and politically,<br />
based on self-support and self-reliance.<br />
Furthermore, such a society will be<br />
highly resilient, even when exposed<br />
to the forces and risks of globalization.<br />
A sufficiency economy will be one<br />
in which the Thai are well-educated,<br />
engage in life-long learning, and possess<br />
high moral standards, especially honesty,<br />
and integrity. Such a society will be a<br />
knowledge-based learning society which<br />
incorporates local wisdom and retains<br />
Thailand’s cultural identity. The society<br />
will be caring and united, and proud<br />
of its cultural heritage. In sum, a sufficiency<br />
economy will be characterized<br />
by balanced, sustainable, and just development.<br />
Ninth Plan, chapter 1:<br />
National Development Vision<br />
THE NEW INSTITUTIONAL CONTEXT FOR COMMUNITY EMPOWERMENT<br />
Empowerment of Communities and Development of<br />
Livable Cities and Communities<br />
Emphasis should be placed on the development of processes that empower<br />
communities so that they can serve as strong foundations of society.<br />
Mobilizing participation of all stakeholders in community development is a<br />
priority target. Livable cities and communities should be achieved through<br />
the creation of enabling environments conducive to the development of a<br />
way of life which is tranquil, convenient, clean, safe, and well disciplined. This<br />
development process will lead to the creation of bodies of knowledge that<br />
are consistent with local wisdom, as well as the development of strong<br />
grassroots economies which are more self-reliant, and support sustainable<br />
development of livable cities and communities.<br />
Community empowerment is an explicit<br />
theme of the Plan, particularly in proposals<br />
to alleviate poverty, improve environmental<br />
management, and generate<br />
sustainable rural development. Following<br />
the rise in poverty during the economic<br />
crisis, “Poverty alleviation efforts should<br />
be holistic in approach, not just focused<br />
on income. To this end, empowerment of<br />
the poor should be a priority”.<br />
The main role of communities in the<br />
Ninth Plan is in efforts to revive agriculture<br />
and promote rural growth in order<br />
both to reduce the gap and strengthen<br />
the linkages between the rural and urban<br />
economies. The Plan stresses the importance<br />
of developing local communities’<br />
capacity to manage their own economic<br />
and social development in partnership<br />
with the public and private sectors. It<br />
aims to support community enterprises,<br />
strengthen communities’ capacity to<br />
manage revolving funds and small credit<br />
schemes, establish community information<br />
centres, and increase networking between<br />
community organizations. In addition it<br />
encourages communities to develop<br />
appropriate local education consistent<br />
with local wisdom and culture, to have<br />
participative community planning, to<br />
exchange knowledge with development<br />
partners, and to take a larger role in<br />
managing natural resources and developing<br />
networks to preserve the environment.<br />
Ninth Plan, chapter 4: Economic and Social Development Strategies<br />
39
40<br />
The share of<br />
local government’s<br />
revenue will rise to<br />
20 per cent in 2001<br />
and 35 per cent<br />
in 2006.<br />
INSTITUTIONAL SHIFTS III:<br />
DEMOCRATIC<br />
DECENTRALIZATION<br />
From centralization to<br />
contractors’ councils<br />
The administration of provincial Thailand<br />
has been highly centralized. The Ministry<br />
of the Interior heads an administrative<br />
pyramid which extends down through<br />
provincial governors, district heads, subdistrict<br />
(tambon) heads and village heads.<br />
Line ministries such as education, agriculture,<br />
and community development post<br />
their own officials in the provinces who<br />
are coordinated and overseen by the<br />
provincial governor.<br />
Elected provincial councils were introduced<br />
in 1955. In theory they were<br />
allotted wide-ranging powers over policymaking,<br />
supervision of the provincial<br />
administration, and approval of the<br />
budget. In reality they were not able<br />
to challenge the provincial bureaucracy.<br />
Instead they became clearing houses for<br />
contracts to build local infrastructure such<br />
as roads, bridges, schools and government<br />
offices. By one estimate, some 80 to 90<br />
per cent of all provincial councillors are<br />
construction contractors, and the councils<br />
are often called “contractors’ councils”. 28<br />
Emergence of the TAO<br />
Demands for decentralization increased in<br />
the early 1990s, resulting in an Act passed<br />
in 1994. This Act made the tambon (subdistrict)<br />
the main site for decentralization.<br />
At the time there were 7,159 tambon with<br />
an average population of around 8,000<br />
people. The act enabled tambon to be<br />
transformed into Tambon Administrative<br />
Organizations (TAO or oboto in Thai)<br />
28 This estimate was made in 1997 by the<br />
director of the division responsible for policy<br />
on PAOs, see Daniel Arghiros, Democracy,<br />
Development and Decentralization in Provincial<br />
Thailand, Richmond: Curzon, 2001, p. 24.<br />
with legal status, enhanced fund-raising<br />
powers, the right to make by-laws,<br />
and the duty to “develop the tambon<br />
economically, socially and culturally”.<br />
Over the following years, most tambon<br />
were upgraded. However the kamnan<br />
(sub-district head) and village heads<br />
remained ex-officio members of the TAO<br />
councils, with the kamnan as chairman.<br />
District officials still took a close supervisory<br />
role. The TAO seemed to be developing<br />
as an extension of the local<br />
bureaucracy.<br />
The 1997 Constitution demanded further<br />
change. It included decentralization<br />
among the directive principles of state<br />
policies (Section 78), and prescribed the<br />
shape of further reform in some detail<br />
(Sections 282-290). In particular it entrusted<br />
local government bodies with<br />
powers of policy-making and fund-raising,<br />
allocated them duties to “conserve local<br />
arts, custom, knowledge or good culture”,<br />
directed them to protect the environment<br />
and natural resources, and mandated that<br />
all councillors in future be elected. It<br />
mandated new legislation to implement<br />
these principles, including the establishment<br />
of a committee to draw up and<br />
implement a decentralization plan.<br />
The legislation was passed in 1999, the<br />
implementation committee established in<br />
2000, and its plans approved in 2001. The<br />
goal is to transfer power within four years<br />
to those local administrative bodies that<br />
can demonstrate their readiness, and<br />
within ten years to the remainder. The<br />
kamnan and village heads lost their ex<br />
officio membership of the TAO councils<br />
between 1999 and 2001. All TAO members<br />
are now elected by the same electorate<br />
as members of parliament (all over<br />
18). The term is four years. Each village<br />
(as officially defined) elects two TAO<br />
members, and each tambon consists on<br />
average of 9-10 villages. The share of<br />
local government’s revenue will rise to 20<br />
per cent in 2001 and 35 per cent in 2006.<br />
The plan also establishes a mechanism for<br />
gradually transferring 245 responsibilities<br />
from 50 departments in 11 ministries to<br />
the local authorities.<br />
<strong>THAILAND</strong> <strong>HUMAN</strong> <strong>DEVELOPMENT</strong> <strong>REPORT</strong> <strong>2003</strong>
This is a dramatic change in the framework<br />
of local government. The TAOs are<br />
close to the base of the governmental<br />
structure. They are now elective bodies<br />
with considerable powers and significant<br />
budgets. There are of course considerable<br />
problems to be faced. But the potential<br />
of this decentralization for community<br />
empowerment is very significant.<br />
INSTITUTIONAL SHIFTS IV:<br />
EDUCATION REFORM<br />
Critiquing the system<br />
Modern education spread rapidly beyond<br />
the urban areas from the 1960s onwards.<br />
Almost everyone entered four years of<br />
primary education, and by the 1980s<br />
almost everybody had basic literacy. As<br />
reported in the stories in chapter 1, community<br />
members were ambivalent about<br />
the result. Despite its obvious benefits,<br />
education was disempowering. It placed<br />
less emphasis on local knowledge and<br />
wisdom. It made communities passive<br />
recipients of new knowledge. The sharp<br />
division between traditional knowledge<br />
and modern education disrupted any<br />
learning process within the community.<br />
From the 1970s onwards, a broader<br />
critique of the education system gradually<br />
rose. Learning was by rote. Textbooks<br />
were standardized, narrow, and dogmatic.<br />
Administration was centralized. Education<br />
was stifled by bureaucracy. In sum, the<br />
system was a reflection of the era<br />
of centralization and authoritarianism. It<br />
needed an overhaul. A reform plan was<br />
drafted in 1974, but there was no political<br />
will to implement it.<br />
Efforts to reform education were ineffective<br />
until the boom which began in the<br />
mid-1980s revealed the system’s basic inadequacy.<br />
Thailand did not have enough<br />
secondary school graduates, enough engineers,<br />
enough research capacity, and<br />
enough creativity to keep up with the<br />
pace of economic growth. By the early<br />
1990s, these failures were widely seen<br />
as a major constraint on future economic<br />
growth. In parallel, another critique<br />
related the corruption, excessive consumerism,<br />
selfish values, and poor business<br />
ethics which seemed to mushroom in<br />
the boom, to the narrowness and<br />
moral inadequacy of curriculum content<br />
and pedagogical style. The bust, when it<br />
came, was quickly read as proof of these<br />
propositions. The preamble of the 1999<br />
National Education Act positioned the<br />
legislation as response to “economic,<br />
political, cultural and social crisis”. 29<br />
From critique to reform<br />
THE NEW INSTITUTIONAL CONTEXT FOR COMMUNITY EMPOWERMENT<br />
The campaign for education reform ran<br />
in parallel with the campaign for constitutional<br />
reform and shared many of<br />
its features. In 1994, an independent<br />
group of activists, including technocrats,<br />
educators, and businessmen, formed a<br />
“Commission on Thailand’s Education in<br />
the Era of Globalization” with support<br />
from a leading bank. The Commission<br />
recruited experts, held public consultations,<br />
and drew up a framework of comprehensive<br />
reform in the educational<br />
system. It then lobbied for government<br />
to accept these proposals as basis for the<br />
reform enacted in 1999.<br />
The activist group was overwhelmingly<br />
urban, but it included some prominent<br />
advocates of community strength. Hence<br />
one principle of the Commission’s proposals<br />
was that “the community must be<br />
capable of maintaining itself not only as a<br />
strong and dynamic unit of the economy,<br />
but a proud and lively part of the social<br />
and cultural life of the country as well”.<br />
This would include the ability “to preserve<br />
and pass on to their future generations<br />
their cultural identity”. 30<br />
29 National Education Act of B.E. 2542 (1999),<br />
Office of the Education Commission, Office<br />
of the Prime Minister, 1999, p. i.<br />
30 Thai Education in the Era of Globalization:<br />
Vision of a Learning Society, A Synopsis of<br />
the Report of the Commission of Thailand’s<br />
Education in the Era of Globalization:<br />
Towards National Progress and Security in<br />
the Next Century, 1996.<br />
The sharp division<br />
between traditional<br />
knowledge and<br />
modern education<br />
disrupted any<br />
learning process<br />
within the community.<br />
41
The changes over<br />
the past decade in<br />
both the institutional<br />
context and the<br />
national agenda<br />
have been dramatic.<br />
42<br />
The 1999 Education Act aimed to achieve<br />
four main goals: to widen access to<br />
education; to change from rote learning<br />
to “child-centred” education; to improve<br />
quality standards; and to decentralize<br />
administration and control.<br />
The Act widened access by extending<br />
compulsory schooling up to 9 years and<br />
free schooling up to 12 years, as well as<br />
making more space for specialized forms<br />
of learning. It established child-centred<br />
learning through a new curriculum, and<br />
retraining of teachers. It planned to upgrade<br />
quality by forming a professional<br />
institute for teachers and education<br />
officials, and a new body to monitor<br />
performance. It decentralized the administration<br />
by converting the Ministry of<br />
Education into a policy and planning<br />
body, setting up local area boards, giving<br />
more independence to schools, and encouraging<br />
greater parent and community<br />
participation. Together, these measures<br />
amounted to a revolution in the education<br />
system.<br />
Education reform and<br />
the community<br />
The reformers’ intention to bring local<br />
communities into a national learning process<br />
is enshrined in the Act’s section 29:<br />
Educational institutions in cooperation<br />
with individuals, families, communities,<br />
community organizations, local<br />
administration organizations, private<br />
persons, private organizations, professional<br />
bodies, religious institutions,<br />
enterprises, and other social institutions<br />
shall contribute to strengthening<br />
the communities by encouraging<br />
learning in the communities themselves.<br />
Thus communities will be<br />
capable of providing education and<br />
training; searching for knowledge,<br />
data, and information; and be able to<br />
benefit from local wisdom and other<br />
sources of learning for community<br />
development in keeping with their<br />
requirements and needs; and identification<br />
of ways of promoting exchanges<br />
of development experience<br />
among communities.<br />
On its final reading, the act was passed<br />
unanimously by both houses. An Education<br />
Reform Office and three sub-commissions<br />
were formed to restructure the<br />
ministry, retrain teachers, redesign curricula,<br />
revise financing, and guide the<br />
supplementary enabling legislation.<br />
PROBLEMS AND ISSUES<br />
The changes over the past decade in both<br />
the institutional context and the national<br />
agenda have been dramatic. The 1997<br />
Constitution is an ambitious attempt to<br />
remap the relations between state and<br />
society. The Constitution and the decentralization<br />
scheme have begun to change<br />
the shape of government. The Eighth and<br />
Ninth Plans have brought a new social<br />
and cultural agenda into the planning<br />
process. The Education Act aspires to lay<br />
the human foundations for success in the<br />
age of globalization. The cycle of boom<br />
and bust has sensitized society to issues<br />
of environmental damage, social justice<br />
and community strength, preparing the<br />
way for pioneer attempts to strengthen<br />
rights, direct government policy, and<br />
decentralize power.<br />
Yet change is difficult. New administrative<br />
structures threaten old power relations<br />
and break old ricebowls. Planning for<br />
social change is easier than achieving it.<br />
Policies hatched in the heat of crisis<br />
can easily be forgotten when conditions<br />
ease. Thailand’s traditions of centralized<br />
government, bureaucratic authority, and<br />
top-down planning will not be quickly or<br />
easily overthrown.<br />
These four institutional changes have<br />
enormous potential to support community<br />
empowerment. But they also have<br />
very real limitations, mainly because<br />
the legacies of centralized government,<br />
top-down thinking, and paternalist attitudes<br />
are not easily removed. In this<br />
section, we look at some of the problems<br />
and complications in these four areas, and<br />
lay out some of the challenges which<br />
community empowerment will confront in<br />
the future.<br />
<strong>THAILAND</strong> <strong>HUMAN</strong> <strong>DEVELOPMENT</strong> <strong>REPORT</strong> <strong>2003</strong>
The 1997 Constitution’s<br />
unfinished business<br />
Chapter 3 of the Constitution establishes<br />
many new rights for individuals and communities.<br />
However, in reality these exist<br />
on paper only. There is as yet no<br />
tradition in Thailand for using the judicial<br />
system to activate constitutional rights,<br />
though some attempts are currently being<br />
made and such a tradition could<br />
eventually emerge. Unlike past charters,<br />
the current Constitution goes beyond the<br />
guarantee of rights to stipulate that these<br />
rights and freedoms can be invoked<br />
directly in the courts to question actions<br />
violating the Constitution. 31 But this requires<br />
a change of judicial practice which<br />
will not be quick. At present, the only<br />
reasonably firm way to substantiate such<br />
rights is through legislation. Yet this, of<br />
course, is time-consuming and difficult.<br />
Section 46 is of great importance to community<br />
empowerment as it enshrines the<br />
right of communities to “participate in the<br />
management, maintenance, preservation,<br />
and exploitation of natural resources and<br />
the environment in a balanced fashion<br />
and persistently as provided by law”. Yet<br />
in reality, the modern state over the last<br />
century has effectively appropriated rights<br />
over most natural resources, often overriding<br />
pre-existing community arrangements.<br />
Thailand’s legal system, based on<br />
the Roman law tradition, has no avenue<br />
for claiming customary rights. Moreover<br />
the state’s rights have been enshrined<br />
in various bits of legislation such as<br />
those which define the operations of<br />
the forestry and irrigation departments.<br />
Hence the phrase “as provided by law”<br />
appended to Section 46 annuls much of<br />
the Section’s force. This can only be rectified<br />
by legislation.<br />
This is far from easy, as the experience<br />
with the Community Forestry Bill demonstrates.<br />
This bill provides a framework for<br />
designating areas as community forests<br />
31 Vitit Muntarbhorn, Human Rights and Human<br />
Development: Thailand Country Study, UNDP<br />
Occasional Paper 36, 2000, p. 3.<br />
THE NEW INSTITUTIONAL CONTEXT FOR COMMUNITY EMPOWERMENT<br />
where management will be shared<br />
between communities and officials under<br />
strict principles. The bill has been under<br />
discussion for over a decade but has<br />
faced considerable opposition, especially<br />
from the Forestry Department which<br />
would have to cede its exclusive control<br />
over areas designated as community<br />
forests. The bill was revived after the<br />
Constitution was passed and was the first<br />
bill submitted to parliament under the<br />
Constitution’s provisions for a “people’s<br />
bill” backed by 50,000 signatures. As of<br />
the time of writing this report, the bill<br />
had reached the Senate where an amendment<br />
had, according to the bill’s drafters<br />
and supporters, undermined the legislation’s<br />
purpose. A way is being sought to<br />
end this deadlock.<br />
The Community Forestry Bill carries the<br />
weight of a fierce controversy over the<br />
fate of people who are living in areas<br />
which have been defined as national<br />
park or protected watershed. Many of<br />
these people were settled before the<br />
areas were so defined, but proof is sometimes<br />
difficult. The fate of these people<br />
involves complex questions over historical<br />
rights, social equity, and environmental<br />
management. Other aspects of community<br />
management of natural resources –<br />
waterways, sea, underground – will be<br />
equally controversial.<br />
Of similar importance for the validation<br />
of community rights is the question of<br />
public hearings. The constitution enshrines<br />
the right of people to express an<br />
opinion before the approval on any<br />
project which will affect the community<br />
“in accordance with the public hearing<br />
procedure, as provided by law”. At present<br />
the government’s monitoring of environment<br />
issues is covered by the<br />
Enhancement and Conservation of the<br />
Environment Quality Act of 1992. It is<br />
widely recognized that the intentions of<br />
this Act are good, but the implementation<br />
has been ineffective. The legislation is<br />
built around the “polluter pays” principle,<br />
but the courts have refused to accept<br />
cases by quibbling over who is the<br />
affected party when pollution occurs. The<br />
legislation also lays down procedures for<br />
environmental impact assessments (EIAs)<br />
The Community<br />
Forestry Bill carries<br />
the weight of a<br />
fierce controversy<br />
over the fate of<br />
people who are<br />
living in areas which<br />
have been defined<br />
as national park or<br />
protected watershed.<br />
43
44<br />
Project proponents still view an EIA as the<br />
way to approve a project, rather than a<br />
mechanism for deciding whether or not a<br />
project should be built in the first place.<br />
Even some government officials think that<br />
way.... If we did it [the Enhancement and<br />
Conservation of the Environment Quality<br />
Act] over, I would demand that public<br />
hearings be carried out at the beginning<br />
and according to an established procedure.<br />
– Kasem Snidvongs, former Permanent Secretary,<br />
Ministry of Science, Technology and Environment<br />
but again these have fallen short of expectations,<br />
mainly because they are commissioned<br />
by the project proponents, not<br />
by an independent body. Further, the legislation<br />
does not mandate social impact<br />
assessment (SIA) and public participation<br />
in the impact assessment process.<br />
In 1996, government introduced a Prime<br />
Minister’s Office Regulation on Public<br />
Hearings. In the opinion of many, this<br />
also falls far short of an adequate law<br />
on public hearings, and far short of<br />
the requirements of the Constitution.<br />
So-called public hearings<br />
have been called<br />
on projects which have<br />
already been approved<br />
but which face local<br />
opposition. Opponents<br />
have perceived these as<br />
attempts to legitimize<br />
prior decisions and have<br />
either refused cooperation<br />
or used the events<br />
as sites of protest.<br />
Hence the potential to<br />
introduce a proper procedure<br />
for public hearings<br />
as a way to negotiate<br />
among the rights<br />
and aspirations of different parties is<br />
being damaged by the lack of adequate<br />
legislation.<br />
There is a special problem over projects<br />
which were designed before social and<br />
environmental conditions changed, and<br />
approved before the new constitution<br />
and new regulations came into force, but<br />
have not yet been implemented. Opponents<br />
of these projects argue that the<br />
principles enshrined in the Constitution<br />
should be applied to these projects,<br />
implying proper social and environmental<br />
assessments and community participation.<br />
Proponents argue that approvals were<br />
made under the laws operating at the<br />
time, and that no review is needed.<br />
Projects of this nature (the Thai-Malaysian<br />
gas pipeline, Bo Nok and Hin Krut power<br />
projects, etc.) have occasioned some of<br />
the bitterest disputes of the past five<br />
years. As yet, there is no mechanism, no<br />
framework, no principles for managing<br />
such issues.<br />
Ninth Plan: sufficiency<br />
economy vs. growth<br />
While the Ninth Plan features peoplecentred<br />
development and community<br />
empowerment, in practice the Plan places<br />
great emphasis on a return to stability<br />
and economic growth. The main strategies<br />
to achieve these objectives are<br />
to upgrade human resources, corporate<br />
competitiveness, and public administration<br />
in order to make Thailand both<br />
more self-reliant and more successful in a<br />
globalized world.<br />
The role of the community is much<br />
diminished from the Eighth Plan. In effect<br />
it is more or less confined to rural development.<br />
Given the emphasis on crisis<br />
recovery, this is not surprising and may in<br />
fact be realistic. However, the language<br />
and tone of the Plan as a whole is a<br />
reversion to more traditional style, not<br />
only in its emphasis on economic growth,<br />
but also in its calls for discipline and unity<br />
in the task of recovery.<br />
The scope and range of the Ninth Plan<br />
is very ambitious. There is some risk that<br />
implementation will focus on measures<br />
to restore growth, and neglect the aspirations<br />
towards community empowerment.<br />
Decentralization:<br />
patronage or participation?<br />
As long as there is no complete<br />
transfer of management from central<br />
government mechanisms to local selfadministration,<br />
true development may<br />
not occur, and all roads will still lead<br />
to Government House as they always<br />
do.<br />
– Dr. Kowit Puang-ngam,<br />
lecturer in community development,<br />
Thammasat University<br />
Are we getting “TAOs of the state” or<br />
“TAOs of the people”?<br />
– Northeastern villager<br />
<strong>THAILAND</strong> <strong>HUMAN</strong> <strong>DEVELOPMENT</strong> <strong>REPORT</strong> <strong>2003</strong>
The rapid rollout of decentralization has<br />
led to a large number of concerns. The<br />
choice of the tambon, a relatively small<br />
unit, theoretically increases the potential<br />
for effective community participation. But<br />
will such a small unit be able to find the<br />
necessary managerial talent, escape continued<br />
subordination to officialdom, evade<br />
capture by powerful local interests, and<br />
achieve sufficient scale in areas such as<br />
health and education?<br />
These concerns have already sparked<br />
wide-ranging debate. Some critics suggest<br />
that the Ministry of the Interior is<br />
trying to retain bureaucratic supervision<br />
over the TAOs. Shortly before the 1999<br />
act, it appointed a special officer to oversee<br />
each TAO. Provincial and district officials<br />
instruct TAOs on government policies<br />
which the TAOs must implement. Efforts<br />
have been made to coopt TAO members<br />
into the culture of the bureaucracy.<br />
Equally, some fear that the TAOs will be<br />
captured by local “dark influences” or<br />
become clearing houses for local contractors<br />
in the same way as the provincial<br />
councils.<br />
Some go further and charge that this<br />
decentralization has been “designed to<br />
fail”. The choice of the tambon as the<br />
level for decentralization came about<br />
because of fierce opposition from the<br />
Ministry of the Interior to effective democratization<br />
at the provincial level. The<br />
tambon units may in many cases prove<br />
too small both in terms of budget size<br />
and human resources.<br />
While TAOs have found it easy to take<br />
over the management of infrastructure<br />
provision, it is not clear what they will do<br />
with the budget expansion planned over<br />
coming years. Education is flagged in the<br />
constitution as a priority area, but teacher<br />
organizations have expressed reservations<br />
about TAOs ability to manage local education.<br />
How committed is the government to<br />
seeing the project through? The Thaksin<br />
Cabinet inaugurated in 2001 launched a<br />
pilot project of “CEO governors” in five<br />
THE NEW INSTITUTIONAL CONTEXT FOR COMMUNITY EMPOWERMENT<br />
provinces. These governors have additional<br />
powers, report directly to the prime<br />
minister’s office, and are supposed to<br />
catalyse local development. This innovation<br />
appears to contradict the trend towards<br />
democratic decentralization. With<br />
the central government facing strong<br />
budget constraints in the wake of the<br />
economic crisis, the increasing fund allocation<br />
to local government may well<br />
come under threat.<br />
These concerns show that the next five<br />
years will be critical for the success or<br />
failure of the tambon-focused decentralization<br />
scheme.<br />
Environment and Participation<br />
In 1999, a TAO in a mountainous and forested area of the north approved a<br />
concession to a quarry company. Local people objected, formed a protest<br />
movement, petitioned the TAO, and then demonstrated outside the provincial<br />
headquarters. They claimed:<br />
the quarries were located in a watershed forest, and would affect both<br />
drinking water supplies and irrigation;<br />
the quarries would disrupt popular tourist spots and religious places;<br />
the TAO had not consulted people, not allowed participation in the<br />
decision, and not acted transparently.<br />
The TAO members were forced to resign. At new elections, members of the<br />
protest group gained a majority. The new TAO held a public meeting,<br />
inviting the quarry company and relevant officials. Villagers found that the<br />
concession agreement had false data (e.g., overestimating the distance<br />
between quarry and village as 5 rather than 2 kms), and that the concession<br />
payment to the TAO had somehow been reduced by two-thirds. After<br />
these revelations, local people took a close interest in the operation of the<br />
TAO, and particularly in its management of the environment so important<br />
to the residents of a forest area. Meetings had to be moved to a bigger<br />
building to accommodate observers.<br />
Education reform: a long<br />
struggle?<br />
As with the other reforms, the aspirations<br />
of the education reformers have run<br />
up against the realities of bureaucratic<br />
inertia, social conservatism, and political<br />
self-interest. The education reform is especially<br />
vulnerable because it aims to change<br />
– Case from a research study supported<br />
by the National Counter Corruption Commission<br />
45
Our fate is in the<br />
hands of both<br />
the officials and<br />
ourselves. But more<br />
in the hands of<br />
officials.<br />
– Villager in a community project<br />
46<br />
the lives of a large and influential social<br />
group – the teachers – and because it<br />
tries to disempower a well-entrenched<br />
section of the bureaucracy.<br />
Teachers are respected and influential<br />
figures within local communities. For that<br />
reason, they have long been recruited<br />
into the networks of elective politicians.<br />
In return for their political service, they<br />
can demand repayment. Since passage<br />
of the National Education Act, 1999 some<br />
teachers have lobbied to adjust the<br />
implementation. Ministers, who have to<br />
think of their party’s political base, have<br />
been vulnerable to this lobby. The teachers<br />
have been particularly uncomfortable<br />
about the new bodies to oversee quality,<br />
and about the switch from rote to childcentred<br />
learning.<br />
Similarly, the education bureaucracy has<br />
resisted the Act’s drastic decentralization<br />
of education administration. It has tried<br />
to influence the supplementary legislation,<br />
in particular to retain budgetary<br />
control. It has tried to assimilate the new<br />
local boards with its existing structure of<br />
76 provincial offices, rather than establishing<br />
a new and more localized network of<br />
295 zones. Eventually, a compromise of<br />
175 zones was agreed.<br />
These and many other issues are the<br />
subject of debate and political wrangling.<br />
But from the angle of communities, there<br />
is a further concern. The intention of the<br />
reform lobby to bridge the gap between<br />
local learning and school learning is<br />
clear, and Section 29 of the Act provides<br />
an enabling framework. But there is no<br />
institutional mechanism to ensure this<br />
opportunity will be taken. In effect, it<br />
requires a separate effort in each community.<br />
Many communities have innovated,<br />
even in advance of the Act. But it is<br />
likely that these efforts will be sporadic<br />
in the absence of any mechanism to<br />
generalize them.<br />
CONCLUSION<br />
Our fate is in the hands of both the<br />
officials and ourselves. But more in<br />
the hands of officials.<br />
– Villager in a community project<br />
Community empowerment is difficult to<br />
imagine outside a context of democracy.<br />
Between the 1970s and 1990s, Thailand<br />
made a transition from military dictatorship<br />
to parliamentary democracy. This<br />
created the political space within which<br />
activists, NGOs, academics, and others pioneered<br />
experiments in strengthening communities,<br />
and demanding more democratic<br />
approaches to economic policy-making.<br />
In the mid-1990s, these efforts achieved<br />
sufficient scale to drive through some<br />
important changes in the institutional<br />
environment. Community rights were<br />
written into the 1997 constitution. Community<br />
strengthening and participation<br />
featured prominently in the Eighth and<br />
Ninth Plans. Decentralization legislation<br />
created democratic local government at a<br />
low level of the state pyramid. Reforms<br />
set out to improve the quality, accessibility,<br />
content and social relevance of education.<br />
These changes have not taken place without<br />
reaction. The previous era of state<br />
centralization and top-down development<br />
has created many vested interests which<br />
resist such changes. The institutional<br />
changes themselves are incomplete in<br />
many ways. There is a serious risk that the<br />
reform trend will falter before these<br />
new institutions can be truly effective in<br />
aiding community empowerment. There<br />
are struggles to come.<br />
We will return to consider ways to<br />
continue reform in the institutional context<br />
in chapter 4. But first we will look<br />
more closely at how in reality community<br />
empowerment has developed from the<br />
bottom up over the past two decades.<br />
<strong>THAILAND</strong> <strong>HUMAN</strong> <strong>DEVELOPMENT</strong> <strong>REPORT</strong> <strong>2003</strong>
CHAPTER<br />
PROMOTING COMMUNITY EMPOWERMENT<br />
In the past when we wanted to say<br />
something, we were afraid. Now<br />
we’re not afraid.<br />
– Villager on an education project<br />
A LEARNING PROCESS ON<br />
A NATIONAL SCALE<br />
Community empowerment is a learning<br />
process on a national scale. It cannot be<br />
conceived as something which happens<br />
only within communities, or as part of<br />
the relations between communities and<br />
government agencies. It is part of a<br />
broader change from dictatorship and<br />
control to democracy and humanism.<br />
This change faces barriers in the form of<br />
old institutions, entrenched mentalities,<br />
and vested interests. To be successful,<br />
community empowerment must command<br />
understanding, acceptance, and<br />
support in the society at large. The previous<br />
chapter showed how international<br />
changes and domestic pressures combined<br />
to change the institutional environment.<br />
This chapter looks at how the<br />
practice of community empowerment<br />
developed in very practical ways from the<br />
bottom-up as a learning process involving<br />
the communities themselves and outside<br />
actors including NGOs and activists,<br />
businesses, research agencies, government<br />
departments, and international agencies.<br />
The movement began from the efforts of<br />
local communities to develop innovative<br />
ways to grapple with problems thrown up<br />
by social and economic change. The first<br />
section of this chapter notes two of the<br />
most widespread and successful examples:<br />
credit schemes and environmental<br />
PROMOTING COMMUNITY EMPOWERMENT<br />
campaigns. Gradually outside agencies<br />
became more involved in assisting,<br />
sponsoring, or initiating such projects.<br />
The second section of this chapter looks<br />
at key examples of cooperation between<br />
communities and business organizations,<br />
and between communities, NGOs, international<br />
agencies, and government<br />
bodies.<br />
The possibility to accelerate this bottomup<br />
movement depends on accumulating<br />
learning at both the local and national<br />
levels. This function was initially undertaken<br />
by NGOs and development<br />
agencies. The third section looks at how,<br />
from around 1990, government agencies<br />
began to sponsor research aimed at<br />
both understanding the community and<br />
promoting its social and economic roles.<br />
By the late 1990s, these efforts had<br />
resulted in a considerable body of<br />
learning.<br />
One important initial application of this<br />
learning was in efforts to replace topdown<br />
methods of planning by bottom-up<br />
procedures. The fourth section reviews<br />
the thinking behind these procedures,<br />
and their adoption by some government<br />
agencies.<br />
The 1997 economic crisis increased the<br />
urgency to identify those most affected<br />
by the crisis and deliver schemes of social<br />
protection and income generation. The<br />
fifth section reviews how more government<br />
and development agencies looked<br />
to communities to perform these roles.<br />
The most important of these was the<br />
Social Investment Fund (SIF) which devised<br />
innovative methods to provide<br />
funds directly to community groups for<br />
projects of building social capital.<br />
3<br />
To be successful,<br />
community<br />
empowerment<br />
must command<br />
understanding,<br />
acceptance, and<br />
support in the<br />
society at large.<br />
47
48<br />
COMMUNITY SCHEMES<br />
FOR EMPOWERMENT<br />
From the 1970s onwards, several hundred<br />
thousand community-based organizations<br />
and networks developed in Thailand.<br />
These groups and networks were created<br />
to cover a wide range of issues such as<br />
livelihood, environment, culture, alternative<br />
farming, natural resource management,<br />
micro-finance, basic industrial<br />
management, eco-tourism, health care,<br />
and education. Some originated wholly<br />
within the village. Some were started by<br />
“development monks”. Some were promoted<br />
by NGOs. Among the variety of<br />
examples, two particular types were widespread<br />
and successful – credit schemes<br />
and environment projects. This reflected<br />
that growing debt and declining access to<br />
natural resources were two of the key<br />
problems faced by communities in the<br />
“age of development”.<br />
Savings and credit<br />
Savings groups have been one of the<br />
most widespread and successful forms of<br />
community enterprise. Often they are<br />
formed in an attempt to control the rising<br />
level of debt to banks and money-lenders.<br />
They provide low-cost finance for local<br />
enterprises. In some cases they have<br />
expanded into providing various kinds of<br />
welfare and social protection. Many<br />
The Power of Unity<br />
The Honesty Savings Group Network in Trat province, consists of 152 small<br />
savings groups and has over 30,000 members. Each group asks members<br />
to come and deposit the same sum on the same day each month, so the<br />
members meet together regularly and interact on a basis of equality.<br />
The network negotiated with a cooking gas wholesaler to reduce the<br />
wholesale price of his product. The wholesaler, in acceding to this reduced<br />
price, remarked, “I have just come to understand the power of unity”. The<br />
Network then distributed the cooking gas directly to the savings groups at<br />
the purchase price, thus bypassing the middleman.<br />
The profits were used for welfare or community projects. The network<br />
plans to negotiate similar deals with other suppliers of goods and services.<br />
examples are associated with local religious<br />
institutions (temples, mosques, or<br />
churches). While they help the community<br />
members to participate in the market<br />
economy, they are often not run on strict<br />
market principles, but are devoted to<br />
maintaining the community, its ethics, and<br />
its way of life. In some cases they have<br />
opened community shops, or become<br />
the base for other kinds of community<br />
activity.<br />
According to a study by Poladet Pinprathip,<br />
in 1999 there were 51,667 community<br />
financial groups with almost 7 million<br />
members and assets of 16,810 million baht.<br />
Many are over twenty years old. The key<br />
features are:<br />
the initial reason for the scheme confronts<br />
a major community problem,<br />
namely the growth of debt dependence,<br />
the fund is not a simple replacement<br />
for a bank, but extends into social<br />
protection,<br />
cooperation on this scheme provides<br />
a basis for other community projects,<br />
these schemes are not covered by<br />
any law,<br />
in the absence of law, the principles<br />
and authority come from elsewhere –<br />
often from the local religious leadership,<br />
Buddhist, Muslim or Christian<br />
communities. Elsewhere they come<br />
from the collective moral authority of<br />
the community itself.<br />
Protecting the environment<br />
In many places, communities were<br />
mobilized to protect natural resources<br />
on which their livelihood depended. In<br />
particular the rapid decline of the forest<br />
area prompted communities to find ways<br />
to preserve what remained. The increasing<br />
pollution of rivers and decline of fish<br />
stocks prompted similar attempts.<br />
In certain instances they were able to<br />
negotiate cooperation with government<br />
agencies to put in place systems for<br />
<strong>THAILAND</strong> <strong>HUMAN</strong> <strong>DEVELOPMENT</strong> <strong>REPORT</strong> <strong>2003</strong>
protecting the local environment. Often<br />
these efforts began when resources on<br />
which the community depends came<br />
under threat from outside forces.<br />
Analysis of such local environmental<br />
projects concludes that there are two<br />
main criteria for success:<br />
Community organizations must be<br />
the most prominent actors; official<br />
organizations such as tambon<br />
administrative organizations (TAOs)<br />
may be supporting actors.<br />
Effective community regulations are<br />
those that are based on and built<br />
from the community’s traditional<br />
values and norms. Kinship, local network,<br />
and community participation<br />
provide additional guarantees for a<br />
sustainable natural resource base.<br />
Community versus Loggers<br />
The Krongkram watershed in Surat<br />
Thani province was threatened by new<br />
agricultural settlers, by logging under<br />
a legal concession, by an irrigation<br />
scheme, and by a Forest Industry<br />
Organization reforestation project.<br />
Three hundred villagers from Tambon<br />
U-tae protested against the reforestation<br />
proposal but were powerless to<br />
halt logging. Then the National Park<br />
Authority proposed to enclose the<br />
villagers’ own farmland. The community<br />
felt that they could not handle<br />
the situation alone. They formed a<br />
Krongkram Watershed Environment<br />
Group in alliance with other villages<br />
and NGOs. The group submitted plans<br />
to the Regional Forest Office which<br />
resulted in cancellation of the irrigation<br />
project, and some cooperation to halt<br />
illegal logging. The community then<br />
established a set of rules under which<br />
community members use the forest.<br />
The Krongkram watershed is now<br />
thriving. It is home to over 3,000<br />
species of trees, many of great size and<br />
value. Each family earns 2,000 to 3,000<br />
Baht per year from forest produce. The<br />
forest has become a vital resource to<br />
the community, while still functioning<br />
COMMUNITIES AND OUTSIDE<br />
AGENCIES<br />
In the 1980s, other outside agencies<br />
turned to community projects. Those<br />
involved included business corporations,<br />
international development agencies, and<br />
government departments. In this section<br />
we highlight a few key examples.<br />
Business and community<br />
Protecting Forests and Fish<br />
In 1967 the leaders of Silalaeng village, Nan province, prohibited logging in<br />
the forest along a 50-metre strip beside the river. The area was expanded<br />
to 150 metres the next year. Six years later, a total ban was put in place. In<br />
1975, the Silalaeng Conservation Group was established to look after the<br />
forest by creating a set of regulations. The forest management scheme was<br />
financed through other community projects such as a savings group, youth<br />
society, and weaving club. The Group was able to expand its activities to<br />
regulate fishing areas in the rivers, and to ban fishing using electric devices,<br />
explosives, or chemicals.<br />
The Population and Community Development<br />
Association (PDA) was formed<br />
in 1976 by a former official of NESDB,<br />
Mechai Viravaidya, to promote family<br />
planning. PDA later extended into refugee<br />
work and HIV/AIDS prevention, and<br />
established good relations with both the<br />
health ministry and international donors.<br />
From the early 1980s it devoted more<br />
attention to community uplift – through<br />
credit schemes, water supply, incomegenerating<br />
schemes – as an integral part<br />
of its health objectives. In the late 1980s<br />
– against a background of rising social<br />
tension, increasing rural-urban migration,<br />
continuing recruitment of village girls into<br />
the sex trade, and steeply rising corporate<br />
profits – Mechai began to involve<br />
corporations in community schemes.<br />
His TBIRD 32 scheme encouraged companies<br />
to donate towards community<br />
schemes and to relocate some business<br />
activity into the villages. A pioneer case<br />
was Bangkok Glass which first sponsored<br />
as a valuable watershed. 32 Thai Business Initiatives for Rural Development.<br />
PROMOTING COMMUNITY EMPOWERMENT<br />
49
50<br />
community activities in a northeastern<br />
village, and later founded a small factory<br />
there to make brushes to clean glass<br />
moulds. Bata Shoes followed. The company<br />
initially opened one village-based<br />
factory, and later added six others which<br />
operate as cooperatives selling their output<br />
to Bata. Another shoe manufacturer<br />
copied the same model. With these<br />
successes, PDA was able to gain<br />
assistance from the Ministry of Industry,<br />
support from international development<br />
agencies, and participation by over 130<br />
firms, Thai and multinational. Mechai<br />
presented the scheme as a way to impart<br />
new skills, raise incomes, reduce ruralurban<br />
migration, diminish the income gap,<br />
and offer companies a chance to participate<br />
in community development.<br />
A different strategy was pursued by<br />
Bangchak, a state enterprise involved in<br />
oil refining. Bangchak promoted communities<br />
in three ways. First, it encouraged<br />
community groups to take up franchises<br />
to start Bangchak gas stations as a way to<br />
increase community income. Second, it<br />
opened a chain of stores inside urban gas<br />
stations which sold products produced by<br />
community enterprises. Third, Bangchak<br />
donated to NGOs, grassroots organizations,<br />
and public campaigns which<br />
promoted community causes. Executives<br />
of the company presented Bangchak as a<br />
model of socially responsible capitalism.<br />
Community, NGO, international<br />
agencies and government<br />
The HIV/AIDS pandemic afflicted Thailand<br />
from the late 1980s. Government responded<br />
in the early 1990s, but at the<br />
time knowledge about the condition was<br />
poorly developed on a worldwide scale.<br />
Parts of rural northern Thailand were<br />
especially badly affected.<br />
The first HIV/AIDS patient in Mae Chan<br />
district of Chiang Rai province was<br />
identified in 1988. Within the next three<br />
years, the district had the highest infection<br />
rate in Thailand. The local hospital<br />
was swamped with cases.<br />
The head of the hospital responded by<br />
mobilizing the community. A coordination<br />
centre was founded, and the commu-<br />
nity involved from the start in planning its<br />
activities. The regional health authorities<br />
became involved. So too did new NGO<br />
networks such as the Northern NGO<br />
Coalition on AIDS and the Network of<br />
People Living with AIDS. International<br />
agencies piled in with funding, training,<br />
and support for networking between the<br />
community, government, and NGOs. Australia<br />
provided support for four years, and<br />
then the European Commission took over.<br />
The centre coordinated work between<br />
the hospital, patients themselves, their<br />
families, NGOs, youth groups, and monks<br />
from the local temple. The monks visited<br />
a Lopburi temple which was already<br />
involved in HIV/AIDS care, and were given<br />
training by the hospital. Then they set up<br />
a day-care centre beside the temple,<br />
educated the community about the pandemic<br />
through sermons at the temple<br />
and over local radio, served as counsellors<br />
to patients, and used their expertise in<br />
herbal medicine to treat secondary infections.<br />
Patients formed self-help groups to raise<br />
income through handicraft production.<br />
NGOs helped to form youth groups which<br />
spread education about AIDS prevention<br />
through the schools and through puppet<br />
dramas. Community meetings were held<br />
to educate families about the pandemic,<br />
emphasize the need for compassion, ease<br />
the resistance to disclosure, and persuade<br />
families to care for patients at home.<br />
What makes Mae Chan special is that it<br />
is the first time in the history of the<br />
epidemic that so many sectors of a<br />
community have banded together to<br />
fight against HIV/AIDS.<br />
– Lee-Nah Hsu,<br />
Manager of UNDP’s Southeast Asia<br />
HIV and Development Project 33<br />
The Ministry of Health adopted the model<br />
for use elsewhere in Thailand. In 2000, a<br />
workshop was held to disseminate the<br />
Mae Chan model as “good practice” for<br />
the Southeast Asian region.<br />
33 See www.hiv.development.org.<br />
<strong>THAILAND</strong> <strong>HUMAN</strong> <strong>DEVELOPMENT</strong> <strong>REPORT</strong> <strong>2003</strong>
The violence of the HIV/AIDS prompted<br />
many innovations. The cooperation between<br />
the local community, health officials,<br />
international agencies, and NGOs<br />
at Mae Chan was just one small example.<br />
It was expensive. But it provided inspiration<br />
for other cooperative experiments,<br />
particularly in community health care.<br />
UNDERSTANDING<br />
COMMUNITY EMPOWERMENT<br />
Until recently, such examples of community<br />
projects and cooperative schemes<br />
were scattered and rather isolated. Some<br />
NGOs and development agencies helped<br />
to network local groups, and multiply<br />
groups by publicizing successful examples.<br />
But these efforts were piecemeal and<br />
often limited in funding.<br />
Researching the community<br />
In the early 1990s, as NGOs and new<br />
development activists began to have a<br />
voice in policy-making, some government<br />
bodies began to sponsor research on<br />
community issues. The Office of the<br />
National Education Commission conducted<br />
research into local wisdom and<br />
learning networks. The Office of the<br />
National Culture Commission investigated<br />
the role of local wisdom and culture in<br />
rural development.<br />
A major advance came in 1993 with the<br />
foundation of the Thailand Research Fund<br />
(TRF), a government funding body for<br />
research. TRF identified research “to build<br />
community strength” as one of its seven<br />
priority areas. TRF funded projects geared<br />
to practical issues such as what constitutes<br />
community strength, how participation<br />
can be encouraged, what means<br />
can be used to develop community<br />
economies, and how schools and communities<br />
can cooperate to enhance community<br />
learning.<br />
As recounted in chapter 1, communities<br />
contend that their capacity for selfreliance<br />
and self-help has been severely<br />
PROMOTING COMMUNITY EMPOWERMENT<br />
weakened by the government’s past<br />
development policies of economic liberalization.<br />
In one TRF project, Napaporn<br />
Hawanon maps the causal relationship<br />
between the government’s development<br />
process and the resulting community<br />
weaknesses as follows:<br />
Development<br />
Process<br />
Profit-oriented<br />
production process,<br />
utilizing high capital<br />
and specialized<br />
labour<br />
New consumption<br />
patterns<br />
Static education<br />
system, geared to<br />
urban and industrial<br />
economy<br />
Deterioration of<br />
natural resources<br />
Effects on<br />
Community<br />
Relationships<br />
Decreased<br />
interdependence<br />
Dependence on<br />
external markets<br />
Dependence on<br />
external<br />
technology<br />
Dependence on<br />
external expertise<br />
Effects on<br />
Community<br />
Knowledge System<br />
New knowledge<br />
does not satisfy<br />
community’s<br />
needs<br />
Old knowledge is<br />
not adapted to<br />
modern society<br />
Lack of integration<br />
of new and old<br />
knowledge<br />
The project also identified the characteristics<br />
of communities which tended to<br />
be empowered.<br />
1. self-sufficient communities (e.g.<br />
mixed farming communities),<br />
2. mono-crop communities with strong<br />
production base, high bargaining<br />
power, and marketing advantages,<br />
3. communities with diversified sources<br />
of income,<br />
4. communities that rely on natural<br />
resources and are able to preserve<br />
the resource base,<br />
Resulting<br />
Community<br />
Weakness<br />
Community<br />
subject to<br />
external risks<br />
Lack of resources<br />
for subsistence<br />
Lack of<br />
independent<br />
authority to deal<br />
with problems<br />
Decline in sense<br />
of community<br />
51
52<br />
5. communities that have a good<br />
savings and funding mechanism and<br />
do not have to rely on external banking<br />
and informal loan systems,<br />
6. communities that are able to<br />
cultivate civic consciousness so that<br />
members live peacefully and look<br />
after one another,<br />
7. poor communities that successfully<br />
improve their conditions due to<br />
external intervention, e.g. development<br />
projects,<br />
8. communities which are affected by<br />
industrial expansion but can adjust to<br />
take advantage of the dual economy,<br />
9. politically strong communities in<br />
which members participate actively<br />
in local affairs and are able to<br />
advocate their demands to local<br />
governments.<br />
Napaporn summarized the learnings<br />
from the research sponsored by TRF<br />
on community empowerment as follows.<br />
Community empowerment policies<br />
should recognize that there are<br />
various ways and means to achieve<br />
community empowerment, and allow<br />
each community to choose the most<br />
appropriate option.<br />
Local wisdom is valuable, but<br />
communities also have to learn new<br />
knowledge such as business management,<br />
production, and marketing<br />
techniques. Communities have to<br />
learn to apply both sets of knowledge.<br />
Research and education<br />
institutions should facilitate the<br />
integration of knowledge for the<br />
communities.<br />
Many communities are adjusting<br />
themselves to the commercial<br />
economy. Capital accumulation is<br />
important and communities can mobilize<br />
funds within specific occupational<br />
groups, or through community<br />
enterprises and savings groups.<br />
Policy to support community capitalization<br />
should take account of this<br />
diversity.<br />
The community learning process is<br />
another important component. Communities<br />
should be able to manage<br />
their own database and assess their<br />
own strength. A general guideline<br />
can be developed, and external<br />
facilitators provided for this purpose.<br />
These conclusions show that a community’s<br />
strength is a function of how well<br />
it can deal with the outside forces of<br />
government and market, and this in turn<br />
depends on the community’s body of<br />
knowledge, ability to cooperate, and<br />
access to natural resources.<br />
Learning and planning<br />
This research clarifies that community<br />
empowerment must be conceived as a<br />
learning process, which has two parts.<br />
First, communities must retain or recover<br />
their own knowledge and their confidence<br />
that this knowledge has value.<br />
However, on its own this is not enough<br />
for them to deal effectively with the outside<br />
world and its constant and rapid<br />
change. Second, communities must also<br />
develop the capacity to import and<br />
absorb new knowledge from outside.<br />
There are many examples of communities<br />
which have created their own knowledge<br />
system by integrating old and new knowledge,<br />
prompted by the desire to survive<br />
and prosper. Some communities are able<br />
to find ways to function successfully in<br />
the modern economy, while at the same<br />
time practising local methods to conserve<br />
the natural environment and maintaining<br />
the social and cultural practices which<br />
give the community strength and value.<br />
Such communities are able to survive and<br />
continuously build their own stock of<br />
social capital.<br />
Community empowerment is a continuous<br />
learning process. The communities<br />
learn how to cope with risk, how to seek,<br />
preserve, and capture the resources<br />
necessary for subsistence, how to cope<br />
with problems, and how to create a sense<br />
of community awareness. This process<br />
involves problem-solving, decision-making,<br />
development of human skills, and a<br />
capacity to plan and implement.<br />
<strong>THAILAND</strong> <strong>HUMAN</strong> <strong>DEVELOPMENT</strong> <strong>REPORT</strong> <strong>2003</strong>
Another TRF project headed by Supasit<br />
Lakong looked at prospects for community<br />
planning. It found that people<br />
wanted to participate in planning and<br />
that participation yielded positive results.<br />
Plans that arose from highly participatory<br />
community forums were different from<br />
the community plans devised by village<br />
leaders alone. They were more oriented<br />
towards self-reliance. Communities which<br />
participated in planning exercises were<br />
more likely to cooperate with the local<br />
administration, and the local administration<br />
in turn was more likely to work to<br />
satisfy the needs of the community.<br />
PLANNING FOR COMMUNITY<br />
EMPOWERMENT<br />
The old community development paradigm<br />
rested on the assumption that rural<br />
communities needed guidance and motivation<br />
to upgrade their living conditions<br />
to the “national standard” which was itself<br />
tied to an international standard. Under<br />
this strategy, government agencies<br />
supported communities by transferring<br />
knowledge and technology to these<br />
communities and then expecting them to<br />
apply these new techniques to “improve”<br />
their communities.<br />
New problem-solving paradigm<br />
Some government departments have<br />
embraced a new development paradigm<br />
which starts by inspiring communities to<br />
solve their own problems. This is very<br />
different from the past use of external<br />
incentives. The thinking and decisionmaking<br />
approach is not based on international<br />
practices and standards, but varies<br />
according to the community’s environment<br />
and current situation. Knowledge<br />
is not externally determined and then<br />
“imported”, with the presumption that the<br />
community will adopt and adapt this<br />
information. Instead, knowledge begins<br />
with what exists within the community.<br />
Knowledge generation and accumulation<br />
largely happens through community<br />
exchanges, which require extensive<br />
participation by community members. It<br />
PROMOTING COMMUNITY EMPOWERMENT<br />
Comparison of the Community’s Old and<br />
New Problem-Solving Paradigms<br />
Key Old Development<br />
Characteristics Paradigm<br />
is more of a “learning process” than a<br />
“knowledge transfer” or “training process”.<br />
Often, the result is a new body of<br />
knowledge, a new consciousness, and a<br />
new value system that gives priority to<br />
self-reliance and mutual self-help.<br />
Exercises in community<br />
planning<br />
Recently, government agencies have<br />
accepted that communities should take<br />
on greater responsibility in planning local<br />
development. The Local Administration<br />
Department issued a directive asking<br />
every district throughout the country to<br />
prepare an “Action Plan” and a “Vision for<br />
Development” over the next five years<br />
(2002-6). These plans are to be based on<br />
a participatory process.<br />
In the opinions of some, however, this<br />
directive did not recognize many of the<br />
processes involved in creating and<br />
promoting a strong community. These<br />
“Community Development Plans” did not<br />
encompass actions that communities<br />
were already undertaking to empower<br />
themselves. The directive was therefore<br />
widely criticized and rejected by many<br />
village, tambon, and district organizations.<br />
New<br />
“Community Empowerment”<br />
Development Paradigm<br />
Dynamics External motivation and Inspiration from within,<br />
material incentives goal of sufficiency<br />
Standard, norm National/international No fixed standard; depend<br />
on individual situation<br />
Knowledge Exogenous transfer of Participatory and holistic<br />
generation knowledge generally learning process<br />
disconnected from the Build on community’s<br />
community’s traditional existing experience<br />
wisdom Focus on learning,<br />
awareness and common<br />
consciousness<br />
53
“Examine the<br />
problem and start<br />
with the things<br />
we already have.<br />
Dream of things we<br />
are capable of doing<br />
and gradually work<br />
towards that dream<br />
in a steady manner.”<br />
54<br />
Those “Community Development Plans”<br />
that were drafted under the directive<br />
often did not truly reflect the mobilization<br />
of people’s power that enhances community<br />
development. They were merely a<br />
checklist of the community’s problems<br />
and needs.<br />
In contrast, some government agencies<br />
have been able to work more successfully<br />
with communities by providing technical,<br />
advisory, and financial support. One<br />
case in point is the “Project for Increasing<br />
Capacity for Sustainable Agriculture”<br />
undertaken by the Ministry of Agriculture<br />
and Cooperatives in collaboration with<br />
agricultural community networks from<br />
over 120 tambon in 21 provinces, with<br />
budgetary support from UNDP. In this<br />
project, “community master plans” are<br />
developed based on the principle of selfreliance.<br />
Communities plan to utilize their<br />
own potential, in addition to learning<br />
from other communities within the<br />
network. The public sector and NGOs<br />
participate in this learning process by<br />
providing support in those areas where<br />
the community needs assistance. The<br />
process of developing such community<br />
plans involves six stages.<br />
Arena 1: Brainstorming. “Examine the<br />
problem and start with the things we<br />
already have. Dream of things we<br />
are capable of doing and gradually<br />
work towards that dream in a steady<br />
manner.” Community representatives<br />
from every village of the tambon join<br />
together to consider their past experiences,<br />
the results of development<br />
projects in rural communities, and<br />
their visions concerning sustainable<br />
development.<br />
Arena 2: Information Collection. “If we<br />
are to start solving our problems<br />
using the tools already at hand, using<br />
local resources and knowledge within<br />
the community, how should we<br />
begin?” This arena aims to gain an<br />
understanding of communal values<br />
and awareness; it attempts to increase<br />
self-reliance, interdependence,<br />
and the search for local potential.<br />
Upon leaving Arena 2, village volunteers<br />
begin the process of finding<br />
information about the community,<br />
such as information concerning the<br />
village’s history, leaders, debts, culture,<br />
local know-how, and resources.<br />
Arena 3: Information Exchange. In this<br />
arena, the village’s history, values and<br />
unique identity is related, and the<br />
villagers learn about the “good<br />
things” that they have within their<br />
community. They find out what skills<br />
and expertise different community<br />
members possess. They become<br />
aware of the changes that have<br />
impacted their lives as well as the<br />
problems facing them. Such information<br />
not only triggers a sense of love,<br />
affection, and loyalty to one’s<br />
community, but it also encourages<br />
villagers to ponder how they can remain<br />
together and solve communal<br />
problems, rather than going their<br />
separate ways.<br />
Arena 4: Analysis of Options. Here is<br />
where villagers study all options<br />
arising both from the ideas of the<br />
community itself and from the experiences<br />
of other communities that<br />
have successfully dealt with similar<br />
problems. Study tours are conducted<br />
to visit model communities, stimulating<br />
new and innovative ideas, which<br />
can supplement the community’s<br />
body of knowledge. New contacts<br />
and friendships are also made within<br />
the larger community network.<br />
Arena 5: Creating Plans. “What can we<br />
do to have enough to live on and to<br />
have a sustainable income for raising<br />
our families?” In this arena, problems<br />
particular to each family are expanded<br />
to represent the common<br />
concerns of the people in the community.<br />
The ideas conceived and the<br />
knowledge acquired in the previous<br />
arenas is used to create plans for<br />
solving the community’s problems<br />
in a viable way that will provide<br />
benefits to all the villagers. The community<br />
master plan begins to take<br />
<strong>THAILAND</strong> <strong>HUMAN</strong> <strong>DEVELOPMENT</strong> <strong>REPORT</strong> <strong>2003</strong>
shape, linking the community activities<br />
together in a mutually reinforcing<br />
manner. NGOs and officials from<br />
the government sector play an<br />
important role in analysing and<br />
linking the information to ensure that<br />
the plans from all the villages are<br />
feasible and can be implemented in<br />
a systematic manner.<br />
Arena 6: Drafting and Implementing a<br />
Plan. Master plans are presented to<br />
the communities at the tambon level<br />
in the form of public hearings. All<br />
interested villagers have the right to<br />
participate and to express their views.<br />
The drafting of a master plan for<br />
self-reliance within the community is<br />
illustrated in the chart.<br />
Some NGOs had experimented with similar<br />
community planning techniques on a<br />
smaller scale in the past, particularly the<br />
Village Foundation (Mulnithi muban) of<br />
Seri Phongphit. The technique begins by<br />
compiling a rough picture of the community’s<br />
accounts, both internal and external.<br />
These accounts then guide a search not<br />
only for opportunities to increase production,<br />
income, and well-being, but also to<br />
reduce outlays by greater self-reliance.<br />
This strategy aligns with H.M. the King’s<br />
emphasis on sufficiency.<br />
1. Review the past 2. Understand the present<br />
The Community Master Plan<br />
Assess one own’s<br />
local know-how<br />
resources<br />
savings<br />
culture<br />
3. Determine the future<br />
Community master plans for self-reliance and poverty alleviation often begin by cutting expenditures as well as by reducing<br />
production costs. Expenditure cutting may involve simple activities such as reducing soft drink consumption by substituting<br />
herbal drinks or soybean milk. Production costs may be cut by similarly simple methods: animal feed produced by the<br />
communities themselves using local materials; herbs that are readily found in the locality used in treating livestock diseases.<br />
Production costs may also be cut by encouraging group investments; for example, having community members co-invest in<br />
raising livestock. For community expenditures such as building schools, local materials and voluntary labour can reduce costs.<br />
The master plan also involves increasing earnings in diverse ways that are within the potential of the community. For example, a<br />
group of landless farmers in Tambon Wang Daeng, Uttaradit province, produced cement blocks using materials available in the<br />
locality and their own labour. The Ministry of Science, Technology and Environment helped them both in examining the quality<br />
of the soil used as raw materials and in acquiring equipment.<br />
As a part of increasing earnings, the master plans often involve community businesses for processing and increasing the value<br />
added to the community’s products. Examples of such businesses include projects for processing dried betel nuts, projects for<br />
improving the quality of mangosteen for export, and community mill projects. The community must concurrently implement<br />
plans for managing its natural resources so that the production process does not destroy the resource base of the community.<br />
PROMOTING COMMUNITY EMPOWERMENT<br />
The National Economic and Social Development<br />
Board (NESDB), with cooperation<br />
from SIF, has adopted these techniques of<br />
community planning for developing plans<br />
at the tambon level. In many TAOs<br />
formed since 1997, the first development<br />
plans were simply lists of infrastructure<br />
projects. NESDB and SIF promoted a<br />
framework of participative plan-making<br />
along the lines of the community-based<br />
model. The result was new plans with<br />
fewer construction projects, and more<br />
schemes to strengthen the local economy<br />
or extend social protection. As of January<br />
– Learnings from the Social Investment Fund (SIF)<br />
55
56<br />
Not the Document<br />
but the Process<br />
“People don’t understand<br />
what community plans are<br />
because they are used to<br />
the idea of plans that take<br />
the shape of a thick<br />
volume of papers. I am not<br />
looking for a pile of documents.<br />
I don’t want plans<br />
that are based on expertise<br />
outside the communities.”<br />
– Anek Nakabutra, Director of SIF<br />
2002, the “Self-Reliance Community Master<br />
Plan” has been applied to over 1,700<br />
tambon.<br />
From the experience of those involved in<br />
these experiments in community planning,<br />
certain characteristics are critical to<br />
success:<br />
Data must be updated and the learning<br />
process must be continuous.<br />
Implementation must be continuous.<br />
There must be regular meetings for<br />
the exchange of problems, information,<br />
and experiences.<br />
There must be cooperation among<br />
members of the public and private<br />
sectors and the villagers.<br />
Members of the younger generation<br />
must be recruited to participate in<br />
the plan in order to ensure future<br />
continuity.<br />
COMMUNITY-BASED<br />
CRISIS RELIEF<br />
The 1997 economic crisis placed the community<br />
at the centre of efforts to alleviate<br />
the social impact of the downturn, and to<br />
find ways to recover. The crisis increased<br />
the acceptance among government departments<br />
and other development agencies<br />
of the importance of community<br />
empowerment.<br />
At the outset of the 1997 crisis, government<br />
and the IMF envisaged a relatively<br />
mild crisis, confined mainly within the<br />
urban economy. By early 1998, however,<br />
it was realized that the crisis would be<br />
deep and far-reaching. The World Bank<br />
warned: “economic and social structures<br />
are under strain, and decades of unparalleled<br />
social progress are under threat....<br />
The poor are being severely hurt. Widespread<br />
economic hardships are tearing at<br />
the fabric of society”. The IMF supported<br />
plans for a “social safety net”.<br />
The speed with which the crisis drove<br />
more people into poverty emphasized the<br />
weakness of schemes of social protection.<br />
The attempts to create a “social safety<br />
net” which could accurately identify and<br />
effectively assist those impacted by the<br />
crisis proved to be very difficult. The poor<br />
are often almost invisible and very difficult<br />
to reach from the national capital.<br />
However, recent innovative research has<br />
shown that communities are well aware<br />
of who the poor are and what kinds of<br />
assistance they need.<br />
Experienced Thai observers warned that,<br />
on past experience, the impact of the<br />
crisis would fall heavily on rural society.<br />
Community activists took the opportunity<br />
to urge government to base its crisis relief<br />
strategies on support for local communities.<br />
Some government projects adopted<br />
this localized approach.<br />
“Sufficiency Economy”<br />
projects<br />
H.M. the King’s royal initiative on the<br />
Sufficiency Economy aimed to combat the<br />
impact of the crisis in the short term, and<br />
to alleviate poverty in the longer term, by<br />
two associated strategies.<br />
Self-reliance: Community self-reliance<br />
can be demonstrated in several ways:<br />
replacement of external production<br />
materials with local ones, use of local<br />
experts instead of external experts,<br />
use of local wisdom to create income-generating<br />
activities instead of<br />
adopting new and unfamiliar techniques,<br />
reliance on local sources of<br />
funds instead of external borrowing,<br />
community self-management in lieu<br />
of reliance on external support,<br />
hands-on and take-charge actions<br />
instead of waiting for government<br />
assistance, as well as more emphasis<br />
on building social capital along with<br />
economic capital.<br />
Sufficiency: Communities regard sufficiency<br />
as the key poverty reduction<br />
strategy. They opt to produce commodities<br />
that are readily marketable.<br />
They focus on reducing expenses<br />
rather than increasing income. In<br />
addition, communities ensure that<br />
there is adequate production for<br />
household consumption.<br />
<strong>THAILAND</strong> <strong>HUMAN</strong> <strong>DEVELOPMENT</strong> <strong>REPORT</strong> <strong>2003</strong>
The Ministry of Interior adopted the strategy<br />
of a Sufficiency Economy and gave<br />
support to 50,093 vocational groups with<br />
531,989 members, 3,425 community business<br />
groups, 11,247 self-reliant groups,<br />
1,833 groups creating new designs and<br />
improved packaging, and 359 groups<br />
receiving certification for their production<br />
standards.<br />
One major strand of the Ministry of Interior’s<br />
strategy, also supported by other<br />
agencies and the private sector, was<br />
to develop and upgrade community<br />
businesses such as small community rice<br />
mills, rubber-processing plants, noodle<br />
factories, food and beverage making,<br />
small petrol stations, and community<br />
shops. Assistance and advice was given<br />
to upgrade the quality of products, to<br />
reduce production costs, to create new<br />
designs, to improve packaging, and to<br />
plan marketing strategies.<br />
Community participation<br />
The Community Development Department<br />
expanded the scope of community<br />
participation in the Tambon Development<br />
Project and the Poverty Alleviation<br />
Project. In the past, only members of<br />
village committees were involved in<br />
submitting projects to seek funds from<br />
the Tambon Development Project, and<br />
approving loan requests from the Poverty<br />
Alleviation Project for poor people<br />
seeking investment loans. Procedures<br />
for both projects were changed so that<br />
forums involving all the stakeholders in<br />
the community have an opportunity<br />
to take part in the decision-making<br />
process.<br />
The Eighth Plan had championed the<br />
concept of partnership building and<br />
networking among public offices and<br />
private organizations. This had resulted<br />
in the formation of “civic assemblies” in<br />
some provinces to debate strategies of<br />
local development. In this context, the<br />
National Social Policy Committee (NSPC)<br />
was founded in 1998 to recommend<br />
strategies to help people cope with the<br />
social impact of the crisis. It was the first<br />
national committee where representa-<br />
PROMOTING COMMUNITY EMPOWERMENT<br />
tives from the private sector and civil<br />
society outnumbered bureaucrats. It<br />
identified community empowerment not<br />
only as an important way to mitigate<br />
the social and economic impact of the<br />
crisis, but also as a key social reform<br />
strategy.<br />
By 1999 it was evident that government<br />
agencies had difficulty in identifying<br />
and targeting those most affected by the<br />
crisis. NSPC drew up the Community<br />
Empowerment Response to Crisis Action<br />
Plan (CERCAP) designed to enhance the<br />
community capacity to help with identification<br />
and targeting. It helped improve<br />
the community’s ability to identify solutions<br />
to their problems. With a minimal<br />
budget, CERCAP facilitated community<br />
civic assembly processes and bottom-up<br />
planning. It also helped mainstream<br />
community plans into the government’s<br />
regular programs.<br />
The Rural Development Fund (RDF) was<br />
expanded to provide credit directly to<br />
community-based organizations. In 1999,<br />
2,722 community-based organizations<br />
benefited from RDF loans totalling 831<br />
million Baht. In 2001, the government<br />
merged the RDF and the Urban Development<br />
Fund to establish the Community<br />
Organizations’ Development Institute<br />
(CODI), which supports community empowerment<br />
on a continuous basis. CODI<br />
is an autonomous public organization<br />
with a nationwide community organization<br />
network and total funding of Baht<br />
2,700 million.<br />
Social Investment Fund (SIF)<br />
The largest crisis relief measure was<br />
initiated by the World Bank and the Japan<br />
Bank for International Cooperation. In initial<br />
debate on this project, representatives<br />
of Thai civil society urged “Don’t give<br />
money to the government and bureaucracies”<br />
as it would result only in leakage<br />
and delay. The agencies in fact decided<br />
to channel part of the funding through<br />
government offices (mainly into employment<br />
generation schemes), but to channel<br />
the major part directly to communitybased<br />
projects. This included a Regional<br />
Urban Development Fund (RUDF) of $30<br />
57
58<br />
million for loans to municipal governments,<br />
and the Social Investment Fund of<br />
$120 million for grants to community<br />
organizations.<br />
The Social Investment Fund (SIF) was<br />
managed through a new Social Fund<br />
Office (SOFO) placed under the Government<br />
Savings Bank (GSB), headed by<br />
Paiboon Wattanasiritham, the former<br />
banker turned community activist. The<br />
primary objective of SIF was defined as:<br />
Transforming the economic crisis into<br />
an opportunity for social reform at<br />
the urban and rural grassroots levels.<br />
This reform should start with the social<br />
capital that is inherent in each<br />
locality and join forces with them to<br />
assist in the development of their<br />
learning processes and the strengthening<br />
of their capabilities in order<br />
to empower those communities to<br />
be self-reliant in the long run.<br />
The objectives also included “Strengthening<br />
the rural economic base by emphasizing<br />
economic self-reliance as a new<br />
alternative for Thai society” and “Strengthening<br />
the society through the establish-<br />
The Objectives of the Social Investment Fund<br />
To encourage social reform through the decentralization of authority to<br />
include community participation in development;<br />
To strengthen the capacity-building of local communities and local<br />
organizations, especially in decision-making and management to be<br />
self-reliant in the long run;<br />
To promote local self-reliant economic systems;<br />
To promote multi-party partnership between the government and the<br />
people;<br />
To stimulate local participation in social development including the<br />
promotion of civil societies and the concept of good governance;<br />
To support investment in community assets such as necessary social<br />
and economic infrastructure to communities through the development<br />
of human, social and natural resource capital.<br />
The SOFO will thus combine short-term objectives of employment, income<br />
generation and social welfare with the long-term objective of strengthening<br />
local management capacity through participatory decision-making at<br />
the community level. While addressing short-term social and economic<br />
problems, a long-term objective of this program is to use the process of<br />
allocating funds as a means to strengthen local community capacities.<br />
ment of civil society networks”. The<br />
management of the fund was placed<br />
under a 16-member board including<br />
academics, NGO workers, officials, and six<br />
community representatives. Project proposals<br />
were solicited directly from “community<br />
organizations”, roughly interpreted<br />
to mean any grouping which had existed<br />
for one year. Funding was dispersed<br />
directly to community organizations<br />
through the GSB. Monitoring and evaluation<br />
were carried out by academics.<br />
From 1998 to early 2002, SIF supported<br />
over 7,200 projects with total funds of<br />
4,100 million baht. Half the funding was<br />
channelled to projects for immediate<br />
welfare. The remainder was distributed<br />
over a broad range of projects to build<br />
social capital. The number of beneficiaries<br />
(according to the application forms) was<br />
over 12 million. It was the first time a<br />
large sum of public resources was transferred<br />
to support community-led initiatives<br />
where the funds were directly<br />
managed by grassroots organizations.<br />
A full evaluation of the impact of SIF<br />
funding is not yet available. But SOFO<br />
has compiled reviews of learnings from<br />
the process. 34<br />
The project started slowly because many<br />
NGOs were reluctant to cooperate in a<br />
project funded by the World Bank, and<br />
because the World Bank was so worried<br />
about corruption and leakage that it<br />
imposed strict working guidelines under<br />
central control. Eventually however, the<br />
SIF executive persuaded the World Bank<br />
to allow the work of screening and<br />
monitoring projects to be decentralized<br />
to eleven regions; and eventually NGO<br />
workers understood that the scheme was<br />
valuable and accepted that the immediate<br />
management was controlled by the Thai<br />
board not the World Bank. The SIF board<br />
was then able to establish regional<br />
and provincial committees manned by<br />
“doctors, lawyers, social activists, business-<br />
34 SOFO, 999 Days of Learning: Social Investment<br />
Fund, February 2002; and 37 Months of Social<br />
Investment Fund Operations: Volume I, Development<br />
of the Social Investment Fund, April 2002.<br />
<strong>THAILAND</strong> <strong>HUMAN</strong> <strong>DEVELOPMENT</strong> <strong>REPORT</strong> <strong>2003</strong>
persons, religious and spiritual leaders,<br />
community leaders, journalists, teachers<br />
and professors” which screened, appraised,<br />
and monitored projects. The incidence of<br />
corruption was low and was managed by<br />
local consultation.<br />
The main problems then lay in working<br />
with the old power structure:<br />
Local and national politicians<br />
schemed to gain access to the funds.<br />
Officials in central agencies endorsed<br />
the scheme, but local officials did not<br />
necessarily follow central directives.<br />
Local officials often questioned the<br />
legitimacy of the SIF scheme, or saw<br />
it as a rival to their own work. “Many<br />
officials were keen to work for the<br />
public benefit, but they ran up<br />
against the fact the bureaucracy is<br />
not used to working with others.”<br />
Some SIF volunteers were equally<br />
reluctant about working with officials.<br />
SIF pioneered a new method of funding<br />
community projects resulting in significant<br />
learnings both for the communities<br />
themselves and for the civil society<br />
organizations involved. “The process of<br />
applying for SIF is already a learning<br />
process that is a part of community<br />
capacity building” (Ammar Siamwalla,<br />
chairman of SIF). Communities had to<br />
come together and learn how to write a<br />
project proposal. NGOs helped. “It really<br />
stirred things up”, reported one villager<br />
involved. The SOFO report lists some of<br />
the indirect benefits as follows:<br />
Learning about the rights and<br />
responsibilities of the individual and<br />
of government organizations to the<br />
community.<br />
Learning about community power<br />
in self development and community<br />
development.<br />
Participation in every stage of the<br />
implementation process resulting in a<br />
sense of ownership and the desire to<br />
maintain the activity or structure that<br />
was created.<br />
PROMOTING COMMUNITY EMPOWERMENT<br />
Emergence of the process of identification<br />
and application of social<br />
capital that in some cases is personal<br />
expertise that will soon be lost.<br />
The direct benefits are difficult to quantify<br />
since the funding mostly went into<br />
projects to build social capital which is<br />
difficult to measure. However, those<br />
involved in SIF identified certain projects<br />
as of special interest:<br />
Projects to build child-care centres<br />
where SIF imposed conditions to<br />
ensure community participation in<br />
such things as funding teacher costs,<br />
providing lunches.<br />
Projects of immediate social welfare<br />
which involved people in the<br />
community devising ways to assist<br />
children, the elderly, the sick, and<br />
those affected by HIV/AIDS. In some<br />
cases SIF pioneered ways to fund<br />
social protection in a self-reliant way<br />
from the profits of community businesses<br />
and credit schemes.<br />
After two years, SIF adopted the<br />
technique of participative community<br />
planning, and in retrospect would<br />
have institutionalized this from the<br />
very beginning.<br />
The volunteer bodies formed to screen<br />
applications subsequently took on other<br />
tasks, such as participating in consultations<br />
on the Ninth Plan. The Community<br />
Organizations’ Development Institute tried<br />
to build on the momentum of SIF. It set<br />
up a network of community-level activists<br />
to develop regional plans, and to provide<br />
help to weaker communities in their dealings<br />
with government and other agencies.<br />
Thai Rak Thai government’s<br />
village projects<br />
In January 2001, a new government came<br />
to power headed by the Thai Rak Thai<br />
party of Thaksin Shinawatra. The party<br />
succeeded at the elections in part<br />
because of an innovative appeal to voters<br />
on a platform of popular measures: debt<br />
relief for farmers, a million-baht revolving<br />
fund for each village, and a 30-baht-pervisit<br />
health care scheme. The party won<br />
a near-majority at the polls, and built a<br />
59
60<br />
1. Capacity and Learning Development in<br />
Community Occupation and Community<br />
Economy such as recycling, eco-tourism,<br />
community enterprise demonstration<br />
centres, agricultural demonstration<br />
centres, integrated agriculture,<br />
agricultural service centres, savings<br />
group networks, agricultural processing<br />
and community markets.<br />
2. Community Welfare and Safety such as<br />
self-reliant alternative medicine<br />
treatment or herbal treatment centres,<br />
senior citizens’ health centres, child<br />
development centres and halfway<br />
houses for HIV/AIDS patients.<br />
3. Restoration, Protection, Management<br />
and Promotion of Culture, Environment<br />
and Natural Resources such as<br />
reforestation, forest management,<br />
forest fire prevention, flood prevention<br />
and drainage, waste management and<br />
folk museums.<br />
4. Group and Network Capacity Building<br />
such as development and processing<br />
of local products, establishment of<br />
information centre, production of<br />
newsletters, community announcement<br />
centre/tower, community radio,<br />
observation/study tours, seminars<br />
and information systems.<br />
5. Immediate Community Welfare<br />
Project for the Needy (Menu 5) which<br />
emphasizes the provision of immediate<br />
assistance directly to beneficiaries that<br />
have been severely impacted upon<br />
by the economic crisis.<br />
Total<br />
Social Investment Fund: Menus, Projects, Budget and Evaluation<br />
Total<br />
Subproject menu Projects<br />
Approved<br />
Budget<br />
(Mil. Baht)<br />
3,181 778<br />
1,207 354<br />
789 194<br />
1,533 819<br />
457 2,016<br />
7,167 4,161<br />
Evaluation: Strengths Evaluation: Weaknesses<br />
Communities process<br />
and add value to local<br />
resources, learn production<br />
management and<br />
some have secondary<br />
occupations and generate<br />
increased income.<br />
Communities are united,<br />
provide high levels of<br />
community counterpart<br />
contribution; highest level<br />
of attainment of objectives<br />
and highest level of<br />
management efficiency.<br />
Communities are<br />
conscious of the need to<br />
protect natural resources<br />
and arts and culture, to<br />
mobilize funds, create<br />
networks and continue<br />
other development work.<br />
Created networks and<br />
responds to community<br />
communities are<br />
empowered in<br />
determining future<br />
emergence of new<br />
generation of leaders.<br />
Problems of product<br />
development, marketing,<br />
communities are uncertain<br />
about consuming community<br />
products, lack of revolving<br />
funds.<br />
Some communities lack<br />
maintenance plan, utilization<br />
plan and participatory learning<br />
resulting in charity and the<br />
status of provider-receiver<br />
within some communities.<br />
Disadvantaged community<br />
members lack the opportunity<br />
to participate because they<br />
have to concern themselves<br />
with making a living, in<br />
addition, these activities do<br />
not provide results instantly.<br />
Some communities lack<br />
coordination of body of<br />
knowledge and community<br />
lifestyle, community members<br />
have not benefited fully,<br />
creation of community<br />
facilitator does not match<br />
community needs.<br />
Projects and budget for September 1998 to January 2002, from SOFO, 37 Months of Social Investment Fund Operations: Volume II, Progress<br />
Report. Evaluation from Executive Summary End of Project Reports, June 2001.<br />
coalition commanding around 350 of the<br />
total of 500 parliamentary seats. In its<br />
first year in office (from February 2001),<br />
the government implemented all its main<br />
election promises.<br />
The scheme to provide a revolving fund<br />
of 1 million baht for each of the nation’s<br />
70,000 villages was inspired by the ideal<br />
of community-based development, and<br />
developed in conjunction with grassroots<br />
<strong>THAILAND</strong> <strong>HUMAN</strong> <strong>DEVELOPMENT</strong> <strong>REPORT</strong> <strong>2003</strong>
NGOs. The new government also<br />
launched a People’s Bank by creating a<br />
new window for small loans from the<br />
Government Savings Bank, and launched<br />
a scheme of “one tambon, one product”<br />
based on the model from Oita prefecture<br />
in Japan. The village fund was launched<br />
and distributed to most of the nation’s<br />
villages in 2001.<br />
Like SIF, the village fund is managed and<br />
allocated by a village committee, not a<br />
government entity. Unlike SIF, however,<br />
there is no emphasis on building social<br />
capital or providing social welfare. The<br />
same one million sum is provided to each<br />
village, irrespective of size or need. The<br />
sum is a loan (as a revolving fund), not<br />
a grant. The government monitors the<br />
repayment record, but has less interest in<br />
the process whereby the fund is allocated,<br />
or the results achieved.<br />
These schemes have become both<br />
popular and controversial, for several<br />
reasons. First, the objectives seem to be<br />
mixed. The prime minister, Thaksin<br />
Shinawatra, has explained that the<br />
schemes are intended to “solve the<br />
problem of poverty of the majority” and<br />
“reduce the socio-economic gaps between<br />
the poor and the well-to-do, and,<br />
especially between the rural and urban<br />
sectors”. This is needed “to ensure social<br />
cohesion and political stability, which will<br />
enable economic recovery and growth”. In<br />
addition he has said that the plans are<br />
attempts “to encourage Thais to be more<br />
entrepreneurial”.<br />
Second, the schemes are also part of an<br />
attempt at fiscal stimulus. Hence some<br />
fear that disbursing the money quickly<br />
may be more important than ensuring it<br />
is well spent.<br />
Third, some believe that the large sums of<br />
money being given to villages may tear<br />
the community apart. The practice of<br />
easy handouts by the government could<br />
jeopardize the community’s financial selfdiscipline<br />
and thereby weaken the community’s<br />
self-reliance. One grassroots<br />
organizer noted that it commonly took<br />
five years for a village credit fund to<br />
accumulate assets of one million baht –<br />
PROMOTING COMMUNITY EMPOWERMENT<br />
with the managers and members learning<br />
by the process – but with the new<br />
scheme a million baht appears in an instant.<br />
Another commented that this was<br />
just another temptation to debt, which<br />
eventually forced villagers to migrate in<br />
search of work. Another complained that<br />
the scheme was unsystematic, and failed<br />
to learn from SIF.<br />
These schemes are promoted by a<br />
government with a dominating parliamentary<br />
majority. The amount involved in the<br />
government’s village projects surpasses<br />
any previous attempt to provide funding<br />
for local community projects and hence<br />
has the potential to have an enormous<br />
impact. As yet there is no publicly available<br />
independent evaluation (except of<br />
the repayment). But the launching of<br />
these schemes has created a new facet<br />
in the debate on the true meaning of<br />
community empowerment.<br />
CONCLUSION<br />
Community empowerment is a learning<br />
process on a national scale. The motive<br />
force must come from within communities<br />
themselves. But success requires<br />
understanding and acceptance by government<br />
and civil society.<br />
Among the many community groups<br />
which had emerged by the 1990s, largely<br />
under their own steam, two types stand<br />
out. The first are savings and credit<br />
groups. The second are groups trying to<br />
manage the local environment. These reflect<br />
the two main problems facing local<br />
communities in the midst of rapid economic<br />
and social change, namely the<br />
vulnerability to debt, and the importance<br />
of the community’s natural resources.<br />
Groups formed to confront these two<br />
issues often served as the basis for other<br />
community projects, including social<br />
protection, health care, and education.<br />
Some experiments in cooperation<br />
between communities and outside actors<br />
emerged from the 1980s onwards. Companies<br />
sponsored income-enhancing<br />
projects. Donor agencies began to channel<br />
funds direct to community groups.<br />
The amount<br />
involved in the<br />
government’s village<br />
projects surpasses<br />
any previous<br />
attempt to provide<br />
funding for local<br />
community projects<br />
and hence has the<br />
potential to have an<br />
enormous impact.<br />
61
62<br />
The HIV/AIDS pandemic prompted a<br />
pioneer example in coordination between<br />
government agency, community, and<br />
NGOs.<br />
The broader social effort to understand<br />
community empowerment took a major<br />
step forward in the early 1990s when<br />
officially sponsored research agencies set<br />
The Community and the Rest<br />
A debate which has raged among community theorists from the 1970s to<br />
the present revolves around the relations between the community and<br />
other social actors – particularly government, the business sector, and the<br />
urban middle class. This debate has sharpened with the recent proliferation<br />
of community-based schemes, backed by organizations (government, World<br />
Bank) with significant funding.<br />
At one end of the spectrum are schemes designed to integrate communities<br />
with the urban economy. Often these schemes are designed to<br />
promote entrepreneurship, and come with strong financial backing.<br />
The Thaksin government schemes represent this end of the spectrum. So<br />
do several schemes launched by corporations and NGOs to involve local<br />
communities with specific business operations. The TBIRD scheme, for<br />
example, links local community businesses to multinational companies<br />
as subcontractors. The Bangchak oil refinery encourages communities to<br />
operate gas stations on franchise, and sells community products through its<br />
store network.<br />
Critics from the other end of the spectrum argue that such schemes do not<br />
truly strengthen communities but rather make them dependent. They<br />
argue that the promotion of entrepreneurship and urban values threatens<br />
the intrinsic community values which are worth preserving. They believe<br />
that community empowerment must emerge bottom-up, not from showers<br />
of money.<br />
Activists like Seri Phongphit and Phittaya Wongkun are sceptical of business<br />
patronage of community schemes because they see no concrete basis of<br />
common interest over the long term. They are sceptical also of government<br />
financial patronage as it contradicts the principles of sufficiency and<br />
self-reliance. Instead they advocate networking to increase communities’<br />
strength in bargaining with the urban economy and the government.<br />
Community rights advocates like Saneh Chamarik and Anan Ganjanaphan<br />
agree with the need for local strength, but also believe that claims for<br />
community rights provide a stronger basis for communities to bargain from<br />
a position of moral strength.<br />
Activists like Prawase Wasi stand at the mid-point of the spectrum. They<br />
argue that political reality (the dominance of the urban economy and<br />
society) means communities must gain the political support of the urban<br />
middle class and of government. Prawase also constantly urges business<br />
and the middle class to recognize the value of local communities (“Don’t let<br />
us think that they are enemies like communists, we must think in terms of<br />
allies.”), and has advocated various “partnership” schemes to institutionalize<br />
the linkage.<br />
out to understand the community and<br />
promote its strength. A key finding of<br />
their research is that community empowerment<br />
is not a technique or administrative<br />
structure but a learning process<br />
that blends old and new knowledge, is<br />
continuous, goes through many stages,<br />
and may involve struggle.<br />
This insight was applied through bottomup<br />
planning techniques which aimed<br />
to facilitate and accelerate the learning<br />
process, and eventually to institutionalize<br />
it within the community. The first<br />
reaction of some participants in these<br />
exercises was the admission that they had<br />
forgotten how to learn.<br />
The 1997 crisis led many agencies to<br />
adopt community-based strategies. The<br />
crisis context in particular enabled some<br />
civil society leaders and a large number<br />
of volunteer activists to experiment<br />
with community-based attempts to build<br />
social capital under the SIF scheme. This<br />
experiment showed the huge potential<br />
for community action. It also revealed<br />
some of the remaining barriers. Some<br />
officials perceived it as a threat to their<br />
authority and their role. This reaction is<br />
another reminder that community empowerment<br />
is a learning process involving<br />
the whole society.<br />
Over the past decade, the movement<br />
towards community empowerment in<br />
Thailand has progressed from two<br />
directions. On the one hand, there has<br />
been a rapid increase in community-led<br />
initiatives. On the other hand, some<br />
government and other outside agencies<br />
have become positive and pro-active<br />
about the need to promote community<br />
empowerment in order to stimulate<br />
economic growth, build social capital, and<br />
enhance well-being. The marriage of<br />
these two forces has enormous potential.<br />
At this stage the process of community<br />
empowerment is more important than<br />
the specific outcomes. This is a transitional<br />
stage in which new techniques and<br />
new forms of government-community<br />
cooperation are being developed whose<br />
full potential will only be realized in the<br />
future.<br />
<strong>THAILAND</strong> <strong>HUMAN</strong> <strong>DEVELOPMENT</strong> <strong>REPORT</strong> <strong>2003</strong>
People like us need endurance. We<br />
need to build a model community so<br />
others can understand and follow. We<br />
know if we understand one another,<br />
care for one another, work for one<br />
another, and have discipline in our<br />
actions, then we will get justice.<br />
– Mun river villager<br />
Thailand is now at a crossroads. As the<br />
country moves beyond the crisis, the<br />
national agenda has begun to shift again.<br />
The prospect of renewed growth has<br />
redefined national priorities. The changes<br />
in the institutional framework now face a<br />
process of review in which arguments for<br />
minor improvements became confused<br />
with movements for serious weakening of<br />
the new Constitution. The Constitution<br />
and crisis have ushered in a new government<br />
with an explicit commitment to<br />
“think new, act new”. Much is now fluid.<br />
The extent to which community empowerment<br />
will guide and assist development<br />
will be determined by decisions<br />
made over the next few years.<br />
In this synthesis chapter, we first widen<br />
the scope and place the concept of community<br />
empowerment in its international<br />
context, historical context, and theoretical<br />
context in debates on development. We<br />
then look at the different interpretations<br />
of community empowerment in Thailand<br />
and show that, while there is a great deal<br />
of disagreement on detail, the various interpretations<br />
fit within a single framework<br />
– moreover, this framework comes from<br />
the communities themselves. On this basis<br />
we suggest what can be done in terms<br />
of public policy to develop community<br />
empowerment in Thailand as a strategy to<br />
further the goals of human development.<br />
COMMUNITY EMPOWERMENT AT THE CROSSROADS<br />
CHAPTER<br />
COMMUNITY EMPOWERMENT<br />
AT THE CROSSROADS<br />
WHY EMPOWERMENT?<br />
Human development is about more than<br />
income. It is about widening people’s<br />
choices to lead lives they value. This<br />
means expanding the capabilities of people<br />
to live long, healthy and creative lives,<br />
to acquire knowledge, to have access to<br />
the resources needed for a decent standard<br />
of living, and to enjoy dignity, selfrespect,<br />
and the respect of others. Policies<br />
in support of human development<br />
goals try to create an environment in<br />
which these capabilities can be enhanced.<br />
The globalizing trends of recent decades<br />
have made these goals both more important<br />
and more difficult to attain. The<br />
wealth of the world has increased rapidly,<br />
but the division between rich and poor,<br />
powerful and powerless, protected and<br />
unprotected, knowledge-rich and knowledge-deprived<br />
have become wider and<br />
often more rigid. At the same time,<br />
globalizing trends have changed the ways<br />
in which these human development goals<br />
must be pursued. While reports on the<br />
decline of the nation-state may be exaggerated,<br />
there has been growing acknowledgement<br />
of the role of other actors –<br />
unofficial, local, international – in the task<br />
of human development.<br />
Human development and<br />
human rights<br />
UNDP has long been committed to<br />
a participative, bottom-up approach to<br />
human development. However, UNDP<br />
responded to the new conditions of the<br />
globalization era with an important innovation<br />
– realizing the powerful synergies<br />
4<br />
63
The local<br />
communities’<br />
view of this “age of<br />
development” is<br />
highly specific.<br />
It highlights how<br />
environmental<br />
destruction affected<br />
their way of life.<br />
It stresses that<br />
“development”<br />
brought both<br />
material gains<br />
but also<br />
disempowerment.<br />
64<br />
between human development and human<br />
rights. This shift of thinking is the background<br />
to the importance of empowerment.<br />
A human rights-based approach to<br />
human development is not only about<br />
expanding people’s choices and capabilities<br />
but about the empowerment of people<br />
to decide how this should be achieved.<br />
Rights lend moral legitimacy to human<br />
development goals, and bring in legal tools<br />
as means to achieve them. Claims to rights<br />
are ways powerless and marginal groups<br />
can enlarge their political space. Development<br />
becomes a right not a gift – including<br />
the right to food, the right to good<br />
health, the right to housing, the right to<br />
education, the right of access to the means<br />
of livelihood, the right to have rights, and<br />
the right not to be poor. Governments<br />
may respond that there are barriers to<br />
meeting certain claims to rights because<br />
of lack of resources, conflicting claims, or<br />
institutional constraints. But the language<br />
of rights sets up a dialogue over how and<br />
when such barriers may be overcome.<br />
In sum, empowerment is a primary strategy<br />
to achieve the human development<br />
goals of poverty alleviation, equity, participation,<br />
and sustainable development.<br />
WHY COMMUNITY?<br />
Community activists in Thailand arrived at<br />
the same conclusion in response to the<br />
same international context but with some<br />
cultural influences that are quite distinctive.<br />
The background lies in the development<br />
era that stretched from the 1960s to<br />
the 1990s. By the post-war era, the centralized<br />
nation-state created in the colonial<br />
era was under the control of military<br />
dictators with strong external backing.<br />
Power was highly centralized and civil<br />
society suppressed. Through top-down<br />
development policies geared to industrialization,<br />
this powerful state achieved<br />
exceptionally high rates of growth, but<br />
with considerable costs including growing<br />
inequality of income and various entitlements;<br />
disruption of local communities;<br />
environmental destruction; and persistent<br />
poverty among certain groups.<br />
Development<br />
and disempowerment<br />
The local communities’ view of this<br />
“age of development” is highly specific. It<br />
highlights how environmental destruction<br />
affected their way of life. It stresses<br />
that “development” brought both material<br />
gains but also disempowerment. This is<br />
how this view was expressed by the<br />
communities contributing to this Report:<br />
In the past, villagers’ livelihood depended<br />
on resources of land, water,<br />
forest. They accumulated knowledge<br />
of using resources by experiment and<br />
practice. They valued coexistence<br />
with nature and with their community<br />
neighbours. They produced<br />
primarily for themselves. They overcame<br />
insecurity by mutual sympathy<br />
and sharing. These values were<br />
expressed and reinforced by customs<br />
and ceremonies. The memory of this<br />
past remains an ideal which shapes<br />
aspirations for the future.<br />
For the villagers, development had<br />
two sides. On the one hand, government<br />
provided social and economic<br />
infrastructure, new social services,<br />
agricultural support, credit, education,<br />
and access to information. In some<br />
respects, life changed for the better.<br />
But on the other hand, development<br />
also made agriculture more subject<br />
to the market and its risks, and more<br />
reliant on imported inputs of technology,<br />
capital, and knowledge which<br />
the villagers do not control. Many<br />
fell into debt, lost land, and had to<br />
migrate to the city. Besides, the city<br />
enclosed more natural resources to<br />
support the urban economy (such as<br />
for power generation) and destroyed<br />
others (such as through pollution).<br />
Villagers were often asked to “sacrifice”<br />
their access to resources for<br />
development in which they did not<br />
participate or benefit. They lost the<br />
power, the foundation of values, and<br />
the knowledge base to manage their<br />
own lives.<br />
– From the conclusion agreed among the<br />
community contributors to chapter 1<br />
<strong>THAILAND</strong> <strong>HUMAN</strong> <strong>DEVELOPMENT</strong> <strong>REPORT</strong> <strong>2003</strong>
Civil society and community<br />
From the mid-1970s, the collapse of external<br />
support for dictatorship and the<br />
gradual emergence of civil society began<br />
a trend towards formal democratization.<br />
But with the overhang from the feudal<br />
and dictatorial past, this democracy<br />
was highly exclusionary. Paternalism was<br />
etched into the mentality of the bureaucracy.<br />
Businessmen nurtured under the<br />
urban-biased development policy dominated<br />
the parliamentary system by exploiting<br />
the power of money. In response,<br />
excluded groups adopted a “people’s<br />
politics” of protest and negotiation, and<br />
began to seek “direct democracy”.<br />
In the emerging civil society opposition<br />
to both centralized power and top-down<br />
development policy, the idea of the<br />
community played an important role. The<br />
community was upheld as both a repository<br />
of values different from those<br />
intrinsic to industrialization, and a foundation<br />
for opposing or neutralizing centralized<br />
power. This thinking began among<br />
grassroots development workers, was then<br />
processed by academics and intellectuals,<br />
who handed back concepts and strategies<br />
to grassroots activists. By the 1980s, there<br />
was a “language” of community thinking<br />
which facilitated debate across villagers,<br />
development workers, and intellectuals.<br />
By the 1990s, advocates were able to<br />
push this language and its concepts into<br />
the halls of policy-making.<br />
By the time of the 1997 Asian crisis, the<br />
community idea in Thailand had the<br />
weight, complexity, depth, and sophistication<br />
which comes from a generation of<br />
debate and practice. The crisis moved it<br />
further into the mainstream. Advocates<br />
took the opportunity to blame the crisis<br />
on past development policy and to<br />
present community strategy as an alternative.<br />
Government and international<br />
agencies grasped onto community empowerment<br />
as a means to deliver social<br />
protection against the impact of the crisis.<br />
A wide-ranging debate on self-strengthening<br />
took on some of the language<br />
and perspective of community thinking.<br />
Concepts of “sufficiency” and “self-reliance”<br />
were adapted to national-level policy and<br />
written into the five-year plans.<br />
COMMUNITY EMPOWERMENT AT THE CROSSROADS<br />
Inside the community<br />
This Report pays little attention to divisions and inequalities within communities.<br />
Partly that is because local variety defies generalization. But there is<br />
also a reason based on Thailand’s political economy.<br />
In many societies, the divisions within rural communities arise from differential<br />
access to land – the classic rural society of landlord, tenant, and landless<br />
labourer. But Thailand’s rural society developed very differently because of<br />
the existence of an open land frontier. Until very recently, most households<br />
had access to land. When the land-man ratio started to deteriorate from<br />
the 1970s, urban growth drew much of the excess population off to the<br />
city. Still today, around 87 per cent of all holdings are owned and only 13<br />
per cent rented. Many of the rentals are inside a family, and others are<br />
absentees. Rural Thailand is a society of smallholders. It is hard to find a<br />
village in Thailand dominated by the house of the big landlord. But, in<br />
recent decades, the ranks of landless and land-poor have increased.<br />
Power in Thai rural society derives not from landholding as much as from<br />
connections to bureaucracy and capital. In local vocabulary this is termed<br />
itthiphon, influence, a different word from the phalang and amnat in<br />
“empowerment” because it is seen as a very different force. People inside<br />
the community draw on this influence. But its origins are outside the<br />
community. Combating this influence is part of community empowerment.<br />
Before the crisis, growing civil society<br />
pressure was bringing changes in statesociety<br />
relations and development policy<br />
orientation. Over the late 1990s, this<br />
pressure resulted in a substantial shift in<br />
the institutional context of development<br />
policy-making, namely a new Constitution<br />
enshrining new rights, a commitment to<br />
people-centred development planning, a<br />
programme of decentralization to local<br />
government, and an ambitious overhaul<br />
of the education system. In the urgency<br />
to cushion the social impact of the crisis,<br />
government departments and international<br />
agencies launched bold experiments<br />
to build social capital through<br />
community projects.<br />
Empowerment as a learning<br />
process<br />
The Thai version of community empowerment<br />
has been created in the same<br />
international context as the international<br />
agenda, and hence they have many<br />
similarities in concept, though great<br />
differences in the form of expression. The<br />
Thai community advocates make the<br />
whole approach revolve around “learning<br />
65
66<br />
The rapid deterioration of<br />
natural resources and the<br />
limited results of attempts<br />
at revival have impacted<br />
on the quality of life and<br />
well-being of the people,<br />
and have weakened the<br />
foundations of the society.<br />
– Ninth Plan summary<br />
(Thai version), chapter 3<br />
communities”. In essence this is the same<br />
as the Human Development concept of<br />
“expanding capabilities”. In the 1990s, the<br />
Thai advocates explicitly adopted the<br />
language of human rights because they<br />
understood its capacity to empower.<br />
To empower themselves again, communities<br />
need to remake a learning<br />
process. This begins with mobilizing<br />
the human resources of wisdom and<br />
leadership in the community to join<br />
together to identify and confront<br />
problems. The next stage is to recover<br />
local knowledge about using<br />
resources in an ethical and sustainable<br />
way. This knowledge may have<br />
to be adjusted and publicized so that<br />
the wider society understands and<br />
appreciates its meaning. The community<br />
may have to build networks<br />
outward from the community in<br />
order to gain space in the society,<br />
and secure access to the resources<br />
needed for livelihood and well-being.<br />
The community will gain the confidence<br />
and ability to learn from<br />
outside in ways which expand rather<br />
than destroy local capabilities.<br />
– From the conclusion agreed among the<br />
community contributors to chapter 1<br />
For many communities, the focus of their<br />
problems is the deterioration or loss of<br />
the natural resources which were the basis<br />
of their livelihood. The strength of the<br />
community is inseparably bound up with<br />
access to natural resources.<br />
WHAT IS EMPOWERMENT?<br />
The English word “power” combines two<br />
different meanings. The first is the power<br />
which is intrinsic to something, such as<br />
the power of a fuel. The second is the<br />
authority to command, such as the power<br />
of a government office or law. This<br />
ambiguity is repeated in many other<br />
languages, including Thai. The first meaning<br />
is expressed by phalang which is used<br />
in such contexts as “electric power”. The<br />
second meaning is expressed by amnat<br />
which is used in such contexts as “to seize<br />
power”. Often the two words are used<br />
together as phalang amnat. This was the<br />
form which the communities contributing<br />
to this project chose in the translation of<br />
“empowerment”. This acknowledges that<br />
community empowerment is not only<br />
about mobilizing internal resources, but<br />
also about confronting external power<br />
relations. One of the community representatives<br />
on this project commented:<br />
“Power (amnat) belongs to us; it doesn’t<br />
come from the government”.<br />
The community representatives who<br />
contributed to this project summarized<br />
their approach to community empowerment<br />
as three strategies:<br />
1. Building their community power to<br />
solve problems independently. Central<br />
plain farmers developed “sufficiency”<br />
systems of farming to escape the<br />
insecurity of market-oriented agriculture.<br />
The U-taphao communities<br />
developed the Bank of Life, not only<br />
to provide appropriate credit, but to<br />
fund social protection and to<br />
cultivate virtues such as sharing and<br />
sympathy.<br />
2. Building their community power to<br />
negotiate cooperation with outside<br />
agencies. Samrong canal communities<br />
became anti-pollution activists –<br />
not only cleaning up the canal but<br />
gathering data on the sources of<br />
pollution – in order to negotiate with<br />
state agencies and business groups<br />
to accept and support their right of<br />
residence.<br />
3. Building their community power and<br />
networks to claim and protect community<br />
rights. Communities in the<br />
northern highlands and along the<br />
Mun river lost access to the resources<br />
basic to their livelihood. To reclaim<br />
rights of access, they built networks<br />
of support in the society and beyond<br />
by reviving their local knowledge in<br />
managing resources, and finding<br />
ways to make other groups understand<br />
and support their claims.<br />
– From the conclusion agreed among the<br />
community contributors to chapter 1<br />
<strong>THAILAND</strong> <strong>HUMAN</strong> <strong>DEVELOPMENT</strong> <strong>REPORT</strong> <strong>2003</strong>
Importantly, the community representatives<br />
see these three strategies as successive<br />
stages of a single approach. Let us<br />
now look at each of these three strategies<br />
in more detail.<br />
1. Building their community<br />
power to solve problems<br />
independently<br />
In the past it was difficult to mobilize<br />
our own resources. Now it’s not.<br />
– Community leader<br />
I’ve seen how they do it on their own.<br />
So I’ve left them alone... they’re doing<br />
fine on their own.<br />
– Community Development Officer<br />
UNDP has defined empowerment as “the<br />
ability of people to gain understanding<br />
and control over personal, social, economic<br />
and political forces in order to take<br />
action to improve their life situations”.<br />
Outside agencies (NGOs, government offices,<br />
private sector, international agencies)<br />
can encourage, guide and facilitate the<br />
process, but essentially it is internal to the<br />
community. It begins with consciousness<br />
of the problems and the possibility of<br />
solution. It requires a learning process to<br />
analyse the problems, to revive relevant<br />
local wisdom, and to seek new knowledge.<br />
It moves then to the mobilization<br />
of social resources, and participative<br />
decision-making. The process, as well as<br />
the result, is empowering.<br />
This model corresponds closely to the<br />
example of the Bank of Life described in<br />
chapter 1. It is worth noting that this<br />
example of local micro-credit has been<br />
repeated – successfully – many times all<br />
over Thailand in the last two decades. SIF<br />
projects, and the current government’s<br />
village funds, are based on similar principles.<br />
Empowerment of this sort cannot<br />
be prescribed. It has to be learnt from<br />
practice.<br />
COMMUNITY EMPOWERMENT AT THE CROSSROADS<br />
2. Building their community<br />
power to negotiate<br />
cooperation with outside<br />
agencies<br />
This is an extension of the first strategy<br />
with the addition of government and<br />
other outside agencies as actors involved<br />
in both negotiating the solution and<br />
achieving the outcome. Outside agencies<br />
may provide budget funds, administrative<br />
resources, specialized knowledge, or<br />
authority to achieve the outcome. Communities<br />
have to learn how to deal with<br />
these outside agencies, and how to<br />
increase the assets they can bring to the<br />
negotiation. This may involve a further<br />
process of learning, and some building of<br />
networks with other groups in a similar<br />
situation, or with NGOs and other allies.<br />
Some departments of government have<br />
responded to this approach with enthusiasm.<br />
This is the model underlying<br />
the experiments in community planning<br />
described in chapter 3.<br />
However, the example of the Samrong<br />
canal communities adds an extra element.<br />
The Samrong communities began from a<br />
situation of disempowerment. They had<br />
no rights of residence and they were<br />
blamed for pollution of the canal. They<br />
were able to overcome these disabilities<br />
by cleaning up the canal, by identifying<br />
the sources of the pollution, and by<br />
creating a network of support among the<br />
various communities and some outside<br />
allies (NGOs, local business). The outcome<br />
was successful for all: the government’s<br />
task was eased, the canal was cleaned<br />
up, the communities were not evicted.<br />
The communities created a situation in<br />
which they could make a claim for the<br />
right to residence and the right to<br />
assistance from government. This example<br />
involves power not only as intrinsic<br />
power (phalang) but also as authority<br />
(amnat). It introduces questions of rights<br />
and the negotiation of claims to rights<br />
which are more prominent in the third<br />
strategy.<br />
67
68<br />
Our idea of struggle is<br />
that farmers need to join<br />
together to have power.<br />
The network across seven<br />
provinces in the North<br />
was created so that we<br />
have bargaining power.<br />
– Somchai Sirichai<br />
3. Building their community<br />
power and networks to<br />
claim and protect<br />
community rights<br />
Communities may be unable to solve<br />
their own problems for various reasons<br />
including: lack of access to the resources<br />
needed; blockage by powerful groups;<br />
bureaucratic opposition or inertia.<br />
Phalang (intrinsic power) comes up<br />
against amnat (authority). This is where<br />
the language of rights comes into play.<br />
Rights are claims on other people – on<br />
government, on neighbours, on society as<br />
a whole. The Mae Wang hill peoples and<br />
Mun river fishing communities were unable<br />
to achieve their goals of defending<br />
their livelihood and retaining their way of<br />
life because they did not have the power<br />
and resources to resist official agencies.<br />
They had to learn how to express their<br />
goals in terms of claims to rights. They<br />
had to create the social space in which<br />
those claims could be heard and understood<br />
by learning how to explain their<br />
problem to others, creatively adapting<br />
Access to Justice<br />
Judicial systems can also be undermined, providing little protection to<br />
ordinary people, especially poor people. Judicial systems are often inaccessible.<br />
They use official language that many people cannot speak or write.<br />
And too often they are open to bribes. 35<br />
In a national survey conducted on behalf of Thailand’s Civil Service Commission<br />
in 2000, almost a third of those involved in a court case over the<br />
previous two years had been solicited for a bribe. The total amount of such<br />
payments was estimated at over 3 billion baht a year. Delay in judgements<br />
and lack of objective decisions were given as the two main reasons for<br />
rejecting legal process as a means to settle a dispute. 36<br />
We are not clever at politics and we don’t know about law.<br />
– Community participant in this project<br />
35 UNDP, Human Development Report 2002, p. 66.<br />
36 Pasuk Phongpaichit et. al., Corruption in the<br />
Public Sector in Thailand: Perceptions and<br />
Experience of Households, report submitted<br />
to the Civil Service Commission, Political<br />
Economy Centre, Chulalongkorn University,<br />
2000.<br />
their local cultural practice, building wideranging<br />
networks of support, and being<br />
persistent.<br />
The language of rights is important<br />
because it sets up the framework for<br />
achieving a solution. Not all claims to<br />
rights will be met. A claim may conflict<br />
with the rights of other peoples. It may<br />
impose too high a cost on the society as<br />
a whole. It may be impossible to fulfil<br />
because the resources required are not<br />
yet available, or have been depleted.<br />
Equally the claim may be just, reasonable,<br />
and attainable, but is being blocked by<br />
vested interests or inertia. The language<br />
of rights defines the problem and makes<br />
it possible to negotiate a solution which<br />
is just for all parties concerned.<br />
But the solution requires an institutional<br />
mechanism in which claims to rights –<br />
and especially conflicting claims – can be<br />
negotiated. In essence, this is the function<br />
of the central institutions of a<br />
democracy – representative assemblies<br />
and legal systems. However, such institutions<br />
hardly figured at all in the communities’<br />
accounts of problem-solving and<br />
empowerment in chapter 1. Thai communities<br />
perceive parliament as dominated<br />
by business people and business concerns.<br />
As in many countries, the poor find<br />
it difficult to gain access to legal systems.<br />
Community participants in this project<br />
perceived law as “something which<br />
belongs to the state”.<br />
The failure of these key democratic<br />
institutions – elective representation and<br />
judicial process – to work for communities<br />
is the major impediment to community<br />
empowerment in Thailand.<br />
These disabilities shape the way communities<br />
currently attempt to negotiate their<br />
rights. In the histories in chapter 1, communities<br />
made their claims for rights by<br />
building social support and petitioning<br />
government. They first went to local officials,<br />
and finally worked their way right up<br />
to the prime minister. In their own<br />
accounts, they presented themselves as<br />
luk (children) asking for the consideration<br />
of pho (father). They still feel obliged to<br />
couch these appeals in the language and<br />
<strong>THAILAND</strong> <strong>HUMAN</strong> <strong>DEVELOPMENT</strong> <strong>REPORT</strong> <strong>2003</strong>
style of paternalism. In the Mun river<br />
case, the issue was projected right up to<br />
the international level with the involvement<br />
of the World Council of Dams.<br />
Whatever the wrong or right of the Mae<br />
Wang and Mun river cases, the accounts<br />
highlight the weakness of institutions to<br />
negotiate claims to rights.<br />
This weakness imposes a special responsibility<br />
on government to undertake the<br />
difficult task of listening. Elective democracy<br />
and judicial process do not function<br />
well in a society where paternalistic<br />
traditions remain strong. Official agencies<br />
must cultivate the ability to listen.<br />
This weakness of institutions also demands<br />
reform. Both these cases concerned<br />
access to natural resources. As<br />
such they were representative of a large<br />
number of other cases in Thailand over<br />
the past decade. There have been attempts<br />
to strengthen the institutional<br />
framework for managing natural resources.<br />
The Enhancement and Conservation<br />
of the Environment Quality Act 1992<br />
imposed stricter conditions on the performance<br />
of environmental impact assessments<br />
(EIAs). A Prime Minister’s Office<br />
regulation of 1996 introduced a procedure<br />
for public hearings. Section 46 of<br />
the 1997 Constitution defines the community’s<br />
right to participate in decisions<br />
on natural resources. The Community<br />
Forestry Bill attempts to substantiate<br />
these rights in one critical area.<br />
But these institutional initiatives have<br />
problems. A sequence of contentious<br />
projects has led to widespread concern<br />
that the environment act should be reviewed.<br />
There has yet to be an effective<br />
public hearing. The Community Forestry<br />
Bill is still blocked by controversy. The<br />
rights defined in the Constitution cannot<br />
yet be substantiated in reality. Several<br />
projects were approved under old rules<br />
but not yet implemented, and there is no<br />
mechanism to review these projects in<br />
the light of changed conditions.<br />
This remaining weakness in the institutional<br />
framework for adjudicating claims<br />
of rights of access to natural resources is<br />
the root of many lingering social conflicts.<br />
COMMUNITY EMPOWERMENT AT THE CROSSROADS<br />
ENHANCING COMMUNITY<br />
EMPOWERMENT<br />
What can be done to enhance community<br />
empowerment? Thailand now has a great<br />
deal of experience. Unofficial agencies<br />
have promoted community empowerment<br />
projects for at least two decades.<br />
Government bodies have become increasingly<br />
enthusiastic in recent years. The<br />
1997 crisis witnessed a wave of experiments.<br />
The task now is to build on<br />
the learnings of that experience, and to<br />
borrow learnings from elsewhere. In this<br />
task, there are roles for government, civil<br />
society organizations, development agencies,<br />
and the communities themselves. In<br />
sketching the tasks, we shall retain the<br />
three-level approach identified by the<br />
communities themselves.<br />
1. Solving problems internally:<br />
accelerating learning from<br />
experience<br />
There has been a great deal of experimentation<br />
with local schemes. The task<br />
now is to extract the practical learnings<br />
from these experiments, and find better<br />
ways to disseminate them. There is<br />
already considerable activity of this sort,<br />
undertaken by both government agencies<br />
and NGOs. But the effort could be greatly<br />
expanded.<br />
The Social Investment Fund (SIF) scheme<br />
has been the largest-ever attempt to<br />
fund communities to enhance social capital<br />
in Thailand. The learnings about such<br />
matters as project types, reasons for success<br />
and failure, management systems,<br />
and so forth are considerable.<br />
SIF’s internal evaluation emphasizes five<br />
areas where the learnings from the<br />
project should be carried forward to<br />
other schemes: 1) SIF has learned a lot<br />
about budget management, transparency,<br />
verification, and horizontal relations; 2)<br />
community learning has to be gradual<br />
and additive with new inputs at appropriate<br />
stages; 3) participative exercises in<br />
Elective democracy<br />
and judicial process<br />
do not function well<br />
in a society where<br />
paternalistic<br />
traditions remain<br />
strong. Official<br />
agencies must<br />
cultivate the ability<br />
to listen.<br />
69
Providing<br />
funding directly to<br />
communities can be<br />
more efficient and<br />
cost-effective than<br />
working through<br />
government<br />
agencies.<br />
70<br />
community planning are effective in<br />
defining problems and setting out the<br />
routes to practical solutions; 4) SIF has<br />
created many new assets of social capital<br />
which need to be catalogued and<br />
managed; 5) some organization should<br />
continue the task of promoting community<br />
strength and social capital with<br />
appropriate funding, and proper procedures<br />
for evaluation. 37<br />
SIF personnel tried to pass their experience<br />
onto the new government’s<br />
million-baht village fund, especially the<br />
importance of beginning from a community<br />
planning exercise. But the planning<br />
would take time which would conflict<br />
with one aim of the new scheme – to<br />
deliver a rapid fiscal stimulus. Besides, the<br />
SIF approach to planning stresses selfreliance,<br />
while the million-baht scheme<br />
leans towards increasing production and<br />
strengthening village linkages with the<br />
urban economy. By the time this report<br />
is published, the SIF project will have<br />
ended.<br />
There are several ways in which government<br />
and international agencies can<br />
help the internal learning process within<br />
communities by networking information<br />
and experience.<br />
The Thailand Research Fund has<br />
sponsored a great volume of research<br />
on community issues. The<br />
practical learnings need to be extracted<br />
from TRF’s considerable body<br />
of research, compiled in an accessible<br />
form, and widely distributed.<br />
Among specific local initiatives,<br />
one of the most successful and<br />
widespread has been community<br />
savings schemes or micro-credit. The<br />
learnings should be similarly compiled<br />
and disseminated in a “how to”<br />
form. The same approach may be<br />
applied to other schemes.<br />
37 Adapted from 37 Months of Social Fund<br />
Operations: Volume I, Development of the<br />
Social Investment Fund, April 2002, p. 33.<br />
The Social Fund Office (SOFO) which<br />
oversees SIF has begun to catalogue<br />
the learnings from SIF in a series of<br />
accessible booklets. 38 This effort<br />
needs to be extended, and the booklets<br />
widely distributed.<br />
The Community Organizations’ Development<br />
Institute has taken steps to<br />
maintain the momentum of SIF, by<br />
encouraging networking and mutual<br />
assistance among community leaders.<br />
This deserves support.<br />
The experience of SIF has implications<br />
for development agencies.<br />
Providing funding directly to communities<br />
can be more efficient and<br />
cost-effective than working through<br />
government agencies. The SIF experience<br />
offers considerable learning on<br />
how such support can be administered<br />
and monitored. Development<br />
agencies who believe in community<br />
empowerment should begin by listening<br />
to communities rather than<br />
relying on government agencies and<br />
other intermediaries.<br />
2. Negotiating cooperation<br />
with outside agencies:<br />
making decentralization<br />
work<br />
In fact, far from strengthening local<br />
democracy, decentralization can actually<br />
reinforce the power and influence of<br />
local elites.... Decentralization helps<br />
poor people most when local politics are<br />
democratic, with strong structures and<br />
open participatory practices. Only if<br />
accompanied by strong support to<br />
community groups can decentralization<br />
empower ordinary people.<br />
– Human Development Report 2002, p. 67-8<br />
38 SOFO has three series: Knowledge for the<br />
Community (Chut khwam ru pue chumchon),<br />
Learnings from the Community (Chut botrian<br />
jak chumchon), and Social Management<br />
(Chut kan jat kan thang sangkhom). Each<br />
booklet is around 40 pages with the emphasis<br />
on practical examples and illustrations.<br />
<strong>THAILAND</strong> <strong>HUMAN</strong> <strong>DEVELOPMENT</strong> <strong>REPORT</strong> <strong>2003</strong>
The most important arena for empowering<br />
communities to work effectively in<br />
cooperation with government is in decentralized<br />
and democratic local government.<br />
Thailand has selected the tambon as the<br />
level for democratic decentralization. The<br />
selection of such a relatively small unit<br />
(average population c. 8,000) has the<br />
advantage that communities may become<br />
closely involved. But it also has the risk<br />
that the Tambon Administrative Organization<br />
(TAO) may become ineffective<br />
because of weak management resources,<br />
ease of capture by sectional local interests,<br />
or subordination to the bureaucracy.<br />
These risks are well understood and<br />
widely discussed. The government has<br />
established programmes of training.<br />
There are already projects launched<br />
to research the performance of TAOs<br />
and expose shortcomings. However, as<br />
democratic decentralization is a very new<br />
departure in the context of the Thai<br />
governmental system, conditions are likely<br />
to change very rapidly, and the learning<br />
process will take some time. This points<br />
to the need for continuous monitoring,<br />
and a readiness to adjust the system to<br />
reflect changing realities.<br />
Enhancing the TAOs’ potential to empower<br />
communities will depend on some<br />
basic principles.<br />
Maintain the commitment to make the<br />
TAOs work. Early studies on TAO performance<br />
have already revealed considerable<br />
problems. However, these<br />
problems should not become an<br />
excuse to diminish the momentum of<br />
decentralization, including the transfer<br />
of budget and responsibilities.<br />
Encourage participation to avoid<br />
capture by sectional or bureaucratic<br />
interests. Early studies show that<br />
many TAOs, like the PAOs before<br />
them, have been captured by contractors.<br />
Also, local officials sometimes<br />
try to guide the TAOs excessively,<br />
and to discourage local<br />
participation. If these trends persist,<br />
communities may see the TAOs as<br />
COMMUNITY EMPOWERMENT AT THE CROSSROADS<br />
just another example of old forms of<br />
influence, and lose faith in their<br />
capacity to respond to local needs.<br />
The solution is greater participation.<br />
Research shows TAOs work better<br />
in areas where people are already<br />
organized for communal action.<br />
Building communal activity (savings<br />
groups etc.), totally separate from the<br />
TAOs, is one way to make the TAOs<br />
more effective.<br />
Guide TAOs into policy areas which will<br />
impact on the poor. Communities will<br />
be keen to participate if the TAO’s<br />
work impacts on them directly in a<br />
positive way. Many TAO members<br />
are uncertain how to utilize their<br />
growing budgets beyond the infrastructure<br />
provision which has hitherto<br />
been the focus of local government.<br />
TAOs must be guided to<br />
undertake pro-poor policies.<br />
Guide TAOs to be active in management<br />
of local resources. Management<br />
of natural resources is a vital issue<br />
everywhere, and a great opportunity<br />
for TAOs to serve community needs<br />
and hence increase community<br />
participation.<br />
Extend community planning and<br />
integrate with TAOs. The experiments<br />
in community planning technique<br />
have been successful in encouraging<br />
participation. This is an important<br />
method to integrate TAOs with the<br />
local communities.<br />
To achieve these principles will need<br />
a great effort to a) research and<br />
monitor the actual performance of<br />
TAOs; b) disseminate the practical<br />
learnings; and c) foster community<br />
activity. To be most effective, these<br />
tasks should be undertaken outside<br />
the government framework. This is<br />
an opportunity for international<br />
agencies to work with local civil<br />
society organizations.<br />
Democratic decentralization is a<br />
worldwide trend. There is a great<br />
deal of practical learning accumulating<br />
about the process, its problems,<br />
Research shows<br />
TAOs work better<br />
in areas where<br />
people are already<br />
organized for<br />
communal action.<br />
71
72<br />
In the past we were made to think that<br />
the poor were the nation’s leftover jumble,<br />
its stumbling point. This thinking is a<br />
barrier to understanding how to create<br />
policies to help the poor. Quite the other<br />
way round, we should understand that the<br />
poor are the nation. Eradicating poverty is<br />
eradicating the real enemy of the nation,<br />
and is more important than “national<br />
wealth” which concentrates in a handful of<br />
people.<br />
and how to overcome them.<br />
Thailand must continually tap this<br />
learning in order to increase its<br />
chance of achieving success in this<br />
historic shift in administration.<br />
Perhaps the most common request<br />
from communities participating in<br />
this project was simply that government<br />
should listen more, and pay<br />
greater respect to opinions, demands,<br />
and expertise that comes from the<br />
grassroots.<br />
3. Claiming community rights:<br />
improving the institutions<br />
Communities have learnt<br />
how to claim rights to<br />
defend their livelihood<br />
and way of life. This is<br />
a fact of life. It is an<br />
outcome of the growing<br />
worldwide interest in<br />
rights issues over the<br />
past decade, and the<br />
strengthening of Thailand’s<br />
civil society.<br />
– Nithi Eiewsriwong, Historian and Social Critic39 Because of its history,<br />
Thailand is weak on<br />
institutions to negotiate<br />
rights. This is not unusual.<br />
Many developing countries have<br />
similar weakness. Moreover, Thailand has<br />
a strong positive trend towards democratization<br />
which is the first prerequisite for<br />
any changes to strengthen the institutional<br />
framework. The 1997 Constitution<br />
has put the major principles in place. The<br />
task now is implementation. But this has<br />
to overcome barriers of opposition, inertia,<br />
and knowledge deficits.<br />
The first task is to complete the unfinished<br />
business of the Constitution, particularly<br />
where it deals with the rights of access<br />
to natural resources which are of critical<br />
importance to local communities.<br />
39 Nithi Eiewsriwong, Khon Jon and Nayobuy<br />
Kan Tam Hai Jon Kong Rath (The Poor and<br />
the State’s Impoverishment Policy) Thailand<br />
Development Support Committee, 2000,<br />
p. 124.<br />
Pass a law on public hearings so that<br />
public hearings following best international<br />
practice will be required<br />
before decisions on all major<br />
projects.<br />
Reform the Enhancement and Conservation<br />
of the Environment Quality<br />
Act 1992 so that EIAs will help to<br />
implement the principles of Sections<br />
56 and 79 of the Constitution.<br />
Include and highlight the significance<br />
of social impact assessments (SIAs)<br />
and public participation in impact<br />
assessment. Create an independent<br />
body to improve the check-andbalance<br />
of the assessment process.<br />
Move beyond compensation payments<br />
as the way to manage the<br />
impact on communities.<br />
Pass the Community Forestry Bill.<br />
Similar legislation to implement<br />
Section 56 will be needed to cover<br />
other natural resources such as<br />
waterways, land, and coastal sea.<br />
There are many projects such as<br />
dams and power plants which have<br />
been planned and partially or fully<br />
approved in the past when conditions<br />
– legal, environmental, and<br />
social – were very different. Disputes<br />
have arisen over the implementation<br />
of some such projects. Some mechanism<br />
is needed to manage these<br />
disputes. This mechanism should<br />
approach these disputes using a<br />
framework of rights. Acknowledging<br />
the rights of various parties to articulate<br />
and claim their rights sets up the<br />
possibility of open and transparent<br />
negotiation. The National Human<br />
Rights Commission can play a role in<br />
defining appropriate procedures.<br />
BUILDING AN ENABLING<br />
ENVIRONMENT FOR<br />
COMMUNITY EMPOWERMENT<br />
Community empowerment, as chapter<br />
3 argued, is a learning process on a<br />
national scale. It will only advance within<br />
a national environment which is enabling<br />
and conducive. Thailand’s democratic<br />
<strong>THAILAND</strong> <strong>HUMAN</strong> <strong>DEVELOPMENT</strong> <strong>REPORT</strong> <strong>2003</strong>
advances over the past two decades were<br />
a necessary precondition to the progress<br />
made so far. The future potential is<br />
similarly framed by the extent to which<br />
the current momentum of reform can be<br />
maintained.<br />
Over recent years, Thailand has launched<br />
on a wide-ranging process of reform. The<br />
movement for constitutional change in<br />
the early 1990s, the search for solutions to<br />
the 1997 economic crisis, and the “think<br />
new, act new” commitment of the new<br />
government elected in 2001 have begun<br />
a wide range of reforms covering budgeting,<br />
public service, education, health, and<br />
much else. The commitment to reform is<br />
impressive. But there is a problem of<br />
finding the human resources to plan and<br />
implement such an agenda. There are<br />
conflicting views over the priorities of<br />
different projects. And there is a very<br />
real risk of “reform fatigue” among policy<br />
makers and among the population as a<br />
whole.<br />
The extent to which community empowerment<br />
can progress and can contribute<br />
to the goals of human development<br />
depend on other reforms creating an enabling<br />
environment and specific synergies<br />
in many areas. Some of the key areas are<br />
considered below.<br />
Maintaining the momentum<br />
of political reform<br />
The recent elections and change in<br />
government affirm the flexibility of Thailand’s<br />
democratic system. The appearance<br />
for the first time of parties fighting elections<br />
on a platform of popular measures<br />
including commitment to fight poverty<br />
and schemes of social protection are a<br />
positive sign.<br />
Yet communities feel that Thailand’s<br />
parliamentary democracy represents the<br />
interests of the rich much better than<br />
those of the poor. There are many social<br />
and cultural reasons for exclusion, and<br />
these have their own momentum of<br />
change. But there is also one very precise<br />
barrier.<br />
COMMUNITY EMPOWERMENT AT THE CROSSROADS<br />
According to Section 107 (3), a<br />
candidate for election to the House<br />
of Representatives must have “graduated<br />
with not lower than a Bachelor’s<br />
degree or its equivalent”. This<br />
rule excludes around 90 per cent of<br />
the total adult population; over 95<br />
per cent of the people in rural areas,<br />
and over 99 per cent in the agricultural<br />
sector. It should be considered<br />
whether this is an appropriate rule<br />
for a democratic country.<br />
Political reform means more than adjustments<br />
to the parliamentary structure. The<br />
prospects for community empowerment<br />
are also affected by such things as the<br />
access to information and the free operation<br />
of the media. Communities have<br />
often complained about the difficulty of<br />
gaining access to information about<br />
projects which directly affect their lives<br />
and livelihoods (see the cases of Samrong<br />
and Pak Mun in chapter 1).<br />
Section 58 of the Constitution confers the<br />
right of access to information. The Official<br />
Information Act of 1997 provides the<br />
machinery for enforcing this right. But<br />
the Act was passed prior to the Constitution,<br />
and some feel that it fails to reflect<br />
the Constitution’s spirit.<br />
The Official Information Commission<br />
charged with implementation of the<br />
Act is not an independent body, like<br />
others mandated by the Constitution,<br />
but comes under the Prime Minister’s<br />
Office and is vulnerable to executive<br />
control. Government should consider<br />
revising the Act and making this<br />
important body independent.<br />
Both individuals and media have made<br />
enthusiastic use of the Information Act.<br />
Many official agencies have responded<br />
positively. But full realization of the<br />
concept of “freedom of information” requires<br />
changes in the systems and culture<br />
of official bodies. The Official Information<br />
Commission charged with implementation<br />
must work steadily to ensure that the<br />
momentum is maintained.<br />
73
The prospects<br />
for community<br />
empowerment,<br />
however, depend a<br />
great deal on the<br />
responsiveness,<br />
effectiveness, and<br />
accountability of the<br />
lower levels of the<br />
bureaucracy.<br />
74<br />
Ensuring the provision of<br />
public goods is responsive to<br />
people’s needs<br />
The 1997 Constitution introduced many<br />
new systems through which popular<br />
voices can penetrate into the halls of<br />
policy-making. The National Economic<br />
and Social Council is “charged with the<br />
duty to give advice and recommendations<br />
to the Council of Ministers on economic<br />
and social problems” (Section 89). The<br />
National Human Rights Commission has<br />
the duty “to propose to the National<br />
Assembly and the Council of Ministers<br />
policies and recommendations with regard<br />
to the revision of laws, rules or regulations<br />
for the purpose of promoting and<br />
protecting human rights” (Section 200).<br />
Section 170 has provision for the submission<br />
of “People’s Bills” to parliament.<br />
These and other measures increase the<br />
number of ways in which communities<br />
and civil society organizations can influence<br />
the provision of public goods which<br />
cannot be created by the communities<br />
themselves. However, the effectiveness of<br />
these channels still depends on how<br />
responsive governments and government<br />
agencies are to them. The Constitution<br />
has attempted to multiply the channels<br />
through which a popular voice can be<br />
heard, and this concept it not always<br />
easy for those in power to understand<br />
and accept. It would be a pity, for<br />
instance, if the reaction to the submission<br />
of “People’s Bills” were to be a turf<br />
war waged to defend the prerogatives of<br />
parliament and the Council of State.<br />
Over the long term, government<br />
has to develop better capacity for<br />
listening to popular demands for<br />
public goods, and responding appropriately.<br />
Reforming the public sector<br />
for empowerment<br />
After a long period of inconclusive debate<br />
and persistent delay, Thailand has finally<br />
committed to reforms of the public sector.<br />
The government has laid out a major plan<br />
of reorganization. The Civil Service Commission<br />
has proposed many reforms in<br />
practices and procedures. Many offices<br />
have adopted a new service mentality.<br />
This is just a beginning. The initial phase<br />
will mostly affect the overall structure and<br />
especially the upper ranks of the public<br />
services. The prospects for community<br />
empowerment, however, depend a great<br />
deal on the responsiveness, effectiveness,<br />
and accountability of the lower levels of<br />
the bureaucracy.<br />
Maintain the commitment to public<br />
sector reform long enough to complete<br />
the task, and ensure that ideals<br />
of responsiveness, effectiveness, and<br />
accountability guide the reform.<br />
Reforming education for<br />
empowerment<br />
After many years of debate, Thailand in<br />
1999 passed the National Education Act.<br />
This Act increases access to education,<br />
initiates mechanisms to improve quality,<br />
decentralizes management, and changes<br />
the pedagogical approach to childcentred<br />
learning.<br />
This is an ambitious reform which faces<br />
considerable opposition, not least among<br />
some of the teachers and education<br />
officials whose lives and careers will be<br />
directly affected. But the success of this<br />
reform is crucial for the future of Thailand<br />
as a whole, as well as for the progress of<br />
community empowerment.<br />
Maintain the commitment to education<br />
reform, especially reform of the<br />
curriculum and of the pedagogical<br />
style to create an educational system<br />
appropriate for a flourishing and<br />
sophisticated democracy.<br />
Extend support to community education<br />
projects which aspire to bridge<br />
the gap between local wisdom and<br />
learning, and the national education<br />
system.<br />
<strong>THAILAND</strong> <strong>HUMAN</strong> <strong>DEVELOPMENT</strong> <strong>REPORT</strong> <strong>2003</strong>
Putting judicial reform on<br />
the national agenda<br />
The judiciary has not yet figured prominently<br />
in Thailand’s agenda of reform.<br />
This is understandable given the emphasis<br />
to date on political reform, decentralization,<br />
education, health, and the reorientation<br />
of development policy. However,<br />
there are good reasons to bring judicial<br />
reform more firmly onto the agenda.<br />
In Thailand there is a very strong<br />
impression that the police and the courts<br />
tend to reinforce the existing power<br />
structure, and offer little opportunity to<br />
challenge its injustices. In the histories<br />
recounted in chapter 1, judicial process<br />
never worked in favour of the communities’<br />
efforts to empower themselves,<br />
and sometimes worked against them.<br />
Innovative legislation such as the 1992<br />
Enhancement and Conservation of the<br />
Environment Quality Act has failed to<br />
live up to expectations because of the<br />
judiciary’s failure to uphold the spirit of<br />
the legislation.<br />
The new Constitution, with its emphasis<br />
on rights, increases the importance of the<br />
judicial system as a means to make such<br />
rights effective. For Thailand’s communities,<br />
there are special concerns over the<br />
courts’ attitude towards customary rights<br />
which are not codified in statute.<br />
Judicial reform is a mammoth<br />
subject. It will be vital to the success<br />
of community empowerment in the<br />
long run that the subject is tackled<br />
before too long.<br />
Refocusing on poverty<br />
alleviation through<br />
empowerment<br />
Until the economic crisis of 1997, Thailand<br />
had an impressive record in reducing the<br />
proportion of the population below the<br />
poverty line. The crisis reversed this trend<br />
and increased the number of poor by<br />
three million people. This reversal forced<br />
a rethink about poverty alleviation<br />
policies both within international agencies<br />
COMMUNITY EMPOWERMENT AT THE CROSSROADS<br />
and within Thailand. The World Bank<br />
identified empowerment as a major<br />
strategy for poverty alleviation. Research<br />
in Thailand showed that the increase in<br />
poverty during the crisis was almost<br />
wholly in the rural areas. It also revealed<br />
the existence of “persistent poverty”<br />
among certain groups even at times of<br />
high economic growth. These findings<br />
emphasised the need for new methods<br />
to identify the poor, and for new strategies<br />
– including empowerment – to tackle<br />
persistent poverty.<br />
The NESDB has reinstated poverty alleviation<br />
as a major focus of its efforts<br />
under the Ninth Plan, and has placed an<br />
emphasis on developing poverty alleviation<br />
strategies based on community<br />
empowerment experiences. 40<br />
Plans to tackle poverty must absorb<br />
the considerable learnings from<br />
projects of community empowerment<br />
over recent years. They must address<br />
not only income poverty but the<br />
broader definition of poverty which is<br />
held by the communities themselves<br />
and which broadly coincides with the<br />
Human Development approach.<br />
Poverty policies should endeavour to<br />
build on the investments in social<br />
capital and community strength<br />
made during the crisis. They must<br />
recognize the importance of improving<br />
access to land and other<br />
natural resources as a key strategy of<br />
poverty alleviation.<br />
Tackling gender bias<br />
Gender bias is one of the most basic<br />
forms of disempowerment. In Thailand<br />
over recent years, trends in gender bias<br />
have been mixed. On the one hand,<br />
women improved their access to education<br />
at all levels. On the other hand, the<br />
change and instability of the economy<br />
increased pressures on women in their<br />
40 Office of the National Economic and Social<br />
Development Board, “Yuthasat Kae Kai Panha<br />
Kham Yak Jon” (Poverty Alleviation Strategies),<br />
June 2002.<br />
For Thailand’s<br />
communities, there<br />
are special concerns<br />
over the courts’<br />
attitude towards<br />
customary rights<br />
which are not<br />
codified in statute.<br />
75
76<br />
dual roles as provider and nurturer.<br />
Moreover, the systematic disempowerment<br />
of women in the formal political<br />
system – as shown by the gender ratios<br />
in parliament, senior bureaucracy, and the<br />
TAOs – has scarcely changed. The 1997<br />
Constitution has boldly stated that “Men<br />
and women shall enjoy equal rights”, but<br />
gender bias is still built into many laws<br />
and institutions.<br />
Community empowerment can contribute<br />
to gender equity by improving<br />
women’s access to credit,<br />
income-earning opportunities, and<br />
social protection within the bounds<br />
of the local community. But this will<br />
depend on women gaining a voice in<br />
community management, both within<br />
the official structure of the TAOs, and<br />
in more informal gatherings.<br />
Above the locality, there are still<br />
important gender issues in the areas<br />
of family law, safety in the workplace,<br />
and access to technical and vocational<br />
training.<br />
Decentralization and Gender<br />
Women in Thailand have considerable power – in the family, in businesses,<br />
in the local community. Yet in anything connected with political power,<br />
they suffer from discrimination and exclusion. They are not only underrepresented<br />
in parliament (45 out of 500 MPs) and the higher bureaucracy,<br />
they are even rare among the ranks of the top political commentators.<br />
However, in NGOs, protest groups, and civil society organizations in general,<br />
women play a prominent role.<br />
Daniel Arghiros, who made a detailed study of Thailand’s electoral system,<br />
observed that the contractors and local officials who were the chief agents<br />
and beneficiaries of electoral manipulation were exclusively male. He<br />
argued that one way to lessen the capture of TAOs by old power centres<br />
might be to reserve a large number of seats for women. 41 Women’s groups<br />
lobbied for reservation but failed.<br />
In India, panchayat local government bodies were reformed in 1992-3,<br />
reserving one-third of seats for women and giving proportional representation<br />
to marginalized groups. In two of the poorest states literacy rates<br />
increased 20 per cent over the next decade. 42<br />
41 Daniel Arghiros, Democracy, Development and<br />
Decentralization in Provincial Thailand, Richmond:<br />
Curzon, 2001, p. 250.<br />
42 UNDP, Human Development Report 2002, p.<br />
74-5.<br />
Managing the environment<br />
As stressed many times through this report,<br />
the deterioration of the environment<br />
is a major force in the disempowerment<br />
of local communities. The shortcomings<br />
of the 1992 Enhancement and Conservation<br />
of the Environment Quality Act are<br />
now well understood, and reform of this<br />
important legislation is now overdue. But<br />
much more than legislation is needed to<br />
tackle Thailand’s environmental problems.<br />
The relationship between poverty, empowerment,<br />
and the environment is complex<br />
and subtle. In some cases poor people<br />
become the agents of environmental<br />
destruction because they have nothing to<br />
exploit but themselves and nature. But in<br />
other cases, poor people are the most<br />
sensitive monitors of environmental decline,<br />
and the most committed proponents<br />
of environmental defence. As<br />
shown in chapter 1, the fishing communities<br />
were the fiercest defenders of the<br />
Mun river against the destruction needed<br />
for a dam project of questionable utility.<br />
Similarly, all along Thailand’s coasts,<br />
small-scale fishermen have protested<br />
against the destruction of the marine environment<br />
by commercial fishing interests<br />
which blatantly defy the law. In these<br />
and similar cases, the poor protest because<br />
they are the most vulnerable to<br />
environmental decline.<br />
The challenge for policy makers is<br />
to embrace popular movements<br />
which defend natural resources so<br />
that poverty alleviation and environmental<br />
defence work in synergy.<br />
The Ninth Plan rightly identifies that<br />
Thailand’s environmental problems<br />
must be tackled under the heading<br />
of good governance. It stresses that<br />
“existing mechanisms for natural<br />
resources and the environmental<br />
management should be adjusted to<br />
emphasize local participation”. Community<br />
empowerment should be<br />
both a means and end of good<br />
environmental governance.<br />
Government agencies must be more<br />
vigilant in enforcing existing laws such<br />
as pollution controls on industries.<br />
<strong>THAILAND</strong> <strong>HUMAN</strong> <strong>DEVELOPMENT</strong> <strong>REPORT</strong> <strong>2003</strong>
Managing globalization<br />
for empowerment<br />
Globalization presents both challenges<br />
and opportunities. The opportunities will<br />
only accrue to countries who actively<br />
manage the processes of globalization.<br />
These benefits include more jobs and<br />
more trade. In the past, Thailand – and<br />
other East Asian countries – benefited<br />
greatly by engaging more with the global<br />
economy.<br />
The 1997 economic crisis revealed many<br />
downside vulnerabilities. In responding to<br />
the 1997 economic crisis, the Thai government<br />
has taken a much more active role<br />
in managing the country’s engagement<br />
with globalization, as a passive role courts<br />
the risk of disempowerment at many<br />
levels.<br />
But managing the country’s engagement<br />
also means grasping the opportunities.<br />
The Doha trade negotiations showed a<br />
much greater concern for the needs of<br />
developing countries than previous trade<br />
rounds. Future talks will scrutinize economic<br />
policies in developed countries<br />
that adversely affect the developing<br />
world. Forces pushing for this need<br />
support. In particular, the whole topic of<br />
agrarian trade and government subsidy is<br />
now open for debate on a world scale.<br />
The importance for Thailand and especially<br />
for Thailand’s poor cannot be underestimated.<br />
Thailand has more people<br />
dependent on agriculture, and lower<br />
levels of agrarian subsidy, than most<br />
countries. Changes in crop prices are one<br />
of the most sensitive forces affecting the<br />
numbers in poverty.<br />
Many of the issues which fall heaviest on<br />
the poor – climate change, pollution,<br />
crime, human trafficking, corruption – are<br />
transnational or global issues. The issues,<br />
priorities, and solutions are increasingly<br />
being defined at the global level. Being<br />
left out will mean being disempowered.<br />
One reason people feel uneasy about<br />
globalization is because they feel powerless<br />
before it. Partly that is because<br />
COMMUNITY EMPOWERMENT AT THE CROSSROADS<br />
governments often engage with international<br />
institutions without involving the<br />
wider society in the debate and the decisions.<br />
They sign international treaties and<br />
conventions without public consultation.<br />
In the last decade, NGOs have become<br />
more vigilant on these matters. But<br />
government needs to take the initiative to<br />
bring these matters to public debate, so<br />
that civil society can review trade-offs and<br />
help shape global public policy. After all<br />
communities in Thailand are part of a<br />
much larger global community. They<br />
have much to offer as well as much to<br />
gain.<br />
An aggressive approach to the<br />
forthcoming negotiations on agrarian<br />
trade and subsidies is one way to<br />
empower the poor.<br />
Thailand must be an active participant<br />
in supporting and shaping the<br />
global efforts to grapple with issues<br />
such as climate change, pollution,<br />
crime and human trafficking.<br />
Government should make greater<br />
efforts to encourage public debate<br />
on issues arising between government<br />
and international institutions.<br />
CONCLUDING REMARKS:<br />
LOOKING AHEAD<br />
Varieties of empowerment<br />
There are many, many different views<br />
on community empowerment – what it<br />
means, how it is done, what it achieves.<br />
This should not be cause for surprise or<br />
disappointment. To begin with, communities<br />
themselves are very different, one<br />
from another. Next, empowerment is a<br />
rather ambiguous term with connotations<br />
of internal strength as well as external<br />
authority. Finally, there are many different<br />
views on the economic, social, and political<br />
ideals that community empowerment<br />
might help achieve. In particular, there is<br />
a fundamental division among community<br />
activists between those who believe that<br />
communities must learn how to become<br />
One reason people<br />
feel uneasy about<br />
globalization is<br />
because they feel<br />
powerless before it.<br />
Partly that is because<br />
governments often<br />
engage with<br />
international<br />
institutions without<br />
involving the wider<br />
society in the debate<br />
and the decisions.<br />
77
The insight<br />
that community<br />
empowerment is a<br />
matter of rights helps<br />
us to understand<br />
that the other main<br />
contribution of other<br />
actors is to help<br />
build systems and<br />
institutions through<br />
which claims to rights<br />
can be negotiated<br />
in a fair and<br />
transparent way.<br />
78<br />
more commercial in order to survive in<br />
the globalizing world, and those who<br />
feel that it is precisely the communities’<br />
agrarian economy and distinctive morality<br />
which are valuable and need to be<br />
preserved.<br />
The first step towards empowerment<br />
is recognizing this variety of real-world<br />
situations and opinion, and acknowledging<br />
the right of communities to determine<br />
their own very varied futures.<br />
Community and globalization<br />
Both at an international level and within<br />
Thailand itself, the importance of the<br />
community has risen in reaction to the<br />
growing force of globalization. While<br />
there are many different views among<br />
community members and community advocates<br />
on the relationship between community<br />
and globalization, there are few if<br />
any who believe that the community<br />
could or should be isolated totally from<br />
the forces of globalization. Rather, there<br />
is a general consensus that communities<br />
need to erect some barriers against outside<br />
forces in order to strengthen their<br />
internal resources and hence be better<br />
equipped to deal with the outside world.<br />
There is then varied debate over the<br />
nature and height of the barriers, the<br />
priorities for internal strengthening,<br />
and the strategies for re-engaging with<br />
the outside world. But the basic idea –<br />
barriers to permit self-strengthening –<br />
commands sufficient consensus that it<br />
was adopted as a national agenda in<br />
response to the 1997 economic crisis.<br />
Empowerment as learning<br />
process<br />
This Report has tried to reflect the many<br />
different voices and the many different<br />
experiments in community empowerment.<br />
The important insight of the communities<br />
which contributed to this project is<br />
that community empowerment is a<br />
learning process which has successive<br />
steps: learning how to realize their potential<br />
as a community; learning how to<br />
negotiate cooperation with government<br />
and other outside agencies; learning how<br />
to claim rights within the society.<br />
This chapter has argued that this<br />
three-level learning process provides a<br />
framework for understanding community<br />
empowerment. It has identified three<br />
priorities for promoting community empowerment<br />
corresponding to these three<br />
levels:<br />
networking the learnings from the<br />
many experiments and experiences<br />
of community projects of recent<br />
years,<br />
making decentralization work for<br />
the communities by maintaining the<br />
momentum of change, fostering<br />
participation, and improving management,<br />
strengthening procedures and institutions<br />
for negotiating claims to rights,<br />
particularly rights over natural resources,<br />
by changes in the 1992<br />
environment act and other legislation<br />
to implement the spirit of the 1997<br />
Constitution.<br />
The insight that community empowerment<br />
is a learning process indicates that<br />
the main contribution of other actors in<br />
community empowerment is to assist<br />
that process – by providing information,<br />
by accelerating the exchange of information<br />
among communities, by breaking<br />
down barriers to learning, and by supporting<br />
legitimate claims for rights.<br />
Donor agencies which believe in<br />
community empowerment must look<br />
more to the communities, rather than<br />
official agencies, as sources of information<br />
and targets for funding.<br />
The insight that community empowerment<br />
is a matter of rights helps us to<br />
understand that the other main contribution<br />
of other actors is to help build<br />
systems and institutions through which<br />
claims to rights can be negotiated in a<br />
fair and transparent way.<br />
<strong>THAILAND</strong> <strong>HUMAN</strong> <strong>DEVELOPMENT</strong> <strong>REPORT</strong> <strong>2003</strong>
Community empowerment<br />
in social context<br />
Community empowerment takes place<br />
within a larger social context. This chapter<br />
has identified several areas of reform<br />
and policy-making which are important<br />
for community empowerment and human<br />
development:<br />
maintaining the momentum of<br />
political reform including the full<br />
implementation of the freedom of<br />
information,<br />
ensuring the provision of public<br />
goods is responsive to people’s<br />
needs, in particular through utilizing<br />
new channels such as the National<br />
Economic and Social Council, the<br />
National Human Rights Commission,<br />
and the submission of “People’s Bills”,<br />
reforming the public sector right<br />
down to the lower levels whose<br />
responsiveness is critical for the success<br />
of community empowerment,<br />
sustaining the intention of the<br />
National Education Act 1999 to overhaul<br />
the education system, with<br />
particular attention to curriculum<br />
change and pedagogical style,<br />
bringing judicial reform more firmly<br />
onto the national agenda so the<br />
judicial system may become more<br />
effective for enforcing rights, particularly<br />
those of the poor,<br />
refocusing economic policy on<br />
alleviating poverty in all its forms,<br />
and building on the learnings from<br />
community empowerment projects<br />
to devise specific plans,<br />
tackling gender bias, particularly<br />
within the local power structures<br />
which are rising in importance,<br />
managing the environment so that<br />
poverty alleviation and environmental<br />
improvement work in synergy,<br />
managing globalization for empowerment,<br />
particularly through an aggressive<br />
approach to WTO negotiations<br />
on agrarian trade.<br />
Opportunity and risk<br />
Thailand is now emerging both from the<br />
economic crisis and from a period of extraordinary<br />
soul-searching and debate.<br />
There is a very wide acceptance of the<br />
view that community empowerment is a<br />
strategy to achieve human development<br />
which reflects people’s real needs, which<br />
is sustainable, and which achieves national<br />
objectives of social justice, peace,<br />
and unity. The problems facing community<br />
empowerment are considerable –<br />
problems of understanding, opposition,<br />
and inertia. But the potential gains are<br />
large, and the risks are small.<br />
Communities have no wish to reject modernity, oppose globalization, and cling to the past.<br />
But they want the power to determine the direction of development based on their own<br />
body of knowledge, their own values, the principle of sustainable balance between man<br />
and nature, and the community’s rights to manage resources.<br />
COMMUNITY EMPOWERMENT AT THE CROSSROADS<br />
– From the conclusion agreed among the community contributors to chapter 1<br />
79
80<br />
<strong>THAILAND</strong> <strong>HUMAN</strong> <strong>DEVELOPMENT</strong> <strong>REPORT</strong> <strong>2003</strong>
PART II<br />
MEASURING <strong>HUMAN</strong> <strong>DEVELOPMENT</strong><br />
81
82<br />
<strong>THAILAND</strong> <strong>HUMAN</strong> <strong>DEVELOPMENT</strong> <strong>REPORT</strong> <strong>2003</strong>
INTRODUCTION TO <strong>HUMAN</strong><br />
ACHIEVEMENT INDEX (HAI)<br />
Human development indices have played<br />
a vital role in establishing UNDP’s contribution<br />
to the debate and advancement<br />
of human development worldwide. Experiences<br />
confirm that indices that capture<br />
progress and disparity in human development<br />
among countries, regions, and<br />
groups, serve as an excellent stimulant<br />
and provide a good forum for policy<br />
advocacy and public participation at both<br />
the global and national levels.<br />
This Report, although focusing on community<br />
empowerment, does not attempt<br />
to develop community empowerment<br />
indices. Several government agencies and<br />
research institutes are producing good<br />
results on that front. In any case, nationwide<br />
community-level data collection and<br />
data analysis is an enormous task which<br />
is beyond the scope of this Report. This<br />
chapter will therefore present some<br />
examples of such effort and devote the<br />
latter part of the chapter to continuing<br />
the work on the “Index of Human<br />
Deprivation – IHD”, a composite index<br />
introduced by the First Thailand Human<br />
Development Report.<br />
With provincial ranking and maps, the IHD<br />
clearly depicts the progress and disparity<br />
in human development situations of all<br />
76 provinces. IHD received enthusiastic<br />
support from the government, development<br />
institutions, and the academia. It<br />
was the first time that a composite index<br />
was developed to assess an overall<br />
human development situation and the<br />
first time that provincial-level data concerning<br />
human development was used in<br />
an integrated and comprehensive manner.<br />
IHD has important policy implications and<br />
<strong>HUMAN</strong> <strong>DEVELOPMENT</strong> INDICES<br />
CHAPTER<br />
<strong>HUMAN</strong> <strong>DEVELOPMENT</strong> INDICES<br />
a potential to become a useful policy<br />
analysis instrument. Further improvement<br />
and refinement of IHD becomes an<br />
important task of the Second Thailand<br />
Human Development Report.<br />
From the Index of Human Deprivation (IHD)<br />
to the Human Achievement Index (HAI)<br />
5<br />
The IHD has 8 components – health, education, employment, income, housing<br />
and environment, transport and communication, consumer’s goods, plus<br />
a women index. Within 8 components, there are 48 indicators. For each<br />
indicator, provinces are divided into three groups – those that perform<br />
above the median are assigned a penalty score of 0, those in the worst<br />
quartile a penalty score of 1, and those in between a penalty score of 0.5.<br />
Each indicator weighs equally within the component, and each component<br />
weighs equally within the composite index. The result is the IHD that<br />
highlights overall and specific deprivation at the provincial level.<br />
The IHD shows that people in the lower Chao Phraya Basin are the most<br />
well-off, and those living in the border areas are most deprived. Living in<br />
Bangkok Metropolis does not guarantee a good life as Bangkok fails to<br />
achieve a top ten ranking. Singburi, a small province situated in the middle<br />
of the country’s rice bowl, is recorded as having the best human development<br />
condition.<br />
On technical aspects, it should be noted that the IHD methodology treats<br />
all the scores above the median equally and focuses on the lowest<br />
and second quartiles because IHD is meant to highlight deprivation, not<br />
excellence. With this focus, IHD cannot capture differences among the<br />
above-the-median provinces. It penalizes poor performance but does not<br />
recognize or award excellence. Provinces that perform well on IHD are<br />
those that manage to stay above average on all indicators, but may not be<br />
exceptional on any one.<br />
When the NESDB-UNDP task force commenced a review of the IHD with<br />
participation from various agencies, no leaf was left unturned. While the<br />
new index retains some of the key characteristics of the IHD, it features<br />
several major changes including its name.<br />
Some indicators are omitted, namely indicators that are relevant to only<br />
a few provinces, those that are considered irrelevant to the socio-economic<br />
situation of the country, those that do not express disparity among<br />
provinces and those without updated data. New additions are indicators<br />
that reflect the new social development.<br />
In addition, HAI features different components, and a new methodology<br />
that should be more useful for policy decisions.<br />
83
84<br />
The result is a new composite index –<br />
the “Human Achievement Index – HAI” .<br />
HAI aims to reflect the rate of change in<br />
human development in 76 provinces<br />
rather than zeroing in on basic deprivation.<br />
Hence, this index is in line with the<br />
state of human development in Thailand<br />
today, as the country has become a middle<br />
income, medium human development<br />
country. This, however, does not mean<br />
that deprivation no longer exists, or that it<br />
is no longer a legitimate concern. HAI<br />
can reflect stagnation or slow progress in<br />
deprived areas, but it allows room for<br />
more advancing provinces to show their<br />
stride.<br />
HAI CHARACTERISTICS<br />
In general, HAI has the following characteristics.<br />
Multidimensionality. The index captures<br />
the multidimensional character of human<br />
development and seeks to express in<br />
systematic ways as many of these dimensions<br />
as possible.<br />
Policy relevance. The index suggests policy<br />
implications and can serve to support<br />
informed decision-making on strategies<br />
and programmes aimed at addressing<br />
inequalities.<br />
Spatial disaggregation. The index seeks to<br />
map uneven progress; it disaggregates<br />
the nation’s regions, which are too broad<br />
in character and too few in numbers to<br />
serve as the focus for policy purpose,<br />
to the provincial level which can be a<br />
strategic point of convergence between<br />
nationally-driven policies, and local initiatives.<br />
Temporal comparison. By measuring progress<br />
against an established “goal post” ,<br />
the index can assess whether human<br />
development situation in a selected<br />
province improves or regresses over time.<br />
Transparency and replicability. The<br />
methodology used for the construction of<br />
the index is simple and replicable, thus<br />
facilitating others to undertake comparable<br />
exercises.<br />
HAI CONCEPT AND<br />
STRUCTURE<br />
HAI is composed of 8 essential phases/<br />
components in a human lifecycle – starting<br />
with the first essential thing that<br />
everyone must have on the first day of<br />
his/her life – health, followed by the next<br />
important step for every child – education.<br />
After schooling, one is expected to get a<br />
job, to secure enough income, to have a<br />
decent housing and living conditions. Then<br />
a person moves beyond him/herself to<br />
have a quality family and community life,<br />
to maintain contacts and communication<br />
with others, and last but not least, to<br />
participate as member of a society. To<br />
sum up, the 8 components are:<br />
Health<br />
Education<br />
Employment<br />
Income<br />
Housing and living conditions<br />
Family and community life<br />
Transportation and communication<br />
Participation.<br />
Under these components are 40 indicators<br />
as shown in Table 1.<br />
HAI METHODOLOGY<br />
The HDI methodology, used in the UNDP<br />
global Human Development Reports, is<br />
used to calculate HAI. For each indicator,<br />
the following calculation is used for each<br />
of the provinces:<br />
Actual value – Minimum value<br />
Maximum value – Minimum value<br />
The minimum and maximum values are<br />
set for each indicator to serve as “goal<br />
post” which covers a range that can<br />
accommodate all possible values for that<br />
indicator in the next ten years. The goal<br />
post set for each indicator is shown in<br />
Table 1.<br />
<strong>THAILAND</strong> <strong>HUMAN</strong> <strong>DEVELOPMENT</strong> <strong>REPORT</strong> <strong>2003</strong>
<strong>HUMAN</strong> <strong>DEVELOPMENT</strong> INDICES<br />
Table 1. Structure of the Human Achievement Index – HAI<br />
HAI Indices Components Indicators Minimum Maximum<br />
1. Health Index 1. Length of life 1. Life expectancy at birth (years) 50 95<br />
2. Quality of life 2. Incidence of first degree mulnutrition in<br />
children under five (%) 0 20<br />
3. Incidence of AIDS (per 100,000) 0 65<br />
4. Incidence of mental illness (per 1,000) 0 100<br />
3. Health promotion 5. Population with unhealthy behavior (%) 15 55<br />
4. Health infrastructure 6. Population per physician (persons) 600 20,000<br />
2. Education Index 5. Stock of education 7. Mean years of schooling for people age 15 years<br />
and over (years) 3 12<br />
6. Flow of education 8. Lower secondary school gross enrolment (%) 30 100<br />
9. Upper secondary school gross enrolment (%) 20 95<br />
7. Quality of education 10. Average marks of lower secondary students (%) 30 65<br />
11. Average marks of upper secondary students (%) 20 55<br />
8. Educational 12. Upper secondary students per teacher (students) 10 37<br />
infrastructure 13. Upper secondary students per classroom (students) 20 60<br />
3. Employment 9. Unemployment and 14. Unemployment (%) 0 8<br />
Index underemployment 15. Underemployment (%) 0 30<br />
10. Labour protection 16. Employees covered by social security (%) 1 100<br />
4. Income Index 11. Income level 17. Household monthly income (Baht) 4,000 30,000<br />
12. Income change 18. Change in household monthly income<br />
(1998-2000) (%) –50 40<br />
13. Poverty level 19. Incidence of poverty (%) 0 60<br />
14. Household debt 20. Households with debt (%) 20 90<br />
5. Housing and 15. Housing quality 21. Households with permanent building 70 100<br />
living conditions materials (%)<br />
index 22. Urban households in slum (%) 0 100<br />
16. Living quality 23. Households with access to refrigerator (%) 30 100<br />
24. Households cooking with fuel gas or electric stove (%) 10 100<br />
6. Family and 17. Family life 25. Female-headed households (%) 10 50<br />
community life 26. Elderly-headed households (%) 5 50<br />
index 27. Working children aged 15-17 (%) 0 60<br />
28. Incidence of divorces (per 1,000 marriages) 50 600<br />
29. Disable persons (%) 0 6<br />
18. Safe community 30. Violent crimes reported (per 100,000) 0 40<br />
31. Drug-related arrests (per 100,000) 60 1,250<br />
7. Transportation 19. Transport 32. Villages with convenient access to nearest<br />
and commu- infrastructure district during rainy season (%) 30 100<br />
nication Index 33. Personal vehicle registration (per 1,000) 80 950<br />
20. Communication 34. Households with access to TV (%) 40 100<br />
infrastructure 35. Population per telephone (persons) 1 65<br />
36. Population with access to internet (%) 1 20<br />
8. Participation 21. Political 37. Vote turnout (%) 30 100<br />
Index participation<br />
22. Civil society 38. Community groups (per 100,000) 4 450<br />
participation 39. Households participate in local groups (%) 35 100<br />
40. Households participate in social services (%) 70 100<br />
85
86<br />
Another Endeavor to Measure Human Development:<br />
Community-level Well-being Indicators<br />
A Thailand Research Fund project aims<br />
to develop community-level well-being<br />
indicators. The research team led<br />
by Amara Pongsapit of Chulalongkorn<br />
University’s Social Research Institute,<br />
identifies and works with 8 categories of<br />
community, namely riverine communities<br />
in Nan, mixed agricultural-industrial<br />
communities in Chiang Mai, coastal<br />
communities in Songkhla, industrial<br />
communities in Rayong, border and<br />
tourist communities in Chiang Rai, slum<br />
communities in Bangkok, Chao Phraya<br />
Basin communities in Ayutthaya and<br />
mixed farming communities in Buri Ram.<br />
Example of environment indicators from<br />
Chiang Mai communities<br />
Development goal Indicators<br />
The team applies participatory action<br />
research to identify 4 development<br />
goals, namely self-reliance, strong<br />
people’s organizations, participation,<br />
and equity, and 9 clusters of indicators<br />
that the people feel are most relevant<br />
and genuinely reflect the state of their<br />
well-being: personal/household economic<br />
situation, education, health, information,<br />
environment, basic infrastructure<br />
and natural resources, family<br />
life, culture and morality, community<br />
life and community strength, social<br />
security and safety net.<br />
Self reliance Households engaged in alternative agriculture.<br />
People’s organizations Community has forest management system.<br />
Community has soil, water and forest preservation system.<br />
Community has drug-free project.<br />
Participation Households with proper garbage disposal arrangement.<br />
Community does not have illegal drug trade.<br />
Equity Households with adequate water supply all year round.<br />
This represents an attempt to develop<br />
a community-based self-management<br />
tool for information collection, situational<br />
analysis, community planning,<br />
monitoring and evaluation. The team<br />
also attempts to identify common<br />
indicators from 8 communities that<br />
would be useful for planning at the<br />
national-level. Although data for these<br />
indicators are not presently available,<br />
the research provides a useful<br />
guidance for the development of<br />
national and community data collection<br />
and analysis.<br />
<strong>THAILAND</strong> <strong>HUMAN</strong> <strong>DEVELOPMENT</strong> <strong>REPORT</strong> <strong>2003</strong>
An Ambitious Attempt to Measure Another Aspect<br />
of Human Development: Happiness Indicators<br />
Another TRF research study led by<br />
Apisit Thamrongwarangkool, a medical<br />
doctor and community development<br />
activist at the Khon Kaen Hospital,<br />
focuses on the subjective aspect of<br />
human development. The team uses<br />
the focus group technique to work<br />
with 10 nationally revered community<br />
wisemen and 190 villagers in 4 Northeastern<br />
provinces (Buri Ram, Nakhon<br />
Ratchasima, Khon Kaen and Surin) to<br />
develop “happiness indicators”.<br />
Happiness component Happiness indicators<br />
Life security Sufficient land<br />
Permanent house<br />
Sufficient food<br />
Physical and mental health Healthy body<br />
Healthy mind<br />
Good family Living with all family members and having a job<br />
Love and understanding without quarrels and jealousy<br />
Strong community Group learning<br />
Informal leader and leadership development<br />
Group activities<br />
Good living environment Fertile soil, plenty of water and animals<br />
Toxic/chemical-free environment<br />
Road, pipe water, electricity<br />
Freedom Ability to do anything that does not incur negative<br />
impacts on others<br />
Debt-free<br />
Self-pride Successful family<br />
Successful career<br />
Access to dharma Peaceful life<br />
Self-content<br />
Merit-making or helping others<br />
<strong>HUMAN</strong> <strong>DEVELOPMENT</strong> INDICES<br />
The team identifies 8 important factors<br />
as shown below, and proposes that<br />
the learning process changes people’s<br />
conception of happiness, and therefore<br />
can be used as an important tool in<br />
rural development. The research team<br />
acknowledges that, due to the limitation<br />
of the areas and participants<br />
selected for this study, the findings are<br />
probably most suitable in the Northeastern<br />
farming context.<br />
87
88<br />
For some indicators, i.e. unemployment,<br />
divorce incidence, the data reflects a<br />
“negation in human development”. Hence,<br />
HAI uses the inverse value (1-calculated<br />
value) to show the degree of progress.<br />
For example, the 3.4% unemployment rate<br />
in Bangkok Metropolis is calculated to be<br />
a 0.3256 index score for unemployment,<br />
which is expressed as 1 – 0.3256 = 0.6744<br />
index score for employment.<br />
HAI does not divide the provinces into<br />
predetermined groups. It allows 76 provinces<br />
to fall into varying positions, hence<br />
there can be as many as 76 positions on<br />
each indicator. The variation at the high<br />
and low ends are captured and treated in<br />
the same manner. As a consequence, a<br />
very good performance on one indicator<br />
can offset a very poor performance on<br />
another.<br />
Weighting is not applied at any level of<br />
the calculation. Hence, the health index<br />
is an expression of an average of all 6<br />
indicators within the health index. Likewise,<br />
all 8 indices carry equal weight in<br />
calculating the composite HAI.<br />
In many ways, the real value and validity<br />
of the HAI comes from the use of the 8<br />
individual components. There is more<br />
analytic and diagnostic value in looking<br />
at variations in the health component or<br />
the education component alone than in<br />
averaging each with all the others. Policy<br />
priorities and choices are clear for each<br />
component, but not for the combined<br />
index. And averaging of averages across<br />
such diverse measures means that the<br />
overall ranking of the provinces must be<br />
understood as indicative of levels of<br />
overall development, not definitive.<br />
DATA SOURCES<br />
Data is the most formidable challenge.<br />
Data used to calculate HAI must have<br />
national coverage with provincial disaggregation.<br />
Several indicators are abandoned<br />
because provincial data is not<br />
available, not reliable, or is systematically<br />
biased.<br />
HAI uses secondary data that do not<br />
entail labourious data processing. This is<br />
to ensure both the economy and the<br />
sustainability of the index.<br />
HAI data is from a) national sample<br />
surveys, e.g., socioeconomic survey, labour<br />
force survey, health and welfare survey;<br />
b) registration systems, e.g., divorce incidence,<br />
personal vehicle registration;<br />
and c) administrative records, e.g., school<br />
enrolment, persons per physician, malnutrition<br />
in children under five, etc.<br />
Data collection for these surveys is conducted<br />
in varying years. Some surveys<br />
are conducted every two or five years.<br />
Most registration systems and administration<br />
records are updated every year. A<br />
small portion of data used in this study is<br />
from five-year surveys, and this is data<br />
that does not change rapidly.<br />
Not all data collected are available in<br />
readily accessible format. Some are downloaded<br />
from web sites, some are kept<br />
as internal databases, some have to be<br />
calculated from various databases, some<br />
are in ASCII files. These databases are<br />
made available by responsible agencies,<br />
or through the National Statistical Office<br />
or the Office of the National Economic<br />
and Social Development Board. The data<br />
tables in the annex are processed and<br />
calculated from these databases.<br />
GENDER DISAGGREGATED<br />
DATA<br />
The “Women index” is one of IHD’s eight<br />
indices. It compares human development<br />
situations of women across provinces and<br />
is therefore not a “gender index”. HAI<br />
does not have a similar component. This<br />
is a trade-off to avoid the problem of<br />
double-counting.<br />
Although HAI was originally planned<br />
to be a gender-disaggregated index, data<br />
was an insurmountable problem. Some<br />
of the HAI indicators use household-level<br />
data that does not allow for gender<br />
disaggregation. Nonetheless, efforts are<br />
made to obtain gender-disaggregated<br />
data when relevant and possible. This<br />
data is presented in the data tables.<br />
<strong>THAILAND</strong> <strong>HUMAN</strong> <strong>DEVELOPMENT</strong> <strong>REPORT</strong> <strong>2003</strong>
HAI’S EIGHT INDICES<br />
1. Health Index<br />
Health is the first and foremost constituent<br />
of people’s well-being. The health<br />
index is composed of:<br />
length and quality of life (life expectancy<br />
and first-degree malnutrition in<br />
children under five),<br />
physical and mental illness (AIDS<br />
incidence, mental illness),<br />
health promotion (unhealthy behaviour,<br />
namely smoking and/or alcohol<br />
consumption),<br />
access to health service (persons per<br />
physician).<br />
By and large, the health index is composed<br />
of indicators that are commonly<br />
used to indicate a general health situation.<br />
It also reflects a shift towards a new<br />
health care approach – health promotion.<br />
However, relevant data is not available,<br />
with the exception of smoking and alcohol<br />
consumption.<br />
The health index ranges from 0.506 to<br />
0.815. The following map shows the distribution<br />
of all provinces in five groups<br />
according to their health index scores,<br />
with green representing best performance<br />
and red representing worst performance.<br />
Map 1 shows that health conditions vary<br />
across the country. Chachoengsao has<br />
the highest achievement in the overall<br />
health index, followed by Bangkok<br />
Metropolis and other provinces in the<br />
Bangkok vicinity, e.g., Samut Sakon, Samut<br />
Prakan, Samut Songkram, Nonthaburi.<br />
Other high performers are Songkhla, Chon<br />
Buri and Uttaradit. In general, health<br />
situations in the Central Plain, the West,<br />
and the East are better than the rest of<br />
the country.<br />
Northeastern provinces are the worst<br />
performers with less access to health<br />
services and a relatively high incidence of<br />
first-degree malnutrition among children.<br />
<strong>HUMAN</strong> <strong>DEVELOPMENT</strong> INDICES<br />
NRDC-2C and Basic Minimum Needs (BMN) Indicators<br />
National Rural Development Committee – 2C is a set of rural development<br />
indicators that use village census. It was developed in 1984, went through<br />
a series of piloting and testing, and was undertaken biannually since 1990.<br />
About 40 indicators cover the aspects of (1) infrastructure, (2) production,<br />
income and employment, (3) public health, (4) consumption and agricultural<br />
water, (5) education and culture, (6) natural resources and environment.<br />
The continuity of the available census data makes the NRDC-2C database a<br />
unique instrument for measuring changes and trends in Thailand’s rural<br />
socio-economic infrastructure. NESDB and the Community Development<br />
Department have used these indicators to classify and target villages<br />
that have relatively poorer development in order to initiate special rural<br />
development projects. NRDC-2C data covers only rural areas and the<br />
indicators are designed to reflect the welfare and needs of Thailand’s rural<br />
communities.<br />
Since 1985, under the umbrella of the National Rural Development<br />
Committee, the household-level Basic Minimum Needs (BMN) indicators<br />
were developed and household data was collected every year. BMN has<br />
approximately 40 indicators, divided into 9 groups – (1) nutrition, (2) housing,<br />
(3) education and health, (4) family safety, (5) income, (6) family<br />
planning, (7) participation, (8) culture and religion, (9) environment.<br />
After every five-year national plan cycle, the benchmark for each indicator is<br />
adjusted to reflect the new national socio-economic development targets.<br />
The BMN indicators are then used to monitor and evaluate the Plan’s<br />
development results.<br />
After serving as key rural development instruments for over a decade,<br />
the NRDC-2C and the BMN indicators are being reviewed to<br />
reflect the national development strategy to integrate “rural” and “urban”<br />
development.<br />
Noteworthy among poor performers is<br />
Rayong – the industrial hub in the Eastern<br />
Seaboard where AIDS and unhealthy<br />
behaviours are jeopardizing public health.<br />
Phuket, despite its high standard of living,<br />
is among the bottom fives for cigarette<br />
and alcohol consumption, and mental<br />
health.<br />
Individual indicators also tell interesting<br />
stories.<br />
Life expectancy is relatively highest<br />
in southern provinces, while lowest in<br />
the North.<br />
Malnutrition is still a problem in<br />
remote areas in Mae Hong Son and<br />
Nan, and some poverty-stricken lower<br />
northeastern provinces.<br />
89
90<br />
1. Bangkok<br />
2. Nakhon Pathom<br />
3. Nonthaburi<br />
4. Pathum Thani<br />
5. Samut Prakan<br />
6. Samut Sakhon<br />
7. Chai Nat<br />
8. Phra Nakhon Si Ayutthaya<br />
9. Lop Buri<br />
10. Saraburi<br />
11. Sing Buri<br />
12. Ang Thong<br />
13. Chanthaburi<br />
14. Chachoengsao<br />
15. Chon Buri<br />
16. Trat<br />
17. Nakhon Nayok<br />
18. Prachin Buri<br />
19. Rayong<br />
20. Sa Kaeo<br />
21. Ratchaburi<br />
22. Kanchanaburi<br />
23. Suphan Buri<br />
24. Samut Songkhram<br />
25. Phetchaburi<br />
26. Prachuap Khiri Khan<br />
27. Nakhon Ratchasima<br />
28. Buri Ram<br />
29. Surin<br />
30. Si Sa Ket<br />
31. Ubon Ratchathani<br />
32. Yasothon<br />
33. Chaiyaphum<br />
34. Amnat Charoen<br />
35. Nong Bua Lam Phu<br />
36. Khon Kaen<br />
37. Udon Thani<br />
38. Loei<br />
39. Nong Khai<br />
40. Maha Sarakham<br />
41. Roi Et<br />
42. Kalasin<br />
43. Sakon Nakhon<br />
44. Nakhon Phanom<br />
45. Mukdahan<br />
46. Chiang Mai<br />
47. Lamphun<br />
48. Lampang<br />
49. Uttaradit<br />
50. Phrae<br />
51. Nan<br />
52. Phayao<br />
53. Chiang Rai<br />
54. Mae Hong Son<br />
55. Nakhon Sawan<br />
56. Uthai Thani<br />
57. Kamphaeng Phet<br />
58. Tak<br />
59. Sukhothai<br />
60. Phitsanulok<br />
61. Phichit<br />
62. Phetchabun<br />
63. Nakhon Si Thammarat<br />
64. Krabi<br />
65. Phangnga<br />
66. Phuket<br />
67. Surat Thani<br />
68. Ranong<br />
69. Chumphon<br />
70. Songkhla<br />
71. Satun<br />
72. Trang<br />
73. Phatthalung<br />
74. Pattani<br />
75. Yala<br />
76. Narathiwat<br />
Map 1. Provincial Distribution of the Health Index<br />
54<br />
65<br />
66<br />
46<br />
47<br />
68<br />
58<br />
22<br />
69<br />
67<br />
64<br />
48<br />
72<br />
53<br />
63<br />
71<br />
52<br />
50<br />
73<br />
70<br />
51<br />
60<br />
38<br />
35<br />
43<br />
57 61<br />
55<br />
62<br />
33<br />
36<br />
40<br />
42<br />
41<br />
21<br />
7<br />
11<br />
9<br />
12 10<br />
8<br />
3<br />
4 17 18<br />
2<br />
1<br />
5 14<br />
24<br />
15<br />
27 28<br />
25<br />
19 13<br />
26<br />
16<br />
6<br />
59<br />
49<br />
37<br />
56<br />
23<br />
20<br />
29<br />
74<br />
75<br />
76<br />
39<br />
32<br />
30<br />
Health Index<br />
44<br />
45<br />
34<br />
0.506 to 0.568 (7)<br />
0.568 to 0.63 (17)<br />
0.63 to 0.692 (24)<br />
0.692 to 0.754 (23)<br />
0.754 to 0.815 (5)<br />
<strong>THAILAND</strong> <strong>HUMAN</strong> <strong>DEVELOPMENT</strong> <strong>REPORT</strong> <strong>2003</strong><br />
31
The AIDS epidemic has moved from<br />
northern provinces to the industrial<br />
areas where there is a large concentration<br />
of workers who migrate from<br />
various parts of the country, e.g.,<br />
Rayong, Pathum Thani, Lampang.<br />
Also notable are provinces on the<br />
eastern border, i.e. Chanthaburi and<br />
Trat.<br />
2. Education Index<br />
Education helps people obtain other skills,<br />
and enables people to function effectively<br />
in a society. The education index is comprised<br />
of:<br />
stock of education (mean years of<br />
schooling),<br />
flow of education (lower and upper<br />
secondary gross enrolment),<br />
educational achievement (lower and<br />
upper secondary students’ performance<br />
in national test),<br />
educational infrastructure (upper secondary<br />
students per teacher, upper<br />
secondary students per classroom).<br />
<strong>HUMAN</strong> <strong>DEVELOPMENT</strong> INDICES<br />
There is no discernable pattern of<br />
distribution for mental illness and<br />
unhealthy behaviour. High incidence<br />
is found in both well-to-do and poor<br />
provinces, and across regions.<br />
Something stays the same – Bangkok<br />
Metropolis has the highest concentration<br />
of physicians per population.<br />
The ratio is 24 times that of the most<br />
deprived province – Si Sa Ket.<br />
Table 2. Five Best and Worst Performers on Health Indicators<br />
Life expectancy 1 st degree AIDS Mental Unhealthy Population<br />
at birth malnutrition in incidence illness behaviour per physician<br />
(years) children under 5 (%) (per 100,000) (per 1,000) (%) (persons)<br />
Top 5 provinces<br />
Nonthaburi 79.8 Ratchaburi 0.0 Nonthaburi 0.0 Phayao 3.5 Samut Bangkok<br />
Songkhram 23.7 Metropolis 793<br />
Narathiwat 78.7 Chiang Rai 0.0 Chachoengsao 0.0 Trang 3.6 Loei 24.5 Chon Buri 1,876<br />
Nakhon Si Nong Bua Phattalung 0.0 Krabi 3.6 Uttaradit 24.6 Chiang Mai 2,082<br />
Thammarat 78.7 Lam Phu 0.8<br />
Pattani 77.6 Samut Prakan 1.0 Ubon Ratchathani 0.1 Chanthaburi 4.2 Songkhla 24.7 Phuket 2,103<br />
Ranong 77.1 Nonthaburi 1.6 Nakhon Phanom 0.4 Nakhon Pathom 4.9 Samut Sakon 24.8 Pathum Thani 2,261<br />
Bottom 5 provinces<br />
Phrae 65.2 Amnat Charoen 13.3 Lampang 24.7 Phuket 49.3 Rayong 47.4 Nong Bua<br />
Lam Phu 13,731<br />
Lamphun 65.1 Buri Ram 13.4 Pathum Thani 25.0 Nonthaburi 49.4 Phitsanulok 50.5 Chaiyaphum 13,759<br />
Chiang Mai 62.9 Khon Kaen 13.9 Trat 36.6 Ubon Ratchathani 54.9 Phuket 51.6 Kalasin 14,261<br />
Phayao 61.7 Nan 15.2 Chanthaburi 39.5 Nakhon Phanom 62.5 Maha Salakam 51.8 Phetchabun 14,629<br />
Chiang Rai 61.6 Mae Hong Son 15.9 Rayong 51.3 Nakhon Sawan 74.5 Mukdahan 55.8 Si Sa Ket 19,007<br />
The indicators reflect the philosophy of<br />
the National Education Act 1999 that<br />
emphasizes both the quantity and quality<br />
of education. Since the national mean<br />
years of schooling is 7.3 years, and<br />
primary education has been compulsory<br />
for quite some time, the education index<br />
focuses on secondary education, which<br />
has become a top national agenda. (Now,<br />
compulsory education is 9 years.)<br />
The education index ranges from 0.383<br />
to 0.649. Apart from a few exceptional<br />
cases, education is relatively equitable<br />
across the country. Most outstanding<br />
provinces are Chon Buri in the East,<br />
Phuket in the South, Lamphun, Lampang<br />
and Chiang Mai in the North, Nakhon<br />
Pathom and Phra Nakhon Si Ayutthaya in<br />
the Central Plain.<br />
91
92<br />
Special attention should be given to<br />
certain northeast provinces, i.e. Nong Bua<br />
Lam Phu, Roi Et, Buri Ram, Si Sa Ket, and<br />
lower northern provinces, i.e. Phetchabun<br />
and Kamphaeng Phet. Border provinces<br />
in the far North and South, i.e. Mae Hong<br />
Son, and Narathiwat are also among the<br />
worst performers.<br />
Individual indicators suggest that:<br />
In terms of access and quantity,<br />
residents of Bangkok Metropolis and<br />
the vicinity, along with Phuket, have<br />
the highest mean years of schooling.<br />
This does not necessarily mean that<br />
children in these prosperous provinces<br />
are the most privileged, but is<br />
largely a result of the migration of<br />
highly educated population from<br />
other regions to the metropolitan<br />
over the past decades. People in<br />
mountainous and border provinces in<br />
the North, e.g., Mae Hong Son, Nan,<br />
Tak, Chiang Rai, and Narathiwat have<br />
the least schooling years.<br />
Bangkok Metropolis has a surprisingly<br />
low enrolment rate. But this finding<br />
should be examined carefully; it could<br />
be attributed to inconsistency in data<br />
collection. Due to different administrative<br />
structures, data for Bangkok<br />
Metropolis and other provinces are<br />
handled by different organizations.<br />
Other low-enrolment provinces are<br />
Nakhon Sawan, Kamphaeng Phet and<br />
Phichit in the lower North.<br />
As for upper secondary enrolment,<br />
Kamphaeng Phet and Sukhothai in<br />
the lower North are still lagging<br />
behind, along with other northeastern<br />
provinces. Nan has a shortage<br />
of education infrastructure, which<br />
is probably a side effect of its high<br />
enrolment rate.<br />
In terms of quality, students in Bangkok<br />
Metropolis, in spite of crowded<br />
classrooms, perform well at both<br />
lower and upper secondary levels,<br />
while students in the Northeast<br />
Table 3. The Five Best and Worst Performers on Education Indicators<br />
Mean years Lower Upper Marks of Marks of Upper secondary Upper secondary<br />
of schooling secondary gross secondary gross lower secondary upper secondary students per students per<br />
(years) enrolment enrolment students students teacher classroom<br />
(%) (%) (%) (%) (students) (students)<br />
Top 5 provinces<br />
Nonthaburi 10.3 Chon Buri 102.3 Lamphun 79.8 Tak 51.6 Chiang Mai 43.8 Phra Nakhon Nakhon<br />
Si Ayutthaya 14 Ratchasima 31<br />
Bangkok Pathum Thani 100.6 Phrae 79.1 Nong Khai 50.1 Bangkok Nonthaburi 15 Nakhon<br />
Metropolis 9.6 Metropolis 43.3 Pathom 32<br />
Pathum Thani 8.8 Yala 100.4 Phuket 79.0 Trat 50.0 Phrae 41.7 Nakhon Pathom 15 Lamphun 32<br />
Phuket 8.4 Lamphun 97.4 Nan 77.2 Bangkok Pattani 40.1 Phattalung 16 Phichit 32<br />
Metropolis 49.6<br />
Samut Prakan 8.4 Nan 96.6 Sing Buri 74.4 Lop Buri 49.3 Sing Buri 39.9 Lampang 16 Ranong 32<br />
Bottom 5 provinces<br />
Narathiwat 5.9 Bangkok Nong Khai 37.9 Songkhla 40.6 Nakhon Si Tak 26 Samut Prakan 39<br />
Metropolis 63.4 Thammarat 31.3<br />
Chiang Rai 5.8 Nakhon Sawan 63.3 Sukhothai 36.5 Uttaradit 40.0 Kalasin 31.0 Si Sa Ket 26 Nonthaburi 39<br />
Tak 5.8 Kamphaeng Kamphaeng Ratchaburi 39.8 Buri Ram 31.0 Buri Ram 26 Phrae 39<br />
Phet 62.1 Phet 35.5<br />
Nan 5.8 Phichit 59.2 Nong Bua Narathiwat 39.8 Nong Bua Nong Bua Bangkok<br />
Lam Phu 31.5 Lam Phu 30.7 Lam Phu 28 Metropolis 40<br />
Mae Hong Roi Et 37.1 Chaiyaphum 30.3 Satun 39.4 Phetchabun 28.7 Sa Kaeo 29 Nan 42<br />
Son 4.5<br />
<strong>THAILAND</strong> <strong>HUMAN</strong> <strong>DEVELOPMENT</strong> <strong>REPORT</strong> <strong>2003</strong>
1. Bangkok<br />
2. Nakhon Pathom<br />
3. Nonthaburi<br />
4. Pathum Thani<br />
5. Samut Prakan<br />
6. Samut Sakhon<br />
7. Chai Nat<br />
8. Phra Nakhon Si Ayutthaya<br />
9. Lop Buri<br />
10. Saraburi<br />
11. Sing Buri<br />
12. Ang Thong<br />
13. Chanthaburi<br />
14. Chachoengsao<br />
15. Chon Buri<br />
16. Trat<br />
17. Nakhon Nayok<br />
18. Prachin Buri<br />
19. Rayong<br />
20. Sa Kaeo<br />
21. Ratchaburi<br />
22. Kanchanaburi<br />
23. Suphan Buri<br />
24. Samut Songkhram<br />
25. Phetchaburi<br />
26. Prachuap Khiri Khan<br />
27. Nakhon Ratchasima<br />
28. Buri Ram<br />
29. Surin<br />
30. Si Sa Ket<br />
31. Ubon Ratchathani<br />
32. Yasothon<br />
33. Chaiyaphum<br />
34. Amnat Charoen<br />
35. Nong Bua Lam Phu<br />
36. Khon Kaen<br />
37. Udon Thani<br />
38. Loei<br />
39. Nong Khai<br />
40. Maha Sarakham<br />
41. Roi Et<br />
42. Kalasin<br />
43. Sakon Nakhon<br />
44. Nakhon Phanom<br />
45. Mukdahan<br />
46. Chiang Mai<br />
47. Lamphun<br />
48. Lampang<br />
49. Uttaradit<br />
50. Phrae<br />
51. Nan<br />
52. Phayao<br />
53. Chiang Rai<br />
54. Mae Hong Son<br />
55. Nakhon Sawan<br />
56. Uthai Thani<br />
57. Kamphaeng Phet<br />
58. Tak<br />
59. Sukhothai<br />
60. Phitsanulok<br />
61. Phichit<br />
62. Phetchabun<br />
63. Nakhon Si Thammarat<br />
64. Krabi<br />
65. Phangnga<br />
66. Phuket<br />
67. Surat Thani<br />
68. Ranong<br />
69. Chumphon<br />
70. Songkhla<br />
71. Satun<br />
72. Trang<br />
73. Phatthalung<br />
74. Pattani<br />
75. Yala<br />
76. Narathiwat<br />
<strong>HUMAN</strong> <strong>DEVELOPMENT</strong> INDICES<br />
Map 2. Provincial Distribution of the Education Index<br />
54<br />
65<br />
66<br />
46<br />
68<br />
58<br />
47<br />
22<br />
69<br />
67<br />
64<br />
48<br />
57<br />
72<br />
59<br />
26<br />
53<br />
63<br />
52<br />
50<br />
73<br />
61<br />
60<br />
70<br />
51<br />
62<br />
75<br />
38<br />
55<br />
7<br />
11<br />
9<br />
12<br />
21<br />
8<br />
4<br />
2 3<br />
1<br />
5<br />
24<br />
17<br />
18<br />
14<br />
15<br />
25<br />
19<br />
6<br />
56<br />
23 10<br />
71<br />
49<br />
74<br />
76<br />
33<br />
27<br />
13<br />
35<br />
20<br />
16<br />
36<br />
37<br />
28<br />
39<br />
43<br />
42<br />
40 41<br />
29<br />
32<br />
30<br />
44<br />
45<br />
34<br />
31<br />
Education Index<br />
0.383 to 0.436 (8)<br />
0.436 to 0.489 (23)<br />
0.489 to 0.542 (25)<br />
0.542 to 0.595 (11)<br />
0.595 to 0.649 (9)<br />
93
94<br />
deserve special attention. It should<br />
also be noted that variations in upper<br />
and lower secondary test scores<br />
may reflect not only the quality of<br />
schools, but also the socio-economic<br />
situations of the households of the<br />
students taking the tests.<br />
In terms of education infrastructure,<br />
Nakhon Pathom is outstanding for<br />
the low ratio of students per teacher<br />
and students per classroom.<br />
3. Employment Index<br />
Working is an important part of everyone’s<br />
life. The quality of working life is<br />
influenced by the extent to which the<br />
workers are able to find:<br />
favourable employment (unemployment<br />
and underemployment),<br />
security and protection (social security).<br />
Unemployment in Thailand has always<br />
been relatively low, even during the<br />
economic crises, but underemployment<br />
remains high, which is a characteristic<br />
of most agricultural societies. Another<br />
important issue is formal vs informal<br />
Table 4. Five Best and Worst Performers on<br />
Employment Indicators<br />
Unemployment Underemployment Social Security<br />
(%) (%) (%)<br />
Top 5 provinces<br />
Suphan Buri 0.1 Uttaradit 0.0 Samut Sakon 99.6<br />
Uthai Thani 0.4 Sa Kaeo 0.0 Samut Prakan 91.6<br />
Trat 0.7 Phetchaburi 0.0 Pathum Thani 78.2<br />
Maha Salakam 0.7 Trat 0.0 Phuket 55.8<br />
Chumphon 0.7 Phitsanulok 0.0 Phra Nakhon<br />
Si Ayutthaya 53.6<br />
Bottom 5 provinces<br />
Samut Prakan 4.1 Phattalung 7.0 Sakhon Nakhon 1.7<br />
Nakhon Phanom 5.0 Nakhon Phanom 7.3 Yasothon 1.6<br />
Amnat Charoen 5.1 Satun 9.5 Nakhon Phanom 1.4<br />
Nong Bua Lam Phu 6.7 Udon Thani 9.7 Amnat Charoen 1.4<br />
Udon Thani 7.3 Phangnga 26.0 Si Sa Ket 0.9<br />
sector employment, which is also reflected<br />
in the social security coverage.<br />
Only workers in the formal sector benefit<br />
from social security. The data in this<br />
study is as of December 2001 when<br />
establishments with 10 employees or<br />
more were required to enter this scheme.<br />
Starting in April 2002, the coverage<br />
expanded to any establishment with one<br />
or more employees. There is also a selfinsured<br />
scheme for self-employed workers,<br />
but this has not been successful. As<br />
of June 2002, about 6.7 million employees<br />
or about one-quarter of the labour force<br />
outside the public sector were covered by<br />
social security.<br />
It should be noted that social security is<br />
registered by the location of the work<br />
place, not the worker’s residence. Therefore,<br />
provinces that have a high concentration<br />
of factories and out-of-province<br />
workers record a very high coverage.<br />
The employment index covers a wide<br />
range, from 0.267 to 0.894. Provinces in<br />
the Bangkok vicinity are the best scorers.<br />
Within this group, Samut Sakon, Pathum<br />
Thani, Samut Prakan – the industrial ring<br />
around Bangkok – are most outstanding.<br />
Next in line are Chon Buri in the East and<br />
Phuket in the South.<br />
Map 3 and Table 4 show that the upper<br />
Northeast, more specifically the border<br />
provinces, are the worst performers.<br />
Udon Thani has the lowest index score,<br />
followed by Nong Bua Lam Phu, Nakhon<br />
Phanom and Amnat Charoen.<br />
An observation should be made that<br />
Phangnga has a very low index score of<br />
0.286 due to its 26 per cent underemployment,<br />
which is exceptionally high,<br />
and is probably a data error. But there is<br />
no basis for estimating an alternative<br />
number. Note, however, that Phangnga<br />
performs respectably in income, housing<br />
and living conditions, as well as family<br />
and community life. In this respect,<br />
Phangnga follows the pattern of most<br />
southern provinces where employment<br />
and income are not closely related as in<br />
other parts of the country.<br />
<strong>THAILAND</strong> <strong>HUMAN</strong> <strong>DEVELOPMENT</strong> <strong>REPORT</strong> <strong>2003</strong>
1. Bangkok<br />
2. Nakhon Pathom<br />
3. Nonthaburi<br />
4. Pathum Thani<br />
5. Samut Prakan<br />
6. Samut Sakhon<br />
7. Chai Nat<br />
8. Phra Nakhon Si Ayutthaya<br />
9. Lop Buri<br />
10. Saraburi<br />
11. Sing Buri<br />
12. Ang Thong<br />
13. Chanthaburi<br />
14. Chachoengsao<br />
15. Chon Buri<br />
16. Trat<br />
17. Nakhon Nayok<br />
18. Prachin Buri<br />
19. Rayong<br />
20. Sa Kaeo<br />
21. Ratchaburi<br />
22. Kanchanaburi<br />
23. Suphan Buri<br />
24. Samut Songkhram<br />
25. Phetchaburi<br />
26. Prachuap Khiri Khan<br />
27. Nakhon Ratchasima<br />
28. Buri Ram<br />
29. Surin<br />
30. Si Sa Ket<br />
31. Ubon Ratchathani<br />
32. Yasothon<br />
33. Chaiyaphum<br />
34. Amnat Charoen<br />
35. Nong Bua Lam Phu<br />
36. Khon Kaen<br />
37. Udon Thani<br />
38. Loei<br />
39. Nong Khai<br />
40. Maha Sarakham<br />
41. Roi Et<br />
42. Kalasin<br />
43. Sakon Nakhon<br />
44. Nakhon Phanom<br />
45. Mukdahan<br />
46. Chiang Mai<br />
47. Lamphun<br />
48. Lampang<br />
49. Uttaradit<br />
50. Phrae<br />
51. Nan<br />
52. Phayao<br />
53. Chiang Rai<br />
54. Mae Hong Son<br />
55. Nakhon Sawan<br />
56. Uthai Thani<br />
57. Kamphaeng Phet<br />
58. Tak<br />
59. Sukhothai<br />
60. Phitsanulok<br />
61. Phichit<br />
62. Phetchabun<br />
63. Nakhon Si Thammarat<br />
64. Krabi<br />
65. Phangnga<br />
66. Phuket<br />
67. Surat Thani<br />
68. Ranong<br />
69. Chumphon<br />
70. Songkhla<br />
71. Satun<br />
72. Trang<br />
73. Phatthalung<br />
74. Pattani<br />
75. Yala<br />
76. Narathiwat<br />
<strong>HUMAN</strong> <strong>DEVELOPMENT</strong> INDICES<br />
Map 3. Provincial Distribution of the Employment Index<br />
54<br />
65<br />
66<br />
46<br />
68<br />
58<br />
47<br />
22<br />
69<br />
64<br />
67<br />
48<br />
26<br />
72<br />
59<br />
63<br />
53<br />
50<br />
70<br />
51<br />
38<br />
57 61 62<br />
33<br />
55<br />
7 9<br />
11<br />
12<br />
8<br />
17<br />
4<br />
2 3 18<br />
1<br />
21 5 14<br />
24 15<br />
25<br />
19<br />
27<br />
13<br />
6<br />
56<br />
23 10<br />
71<br />
52<br />
73<br />
49<br />
60<br />
74<br />
75<br />
76<br />
35<br />
20<br />
16<br />
36<br />
37<br />
39<br />
42<br />
40 41<br />
28 29<br />
43<br />
32<br />
30<br />
44<br />
45<br />
34<br />
31<br />
Employment Index<br />
0.267 to 0.392 (5)<br />
0.392 to 0.517 (11)<br />
0.517 to 0.642 (37)<br />
0.642 to 0.767 (18)<br />
0.767 to 0.894 (5)<br />
95
96<br />
4. Income Index<br />
Income represents the command people<br />
have over goods and services. Income is<br />
necessary for people to achieve a certain<br />
standard of well-being. Poverty, on the<br />
other hand, is an indicator of ill-being.<br />
People are defined as poor if they do not<br />
have sufficient income to satisfy their<br />
minimum basic needs. The income index<br />
is expressed by:<br />
Income (household income and<br />
income change),<br />
Poverty (poverty incidence),<br />
Debt (household debt).<br />
Provinces vary considerably on this measure.<br />
The income index ranges from 0.150<br />
to 0.808. Predictably, Bangkok Metropolis<br />
maintains the highest score, followed by<br />
Phuket, Nonthaburi and Pathum Thani<br />
– the two provinces that could be regarded<br />
as Bangkok’s northern surburb.<br />
Phra Nakhon Si Ayutthaya, Chon Buri and<br />
Table 5. The Five Best and Worst Performers<br />
on Income Indicators<br />
Household Household current Poverty Households<br />
current income income changes incidence with debt<br />
(Baht/month) 1998-2000 (%) (%) (%)<br />
Top 5 provinces<br />
Bangkok Phangnga 33.4 Phuket 0.05 Narathiwat 24.7<br />
Metropolis 26,831<br />
Nonthaburi 24,393 Yala 33.0 Chon Buri 0.05 Phangnga 26.4<br />
Phuket 20,200 Kamphaeng Nonthaburi 0.05 Chon Buri 28.0<br />
Phet 27.5<br />
Pathum 19,160 Uthai Thani 24.1 Samut Trat 34.6<br />
Thani Songkhram 0.05<br />
Nakhon Ang Thong 21.0 Bangkok Phuket 35.1<br />
Pathom 18,205 Metropolis 0.26<br />
Bottom 5 provinces<br />
Surin 6,148 Nakhon Sakhon Nakhon<br />
Phanom -32.8 Nakhon 40.48 Sawan 76.4<br />
Phayao 5,865 Nong Bua Surin 41.02 Loei 79.4<br />
Lam Phu -35.3<br />
Nong Bua Trat -37.0 Nakhon Krabi 79.4<br />
Lam Phu 5,358 Phanom 48.14<br />
Nakhon Yasothon -37.6 Nong Bua Si Sa Ket 81.2<br />
Phanom 5,209 Lam Phu 49.98<br />
Yasothon 4,753 Nong Khai -40.9 Yasothon 50.27 Buri Ram 86.1<br />
Samut Songkhram – an industrial ring<br />
around Bangkok form the next best<br />
group. Samut Prakan and Samut Sakon –<br />
also part of the industrial ring – are<br />
notably absent from the first echelon.<br />
They appear in the second and third tiers<br />
respectively, reflecting the low-paying jobs<br />
held by residents of the two provinces.<br />
Phuket consistently appears in the best<br />
five in household income, poverty and<br />
debt. In general, northeastern provinces<br />
are at the low end of the spectrum. The<br />
gap between Bangkok Metropolis and<br />
Yasothon – the lowest income province is<br />
5.6 times. Three provinces – Yasothon,<br />
Nong Bua Lam Phu and Nakhon Phanom<br />
consistently appear in the bottom five in<br />
all categories, with an exception of debt.<br />
Map 4 presents areas of prosperity and<br />
pockets of poverty that share a similar<br />
distribution pattern as the employment<br />
index. The exception is the South where<br />
there is high underemployment and low<br />
social security coverage, but the people<br />
have a reasonable level of income and a<br />
low poverty incidence. The economic and<br />
demographic structure of the South is<br />
largely accountable for this characteristic.<br />
A likely explanation is that some common<br />
economic activities in the South are<br />
indeed episodic. These activities include:<br />
harvesting of raw latex, palm oil, and<br />
parawood; seasonal fishing and shell<br />
fishing, boat rentals and other services for<br />
seasonal tourists. Together, in most years,<br />
these activities produce good incomes.<br />
But respondents to a survey may still<br />
quite accurately report that they are<br />
“underemployed” and not covered by<br />
social security.<br />
As echoed in previous chapters, debt is a<br />
problem in most communities. Even in<br />
best places, at least a quarter of the<br />
households are in debt. In worst cases,<br />
the proportion is close to ninth-tens. 43<br />
43 In OECD countries, 60-70 per cent of households<br />
have mortgage debt for housing. This is<br />
a form of forced savings and, with the higher<br />
average incomes in these countries, is fully<br />
sustainable and desirable. Some of the betteroff<br />
provinces and income deciles in Thailand<br />
may also have sustainable debt for housing<br />
and for business formation or expansion.<br />
<strong>THAILAND</strong> <strong>HUMAN</strong> <strong>DEVELOPMENT</strong> <strong>REPORT</strong> <strong>2003</strong>
1. Bangkok<br />
2. Nakhon Pathom<br />
3. Nonthaburi<br />
4. Pathum Thani<br />
5. Samut Prakan<br />
6. Samut Sakhon<br />
7. Chai Nat<br />
8. Phra Nakhon Si Ayutthaya<br />
9. Lop Buri<br />
10. Saraburi<br />
11. Sing Buri<br />
12. Ang Thong<br />
13. Chanthaburi<br />
14. Chachoengsao<br />
15. Chon Buri<br />
16. Trat<br />
17. Nakhon Nayok<br />
18. Prachin Buri<br />
19. Rayong<br />
20. Sa Kaeo<br />
21. Ratchaburi<br />
22. Kanchanaburi<br />
23. Suphan Buri<br />
24. Samut Songkhram<br />
25. Phetchaburi<br />
26. Prachuap Khiri Khan<br />
27. Nakhon Ratchasima<br />
28. Buri Ram<br />
29. Surin<br />
30. Si Sa Ket<br />
31. Ubon Ratchathani<br />
32. Yasothon<br />
33. Chaiyaphum<br />
34. Amnat Charoen<br />
35. Nong Bua Lam Phu<br />
36. Khon Kaen<br />
37. Udon Thani<br />
38. Loei<br />
39. Nong Khai<br />
40. Maha Sarakham<br />
41. Roi Et<br />
42. Kalasin<br />
43. Sakon Nakhon<br />
44. Nakhon Phanom<br />
45. Mukdahan<br />
46. Chiang Mai<br />
47. Lamphun<br />
48. Lampang<br />
49. Uttaradit<br />
50. Phrae<br />
51. Nan<br />
52. Phayao<br />
53. Chiang Rai<br />
54. Mae Hong Son<br />
55. Nakhon Sawan<br />
56. Uthai Thani<br />
57. Kamphaeng Phet<br />
58. Tak<br />
59. Sukhothai<br />
60. Phitsanulok<br />
61. Phichit<br />
62. Phetchabun<br />
63. Nakhon Si Thammarat<br />
64. Krabi<br />
65. Phangnga<br />
66. Phuket<br />
67. Surat Thani<br />
68. Ranong<br />
69. Chumphon<br />
70. Songkhla<br />
71. Satun<br />
72. Trang<br />
73. Phatthalung<br />
74. Pattani<br />
75. Yala<br />
76. Narathiwat<br />
<strong>HUMAN</strong> <strong>DEVELOPMENT</strong> INDICES<br />
Map 4. Provincial Distribution of the Income Index<br />
54<br />
65<br />
66<br />
46<br />
47<br />
68<br />
58<br />
22<br />
69<br />
67<br />
64<br />
48<br />
50<br />
39<br />
60<br />
38<br />
35<br />
43<br />
57 61 62<br />
33<br />
36<br />
40<br />
42<br />
41<br />
55<br />
56<br />
21<br />
7 9<br />
11<br />
12<br />
8 17<br />
4<br />
2<br />
18<br />
3<br />
1<br />
5 14<br />
24 15<br />
27<br />
28 29<br />
25<br />
19 13<br />
6<br />
59<br />
49<br />
37<br />
23 10<br />
20<br />
26<br />
72<br />
63<br />
53<br />
71<br />
52<br />
73<br />
70<br />
51<br />
75<br />
74<br />
76<br />
16<br />
32<br />
30<br />
Income Index<br />
44<br />
45<br />
34<br />
31<br />
0.15 to 0.282 (5)<br />
0.282 to 0.414 (15)<br />
0.414 to 0.546 (23)<br />
0.546 to 0.678 (25)<br />
0.678 to 0.808 (8)<br />
97
98<br />
It is also interesting to observe that<br />
provinces with heavy debts are not the<br />
worst poverty-stricken. The relationship<br />
between poverty and debt is by no<br />
means direct and simple. Krabi – a rich<br />
resource and famous tourist destination in<br />
the South surprisingly turns up as the<br />
third-ranking province in debt, which<br />
accounts for its low ranking on the overall<br />
income index. It should, however, be<br />
noted that the household debt data used<br />
in this study consists of all sources of<br />
debt – household consumption, non-farm<br />
business, farming and others.<br />
5. Housing and Living<br />
Conditions Index<br />
The housing and living conditions index<br />
has 4 indicators that convey:<br />
physical and durable facilities (households<br />
constructed with permanent<br />
materials, urban households in slum),<br />
essential amenities (refrigerator, cooking<br />
gas or electric stove).<br />
Table 6. Five Best and Worst Performers on<br />
Housing and Living Conditions Indicators<br />
Houses with Urban Households Households<br />
permanent households with with cooking<br />
materials in slum Refrigerator gas or electric<br />
(%) (%) (%) stove (%)<br />
Top 5 provinces<br />
Nonthaburi 100.0 Chumphon 2.2 Rayong 93.5 Rayong 97.0<br />
Trat 100.0 Trang 4.8 Nonthaburi 90.0 Samut<br />
Songkhram 94.7<br />
Rayong 100.0 Nakhon Ang Thong 86.5 Samut<br />
Pathom 5.5 Prakan 92.7<br />
Uttaradit 100.0 Phetchaburi 5.7 Phra Nakhon Si Krabi 90.8<br />
Ayutthaya 85.6<br />
Satun 100.0 Kanchanaburi 6.3 Lamphun 85.4 Samut<br />
Sakon 90.8<br />
Bottom 5 provinces<br />
Samut Sakon 90.8 Sakhon Buri Ram 51.9 Ubon<br />
Nakhon 78.7 Ratchathani 22.7<br />
Chiang Mai 90.6 Maha Ubon Mukdahan 20.3<br />
Salakam 80.7 Ratchathani 51.2<br />
Prachuap Uthai Thani 82.3 Surin 40.0 Kalasin 18.3<br />
Khiri Khan 90.4<br />
Kanchanaburi 89.6 Samut Sakon 83.6 Si Sa Ket 39.6 Amnat<br />
Charoen 16.8<br />
Phangnga 89.2 Krabi 100.0 Mae Hong Nakhon<br />
Son 36.7 Phanom 10.9<br />
Although environmental factors are the<br />
basis of a good living environment,<br />
relevant data is not available at the<br />
provincial level. Therefore, this index<br />
cannot capture the downside of life in<br />
overcrowded and industrial cities, e.g.,<br />
pollution or other environmental harzards<br />
that are threatening the lives of many<br />
Thais.<br />
The housing and living conditions index<br />
ranges from 0.406 to 0.904. Nonthaburi<br />
and Nakhon Pathom – the northern and<br />
western Bangkok surburbs are among the<br />
top five. Others are Chumporn and<br />
Songkhla in the South and Chon Buri in<br />
the East. In general, provinces in the<br />
Central Plain, the East and the South,<br />
especially industrial provinces have good<br />
housing and living conditions.<br />
Mae Hong Son – a northern province on<br />
the Myanmar border, and most northeastern<br />
provinces along the border are<br />
the worst-off, while the central northeastern<br />
provinces and the upper northern<br />
provinces also deserve special attention.<br />
Many people in industrial provinces near<br />
Bangkok especially Samut Sakhon and<br />
Samut Prakan live in congested areas, and<br />
many northeastern households still live<br />
without cooking gas or an electric stove.<br />
Urban households in slum is the proportion<br />
of household in slum out of total<br />
households in urban areas (municipal and<br />
sanitary districts). This indicator deserves a<br />
careful examination. For example, the data<br />
shows that 100 per cent of households<br />
in Krabi are in slum. This is a result of<br />
different data sources. 44 As a result, the<br />
denominator is an imperfect proxy for the<br />
relevant urban population, yielding percentages<br />
living in slums that are probably<br />
too low in some provinces and too high in<br />
others.<br />
44 Number of households in low-income community<br />
in 317 municipal areas with over<br />
10,000 persons is from Housing Authority of<br />
Thailand Survey in 2000. Number of households<br />
in municipal and sanitary districts is<br />
from Socio-economic Survey 2000, National<br />
Statistical Office.<br />
<strong>THAILAND</strong> <strong>HUMAN</strong> <strong>DEVELOPMENT</strong> <strong>REPORT</strong> <strong>2003</strong>
1. Bangkok<br />
2. Nakhon Pathom<br />
3. Nonthaburi<br />
4. Pathum Thani<br />
5. Samut Prakan<br />
6. Samut Sakhon<br />
7. Chai Nat<br />
8. Phra Nakhon Si Ayutthaya<br />
9. Lop Buri<br />
10. Saraburi<br />
11. Sing Buri<br />
12. Ang Thong<br />
13. Chanthaburi<br />
14. Chachoengsao<br />
15. Chon Buri<br />
16. Trat<br />
17. Nakhon Nayok<br />
18. Prachin Buri<br />
19. Rayong<br />
20. Sa Kaeo<br />
21. Ratchaburi<br />
22. Kanchanaburi<br />
23. Suphan Buri<br />
24. Samut Songkhram<br />
25. Phetchaburi<br />
26. Prachuap Khiri Khan<br />
27. Nakhon Ratchasima<br />
28. Buri Ram<br />
29. Surin<br />
30. Si Sa Ket<br />
31. Ubon Ratchathani<br />
32. Yasothon<br />
33. Chaiyaphum<br />
34. Amnat Charoen<br />
35. Nong Bua Lam Phu<br />
36. Khon Kaen<br />
37. Udon Thani<br />
38. Loei<br />
39. Nong Khai<br />
40. Maha Sarakham<br />
41. Roi Et<br />
42. Kalasin<br />
43. Sakon Nakhon<br />
44. Nakhon Phanom<br />
45. Mukdahan<br />
46. Chiang Mai<br />
47. Lamphun<br />
48. Lampang<br />
49. Uttaradit<br />
50. Phrae<br />
51. Nan<br />
52. Phayao<br />
53. Chiang Rai<br />
54. Mae Hong Son<br />
55. Nakhon Sawan<br />
56. Uthai Thani<br />
57. Kamphaeng Phet<br />
58. Tak<br />
59. Sukhothai<br />
60. Phitsanulok<br />
61. Phichit<br />
62. Phetchabun<br />
63. Nakhon Si Thammarat<br />
64. Krabi<br />
65. Phangnga<br />
66. Phuket<br />
67. Surat Thani<br />
68. Ranong<br />
69. Chumphon<br />
70. Songkhla<br />
71. Satun<br />
72. Trang<br />
73. Phatthalung<br />
74. Pattani<br />
75. Yala<br />
76. Narathiwat<br />
<strong>HUMAN</strong> <strong>DEVELOPMENT</strong> INDICES<br />
Map 5. Provincial Distribution of the Housing and<br />
Living Conditions Index<br />
54<br />
65<br />
66<br />
46<br />
47<br />
68<br />
58<br />
22<br />
69<br />
67<br />
64<br />
48<br />
57<br />
59<br />
26<br />
72<br />
63<br />
53<br />
50<br />
61<br />
60<br />
70<br />
73<br />
51<br />
62<br />
75<br />
38<br />
55<br />
56<br />
7<br />
11<br />
9<br />
12<br />
21<br />
8<br />
4<br />
2 3<br />
1<br />
5<br />
24<br />
17<br />
18<br />
14<br />
15<br />
25<br />
19<br />
6<br />
23 10<br />
71<br />
52<br />
49<br />
74<br />
76<br />
33<br />
27<br />
13<br />
35<br />
20<br />
16<br />
36<br />
37<br />
40<br />
39<br />
42<br />
41<br />
28 29<br />
43<br />
32<br />
30<br />
44<br />
45<br />
34<br />
31<br />
Housing and Living<br />
Conditions Index<br />
0.406 to 0.506 (10)<br />
0.506 to 0.606 (12)<br />
0.606 to 0.706 (16)<br />
0.706 to 0.806 (20)<br />
0.806 to 0.904 (18)<br />
99
100<br />
6. Family and Community<br />
Life Index<br />
Every individual needs a family and a<br />
community life. Strong family and community<br />
ties provide necessary emotional<br />
support and are the most reliable social<br />
safety net. A stressful family life, on the<br />
other hand, places extra burden on all<br />
family members. Communities that are<br />
beset with social problems also expose<br />
their members to human insecurity. This<br />
index is captured by the followings:<br />
family life (female-headed households,<br />
elderly-headed households,<br />
working children, divorce incidence,<br />
disabled persons),<br />
community life (violent crimes reported,<br />
drug-related arrests).<br />
The family and community life index<br />
ranges from 0.483 to 0.778. In contrast to<br />
other indices, the best family and community<br />
life is found in the northeastern<br />
provinces. Surin has the highest score,<br />
followed closely by Khon Kaen, Yasothon,<br />
Nong Bua Lam Phu, Sa Kaeo, Buri Ram.<br />
Mae Hong Son, a remote province in the<br />
North, also another poor-income and<br />
deprived province in many aspects, is<br />
also a high scorer. Yala – the southern<br />
most province is also outstanding. Other<br />
southern provinces also have good family<br />
and community life.<br />
At the other end are Phra Nakhon Si<br />
Ayutthaya, followed by Ratchaburi, Sing<br />
Buri, Chachoengsao, Chon Buri, Nakhon<br />
Pathom, Samut Sakon, Bangkok Metropolis,<br />
and Chiang Mai. Most are outlying<br />
provinces around Bangkok. Kanchanaburi<br />
Table 7. Five Best and Worst Performers on Family and Community Life Indicators<br />
Female-headed Elderly-headed Working Divorce incidence Disable Violent Drug-related<br />
households households children aged (per 1,000 persons crimes reported arrests<br />
(%) (%) 15-17 (%) marriage) (%) (per 100,000) (per 100,000)<br />
Top 5 provinces<br />
Mae Hong 13.8 Samut Phrae 4.7 Narathiwat 95 Mae Hong Yasothon 4 Surin 76<br />
Son Prakan 6.8 Son 0.7<br />
Krabi 13.9 Phuket 11.5 Nonthaburi 6.7 Pattani 95 Songkhla 0.8 Amnat Phattalung 86<br />
Charoen 4<br />
Loei 14.7 Mukdahan 12.0 Khon Kaen 6.8 Yala 100 Udon Thani 0.8 Surin 4 Nong Bua<br />
Lam Phu 95<br />
Amnat Chon Buri 12.0 Phayao 7.4 Si Sa Ket 106 Samut Sakhon Buri Ram 98<br />
Charoen 15.0 Sakon 0.8 Nakhon 5<br />
Mukdahan 16.9 Bangkok Ang Thong 9.1 Ubon 109 Rayong 0.8 Si Sa Ket 5 Si Sa Ket 137<br />
Metropolis 12.2 Ratchathani<br />
Bottom 5 provinces<br />
Chon Buri 37.8 Phichit 33.9 Chachoeng- 36.2 Bangkok 351 Nakhon 2.8 Songkhla 28 Phra Nakhon 944<br />
sao Metropolis Sawan Si Ayutthaya<br />
Chachoengsao 38.7 Phra Nakhon 35.6 Krabi 36.5 Lampang 361 Chai Nat 2.9 Surat Thani 29 Pathum 963<br />
Si Ayutthaya Thani<br />
Phra Nakhon Ratchaburi 37.2 Tak 40.2 Chiang Rai 362 Phichit 3.2 Krabi 30 Samut 1,001<br />
Si Ayutthaya 41.5 Prakan<br />
Sing Buri 41.6 Lop Buri 37.3 Samut 41.5 Phrae 366 Phrae 3.3 Satun 31 Bangkok<br />
Sakon Metropolis 1,015<br />
Ratchaburi 41.9 Sing Buri 42.8 Mae Hong 48.0 Chiang Mai 384 Si Sa Ket 4.0 Trang 34 Nakhon 1,043<br />
Son Pathom<br />
<strong>THAILAND</strong> <strong>HUMAN</strong> <strong>DEVELOPMENT</strong> <strong>REPORT</strong> <strong>2003</strong>
1. Bangkok<br />
2. Nakhon Pathom<br />
3. Nonthaburi<br />
4. Pathum Thani<br />
5. Samut Prakan<br />
6. Samut Sakhon<br />
7. Chai Nat<br />
8. Phra Nakhon Si Ayutthaya<br />
9. Lop Buri<br />
10. Saraburi<br />
11. Sing Buri<br />
12. Ang Thong<br />
13. Chanthaburi<br />
14. Chachoengsao<br />
15. Chon Buri<br />
16. Trat<br />
17. Nakhon Nayok<br />
18. Prachin Buri<br />
19. Rayong<br />
20. Sa Kaeo<br />
21. Ratchaburi<br />
22. Kanchanaburi<br />
23. Suphan Buri<br />
24. Samut Songkhram<br />
25. Phetchaburi<br />
26. Prachuap Khiri Khan<br />
27. Nakhon Ratchasima<br />
28. Buri Ram<br />
29. Surin<br />
30. Si Sa Ket<br />
31. Ubon Ratchathani<br />
32. Yasothon<br />
33. Chaiyaphum<br />
34. Amnat Charoen<br />
35. Nong Bua Lam Phu<br />
36. Khon Kaen<br />
37. Udon Thani<br />
38. Loei<br />
39. Nong Khai<br />
40. Maha Sarakham<br />
41. Roi Et<br />
42. Kalasin<br />
43. Sakon Nakhon<br />
44. Nakhon Phanom<br />
45. Mukdahan<br />
46. Chiang Mai<br />
47. Lamphun<br />
48. Lampang<br />
49. Uttaradit<br />
50. Phrae<br />
51. Nan<br />
52. Phayao<br />
53. Chiang Rai<br />
54. Mae Hong Son<br />
55. Nakhon Sawan<br />
56. Uthai Thani<br />
57. Kamphaeng Phet<br />
58. Tak<br />
59. Sukhothai<br />
60. Phitsanulok<br />
61. Phichit<br />
62. Phetchabun<br />
63. Nakhon Si Thammarat<br />
64. Krabi<br />
65. Phangnga<br />
66. Phuket<br />
67. Surat Thani<br />
68. Ranong<br />
69. Chumphon<br />
70. Songkhla<br />
71. Satun<br />
72. Trang<br />
73. Phatthalung<br />
74. Pattani<br />
75. Yala<br />
76. Narathiwat<br />
<strong>HUMAN</strong> <strong>DEVELOPMENT</strong> INDICES<br />
Map 6. Provincial Distribution of the<br />
Family and Community Life Index<br />
54<br />
65<br />
66<br />
46<br />
47<br />
68<br />
58<br />
22<br />
69<br />
67<br />
64<br />
48<br />
57<br />
59<br />
26<br />
72<br />
63<br />
53<br />
50<br />
73<br />
61<br />
60<br />
70<br />
51<br />
62<br />
38<br />
55<br />
56<br />
7<br />
11<br />
9<br />
12<br />
21<br />
8<br />
4<br />
2 3<br />
1<br />
5<br />
24<br />
17<br />
18<br />
14<br />
15<br />
25<br />
19<br />
6<br />
23 10<br />
71<br />
52<br />
49<br />
33<br />
74<br />
75<br />
76<br />
27<br />
13<br />
35<br />
20<br />
16<br />
36<br />
37<br />
40<br />
39<br />
42<br />
41<br />
28 29<br />
43<br />
32<br />
30<br />
44<br />
45<br />
34<br />
31<br />
Family and Community<br />
Life Index<br />
0.483 to 0.542 (4)<br />
0.542 to 0.601 (10)<br />
0.601 to 0.66 (25)<br />
0.66 to 0.719 (22)<br />
0.719 to 0.778 (15)<br />
101
102<br />
and Tak on the western border are the<br />
other two provinces that are not performing<br />
well.<br />
Other interesting patterns are:<br />
The Central Plain has a remarkably<br />
high proportion of female-headed<br />
households and elderly-headed<br />
households. 45 (Note that the “femaleheaded”<br />
designation tells who is the<br />
breadwinner of the family. A husband-and-wife<br />
family may be categorized<br />
as such).<br />
Northern provinces are remarkably<br />
high in divorce rate. High rates of<br />
working children are notable in Mae<br />
Hong Son, Tak and Samut Sakon.<br />
These are provinces with high concentration<br />
of ethnic minorities and<br />
migrant workers.<br />
Bangkok Metropolis and Bangkok<br />
vicinity entail high rates of divorce,<br />
crimes and drug offenses.<br />
The Northeast, on the contrary, has<br />
the lowest divorce and crime rates.<br />
Drug also seems to be a lesser<br />
problem.<br />
7. Transportation and<br />
Communication Index<br />
Mobility and connectivity enhances<br />
people’s capacity while enriching their<br />
lives. This index is composed of:<br />
Transport (travel to nearest district,<br />
personal vehicle registration),<br />
Communication (television, telephone,<br />
internet).<br />
45 Some of the variations in elderly-headed<br />
households (for example, in the Central Plain)<br />
are probably due to a mix of demographic<br />
change (aging of the population) and family<br />
dispersion as younger generations find better<br />
opportunities in the cities.<br />
Data for convenient access to the nearest<br />
district is from rural areas only. In general,<br />
people in urban areas have convenient<br />
access to important facilities – hence<br />
Bangkok is assigned a perfect score.<br />
This is one of the most inequitable indices<br />
with a range between 0.209 and<br />
0.877. Phuket, now being groomed to be<br />
the national IT centre, performs second<br />
after Bangkok. Chon Buri and Rayong the<br />
two industrial provinces in the East are at<br />
the forefront, as well as Nonthaburi which<br />
serves as Bangkok’s residential surburb.<br />
Apart from some provinces that form a<br />
small crescent around the Gulf of Thailand,<br />
a few hubs of transportation and<br />
communication are located in the North<br />
and South.<br />
Personal vehicle registration is probably<br />
overestimated for Bangkok and underestimated<br />
for Bangkok vicinity since<br />
a large number of vehicles in these<br />
provinces are registered in Bangkok.<br />
It comes as no surprise that Mae Hong<br />
Son – a remote mountainous province on<br />
the Myanmar border scores the lowest.<br />
Si Sa Ket, Surin, Nong Bua Lam Phu, Buri<br />
Ram, Kalasin in the Northeast are the next<br />
worst-off group. Pattani on the southern<br />
border also deserves special attention.<br />
The relatively low penetration of television<br />
in some southern provinces is also<br />
noteworthy.<br />
All in all, the Northeast which is the<br />
poorest region, is much less advanced<br />
than the rest of the country. The disparity<br />
is most acute in telephone and internet –<br />
the backbone of the network age. The<br />
telephone indicator shows that the best<br />
province is 30 times better than the worst<br />
province. Nonetheless, it should be noted<br />
that excluded from this indicator are mobile<br />
phones, which in many remote areas<br />
have helped overcome the infrastructure<br />
barrier. At present, mobile phones have<br />
surpassed fixed line telephones in terms<br />
of subscribers.<br />
<strong>THAILAND</strong> <strong>HUMAN</strong> <strong>DEVELOPMENT</strong> <strong>REPORT</strong> <strong>2003</strong>
1. Bangkok<br />
2. Nakhon Pathom<br />
3. Nonthaburi<br />
4. Pathum Thani<br />
5. Samut Prakan<br />
6. Samut Sakhon<br />
7. Chai Nat<br />
8. Phra Nakhon Si Ayutthaya<br />
9. Lop Buri<br />
10. Saraburi<br />
11. Sing Buri<br />
12. Ang Thong<br />
13. Chanthaburi<br />
14. Chachoengsao<br />
15. Chon Buri<br />
16. Trat<br />
17. Nakhon Nayok<br />
18. Prachin Buri<br />
19. Rayong<br />
20. Sa Kaeo<br />
21. Ratchaburi<br />
22. Kanchanaburi<br />
23. Suphan Buri<br />
24. Samut Songkhram<br />
25. Phetchaburi<br />
26. Prachuap Khiri Khan<br />
27. Nakhon Ratchasima<br />
28. Buri Ram<br />
29. Surin<br />
30. Si Sa Ket<br />
31. Ubon Ratchathani<br />
32. Yasothon<br />
33. Chaiyaphum<br />
34. Amnat Charoen<br />
35. Nong Bua Lam Phu<br />
36. Khon Kaen<br />
37. Udon Thani<br />
38. Loei<br />
39. Nong Khai<br />
40. Maha Sarakham<br />
41. Roi Et<br />
42. Kalasin<br />
43. Sakon Nakhon<br />
44. Nakhon Phanom<br />
45. Mukdahan<br />
46. Chiang Mai<br />
47. Lamphun<br />
48. Lampang<br />
49. Uttaradit<br />
50. Phrae<br />
51. Nan<br />
52. Phayao<br />
53. Chiang Rai<br />
54. Mae Hong Son<br />
55. Nakhon Sawan<br />
56. Uthai Thani<br />
57. Kamphaeng Phet<br />
58. Tak<br />
59. Sukhothai<br />
60. Phitsanulok<br />
61. Phichit<br />
62. Phetchabun<br />
63. Nakhon Si Thammarat<br />
64. Krabi<br />
65. Phangnga<br />
66. Phuket<br />
67. Surat Thani<br />
68. Ranong<br />
69. Chumphon<br />
70. Songkhla<br />
71. Satun<br />
72. Trang<br />
73. Phatthalung<br />
74. Pattani<br />
75. Yala<br />
76. Narathiwat<br />
<strong>HUMAN</strong> <strong>DEVELOPMENT</strong> INDICES<br />
Map 7. Provincial Distribution of the<br />
Transportation and Communication Index<br />
54<br />
65<br />
66<br />
46<br />
47<br />
68<br />
58<br />
22<br />
69<br />
67<br />
64<br />
48<br />
57<br />
59<br />
26<br />
72<br />
63<br />
53<br />
50<br />
73<br />
61<br />
60<br />
70<br />
51<br />
62<br />
38<br />
56<br />
7<br />
55<br />
11<br />
9<br />
12<br />
21<br />
8<br />
4<br />
2 3<br />
1<br />
5<br />
24<br />
17<br />
18<br />
14<br />
15<br />
25<br />
19<br />
6<br />
23 10<br />
71<br />
52<br />
49<br />
33<br />
74<br />
75<br />
76<br />
27<br />
13<br />
35<br />
20<br />
16<br />
36<br />
37<br />
40<br />
39<br />
42<br />
41<br />
28 29<br />
43<br />
32<br />
30<br />
44<br />
45<br />
34<br />
31<br />
Transportation and<br />
Communication Index<br />
0.209 to 0.343 (3)<br />
0.343 to 0.477 (17)<br />
0.477 to 0.611 (33)<br />
0.611 to 0.745 (20)<br />
0.745 to 0.877 (3)<br />
103
104<br />
Table 8. Five Best and Worst Performers on Transport and Communication Indicators<br />
Villages with Personal vehicle Households<br />
convenient access registration with access to<br />
to nearest district (per 1,000) television<br />
(%) (%)<br />
8. Participation Index<br />
Top 5 provinces<br />
Political and social participation enhances<br />
people’s lives and improves the quality of<br />
community life. The participation index is<br />
expressed by:<br />
political participation (vote turnout),<br />
civil society participation (community<br />
groups, households’ participation in<br />
local groups and social services).<br />
Data for households’ participation in local<br />
groups and social services is from rural<br />
areas, which is used as proxy for the<br />
entire province. There is no comparable<br />
data for Bangkok. As Bangkok is among<br />
the bottom five in terms of community<br />
groups, and its residents are generally<br />
known to lead a rather individualist life<br />
style, it is given the same score as the<br />
least active province.<br />
It should also be noted that government<br />
agencies usually play an important role in<br />
Population Population with access<br />
per telephone to internet<br />
(persons) (%)<br />
Bangkok Metropolis 100.0 Phuket 888 Rayong 97.0 Chai Nat 2 Bangkok Metropolis 16.0<br />
Sing Buri 98.3 Bangkok Metropolis 734 Nonthaburi 96.3 Bangkok Metropolis 2 Nonthaburi 15.9<br />
Trang 98.3 Rayong 633 Samut Songkhram 96.1 Pathum Thani 2 Phuket 10.6<br />
Satun 98.0 Chon Buri 621 Loei 95.5 Nonthaburi 2 Pathum Thani 10.3<br />
Phuket 97.9 Lamphun 586 Lamphun 95.2 Samut Prakan 2 Samut Prakan 10.1<br />
Bottom 5 provinces<br />
Mukdahan 73.9 Si Sa Ket 151 Phangnga 79.1 Kalasin 50 Narathiwat 1.5<br />
Kalasin 73.6 Samut Prakan 118 Yala 77.3 Buri Ram 52 Buri Ram 1.4<br />
Surin 68.5 Nong Bua Lam Phu 115 Narathiwat 73.0 Surin 57 Nong Khai 1.2<br />
Si Sa Ket 61.3 Mae Hong Son 114 Pattani 67.2 Si Sa Ket 58 Nong Bua Lam Phu 1.0<br />
Mae Hong Son 41.1 Pathum Thani 109 Mae Hong Son 51.2 Nong Bua Lam Phu 61 Sa Kaeo 0.9<br />
helping establish and support “community<br />
groups” as part of their outreach and<br />
extension programmes. This data is therefore<br />
an inadequate measure of people’s<br />
participation. Nonetheless, in the absence<br />
of other systematic data at the provincial<br />
level, they provide an initial glimpse into<br />
this very important aspect of human<br />
achievement.<br />
The participation index ranges from 0.295<br />
to 0.768. Nan has the highest score,<br />
followed by Sing Buri, Phangnga, Amnat<br />
Charoen, Uthai Thani.<br />
At the other end, the residents of Bangkok,<br />
Samut Sakon and Pathum Thani (in<br />
Bangkok vicinity), Phitsanulok in the<br />
North, Pattani and Chumporn in the<br />
South, and Chon Buri in the East are<br />
among the least active.<br />
While there is no discernable pattern of<br />
participation, Map 8 illustrates that people<br />
in the upper North and the Northeast<br />
have higher participatory rates, while<br />
<strong>THAILAND</strong> <strong>HUMAN</strong> <strong>DEVELOPMENT</strong> <strong>REPORT</strong> <strong>2003</strong>
1. Bangkok<br />
2. Nakhon Pathom<br />
3. Nonthaburi<br />
4. Pathum Thani<br />
5. Samut Prakan<br />
6. Samut Sakhon<br />
7. Chai Nat<br />
8. Phra Nakhon Si Ayutthaya<br />
9. Lop Buri<br />
10. Saraburi<br />
11. Sing Buri<br />
12. Ang Thong<br />
13. Chanthaburi<br />
14. Chachoengsao<br />
15. Chon Buri<br />
16. Trat<br />
17. Nakhon Nayok<br />
18. Prachin Buri<br />
19. Rayong<br />
20. Sa Kaeo<br />
21. Ratchaburi<br />
22. Kanchanaburi<br />
23. Suphan Buri<br />
24. Samut Songkhram<br />
25. Phetchaburi<br />
26. Prachuap Khiri Khan<br />
27. Nakhon Ratchasima<br />
28. Buri Ram<br />
29. Surin<br />
30. Si Sa Ket<br />
31. Ubon Ratchathani<br />
32. Yasothon<br />
33. Chaiyaphum<br />
34. Amnat Charoen<br />
35. Nong Bua Lam Phu<br />
36. Khon Kaen<br />
37. Udon Thani<br />
38. Loei<br />
39. Nong Khai<br />
40. Maha Sarakham<br />
41. Roi Et<br />
42. Kalasin<br />
43. Sakon Nakhon<br />
44. Nakhon Phanom<br />
45. Mukdahan<br />
46. Chiang Mai<br />
47. Lamphun<br />
48. Lampang<br />
49. Uttaradit<br />
50. Phrae<br />
51. Nan<br />
52. Phayao<br />
53. Chiang Rai<br />
54. Mae Hong Son<br />
55. Nakhon Sawan<br />
56. Uthai Thani<br />
57. Kamphaeng Phet<br />
58. Tak<br />
59. Sukhothai<br />
60. Phitsanulok<br />
61. Phichit<br />
62. Phetchabun<br />
63. Nakhon Si Thammarat<br />
64. Krabi<br />
65. Phangnga<br />
66. Phuket<br />
67. Surat Thani<br />
68. Ranong<br />
69. Chumphon<br />
70. Songkhla<br />
71. Satun<br />
72. Trang<br />
73. Phatthalung<br />
74. Pattani<br />
75. Yala<br />
76. Narathiwat<br />
<strong>HUMAN</strong> <strong>DEVELOPMENT</strong> INDICES<br />
Map 8. Provincial Distribution of the Participation Index<br />
54<br />
65<br />
66<br />
46<br />
47<br />
68<br />
58<br />
22<br />
69<br />
67<br />
64<br />
48<br />
57<br />
59<br />
26<br />
72<br />
63<br />
53<br />
50<br />
73<br />
61<br />
60<br />
70<br />
51<br />
62<br />
38<br />
55<br />
56<br />
7<br />
11<br />
9<br />
12<br />
21<br />
8<br />
4<br />
2 3<br />
1<br />
5<br />
24<br />
17<br />
18<br />
14<br />
15<br />
25<br />
19<br />
6<br />
23 10<br />
71<br />
52<br />
49<br />
33<br />
74<br />
75<br />
76<br />
27<br />
13<br />
35<br />
20<br />
16<br />
36<br />
37<br />
40<br />
39<br />
42<br />
41<br />
28 29<br />
43<br />
32<br />
30<br />
44<br />
45<br />
34<br />
31<br />
Participation Index<br />
0.295 to 0.39 (2)<br />
0.39 to 0.485 (2)<br />
0.485 to 0.58 (13)<br />
0.58 to 0.675 (41)<br />
0.675 to 0.768 (18)<br />
105
106<br />
Vote turnout (%)<br />
Table 9. The Five Best and Worst Performers on Participation Indicators<br />
Community groups Households participate Households participate<br />
(per 100,000) in local groups (%) in social service (%)<br />
those in the lower North and upper<br />
South have relatively lower rates of<br />
participation. 46<br />
COMPOSITE HAI<br />
Top 5 provinces<br />
Prachin Buri 94.8 Trat 253 Lampang 98.4 Maha Salakam 99.1<br />
Lamphun 83.8 Phayao 221 Phrae 97.9 Lampang 99.1<br />
Satun 82.2 Nan 211 Phayao 97.9 Amnat Charoen 99.0<br />
Nan 79.5 Sing Buri 201 Lamphun 96.8 Nan 99.0<br />
Chiang Mai 78.8 Phangnga 175 Samut Songkhram 96.5 Surin 98.9<br />
Bottom 5 provinces<br />
Si Sa Ket 64.3 Samut Sakon 40.0 Satun 70.8 Trang 89.3<br />
Nong Khai 62.3 Phuket 35.0 Samut Sakon 66.3 Phattalung 89.0<br />
Kamphaeng Phet 61.6 Nonthaburi 33.2 Pathum Thani 57.8 Phitsanulok 88.3<br />
Samut Prakan 60.8 Samut Prakan 19.5 Samut Prakan 37.8 Samut Sakon 88.2<br />
Mukdahan 37.4 Bangkok Metropolis 8.3 Bangkok Metropolis 37.8 Bangkok Metropolis 88.2<br />
Together, the 8 indices give HAI composite<br />
values that range from 0.477 to 0.718.<br />
Table 10 shows HAI indices and the composite<br />
index by province in descending<br />
order.<br />
46 In international research, there is strong<br />
evidence that helps to explain why the<br />
number of community groups and household<br />
participation in local groups tend to be high in<br />
poorer areas, and much lower in wealthy areas,<br />
particularly in large cities. The higher proportions<br />
in poor areas are due, in part, to “informal<br />
insurance”. Households insure against risk by a<br />
range of informal insurance mechanisms,<br />
including building and drawing on social capital<br />
such as reciprocal labour exchanges, and<br />
savings and loan circles. In big cities, households<br />
have access to formal insurance and<br />
also have higher incomes that enable them<br />
to self-insure. (See for example: Jonathan,<br />
Morduch “Between the Market and the State:<br />
Can Informal Insurance Patch the Safety Net?”<br />
1999, Background paper for the Word Development<br />
Report 2000/2001). Thus, some of the<br />
variation in participation is natural, explainable,<br />
seen worldwide, and not necessarily bad.<br />
On the HAI scale, Phuket, the tourism and<br />
business center of the South, has the<br />
highest level of human achievement in<br />
the country. Bangkok metropolis takes<br />
the sixth place. The remaining top ten<br />
scorers are part of the urban, industrial<br />
base that forms a crescent around Bangkok,<br />
all within 200 kilometre radius from<br />
Bangkok. Lamphun, the largest industrial<br />
base in the North, and Songkhla – the<br />
business center of the South are three<br />
exceptions.<br />
The next best ten are provinces surrounding<br />
the first group. Yala and Chumporn in<br />
the South and Chanthaburi in the East are<br />
the only three exceptions.<br />
At the lower end of the scale, Nakhon<br />
Phanom, a border province in the Northeast,<br />
has the lowest level of human<br />
achievement. Nine of the bottom ten<br />
provinces are in the Northeast. The<br />
only exception is Mae Hong Son in the<br />
North.<br />
Northeastern provinces still dominate the<br />
next worst-off group of ten, with Nakhon<br />
Sawan in the Central Plain and<br />
Phetchabun in the North as the exceptions.<br />
<strong>THAILAND</strong> <strong>HUMAN</strong> <strong>DEVELOPMENT</strong> <strong>REPORT</strong> <strong>2003</strong>
Map 9 shows the distribution of all<br />
the provinces in five categories – green<br />
representing the most advanced group<br />
in human achievement, while red representing<br />
the opposite.<br />
In general, HAI shows that human<br />
achievement is higher in Bangkok and<br />
Location<br />
its outlying provinces. It confirms that the<br />
Northeast has the lowest level of human<br />
achievement. The lower North is another<br />
area that deserves special attention.<br />
Further, HAI also shows that some border<br />
provinces in the North, Northeast and the<br />
South are among the worst off.<br />
Table 10. Human Achievement Indices and the Composite Index by Province<br />
Housing Family Transportation<br />
Health Education Employment Income and living and and Participation Composite<br />
Index Index Index Index conditions community communication Index Index<br />
Index life Index Index<br />
1 2 3 4 5 6 7 8<br />
1. Phuket 0.6218 0.6377 0.7700 0.7676 0.8308 0.6642 0.8315 0.6161 0.7175<br />
2. Nonthaburi 0.7463 0.5992 0.6523 0.7569 0.9035 0.6565 0.7323 0.6009 0.7060<br />
3. Chon Buri 0.7505 0.6483 0.7787 0.7028 0.8611 0.5555 0.7558 0.5517 0.7006<br />
4. Nakhon Pathom 0.7160 0.6217 0.6743 0.6594 0.8766 0.5610 0.6470 0.6871 0.6804<br />
5. Songkhla 0.7696 0.5119 0.6569 0.5928 0.8730 0.6919 0.6973 0.6369 0.6788<br />
6. Bangkok<br />
Metropolis 0.7884 0.5418 0.6744 0.8074 0.8191 0.5816 0.8765 0.2959 0.6731<br />
7. Rayong 0.5604 0.5589 0.7037 0.6715 0.8346 0.6978 0.7320 0.5832 0.6678<br />
8. Lamphun 0.6174 0.6475 0.6470 0.5859 0.7079 0.6496 0.6940 0.7610 0.6638<br />
9. Samut<br />
Songkhram 0.7457 0.5147 0.6513 0.6951 0.8096 0.6262 0.6006 0.6648 0.6635<br />
10. Pathum Thani 0.7012 0.5833 0.8137 0.6918 0.7936 0.5928 0.6603 0.4702 0.6634<br />
11. Ang Thong 0.6852 0.5885 0.5997 0.6284 0.8215 0.6625 0.6251 0.6215 0.6540<br />
12. Phra Nakhon<br />
Si Ayutthaya 0.6260 0.6094 0.6813 0.7042 0.8408 0.4833 0.6055 0.6787 0.6536<br />
13. Phetchaburi 0.7300 0.5587 0.6568 0.5547 0.8253 0.6299 0.6198 0.6392 0.6518<br />
14. Saraburi 0.7121 0.5488 0.7124 0.6048 0.7513 0.6107 0.6393 0.6271 0.6508<br />
15. Yala 0.6898 0.5789 0.6153 0.6146 0.7920 0.7291 0.5772 0.5910 0.6485<br />
16. Sing Buri 0.7191 0.5992 0.6246 0.6399 0.6804 0.5309 0.6559 0.6996 0.6437<br />
17. Chachoengsao 0.8146 0.5515 0.6728 0.5677 0.8332 0.5318 0.5814 0.5916 0.6431<br />
18. Samut Prakan 0.7856 0.5409 0.7884 0.6489 0.7859 0.6190 0.5984 0.3656 0.6416<br />
19. Chanthaburi 0.6661 0.5343 0.6583 0.4784 0.7794 0.6554 0.6567 0.6585 0.6359<br />
20. Chumphon 0.7165 0.5015 0.6600 0.5681 0.8676 0.6128 0.5926 0.5453 0.6330<br />
21. Prachin Buri 0.7297 0.4879 0.6470 0.6042 0.7641 0.6212 0.5395 0.6707 0.6330<br />
22. Trat 0.6216 0.5212 0.6527 0.4540 0.8322 0.6537 0.5844 0.7308 0.6313<br />
23. Surat Thani 0.7131 0.4866 0.6629 0.5789 0.7396 0.6591 0.6307 0.5632 0.6293<br />
24. Suphan Buri 0.6760 0.4802 0.6483 0.5903 0.8564 0.6284 0.5425 0.6111 0.6292<br />
25. Prachuap<br />
Khiri Khan 0.6784 0.5184 0.6356 0.5758 0.7364 0.6425 0.6312 0.6013 0.6275<br />
26. Lampang 0.6359 0.6217 0.6167 0.4543 0.6404 0.6537 0.6384 0.7402 0.6252<br />
27. Samut Sakon 0.7916 0.4940 0.8933 0.5647 0.6060 0.5797 0.6275 0.4371 0.6242<br />
28. Trang 0.6937 0.5115 0.6253 0.5394 0.8328 0.6112 0.6055 0.5627 0.6228<br />
29. Ratchaburi 0.7366 0.4868 0.5572 0.6401 0.8008 0.5070 0.6567 0.5880 0.6216<br />
30. Satun 0.7140 0.5136 0.4616 0.5670 0.8634 0.6624 0.5776 0.6018 0.6202<br />
31. Phrae 0.6292 0.5699 0.5398 0.5187 0.6813 0.6359 0.6464 0.7230 0.6180<br />
32. Uttaradit 0.7523 0.4850 0.5814 0.4683 0.7330 0.6517 0.5671 0.6834 0.6153<br />
<strong>HUMAN</strong> <strong>DEVELOPMENT</strong> INDICES<br />
(Continued on next page)<br />
107
108<br />
Location<br />
Table 10 (continued)<br />
Housing Family Transportation<br />
Health Education Employment Income and living and and Participation Composite<br />
Index Index Index Index conditions community communication Index Index<br />
Index life Index Index<br />
1 2 3 4 5 6 7 8<br />
33. Nakhon Nayok 0.7047 0.5136 0.5747 0.5622 0.7781 0.6362 0.5715 0.5673 0.6135<br />
34. Phayao 0.5701 0.5319 0.6219 0.4185 0.7060 0.6975 0.6114 0.7496 0.6134<br />
35. Uthai Thani 0.7043 0.5147 0.6602 0.5619 0.5628 0.6548 0.5567 0.6892 0.6131<br />
36. Lop Buri 0.7206 0.5748 0.5240 0.5291 0.7903 0.5621 0.5657 0.6001 0.6083<br />
37. Phattalung 0.6738 0.5281 0.4546 0.5174 0.8321 0.6814 0.5631 0.5979 0.6061<br />
38. Phangnga 0.6644 0.4962 0.2858 0.7599 0.7081 0.7017 0.5338 0.6942 0.6055<br />
39. Ranong 0.6461 0.5077 0.6087 0.5498 0.6697 0.7084 0.5690 0.5732 0.6041<br />
40. Chai Nat 0.6983 0.4534 0.4722 0.6338 0.7442 0.5881 0.6213 0.6166 0.6035<br />
41. Chiang Mai 0.6504 0.6187 0.5595 0.5203 0.5571 0.5853 0.6378 0.6829 0.6015<br />
42. Nan 0.5419 0.5707 0.6301 0.4025 0.6945 0.6814 0.4904 0.7679 0.5974<br />
43. Nakhon Si<br />
Thammarat 0.6776 0.4884 0.5024 0.5072 0.7937 0.6816 0.5583 0.5475 0.5946<br />
44. Chiang Rai 0.7013 0.5031 0.5844 0.4997 0.5903 0.6149 0.5634 0.6720 0.5911<br />
45. Kanchanaburi 0.7088 0.4716 0.5450 0.4804 0.7598 0.5948 0.5639 0.6010 0.5907<br />
46. Sa Kaeo 0.6546 0.4763 0.6298 0.4643 0.6424 0.7457 0.4204 0.6459 0.5849<br />
47. Khon Kaen 0.6673 0.5416 0.5052 0.4107 0.5430 0.7768 0.5677 0.6532 0.5832<br />
48. Krabi 0.6910 0.5046 0.6143 0.4012 0.6211 0.6817 0.5404 0.5819 0.5795<br />
49. Sukhothai 0.6538 0.4531 0.5854 0.3578 0.7187 0.6401 0.5584 0.6276 0.5743<br />
50. Phichit 0.6518 0.4595 0.6187 0.4143 0.6819 0.6198 0.5480 0.5824 0.5721<br />
51. Narathiwat 0.6085 0.4253 0.5040 0.5659 0.6619 0.7257 0.4846 0.5840 0.5700<br />
52. Phitsanulok 0.6401 0.5057 0.6269 0.4134 0.6795 0.6304 0.5363 0.5250 0.5697<br />
53. Pattani Nakon 0.6721 0.5321 0.5446 0.4479 0.6625 0.6983 0.4576 0.5280 0.5679<br />
54. Ratchasima 0.6100 0.4833 0.5283 0.4015 0.7276 0.6777 0.4818 0.6184 0.5661<br />
55. Kamphaeng<br />
Phet 0.6171 0.4278 0.4698 0.6092 0.6442 0.6693 0.4545 0.5648 0.5571<br />
56. Tak 0.5850 0.4815 0.5957 0.4814 0.5986 0.5879 0.4877 0.6324 0.5563<br />
57. Maha Salakam 0.5666 0.4856 0.6364 0.4438 0.4458 0.7280 0.4352 0.6952 0.5546<br />
58. Loei 0.6533 0.4913 0.5285 0.2433 0.6276 0.7167 0.4938 0.6757 0.5538<br />
59. Chaiyaphum 0.6063 0.4499 0.5117 0.4656 0.6023 0.6701 0.4237 0.6236 0.5441<br />
60. Nakhon Sawan 0.5642 0.4841 0.5721 0.3336 0.6180 0.6269 0.5728 0.5776 0.5437<br />
61. Phetchabun 0.6678 0.4254 0.5398 0.4673 0.5571 0.6390 0.4720 0.5758 0.5430<br />
62. Yasothon 0.6116 0.4650 0.5367 0.2305 0.5999 0.7746 0.4455 0.6800 0.5430<br />
63. Ubon<br />
Ratchathani 0.6159 0.4644 0.5500 0.4220 0.4452 0.7450 0.4478 0.6477 0.5423<br />
64. Roi Et 0.6579 0.3831 0.4836 0.4259 0.5739 0.7018 0.4171 0.6704 0.5392<br />
65. Kalasin 0.6035 0.4881 0.6204 0.2997 0.5141 0.7336 0.3695 0.6546 0.5354<br />
66. Surin 0.5929 0.4919 0.6311 0.3027 0.4958 0.7780 0.3208 0.6563 0.5337<br />
67. Mae Hong Son 0.6402 0.4276 0.6245 0.4903 0.4735 0.7338 0.2094 0.6558 0.5319<br />
68. Nong Khai 0.6934 0.4627 0.5740 0.2363 0.5271 0.7203 0.4350 0.5993 0.5310<br />
69. Mukdahan 0.5515 0.5423 0.5830 0.3962 0.4610 0.6951 0.4330 0.5736 0.5295<br />
70. Udon Thani 0.6545 0.4908 0.2677 0.3349 0.6264 0.7222 0.4791 0.6461 0.5277<br />
71. Sakhon Nakhon 0.6517 0.4700 0.4931 0.3925 0.4121 0.6691 0.4245 0.6434 0.5196<br />
72. Amnat Charoen 0.5718 0.4490 0.3812 0.3747 0.4069 0.7371 0.4272 0.6937 0.5052<br />
73. Nong Bua Lam<br />
Phu 0.7106 0.3966 0.3543 0.1502 0.6194 0.7615 0.355 0.6848 0.5040<br />
74. Buri Ram 0.5459 0.4122 0.5208 0.3305 0.4794 0.7402 0.3582 0.6028 0.4987<br />
75. Si Sa Ket 0.5731 0.4350 0.4703 0.3402 0.4438 0.7057 0.2815 0.6627 0.4890<br />
76. Nakhon Phanom 0.5060 0.4585 0.3776 0.2484 0.4286 0.6883 0.4355 0.6704 0.4767<br />
<strong>THAILAND</strong> <strong>HUMAN</strong> <strong>DEVELOPMENT</strong> <strong>REPORT</strong> <strong>2003</strong>
Map 9. Provincial Distribution of the Human Achievement Index (HAI)<br />
1. Bangkok<br />
2. Nakhon Pathom<br />
3. Nonthaburi<br />
4. Pathum Thani<br />
5. Samut Prakan<br />
6. Samut Sakhon<br />
7. Chai Nat<br />
8. Phra Nakhon Si Ayutthaya<br />
9. Lop Buri<br />
10. Saraburi<br />
11. Sing Buri<br />
12. Ang Thong<br />
13. Chanthaburi<br />
14. Chachoengsao<br />
15. Chon Buri<br />
16. Trat<br />
17. Nakhon Nayok<br />
18. Prachin Buri<br />
19. Rayong<br />
20. Sa Kaeo<br />
21. Ratchaburi<br />
22. Kanchanaburi<br />
23. Suphan Buri<br />
24. Samut Songkhram<br />
25. Phetchaburi<br />
26. Prachuap Khiri Khan<br />
27. Nakhon Ratchasima<br />
28. Buri Ram<br />
29. Surin<br />
30. Si Sa Ket<br />
31. Ubon Ratchathani<br />
32. Yasothon<br />
33. Chaiyaphum<br />
34. Amnat Charoen<br />
35. Nong Bua Lam Phu<br />
36. Khon Kaen<br />
37. Udon Thani<br />
38. Loei<br />
39. Nong Khai<br />
40. Maha Sarakham<br />
41. Roi Et<br />
42. Kalasin<br />
43. Sakon Nakhon<br />
44. Nakhon Phanom<br />
45. Mukdahan<br />
46. Chiang Mai<br />
47. Lamphun<br />
48. Lampang<br />
49. Uttaradit<br />
50. Phrae<br />
51. Nan<br />
52. Phayao<br />
53. Chiang Rai<br />
54. Mae Hong Son<br />
55. Nakhon Sawan<br />
56. Uthai Thani<br />
57. Kamphaeng Phet<br />
58. Tak<br />
59. Sukhothai<br />
60. Phitsanulok<br />
61. Phichit<br />
62. Phetchabun<br />
63. Nakhon Si Thammarat<br />
64. Krabi<br />
65. Phangnga<br />
66. Phuket<br />
67. Surat Thani<br />
68. Ranong<br />
69. Chumphon<br />
70. Songkhla<br />
71. Satun<br />
72. Trang<br />
73. Phatthalung<br />
74. Pattani<br />
75. Yala<br />
76. Narathiwat<br />
<strong>HUMAN</strong> <strong>DEVELOPMENT</strong> INDICES<br />
54<br />
65<br />
66<br />
68<br />
46<br />
58<br />
47<br />
69<br />
22<br />
67<br />
64<br />
48<br />
57<br />
56<br />
25<br />
59<br />
21<br />
72<br />
7 9<br />
12<br />
8<br />
17<br />
4<br />
2<br />
18<br />
3 1<br />
5<br />
14<br />
24 15<br />
6<br />
23 10<br />
26<br />
63<br />
53<br />
50<br />
71<br />
52<br />
55<br />
73<br />
61<br />
49<br />
60<br />
70<br />
51<br />
62<br />
74<br />
75<br />
19<br />
38<br />
76<br />
33<br />
27<br />
13<br />
35<br />
20<br />
16<br />
36<br />
37<br />
28<br />
40<br />
39<br />
43<br />
42<br />
41<br />
29<br />
32<br />
30<br />
44<br />
45<br />
34<br />
31<br />
Human Achievement Index<br />
0.476 to 0.524 (6)<br />
0.524 to 0.572 (20)<br />
0.572 to 0.62 (20)<br />
0.62 to 0.668 (24)<br />
0.668 to 0.718 (6)<br />
109
110<br />
Health Education Employment Income<br />
Table 11. Provincial Ranking by HAI Indices<br />
Housing Family and Transportation<br />
and living community and Participation HAI<br />
conditions life communication<br />
1. Chachoengsao Chon Buri Samut Sakon Bangkok Nonthaburi Surin Bangkok Nan Phuket<br />
Metropolis Metropolis<br />
2. Samut Sakon Lamphun Pathum Thani Phuket Nakhon Pathom Khon Kaen Phuket Lamphun Nonthaburi<br />
3. Bangkok Phuket Samut Prakan Phangnga Songkhla Yasothon Chon Buri Phayao Chon Buri<br />
Metropolis<br />
4. Samut Prakan Nakhon Chon Buri Nonthaburi Chumphon Nong Bua Nonthaburi Lampang Nakhon<br />
Pathom Lam Phu Pathom<br />
5. Songkhla Lampang Phuket Phra Nakhon Satun Sa Kaeo Rayong Trat Songkhla<br />
Si Ayutthaya<br />
6. Uttaradit Chiang Mai Saraburi Chon Buri Chon Buri Ubon Songkhla Phrae Bangkok<br />
Ratchathani Metropolis<br />
7. Chon Buri Phra Nakhon Rayong Samut Suphan Buri Buri Ram Lamphun Sing Buri Rayong<br />
Si Ayutthaya Songkhram<br />
8. Nonthaburi Nonthaburi Phra Nakhon Pathum Thani Phra Nakhon Amnat Pathum Maha Salakam Lamphun<br />
Si Ayutthaya Si Ayutthaya Charoen Thani<br />
9. Samut Sing Buri Bangkok Rayong Rayong Mae Hong Son Ratchaburi Phangnga Samut<br />
Songkhram Metropolis Songkhram<br />
10. Ratchaburi Ang Thong Nakhon Nakhon Chachoengsao Kalasin Chanthaburi Amnat Pathum<br />
Pathom Pathom Charoen Thani<br />
11. Phetchaburi Pathum Thani Chachoengsao Samut Prakan Trang Yala Sing Buri Uthai Thani Ang Thong<br />
12. Prachin Buri Yala Surat Thani Ratchaburi Trat Maha Salakam Nakhon Nakhon Phra Nakhon<br />
Pathom Pathom Si Ayutthaya<br />
13. Lop Buri Lop Buri Uthai Thani Sing Buri Phattalung Narathiwat Phrae Nong Bua Phetchaburi<br />
Lam Phu<br />
14. Sing Buri Nan Chumphon Chai Nat Phuket Udon Thani Saraburi Uttaradit Saraburi<br />
15. Chumphon Phrae Chanthaburi Ang Thong Phetchaburi Nong Khai Lampang Chiang Mai Yala<br />
16. Nakhon Pathom Rayong Songkhla Yala Ang Thong Loei Chiang Mai Yasothon Sing Buri<br />
17. Satun Phetchaburi Phetchaburi Kamphaeng Bangkok Ranong Prachuap Phra Nakhon Chachoengsao<br />
Phet Metropolis Khiri Khan Si Ayutthaya<br />
18. Surat Thani Chachoengsao Trat Saraburi Samut Si Sa Ket Surat Thani Loei Samut Prakan<br />
Songkhram<br />
19. Saraburi Saraburi Nonthaburi Prachin Buri Ratchaburi Roi Et Samut Sakon Chiang Rai Chanthaburi<br />
20. Nong Bua Mukdahan Samut Songkhla Nakhon Si Phangnga Ang Thong Prachin Buri Prachin Buri<br />
Lam Phu Songkhram Thammarat<br />
21. Kanchanaburi Bangkok Suphan Buri Suphan Buri Pathum Thani Pattani Chai Nat Roi Et Chumphon<br />
Metropolis<br />
22. Nakhon Nayok Khon Kaen Lamphun Lamphun Yala Rayong Phetchaburi Nakhon Trat<br />
Phanom<br />
23. Uthai Thani Samut Prakan Prachin Buri Surat Thani Lop Buri Phayao Phayao Samut Surat Thani<br />
Songkhram<br />
24. Chiang Rai Chanthaburi Maha Salakam Prachuap Samut Prakan Mukdahan Phra Nakhon Si Sa Ket Suphan Buri<br />
Khiri Khan Si Ayutthaya<br />
25. Pathum Thani Pattani Prachuap Chumphon Chanthaburi Songkhla Trang Chanthaburi Prachuap<br />
Khiri Khan Khiri Khan<br />
26. Chai Nat Phayao Surin Chachoengsao Nakhon Nayok Nakhon Samut Surin Lampang<br />
Phanom Songkhram<br />
27. Trang Phattalung Nan Satun Prachin Buri Krabi Samut Prakan Mae Hong Son Samut Sakon<br />
28. Nong Khai Trat Sa Kaeo Narathiwat Kanchanaburi Nakhon Si Chumphon Kalasin Trang<br />
Thammarat<br />
29. Krabi Prachuap Phitsanulok Samut Sakon Saraburi Phattalung Trat Khon Kaen Ratchaburi<br />
Khiri Khan<br />
30. Yala Samut Trang Nakhon Nayok Chai Nat Nan Chachoengsao Ubon Satun<br />
Songkhram Ratchathani<br />
31. Ang Thong Uthai Thani Sing Buri Uthai Thani Surat Thani Nakon Satun Udon Thani Phrae<br />
Ratchasima<br />
32. Prachuap Satun Mae Hong Son Phetchaburi Prachuap Chaiyaphum Yala Sa Kaeo Uttaradit<br />
Khiri Khan Khiri Khan<br />
33. Nakhon Si Nakhon Phayao Ranong Uttaradit Kamphaeng Nakhon Sakhon Nakhon<br />
Thammarat Nayok Phet Sawan Nakhon Nayok<br />
34. Suphan Buri Songkhla Kalasin Trang Nakon Sakhon Nakhon Phetchaburi Phayao<br />
Ratchasima Nakhon Nayok<br />
35. Phattalung Trang Phichit Lop Buri Sukhothai Phuket Ranong Songkhla Uthai Thani<br />
36. Pattani Ranong Lampang Chiang Mai Phangnga Ang Thong Khon Kaen Tak Lop Buri<br />
37. Phetchabun Phitsanulok Yala Phrae Lamphun Satun Uttaradit Sukhothai Phattalung<br />
38. Khon Kaen Krabi Krabi Phattalung Phayao Surat Thani Lop Buri Saraburi Phangnga<br />
39. Chanthaburi Chiang Rai Ranong Nakhon Si Nan Nonthaburi Kanchanaburi Chaiyaphum Ranong<br />
Thammarat<br />
<strong>THAILAND</strong> <strong>HUMAN</strong> <strong>DEVELOPMENT</strong> <strong>REPORT</strong> <strong>2003</strong>
Health Education Employment Income<br />
<strong>HUMAN</strong> <strong>DEVELOPMENT</strong> INDICES<br />
Table 11 (continued)<br />
Housing Family and Transportation<br />
and living community and Participation HAI<br />
conditions life communication<br />
40. Phangnga Chumphon Ang Thong Chiang Rai Phichit Chanthaburi Chiang Rai Ang Thong Chai Nat<br />
41. Roi Et Phangnga Tak Mae Hong Son Phrae Uthai Thani Phattalung Nakon Chiang Mai<br />
Ratchasima<br />
42. Sa Kaeo Samut Sakon Sukhothai Tak Sing Buri Lampang Sukhothai Chai Nat Nan<br />
43. Udon Thani Surin Chiang Rai Kanchanaburi Phitsanulok Trat Nakhon Si Phuket Nakhon Si<br />
Thammarat Thammarat<br />
44. Sukhothai Loei Mukdahan Chanthaburi Ranong Uttaradit Uthai Thani Suphan Buri Chiang Rai<br />
45. Loei Udon Thani Uttaradit Uttaradit Pattani Lamphun Phichit Buri Ram Kanchanaburi<br />
46. Phichit Nakhon Si Nakhon Nayok Phetchabun Narathiwat Prachuap Suphan Buri Satun Sa Kaeo<br />
Thammarat Khiri Khan<br />
47. Sakhon Kalasin Nong Khai Chaiyaphum Kamphaeng Sukhothai Krabi Prachuap Khon Kaen<br />
Nakhon Phet Khiri Khan<br />
48. Chiang Mai Prachin Buri Nakhon Sawan Sa Kaeo Sa Kaeo Phetchabun Prachin Buri Kanchanaburi Krabi<br />
49. Ranong Ratchaburi Chiang Mai Lampang Lampang Nakhon Nayok Phitsanulok Nonthaburi Sukhothai<br />
50. Mae Hong Son Surat Thani Ratchaburi Trat Loei Phrae Phangnga Lop Buri Phichit<br />
51. Phitsanulok Maha Salakam Ubon Pattani Udon Thani Phitsanulok Loei Nong Khai Narathiwat<br />
Ratchathani<br />
52. Lampang Uttaradit Kanchanaburi Maha Salakam Krabi Phetchaburi Nan Phattalung Phitsanulok<br />
53. Phrae Nakhon Sawan Pattani Roi Et Nong Bua Suphan Buri Tak Chachoengsao Pattani<br />
Lam Phu<br />
54. Phra Nakhon Nakon Phrae Ubon Nakhon Nakhon Narathiwat Yala Nakon<br />
Si Ayutthaya Ratchasima Ratchathani Sawan Sawan Ratchasima<br />
55. Phuket Tak Phetchabun Phayao Samut Sakon Samut Nakon Ratchaburi Kamphaeng<br />
Songkhram Ratchasima Phet<br />
56. Trat Suphan Buri Yasothon Phichit Chaiyaphum Prachin Buri Udon Thani Narathiwat Tak<br />
57. Lamphun Sa Kaeo Loei Phitsanulok Yasothon Phichit Phetchabun Rayong Maha<br />
Salakam<br />
58. Kamphaeng Kanchanaburi Nakon Khon Kaen Tak Samut Pattani Phichit Loei<br />
Phet Ratchasima Prakan<br />
59. Ubon Sakhon Lop Buri Nan Chiang Rai Chiang Rai Kamphaeng Krabi Chaiyaphum<br />
Ratchathani Nakhon Phet<br />
60. Yasothon Yasothon Buri Ram Nakon Roi Et Chumphon Ubon Nakhon Nakhon<br />
Ratchasima Ratchathani Sawan Sawan<br />
61. Nakon Ubon Chaiyaphum Krabi Uthai Thani Trang Yasothon Phetchabun Yasothon<br />
Ratchasima Ratchathani<br />
62. Narathiwat Nong Khai Khon Kaen Mukdahan Chiang Mai Saraburi Nakhon Mukdahan Phetchabun<br />
Phanom<br />
63. Chaiyaphum Phichit Narathiwat Sakhon Phetchabun Kanchanaburi Maha Ranong Ubon<br />
Nakhon Salakam Ratchathani<br />
64. Kalasin Nakhon Nakhon Si Amnat Khon Kaen Pathum Nong Khai Nakhon Roi Et<br />
Phanom Thammarat Charoen Thani Nayok<br />
65. Surin Chai Nat Sakhon Sukhothai Nong Khai Chai Nat Mukdahan Kamphaeng Kalasin<br />
Nakhon Phet<br />
66. Tak Sukhothai Roi Et Si Sa Ket Kalasin Tak Amnat Surat Thani Surin<br />
Charoen<br />
67. Si Sa Ket Chaiyaphum Chai Nat Udon Thani Surin Chiang Mai Sakhon Trang Mae<br />
Nakhon Hong Son<br />
68. Amnat Amnat Si Sa Ket Nakhon Buri Ram Bangkok Chaiyaphum Chon Buri Nong Khai<br />
Charoen Charoen Sawan Metropolis<br />
69. Phayao Si Sa Ket Kamphaeng Buri Ram Mae Hong Samut Sa Kaeo Nakhon Si Mukdahan<br />
Phet Son Sakon Thammarat<br />
70. Maha Kamphaeng Satun Surin Mukdahan Lop Buri Roi Et Chumphon Udon Thani<br />
Salakam Phet<br />
71. Nakhon Mae Hong Phattalung Kalasin Maha Nakhon Kalasin Pattani Sakhon<br />
Sawan Son Salakam Pathom Nakhon<br />
72. Rayong Phetchabun Amnat Nakhon Ubon Chon Buri Buri Ram Phitsanulok Amnat<br />
Charoen Phanom Ratchathani Charoen<br />
73. Mukdahan Narathiwat Nakhon Loei Si Sa Ket Chachoengsao Nong Bua Pathum Nong Bua<br />
Phanom Lam Phu Thani Lam Phu<br />
74. Buri Ram Buri Ram Nong Bua Nong Khai Nakhon Sing Buri Surin Samut Buri Ram<br />
Lam Phu Phanom Sakon<br />
75. Nan Nong Bua Phangnga Yasothon Sakhon Ratchaburi Si Sa Ket Samut Si Sa Ket<br />
Lam Phu Nakhon Prakan<br />
76. Nakhon Roi Et Udon Thani Nong Bua Amnat Phra Nakhon Mae Hong Bangkok Nakhon<br />
Phanom Lam Phu Charoen Si Ayutthaya Son Metropolis Phanom<br />
111
112<br />
<strong>HUMAN</strong> <strong>DEVELOPMENT</strong><br />
INDEX (HDI)<br />
While HAI is locally developed for assessing<br />
progress in human development in<br />
Thailand, HDI is UNDP’s key human development<br />
index and has been used and<br />
recognized worldwide to compare human<br />
development progress among countries<br />
since 1990. It has also been used at subnational<br />
level in many countries. In the<br />
following section, this Report will attempt<br />
to use HDI to capture human development<br />
situations at the provincial level in<br />
Thailand.<br />
HDI is based on three indicators: (i) length<br />
of life, as measured by life expectancy<br />
at birth, (ii) educational attainment, as<br />
measured by the adult literacy rate 47 and<br />
the combined gross primary, secondary<br />
and tertiary enrolment ratio; 48 and (iii)<br />
standard of living, as measured by GDP<br />
per capita (US$ PPP). 49<br />
Table 12 presents HDI scores and ranks by<br />
province. Rayong – the center of the<br />
Eastern Seaboard has the highest HDI<br />
score. Rayong’s GPP per capita almost<br />
doubles that of Chon Buri. Phuket falls<br />
slightly from 1 st rank on HAI to 5 th place<br />
on the HDI. Similar pattern is noted<br />
for several industrial cities, e.g., Nakorn<br />
Pathom, Songkhla, Samut Songkhram,<br />
Lamphun, Ang Thong, and some tourist<br />
cities, e.g., Phetchaburi, Nakorn Nayok,<br />
Chiang Mai, Chiang Rai, and Phuket. One<br />
possible explanation is that the use of<br />
47 Adult literacy rate for population aged 14 to<br />
50 from BMN data in 2000. BMN data covers<br />
only rural areas. Bangkok Metropolis literacy<br />
rate data is therefore not available. In this<br />
calculation, Bangkok vicinity literacy rate is<br />
used as proxy for Bangkok Metropolis literacy<br />
rate.<br />
48 In this calculation, tertiary enrolment is<br />
dropped as most students enrol in universities/colleges<br />
in large cities, and some<br />
provinces do not have any tertiary institution.<br />
49 This calculation uses gross provincial product<br />
(GPP) per capita and does not convert it<br />
to US$PPP as it is for the purpose of intracountry,<br />
not inter-country comparison.<br />
GPP, which records income from business<br />
establishments by their place of registration,<br />
not their physical location, could produce<br />
such result in cases that a number<br />
of the larger factories and hotels have<br />
their headquarters or business units registered<br />
in Bangkok. There are, however,<br />
several other factors at work that account<br />
for the gaps between HAI and HDI that<br />
cannot be categorically explained.<br />
On the contrary, some provinces perform<br />
considerably better on HDI than HAI.<br />
Three southern most provinces, for example,<br />
constitute a case of large discrepancy.<br />
When comparing HAI with HDI, Satun<br />
moves from 30 th to 14 th place, Narathiwat<br />
from 51 st to 25 th , and Pattani from 53 rd to<br />
19 th . No single explanation can account<br />
for this. The difference is a result of a<br />
combination of factors, largely due to the<br />
use of different indices and indicators.<br />
This highlights the fact that decisions<br />
regarding the structure of composite<br />
index, the selection of relevant indices<br />
and indicators are most crucial; they<br />
should mirror both the subjective norms<br />
and objective standards of human development<br />
of the society.<br />
GENDER-RELATED<br />
<strong>DEVELOPMENT</strong> INDEX (GDI)<br />
GDI measures progress in human development<br />
using the same variables as the<br />
HDI, but takes account of inequality in<br />
achievement between women and men.<br />
In this Report, GDI is based on the available<br />
gender disaggregated data, namely<br />
life expectancy, combined primary, secondary<br />
enrolment ratio, 50 and GPP per<br />
capita.<br />
GDI represents the HDI adjusted for<br />
gender inequality. GDI gives some indication<br />
of how basic human capabilities are<br />
distributed between women and men. If<br />
GDI equals HDI, it means that there is no<br />
gender bias between women and men.<br />
The greater the gender disparity in<br />
human development, the lower the GDI is<br />
50 No gender disaggregated data for adult<br />
literacy rate.<br />
<strong>THAILAND</strong> <strong>HUMAN</strong> <strong>DEVELOPMENT</strong> <strong>REPORT</strong> <strong>2003</strong>
Table 12. HAI, HDI and GDI by Province<br />
HDI rank<br />
HAI rank HAI score HDI rank HDI score GDI rank GDI score Minus GDI rank<br />
1. Phuket 0.7175 5 0.8027 3 0.7616 2<br />
2. Nonthaburi 0.7060 7 0.7992 6 0.7282 1<br />
3. Chon Buri 0.7006 4 0.8113 2 0.7715 2<br />
4. Nakhon Pathom 0.6804 18 0.7337 22 0.6651 -4<br />
5. Songkhla 0.6788 15 0.7454 10 0.7017 5<br />
6. Rayong 0.6678 1 0.8198 4 0.7587 -3<br />
7. Bangkok Metropolis 0.6731 8 0.7964 12 0.6962 -4<br />
8. Samut Songkhram 0.6635 57 0.6605 58 0.5578 -1<br />
9. Lamphun 0.6638 68 0.6411 75 0.5021 -7<br />
10. Pathum Thani 0.6634 3 0.8130 1 0.7723 2<br />
11. Ang Thong 0.6540 28 0.7118 31 0.6410 -3<br />
12. Phra Nakhon Si Ayutthaya 0.6536 13 0.7480 19 0.6721 -6<br />
13. Phetchaburi 0.6518 33 0.7025 35 0.6290 -2<br />
14. Saraburi 0.6508 9 0.7825 8 0.7187 1<br />
15. Yala 0.6485 22 0.7234 14 0.6912 8<br />
16. Sing Buri 0.6437 48 0.6794 39 0.6023 9<br />
17. Chachoengsao 0.6431 10 0.7643 13 0.6945 -3<br />
18. Samut Prakan 0.6416 2 0.8165 5 0.7578 -3<br />
19. Chanthaburi 0.6359 26 0.7171 21 0.6694 5<br />
20. Prachin Buri 0.6330 30 0.7109 36 0.6102 -6<br />
21. Chumphon 0.6330 11 0.7536 9 0.7130 2<br />
22. Trat 0.6313 17 0.7392 20 0.6704 -3<br />
23. Surat Thani 0.6293 20 0.7259 33 0.6401 -13<br />
24. Suphan Buri 0.6292 35 0.6959 38 0.6057 -3<br />
25. Prachuap Khiri Khan 0.6275 16 0.7447 17 0.6738 -1<br />
26. Lampang 0.6252 39 0.6927 29 0.6415 10<br />
27. Samut Sakon 0.6242 6 0.8020 7 0.7263 -1<br />
28. Trang 0.6228 24 0.7201 26 0.6561 -2<br />
29. Ratchaburi 0.6216 29 0.7112 34 0.6368 -5<br />
30. Satun 0.6202 14 0.7476 23 0.6646 -9<br />
31. Phrae 0.6180 69 0.6384 53 0.5675 16<br />
32. Uttaradit 0.6153 40 0.6921 43 0.5970 -3<br />
33. Nakhon Nayok 0.6135 51 0.6747 48 0.5873 3<br />
34. Uthai Thani 0.6131 42 0.6870 42 0.5989 0<br />
35. Phayao 0.6134 75 0.6160 61 0.5528 14<br />
36. Lop Buri 0.6083 27 0.7123 30 0.6410 -3<br />
37. Phattalung 0.6061 46 0.6808 52 0.5698 -6<br />
38. Phangnga 0.6055 43 0.6865 74 0.5040 -31<br />
39. Ranong 0.6041 32 0.7052 76 0.4823 -44<br />
40. Chai Nat 0.6035 37 0.6950 49 0.5835 -12<br />
41. Chiang Mai 0.6015 55 0.6628 32 0.6403 23<br />
42. Nan 0.5974 50 0.6749 28 0.6493 22<br />
43. Nakhon Si Thammarat 0.5946 23 0.7204 37 0.6076 -14<br />
44. Chiang Rai 0.5911 76 0.6070 51 0.5700 25<br />
45. Kanchanaburi 0.5907 21 0.7250 27 0.6542 -6<br />
46. Sa Kaeo 0.5849 31 0.7097 25 0.6572 6<br />
47. Khon Kaen 0.5832 38 0.6928 41 0.5994 -3<br />
48. Krabi 0.5795 12 0.7519 15 0.6842 -3<br />
49. Sukhothai 0.5743 56 0.6613 56 0.5607 0<br />
50. Phichit 0.5721 62 0.6525 66 0.5417 -4<br />
51. Narathiwat 0.5700 25 0.7197 11 0.6966 14<br />
52. Phitsanulok 0.5697 44 0.6864 40 0.6007 4<br />
53. Pattani 0.5679 19 0.7273 24 0.6617 -5<br />
54. Nakon Ratchasima 0.5661 47 0.6803 54 0.5672 -7<br />
55. Kamphaeng Phet 0.5571 36 0.6951 44 0.5957 -8<br />
<strong>HUMAN</strong> <strong>DEVELOPMENT</strong> INDICES<br />
(Continued on next page)<br />
113
114<br />
Table 12 (continued)<br />
HDI rank<br />
HAI rank HAI score HDI rank HDI score GDI rank GDI score Minus GDI rank<br />
56. Tak 0.5563 34 0.6966 16 0.6790 18<br />
57. Maha Salakam 0.5546 63 0.6503 64 0.5461 -1<br />
58. Loei 0.5538 45 0.6840 45 0.5933 0<br />
59. Chaiyaphum 0.5441 49 0.6766 57 0.5581 -8<br />
60. Nakhon Sawan 0.5437 41 0.6887 46 0.5913 -5<br />
61. Phetchabun 0.5430 53 0.6725 50 0.5809 3<br />
62. Yasothon 0.5430 72 0.6348 72 0.5177 0<br />
63. Ubon Ratchathani 0.5423 61 0.6547 62 0.5527 -1<br />
64. Roi Et 0.5392 67 0.6431 69 0.5292 -2<br />
65. Kalasin 0.5354 64 0.6476 59 0.5561 5<br />
66. Surin 0.5337 59 0.6551 60 0.5539 -1<br />
67. Mae Hong Son 0.5319 66 0.6433 18 0.6729 48<br />
68. Nong Khai 0.5310 60 0.6547 67 0.5370 -7<br />
69. Mukdahan 0.5295 52 0.6742 47 0.5907 5<br />
70. Udon Thani 0.5277 54 0.6642 55 0.5622 -1<br />
71. Sakhon Nakhon 0.5196 71 0.6355 70 0.5221 1<br />
72. Amnat Charoen 0.5052 70 0.6384 68 0.5342 2<br />
73. Nong Bua Lam Phu 0.5040 74 0.6329 73 0.5145 1<br />
74. Buri Ram 0.4987 58 0.6591 63 0.5499 -5<br />
75. Si Sa Ket 0.4890 65 0.6475 65 0.5449 0<br />
76. Nakhon Phanom 0.4767 73 0.6332 71 0.5204 2<br />
relative to HDI. A positive figure in the<br />
HDI rank-minus-GDI rank column in Table<br />
11 signals a relatively equitable process of<br />
capacity building between men and<br />
women in the province.<br />
Table 12 shows that with the exception of<br />
Mae Hong Son where women fare better<br />
than men (GDI higher than HDI), gender<br />
disparity is still prevalent in every part<br />
of the country. It is, however, much<br />
less pronounced in northern provinces. A<br />
few southern provinces deserve special<br />
attention, e.g., Phangnga and Ranong.<br />
Songkhla, Yala and Narathiwat, noticably<br />
contradict the generalization of Muslimdominated<br />
provinces having a propensity<br />
for gender inequality.<br />
It should, however, be noted that the<br />
income component in the GDI takes into<br />
account the income difference between<br />
men and women who are engaged in<br />
income-generating activities, and does not<br />
include those who do not have income.<br />
A province where women work for less<br />
income than men could therefore have a<br />
lower GDI score than another province<br />
where women do not work at all.<br />
A REGIONAL OVERVIEW:<br />
HAI, HDI, GDI<br />
A brief regional analysis of HAI, HDI and<br />
GDI can enrich our provincial analysis and<br />
offer another perspective on disparity in<br />
Thailand.<br />
By and large, the regional ranking presents<br />
no big surprise. Table 13 shows that<br />
Bangkok Metropolis leads other regions in<br />
overall human achievement. It is the leader<br />
in four aspects – health, income, housing<br />
and living conditions, transportation and<br />
communication. Bangkok vicinity takes<br />
the lead in education and employment.<br />
The Northeast finds itself in extreme<br />
situations – being at the bottom in five<br />
areas, but on the top on family and community<br />
life, and participation.<br />
Common perception of the South belies<br />
its situation. Southerners are not generally<br />
thought of being poor or deprived,<br />
and the region ranks respectably in health<br />
and income. Yet, the South is the second<br />
worst-off in education and employment.<br />
<strong>THAILAND</strong> <strong>HUMAN</strong> <strong>DEVELOPMENT</strong> <strong>REPORT</strong> <strong>2003</strong>
The North also deserves special attention<br />
as it comes second to last in health,<br />
income, housing and living conditions,<br />
transportation and communication.<br />
The Central, Plain, the East and the West<br />
are in a relatively good situation in most<br />
aspects, but they all have difficulty maintaining<br />
a good family and community life<br />
and active public participation.<br />
Table 14 presents a comparison of HAI,<br />
HDI, and GDI by region. The three regional<br />
rankings are generally aligned or<br />
staying very close, with an exception of<br />
Bangkok Metropolis that exhibits a higher<br />
degree of gender disparity.<br />
Table 13. HAI Indices and the Composite Index by region<br />
Location<br />
Health<br />
Index<br />
Education<br />
Index<br />
Employment<br />
Index<br />
Income<br />
Index<br />
Housing<br />
and living<br />
conditions<br />
Index<br />
Family<br />
and<br />
commu-<br />
nity<br />
life Index<br />
Transportationandcommunication<br />
Index<br />
Participation<br />
Index<br />
Composite<br />
Index<br />
1 2 3 4 5 6 7 8<br />
Kingdom 0.6889 0.5075 0.5885 0.5100 0.7040 0.6573 0.5984 0.6758 0.6163<br />
Bangkok Metropolis 0.7884 0.5418 0.6744 0.8074 0.8191 0.5816 0.8765 0.2959 0.6731<br />
Bangkok vicinity 0.7369 0.5618 0.7496 0.6725 0.8094 0.6015 0.6613 0.5084 0.6627<br />
Eastern region 0.7058 0.5484 0.6874 0.5817 0.8032 0.6222 0.5865 0.6076 0.6429<br />
Central region 0.7110 0.5612 0.6032 0.6200 0.7769 0.5678 0.6056 0.6356 0.6352<br />
Western region 0.7042 0.5035 0.6052 0.5798 0.8021 0.5954 0.6022 0.6147 0.6259<br />
Southern region 0.6743 0.5094 0.5736 0.5452 0.7822 0.6765 0.5992 0.5821 0.6178<br />
Northern region 0.6563 0.5095 0.5832 0.4610 0.6296 0.6345 0.5680 0.6525 0.5868<br />
Northeastern region 0.6234 0.4654 0.5074 0.3542 0.5422 0.7209 0.4392 0.6502 0.5379<br />
Region<br />
Table 14. Comparison of HAI, HDI, GDI by region<br />
HAI HAI HDI HDI GDI GDI<br />
rank score rank score rank score<br />
Kingdom 0.6163 0.7263 0.6378<br />
Bangkok Metropolis 1 0.6731 2 0.7964 3 0.6962<br />
Bangkok vicinity 2 0.6627 1 0.8094 1 0.7473<br />
Eastern region 3 0.6429 3 0.7803 2 0.7226<br />
Central region 4 0.6352 4 0.7354 4 0.6593<br />
Western region 5 0.6259 6 0.7111 6 0.6323<br />
Southern region 6 0.6178 5 0.7257 5 0.6373<br />
Northern region 7 0.5868 7 0.6624 7 0.5943<br />
Northeastern region 8 0.5379 8 0.6613 8 0.5554<br />
<strong>HUMAN</strong> <strong>DEVELOPMENT</strong> INDICES<br />
CONCLUSION<br />
Measuring human development is a<br />
daunting task. New indices are often<br />
a target of criticism and disagreement<br />
among academics, policy makers and development<br />
practitioners. Yet, many organizations,<br />
UNDP included, are committed to<br />
find a new and better way to measure<br />
human development. This is because in<br />
most cases, in spite of their imperfection,<br />
the value of human development indices<br />
outweighs their shortcomings.<br />
In the case of HAI, HDI and GDI, their<br />
value lies first and foremost in their<br />
potential to gain the attention and get<br />
115
116<br />
the policy makers and the people to<br />
think, discuss and debate “human development”<br />
in concrete and meaningful<br />
terms. The regional and provincial data<br />
that supports the 40 indicators, 8 HAI<br />
indices and the composite index can<br />
serve as an important basis for public<br />
awareness, problem identification, and<br />
policy decisions at national and local<br />
levels.<br />
It is hoped that the provincial and regional<br />
HAI, HDI and GDI presented in this Report<br />
has constituted a good start for an ongoing<br />
process in which the indices and the<br />
composite index will be improved both<br />
with better data and better methodologies.<br />
This process will provide an enabling environment<br />
and valuable support to policy<br />
makers and the public in their pursuit of<br />
human development in the years to come.<br />
<strong>THAILAND</strong> <strong>HUMAN</strong> <strong>DEVELOPMENT</strong> <strong>REPORT</strong> <strong>2003</strong>
STATISTICAL ANNEX<br />
117
118<br />
<strong>THAILAND</strong> <strong>HUMAN</strong> <strong>DEVELOPMENT</strong> <strong>REPORT</strong> <strong>2003</strong>
TECHNICAL NOTES ON HDI AND GDI<br />
<strong>HUMAN</strong> <strong>DEVELOPMENT</strong><br />
INDEX (HDI)<br />
HDI is based on three indices: longevity;<br />
as measured by life expectancy at birth;<br />
education attainment, as measured by a<br />
combination of the adult literacy rate<br />
(two-thirds weight) and combined gross<br />
primary, lower secondary and upper secondary<br />
enrolment ratio (one-third weight);<br />
and standard of living; as measured by<br />
Gross Domestic Product (GDP) per capita,<br />
expressed in US$ PPP.<br />
The calculation of provincial<br />
and regional HDI follows the<br />
methodology of global HDI with<br />
the following adjustments:<br />
Tertiary enrolment is not used, as<br />
most students enrol in universities/<br />
colleges in large cities, and some<br />
provinces do not have tertiary institution.<br />
This calculation uses gross regional/<br />
provincial product (GPP) per capita<br />
instead of purchasing power parity in<br />
US$.<br />
Computing the individual HDI indices is<br />
based on the following formula:<br />
Index = (Actual value – Minimum value)/<br />
(Maximum value – Minimum value)<br />
Fixed minimum and maximum values<br />
(goal post):<br />
Life expectancy at birth: 25 years and<br />
85 years.<br />
TECHNICAL NOTES ON HDI AND GDI<br />
Adult literacy rate (aged 14 to 50):<br />
0 per cent and 100 per cent<br />
Combined gross enrolment ratio:<br />
0 per cent and 100 per cent<br />
GPP or GRP per capita: $100 and<br />
$40,000<br />
Data and Calculation<br />
Life expectancy at birth: 1996 data.<br />
Adult literacy rate: Data for adult<br />
literacy rate for population aged 14<br />
to 50 is from Basic Minimum Needs<br />
data in 2000. BMN data covers only<br />
rural areas which is used as proxy for<br />
the entire province. BMN does not<br />
include the Bangkok Metropolis,<br />
hence, the Bangkok vicinity data is<br />
used as proxy for Bangkok Metropolis<br />
literacy rate.<br />
Combined gross enrolment: Combined<br />
gross enrolment of primary,<br />
lower secondary education and upper<br />
secondary education in 1999.<br />
Income:<br />
Human development requires a<br />
certain level of income. Beyond this<br />
level, additional income does not<br />
translate into human development.<br />
To reflect this, income is discounted<br />
by the following formula:<br />
W(y) = (log y – log ymin)/<br />
(log ymax – log ymin)<br />
HDI = (life expectancy index +<br />
education attainment index<br />
+ income index)/3<br />
119
120<br />
GENDER-RELATED<br />
<strong>DEVELOPMENT</strong> INDEX (GDI)<br />
The calculation of provincial<br />
and regional GDI follows the<br />
methodology of global GDI, with<br />
the same adjustments made for<br />
HDI for Thailand.<br />
Computing GDI individual indices is<br />
based on the following formula:<br />
Index = (Actual value – Minimum value)/<br />
(Maximum value – Minimum value)<br />
Fixed minimum and maximum values<br />
(goal post):<br />
Life expectancy at birth: Women<br />
generally live longer than men. For<br />
women the maximum value is 87.5<br />
years and the minimum value is 27.5<br />
years. For men the maximum value<br />
is 82.5 years and the minimum value<br />
is 22.5 years<br />
Adult literacy rate: There is no gender<br />
disaggregated data. Therefore, this<br />
indicator is excluded from the calculation.<br />
Combined gross enrolment ratio:<br />
0 per cent and 100 per cent<br />
GPP per capita: $100 and $40,000<br />
Data and Calculation<br />
Life expectancy at birth: 1996 data.<br />
Combined gross enrolment: Combined<br />
gross enrolment of primary,<br />
lower secondary education and upper<br />
secondary education in 1999.<br />
Income:<br />
Values of per capita GPP for women<br />
and men are calculated from the<br />
female share (sf) and male share (sm)<br />
of earned income. These shares are<br />
estimated from the ratio of the<br />
female total real income (wf ) to the<br />
male total real income (wm) and the<br />
percentage of women (eaf ) and men<br />
(eam) in the economically active<br />
population.<br />
In this calculation, income shares of<br />
women and men is an average of<br />
real total income (wage, salary, overtime,<br />
bonus, profit, etc.) observed<br />
from the labour force survey 1992 to<br />
1998.<br />
Income ratio of women/men is 77<br />
per cent (see income sheet).<br />
Percentage share of women and men<br />
in the economically active population<br />
(total labour force) are 45 per cent<br />
and 54.99 per cent, respectively.<br />
Female share of total income (sf) is<br />
0.39.<br />
Therefore, the GPP per capita for<br />
women is equal to Sf x GPP per capita.<br />
And GPP per capita for men is equal<br />
to GPP per capita – women GPP per<br />
capita.<br />
High-levels of income is discounted<br />
by using the following formula:<br />
W(y) = (log y – log ymin)/<br />
(log ymax – log ymin)<br />
Equally distributed life expectancy<br />
index:<br />
{[female population share x<br />
(female life expectancy index) -1 ] +<br />
[male population share x<br />
(male life expectancy index) -1 ]} -1<br />
Equally distributed educational<br />
attainment index:<br />
{[female population share x<br />
(female educational attainment<br />
index) -1 ] + [male population share<br />
x (male educational attainment<br />
index) -1 ]} -1<br />
Equally distributed income index:<br />
Percentage share of the economically<br />
active population.<br />
Female (eaf ) 45.0 per cent<br />
Male (eam) 54.99 per cent<br />
<strong>THAILAND</strong> <strong>HUMAN</strong> <strong>DEVELOPMENT</strong> <strong>REPORT</strong> <strong>2003</strong>
Ratio of female total real income to<br />
male total real income (Wf/Wm) =<br />
0.77<br />
Female share of total income (sf ) =<br />
(0.77 x 0.45)/[(0.77 x 0.45) + 0.5499]<br />
= 0.39<br />
Female total GPP per capita =<br />
0.39 x GPP per capita<br />
Male total GPP per capita =<br />
1 – Female total GPP per capita<br />
W(yf ) = [log (yf ) – log (100)]/[log<br />
TECHNICAL NOTES ON HDI AND GDI<br />
(40,000) – log (100)]<br />
W(ym) = [log (ym) – log (100)]/[log<br />
(40,000) – log (100)]<br />
Equally distributed income index =<br />
({female population share x [W(yf )] -1 }<br />
+ {male population share x<br />
[W(ym)] -1 }) -1<br />
GDI = (equally distributed life<br />
expectancy + equally distributed<br />
educational attainment + equally<br />
distributed income)/3<br />
121
122<br />
TABLE 1 – BASIC DATA<br />
Columns 1-3<br />
Key Registration Statistics 2001,<br />
Registration Administration Bureau,<br />
Department of Local Administration,<br />
Ministry of Interior.<br />
Columns 4-5<br />
Socio-economic Survey 2000,<br />
National Statistical Office.<br />
Columns 6-7<br />
National Account Division, Office of<br />
the National Economic and Social<br />
Development Board, 1999. Gross<br />
provincial product at current market<br />
prices and per capita income by<br />
region and province 1999.<br />
Columns 8-12<br />
Royal Thai Survey Department and<br />
Royal Forest Department, LANDSAT,<br />
1998.<br />
Notes: 1. Forest land is the land area still<br />
under forest.<br />
2. Unclassified land is the balance of<br />
land area taken from total land<br />
minus forest land and farm holding<br />
land, municipal area, railroads, highways,<br />
real estate, public area, etc.<br />
TABLE 2 – HEALTH<br />
Column 1<br />
Number of Midyear Population<br />
(July 1 st) by Region and Province,<br />
2001, Bureau of Health Policy and<br />
Planning, Ministry of Public Health.<br />
Columns 2-4<br />
Development Evaluation Division,<br />
National Economic and Social Development<br />
Board. Calculation is based<br />
DATA SOURCES<br />
on the 1998 civil registration from<br />
Registration Administration Bureau<br />
Department, Ministry of Interior.<br />
Columns 5-7<br />
Public Health Statistics 2002, Health<br />
Information Division, Bureau of<br />
Health Policy and Planning, Ministry<br />
of Public Health.<br />
Column 8<br />
Nutrition Surveillance in Children<br />
(0-60 months) Report, First Quarter/<br />
Fiscal Year 1998 (October-December<br />
1997), Health Department, Ministry of<br />
Public Health.<br />
Note: Data includes only first-degree malnutrition.<br />
Columns 9-11<br />
Department of Communicable Disease<br />
Control, Ministry of Public Health,<br />
Fiscal Year 2001 (Sickness per 1000<br />
population). Number of patients<br />
covers only those who came for medical<br />
services. Population Midyear 2001.<br />
Columns 12-14<br />
Division of Epidemiology, Ministry of<br />
Public Health. Number of AIDS<br />
patients by province is from 1984 to<br />
August 31, 2002 and does not<br />
exclude those who passed away.<br />
Number of new AIDS patients represents<br />
reported cases during January-<br />
September 31,2002. AIDS incidence<br />
per 100,000 population (new AIDS<br />
rate) is also based on the 9-month<br />
data.<br />
Column 15<br />
Department of Mental Health, Ministry<br />
of Public Health, Fiscal Year 2001.<br />
Population by province as of December<br />
31, 2001 from Registration<br />
<strong>THAILAND</strong> <strong>HUMAN</strong> <strong>DEVELOPMENT</strong> <strong>REPORT</strong> <strong>2003</strong>
Administration Bureau, Department<br />
of Local Administration, Ministry of<br />
Interior, December 31, 2001.<br />
Note: Mental illnesses include those who are<br />
diagnosed for schizophrenia, anxiety,<br />
depression, mental retardness, drugaddiction,<br />
other mental illnesses,<br />
suicide, attempted suicide.<br />
Columns 16-18<br />
Health and Welfare Survey 2001,<br />
National Statistical Office. The survey<br />
shows percentages of population aged<br />
11 and over who regularly smoke and/<br />
or consume alcoholic beverage.<br />
Columns 19-23<br />
Health Personnel and Resources<br />
2000, Health Information Division,<br />
Bureau of Health Policy and Planning,<br />
Ministry of Public Health.<br />
TABLE 3 – EDUCATION<br />
Columns 1-3<br />
National Statistical Office, Calculation<br />
is based on the Labour Force<br />
Survey, Round 3 (July-September),<br />
2001, and covers people aged 15<br />
and over.<br />
Columns 4-12<br />
Calculation is based on the Labor<br />
Force Survey, Round 3 (July-<br />
September), 2001, and covers<br />
people aged 15 and over, National<br />
Statistical Office.<br />
Columns 13-18<br />
Numbers of students are from<br />
Educational Areas’ reports of students<br />
and teachers 2000, Education Information<br />
Center, Office of Permanent<br />
Secretary, Ministry of Education.<br />
Number of students in each age<br />
group in 2000 is from Office of the<br />
National Education Commission.<br />
Columns 19-20<br />
Information and Statistical Section,<br />
Planning Division, Department of<br />
General Education, Ministry of Education,<br />
2000.<br />
DATA SOURCES<br />
Columns 21-22<br />
National Assessment Test, Department<br />
of Curriculum and Instruction<br />
Development, Ministry of Education,<br />
1997.<br />
Notes: 1. For lower secondary level, the<br />
figures are average scores in five<br />
major subjects.<br />
2. For upper secondary level, the<br />
figures are average scores in eight<br />
major subjects.<br />
Columns 23-28<br />
Education Information Center, Office<br />
of Permanent Secretary, Ministry of<br />
Education, 1999.<br />
Column 29<br />
Data compiled from:<br />
Technical and Planning Division,<br />
Department of Skills Development,<br />
Ministry of Labour and Social Welfare,<br />
1999.<br />
Non-formal Education Department,<br />
Ministry of Education, 1999.<br />
Occupational Promotion Division,<br />
Community Development Office,<br />
Bangkok Metropolitan Administration,<br />
1999.<br />
Education Information Center, Office<br />
of Permanent Secretary, Ministry of<br />
Education, 1999.<br />
Number of population at December<br />
31, 1999 from Registration Administration<br />
Bureau, Department of Local<br />
Administration, Ministry of Interior.<br />
TABLE 4 – EMPLOYMENT<br />
Columns 1-16<br />
Labour Force Survey, Round 3<br />
(July-September)<br />
Statistical Office.<br />
2001, National<br />
Notes: Employment, Unemployment and<br />
Underemployment<br />
15 years and over.<br />
for population<br />
Underemployment = having worked<br />
less than 35 hours per week and<br />
wanting to work more.<br />
123
124<br />
Column 17<br />
Technical Studies and Planing Division,<br />
Social Security Office. Insured<br />
persons by provinces are as of<br />
December 2001.<br />
Note: Percentage of insured workers =<br />
number of total insured workers/<br />
current labour force; Calculated from<br />
Labour Force Survey, Round 3 (July-<br />
September) 2001, National Statistical<br />
Office.<br />
TABLE 5 – INCOME<br />
Columns 1, 6-7, 15-16<br />
Socio-economic Survey 1998,<br />
National Statistical Office.<br />
Columns 2-4, 13-14, 18-19<br />
Socio-economic Survey 2000,<br />
National Statistical Office.<br />
Columns 5, 8, 17<br />
Calculation<br />
inflation.<br />
is not adjusted by<br />
Columns 9-12<br />
Calculated from Socio-economic<br />
Survey 2000.<br />
Note: Welfare is percentage of average<br />
income above poverty line (100*<br />
per capita current income/poverty<br />
line).<br />
TABLE 6 – HOUSING AND<br />
LIVING CONDITIONS<br />
Columns 1-3, 5-11<br />
Socio-economic Survey 2000,<br />
National Statistical Office.<br />
Column 4<br />
Number of households in congested<br />
communities from Housing Authority<br />
of Thailand, Preliminary data as of<br />
July 24, 2001.<br />
Number of households in municipalities<br />
and sanitary districts from Socioeconomic<br />
Survey 2000, National<br />
Statistical Office.<br />
TABLE 7 – FAMILY AND<br />
COMMUNITY LIFE<br />
Columns 1-4<br />
Socio-economic Survey 2000,<br />
National Statistical Office (Elders are<br />
those aged 60 and over).<br />
Columns 5-7<br />
Labour Force Survey, Round 3<br />
(July-September) 2001, National<br />
Statistical Office.<br />
Note: Working children are children aged<br />
15-17 not attending schools. They<br />
may be employed, unemployed,<br />
seasonally unemployed or assigned to<br />
do housework.<br />
Column 8<br />
Key Registration Statistics 1999,<br />
Registration Administration Bureau,<br />
Department of Local Administration,<br />
Ministry of Interior.<br />
Columns 9-11<br />
Health and Welfare Survey 2001,<br />
National Statistical Office.<br />
Columns 12-13<br />
Crime Statistics of Thailand 2000,<br />
Royal Thai Police. Calculation is<br />
based on population at December 31,<br />
2000, Registration Administration<br />
Bureau, Department of Local Administration,<br />
Ministry of Interior.<br />
Notes: Violent crimes include murder, gang<br />
robbery, robbery, kidnapping and<br />
arson.<br />
TABLE 8 – TRANSPORT AND<br />
COMMUNICATION<br />
Columns 1-2<br />
National Rural Development 2C (Khor<br />
Chor Chor 2 Khor), 2001.<br />
<strong>THAILAND</strong> <strong>HUMAN</strong> <strong>DEVELOPMENT</strong> <strong>REPORT</strong> <strong>2003</strong>
Note: Convenient travel to the nearest<br />
district is defined as (1) having private<br />
automobile or public bus service all<br />
year round including rainy season, (2)<br />
over 60% of the households in the<br />
village own a motorcycle, (3) travel<br />
time to the nearest district by boat,<br />
train or other means of transportation<br />
is less than 15 minutes.<br />
Column 3<br />
Technical and Planning Division,<br />
Department of Land Transportation,<br />
December, 2001.<br />
Notes: 1. Includes personal car with less<br />
than 7 seats, personal car with<br />
more than 7 seats and motorcycle.<br />
2. Calculation is based on population<br />
at December 31, 2001 from<br />
Registration Administration Bureau,<br />
Department of Local Administration,<br />
Ministry of Interior.<br />
Columns 4-5<br />
Socio-economic Survey 2000,<br />
National Statistical Office.<br />
Columns 6-8<br />
Number of personal and public<br />
telephones provided by TOT, TA and<br />
TT&T. This includes only telephone<br />
lines that had been leased. Population<br />
per telephone line (operated by<br />
TOT, TA and TT&T) as of July 31, 2002<br />
is provided by TOT Corporation<br />
Public Company Limited, Thailand.<br />
DATA SOURCES<br />
Note: Number of leased lined in Bangkok<br />
Metropolis, Nonthaburi, Pathum Thani<br />
and Samut Prakan comes in one<br />
aggregated number. This Report<br />
assumes the same population per<br />
telephone ratio for all four provinces<br />
and calculates the number of<br />
telephone lines per province by this<br />
ratio.<br />
Columns 9-10<br />
Labour Force Survey, Round 3<br />
(July-September), 2000, Record 2,<br />
National Statistical Office.<br />
Notes: Internet access includes access from<br />
home, workplace, school, internet<br />
cafe, etc.<br />
TABLE 9 – PARTICIPATION<br />
Columns 1-2<br />
Election Commission of Thailand,<br />
Result of the General Election,<br />
January 6, 2001.<br />
Column 3<br />
Community Organization Development<br />
Institute, 2000.<br />
Columns 4-5<br />
Minimum Basic Needs (BMN) 2001,<br />
Community Development Department,<br />
Ministry of Interior.<br />
125
DATA TABLES
Table 1. Basic Data<br />
126<br />
Population 2001 Household Gross Provincial<br />
2000 Product (GPP) 1999<br />
Location Total Male Female<br />
Total Per capita<br />
Number Number Number Number Average size mil. Baht/year Baht/year<br />
1 2 3 4 5 6 7<br />
Kingdom 62,308,887 30,913,485 31,395,402 16,086,398 3.6 4,615,386 74,675<br />
Bangkok Metropolis 5,726,203 2,776,975 2,949,228 1,960,900 3.3 1,715,992 228,921<br />
Bangkok Vicinity 3,802,688 1,844,721 1,957,967 915,600 3.3 2,268,248 203,778<br />
Nakhon Pathom 791,914 385,756 406,158 212,600 3.6 64,217 75,817<br />
Nonthaburi 884,077 423,420 460,657 203,400 3.3 78,962 101,363<br />
Pathum Thani 679,417 330,181 349,236 147,100 3.3 129,169 230,248<br />
Samut Prakan 1,011,692 492,074 519,618 237,300 3.0 186,506 183,568<br />
Samut Sakon 435,588 213,290 222,298 115,200 3.4 93,401 216,207<br />
Central Region 2,984,711 1,474,359 1,510,352 789,400 3.4 207,653 71,334<br />
Chai Nat 350,932 170,406 180,526 109,900 3.0 14,943 40,169<br />
Phra Nakhon Si Ayutthaya 741,774 360,882 380,892 193,700 3.4 75,884 103,808<br />
Lop Buri 765,133 387,828 377,305 198,700 3.4 31,432 41,467<br />
Saraburi 614,267 307,532 306,735 144,900 3.5 61,929 115,539<br />
Sing Buri 223,163 107,652 115,511 67,400 3.7 10,325 42,844<br />
Ang Thong 289,442 140,059 149,383 74,800 3.7 13,141 48,134<br />
Eastern Region 4,241,974 2,121,611 2,120,363 1,040,800 3.5 568,556 144,230<br />
Chanthaburi 499,849 248,952 250,897 120,100 3.4 22,844 50,878<br />
Chachoengsao 643,996 317,691 326,305 162,900 3.9 55,544 88,586<br />
Chon Buri 1,104,231 555,195 549,036 258,400 3.0 206,859 210,009<br />
Trat 224,341 113,368 110,973 53,700 3.3 14,803 74,762<br />
Nakhon Nayok 250,007 124,132 125,875 70,200 3.6 9,393 36,834<br />
Prachin Buri 448,476 224,813 223,663 109,600 3.7 25,699 52,446<br />
Rayong 536,335 268,058 268,277 131,600 3.3 219,105 419,741<br />
Sa Kaeo 534,739 269,402 265,337 134,300 3.8 14,310 34,398<br />
Western Region 3,623,638 1,794,357 1,829,281 886,200 3.6 192,338 55,734<br />
Ratchaburi 825,272 405,758 419,514 208,600 3.6 48,754 61,018<br />
Kanchanaburi 792,294 401,457 390,837 169,800 3.7 43,578 62,612<br />
Suphan Buri 859,905 419,042 440,863 230,100 3.5 40,148 46,413<br />
Samutshongkhram 204,406 99,151 105,255 53,200 3.7 8,675 41,707<br />
Phetchaburi 459,042 223,764 235,278 112,800 3.5 22,515 51,522<br />
Prachuap Khiri khan 482,719 245,185 237,534 111,700 3.5 28,668 64,278<br />
Northeastern Region 21,493,681 10,746,373 10,747,308 5,205,799 3.9 530,277 25,367<br />
Nakon Ratchasima 2,565,685 1,272,823 1,292,862 680,300 3.7 94,324 36,070<br />
Buri Ram 1,533,874 765,853 768,021 349,200 4.0 32,935 22,060<br />
Surin 1,392,229 696,355 695,874 343,800 3.9 26,235 19,725<br />
Si Sa Ket 1,451,435 725,240 726,195 352,800 3.9 27,533 19,569<br />
Ubon Ratchathani 1,779,752 892,336 887,416 406,100 3.9 37,119 21,938<br />
Yasothon 552,714 277,538 275,176 142,800 3.9 11,392 19,743<br />
Chaiyaphum 1,130,913 563,573 567,340 287,000 3.5 28,450 25,934<br />
Amnat Charoen 368,230 184,773 183,457 87,600 4.0 6,375 17,807<br />
Nong Bua Lam Phu 496,519 250,760 245,759 111,700 4.1 8,075 16,719<br />
Khon Kaen 1,756,995 876,223 880,772 453,500 3.7 70,261 39,428<br />
<strong>THAILAND</strong> <strong>HUMAN</strong> <strong>DEVELOPMENT</strong> <strong>REPORT</strong> <strong>2003</strong>
Table 1 Basic Data (Continued)<br />
Population 2001 Household Gross Provincial<br />
2000 Product (GPP) 1999<br />
Location Total Male Female<br />
Total Per capita<br />
Number Number Number Number Average size mil. Baht/year Baht/year<br />
1 2 3 4 5 6 7<br />
Udon Thani 1,526,600 766,735 759,865 349,300 4.3 37,921 25,902<br />
Loei 632,320 321,305 311,015 152,000 4.1 15,305 26,118<br />
Nong Khai 904,806 455,556 449,250 215,400 4.0 21,639 24,478<br />
Maha Salakam 939,920 467,710 472,210 244,800 4.1 21,039 21,847<br />
Roi Et 1,319,589 659,858 659,731 313,800 3.7 27,120 21,941<br />
Kalasin 985,454 491,926 493,528 233,400 4.0 19,662 21,302<br />
Sakhon Nakhon 1,101,608 550,123 551,485 246,400 4.1 22,554 21,728<br />
Nakhon Phanom 719,111 359,115 359,996 167,100 4.0 13,629 19,867<br />
Mukdahan 335,927 168,571 167,356 68,800 3.9 8,710 30,034<br />
Northern Region 12,124,425 6,020,928 6,103,497 3,182,200 3.4 425,066 37,905<br />
Chiang Mai 1,600,850 791,537 809,313 432,800 3.1 80,503 55,405<br />
Lamphun 406,030 199,151 206,879 122,900 3.3 27,045 62,316<br />
Lampang 801,260 398,240 403,020 225,200 3.4 32,060 41,368<br />
Uttaradit 484,060 240,181 243,879 128,900 3.2 17,924 38,965<br />
Phrae 486,502 239,588 246,914 153,100 3.4 12,946 25,334<br />
Nan 487,206 246,320 240,886 125,800 3.4 12,404 28,127<br />
Phayao 509,075 252,068 257,007 144,500 3.3 14,067 27,967<br />
Chiang Rai 1,263,169 630,324 632,845 319,800 3.6 31,893 28,629<br />
Mae Hong Son 236,993 122,726 114,267 47,200 3.6 5,568 32,184<br />
Nakhon Sawan 1,128,855 555,646 573,209 310,300 3.3 41,583 37,631<br />
Uthai Thani 333,909 164,830 169,079 89,100 3.5 10,702 34,634<br />
Kamphaeng Phet 766,248 380,858 385,390 190,400 3.5 27,521 40,354<br />
Tak 498,890 253,313 245,577 99,100 3.6 15,354 43,128<br />
Sukhothai 624,064 304,778 319,286 169,700 3.5 18,398 31,130<br />
Phitsanulok 869,566 431,474 438,092 224,700 3.6 32,314 40,191<br />
Phichit 591,412 290,385 301,027 154,700 3.4 18,577 31,974<br />
Phetchabun 1,036,336 519,509 516,827 244,000 3.7 26,208 28,425<br />
Southern Region 8,311,567 4,134,161 4,177,406 2,105,500 3.9 423,249 51,284<br />
Nakhon Si Thammarat 1,527,273 761,238 766,035 425,100 4.0 67,779 41,329<br />
Krabi 371,814 187,513 184,301 82,400 3.9 18,864 57,338<br />
Phangnga 237,514 120,248 117,266 69,700 3.9 15,528 62,868<br />
Phuket 261,386 127,123 134,263 49,200 3.3 37,463 188,257<br />
Surat Thani 907,612 452,523 455,089 228,700 3.6 48,404 54,880<br />
Ranong 161,724 83,194 78,530 37,600 3.4 14,126 102,362<br />
Chumphon 468,746 235,574 233,172 125,100 3.3 20,713 46,757<br />
Songkhla 1,249,402 615,043 634,359 330,700 3.5 76,617 58,846<br />
Satun 267,095 133,815 133,280 61,200 4.0 15,789 61,675<br />
Trang 596,673 295,925 300,748 155,900 3.9 27,316 44,130<br />
Phattalung 502,869 247,680 255,189 137,700 3.5 14,118 27,307<br />
Pattani 618,268 305,065 313,203 144,200 4.4 31,229 50,862<br />
Yala 451,190 225,891 225,299 103,600 4.2 16,204 39,523<br />
Narathiwat 690,001 343,329 346,672 154,400 4.6 19,098 29,069<br />
DATA TABLES<br />
127
Table 1. Basic Data (continued)<br />
128<br />
Location<br />
Total Land Area Forest Area Farm Holding Land Unclassified Land Pop. Density<br />
1998 1998 1998 1998 1998<br />
rai rai rai rai p.p. sq. km<br />
8 9 10 11 12<br />
Kingdom 320,696,888 81,076,428 130,393,525 109,226,935 121<br />
Bangkok Metropolis 978,263 1,094 143,904 833,265 3,658<br />
Bangkok Vicinity 3,870,578 12,458 1,841,006 2,017,114 614<br />
Nakhon Pathom 1,355,204 0 751,078 604,126 365<br />
Nonthaburi 388,939 0 189,167 199,772 1,421<br />
Pathum Thani 953,660 0 536,937 416,723 445<br />
Samut Prakan 627,558 1,857 230,483 395,218 1,008<br />
Samut Sakon 545,217 10,601 133,341 401,275 499<br />
Central Region 10,370,922 151,711 6,334,005 3,885,206 180<br />
Chai Nat 1,543,591 3,713 1,165,728 374,150 142<br />
Phra Nakhon Si Ayutthaya 1,597,900 0 1,092,641 505,259 290<br />
Lop Buri 3,874,846 119,531 2,228,617 1,526,698 123<br />
Saraburi 2,235,304 28,467 949,654 1,257,183 172<br />
Sing Buri 514,049 0 433,675 80,374 271<br />
Ang Thong 605,232 0 463,690 141,542 299<br />
Eastern Region 22,814,063 4,692,142 10,394,196 7,727,725 116<br />
Chanthaburi 3,961,250 1,166,962 1,545,822 1,248,466 79<br />
Chachoengsao 3,344,375 724,219 1,788,757 831,399 120<br />
Chon Buri 2,726,875 150,509 1,305,611 1,270,755 253<br />
Trat 1,761,875 469,845 494,278 797,752 80<br />
Nakhon Nayok 1,326,250 300,624 641,815 383,811 118<br />
Prachin Buri 2,976,476 998,907 1,242,574 734,995 94<br />
Rayong 2,220,000 131,064 1,273,862 815,074 151<br />
Sa Kaeo 4,496,962 750,012 2,101,477 1,645,473 74<br />
Western Region 26,904,427 9,865,049 7,170,403 9,868,975 84<br />
Ratchaburi 3,247,789 816,640 1,127,565 1,303,584 159<br />
Kanchanaburi 12,176,968 6,579,846 1,983,144 3,613,978 41<br />
Suphan Buri 3,348,755 353,597 2,088,609 906,549 160<br />
Samutshongkhram 260,442 7,156 112,232 141,054 491<br />
Phetchaburi 3,890,711 1,340,466 664,130 1,886,115 74<br />
Prachuap Khiri khan 3,979,762 767,344 1,194,723 2,017,695 76<br />
Northeastern Region 105,533,963 13,114,948 57,429,749 34,989,266 127<br />
Nakon Ratchasima 12,808,728 1,389,187 7,715,541 3,704,000 125<br />
Buri Ram 6,451,178 327,657 3,803,346 2,320,175 149<br />
Surin 5,077,535 168,906 3,535,333 1,373,296 171<br />
Si Sa Ket 5,524,985 441,016 3,397,169 1,686,800 164<br />
Ubon Ratchathani 9,840,526 1,548,360 4,776,985 3,515,181 113<br />
Yasothon 2,601,040 230,626 1,627,928 742,486 133<br />
Chaiyaphum 7,986,429 1,882,033 3,437,482 2,666,914 89<br />
Amnat Charoen 1,975,785 646,562 1,319,964 9,259 116<br />
Nong Bua Lam Phu 2,411,929 182,814 1,506,081 723,034 129<br />
Khon Kaen 6,803,744 507,269 4,077,983 2,218,492 161<br />
<strong>THAILAND</strong> <strong>HUMAN</strong> <strong>DEVELOPMENT</strong> <strong>REPORT</strong> <strong>2003</strong>
Table 1 Basic Data<br />
Location<br />
Udon Thani 7,331,439 1,154,075 3,696,675 2,480,689 130<br />
Loei 7,140,382 1,805,667 2,279,037 3,055,678 55<br />
Nong Khai 4,582,675 289,644 2,539,978 1,753,053 123<br />
Maha Salakam 3,307,302 20,392 2,712,409 574,501 178<br />
Roi Et 5,187,156 116,719 3,179,594 1,890,843 159<br />
Kalasin 4,341,716 369,220 2,560,861 1,411,635 142<br />
Sakhon Nakhon 6,003,602 850,938 2,924,574 2,228,090 115<br />
Nakhon Phanom 3,445,418 351,875 1,440,619 1,652,924 130<br />
Mukdahan 2,712,394 831,988 898,190 982,216 77<br />
Northern Region 106,027,680 45,660,825 28,274,892 32,091,963 71<br />
Chiang Mai 12,566,911 8,787,656 1,316,820 2,462,435 80<br />
Lamphun 2,816,176 1,332,499 473,391 1,010,286 90<br />
Lampang 7,833,726 4,896,650 984,526 1,952,550 64<br />
Uttaradit 4,899,120 1,885,439 1,308,252 1,705,429 62<br />
Phrae 4,086,624 1,506,769 613,520 1,966,335 74<br />
Nan 7,170,045 2,995,238 776,777 3,398,030 42<br />
Phayao 3,959,412 1,513,281 1,012,642 1,433,489 80<br />
Chiang Rai 7,298,981 2,386,875 2,145,246 2,766,860 108<br />
Mae Hong Son 7,925,787 5,479,650 246,060 2,200,077 19<br />
Nakhon Sawan 5,998,548 413,902 4,034,458 1,550,188 118<br />
Uthai Thani 4,206,404 1,614,805 1,329,812 1,261,787 50<br />
Kamphaeng Phet 5,379,681 1,251,718 2,602,823 1,525,140 89<br />
Tak 10,254,156 7,182,562 1,024,401 2,047,193 30<br />
Sukhothai 4,122,557 1,385,156 1,901,328 836,073 95<br />
Phitsanulok 6,759,909 1,493,781 2,519,007 2,747,121 80<br />
Phichit 2,831,883 0 2,095,091 736,792 131<br />
Phetchabun 7,917,760 1,534,844 3,890,738 2,492,178 82<br />
Southern Region 44,196,992 7,578,201 18,805,370 17,813,421 118<br />
Nakhon Si Thammarat 6,214,064 768,436 3,062,459 2,383,169 154<br />
Krabi 2,942,820 199,376 1,229,245 1,514,199 79<br />
Phangnga 2,606,809 714,062 831,651 1,061,096 57<br />
Phuket 339,396 15,236 143,021 181,139 481<br />
Surat Thani 8,057,168 1,881,587 2,623,957 3,551,624 70<br />
Ranong 2,061,278 664,780 453,074 943,424 49<br />
Chumphon 3,755,630 636,874 1,810,696 1,308,060 78<br />
Songkhla 4,621,181 357,423 2,088,694 2,175,064 169<br />
Satun 1,549,361 330,178 538,569 680,614 108<br />
Trang 3,073,449 584,688 1,527,424 961,337 121<br />
Phattalung 2,140,296 273,505 1,205,519 661,272 147<br />
Pattani 1,212,722 27,346 742,287 443,089 319<br />
Yala 2,825,674 696,897 1,185,198 943,579 100<br />
Narathiwat 2,797,144 427,813 1,363,576 1,005,755 154<br />
DATA TABLES<br />
Total Land Area Forest Area Farm Holding Land Unclassified Land Pop. Density<br />
1998 1998 1998 1998 1998<br />
rai rai rai rai p.p. sq. km<br />
8 9 10 11 12<br />
129
Table 2. Health<br />
130<br />
Population Life expectancy at birth Crude death Infant mortality Maternal mortality Under 5 Sexually transmitted diseases 2001<br />
1996 (yrs) rate 2001 rate 2001 rate 2001 1 st degree<br />
Location Mid-year 2001 per 1,000 pop. per 1,000 per 100,000 malnutrition No. of patients No. of STD STD per<br />
Male Female Total live births live births 1997 (%) examined cases 1,000 pop.<br />
1 2 3 4 5 6 7 8 9 10 11<br />
Kingdom 62,093,855 68.5 76.1 72.2 6.0 6.5 12.9 7.36 538,816 15,358 0.25<br />
Bangkok Metropolis 5,703,292 69.6 77.9 73.8 6.8 7.3 10.0 4.01 39,900 5,800 1.02<br />
Bangkok Vicinity 2,974,869 70.1 78.0 74.1 7.9 5.6 12.6 1.66 42,547 620 0.21<br />
Nakhon Pathom 786,527 66.5 75.9 71.2 6.7 5.7 9.6 2.04 18,201 195 0.25<br />
Nonthaburi 871,843 77.2 82.4 79.8 6.6 5.2 10.6 1.60 1,437 11 0.01<br />
Pathum Thani 667,060 67.9 75.3 71.6 5.8 3.7 27.1 1.91 1,220 6 0.01<br />
Samut Prakan 1,003,765 72.8 78.9 75.9 5.5 8.3 15.7 1.02 12,809 346 0.34<br />
Samut Sakon 432,201 69.1 77.7 73.4 6.9 5.1 0.0 1.79 8,880 62 0.14<br />
Central Region 2,975,959 69.3 76.0 72.6 7.2 8.0 11.0 3.26 28,561 539 0.18<br />
Chai Nat 350,988 71.0 77.7 74.4 6.6 9.7 0.0 4.08 1,774 6 0.02<br />
Phra Nakhon Si Ayutthaya 737,893 67.8 74.0 71.0 7.1 7.1 0.0 2.98 7,875 191 0.26<br />
Lop Buri 763,301 70.3 77.2 73.6 7.0 6.3 13.2 4.60 7,992 96 0.13<br />
Saraburi 610,934 71.1 79.2 75.1 6.8 4.0 12.9 6.37 4,816 154 0.25<br />
Sing Buri 223,420 65.5 69.6 67.7 9.5 7.9 0.0 3.70 5,040 78 0.35<br />
Ang Thong 289,423 67.6 75.4 71.6 8.1 13.2 39.9 2.17 1,064 14 0.05<br />
Eastern Region 4,211,410 68.0 76.5 72.1 6.3 4.8 5.1 4.80 57,434 1,216 0.29<br />
Chanthaburi 496,642 66.6 74.8 70.4 7.2 3.8 15.0 5.28 10,614 44 0.09<br />
Chachoengsao 641,874 70.9 79.0 74.9 6.2 3.3 0.0 2.59 4,214 46 0.07<br />
Chon Buri 1,091,375 68.2 76.5 72.1 7.0 5.3 13.8 1.89 29,366 858 0.79<br />
Trat 224,133 67.7 77.6 72.3 5.8 6.5 0.0 4.41 832 18 0.08<br />
Nakhon Nayok 248,445 64.7 73.7 69.1 6.3 3.2 0.0 4.25 1,162 4 0.02<br />
Prachin Buri 446,334 69.9 77.5 73.7 6.3 6.0 0.0 7.54 1,700 39 0.09<br />
Rayong 529,927 64.3 73.8 68.7 6.3 5.7 12.0 4.30 8,076 186 0.35<br />
Sa Kaeo 532,680 69.6 77.6 73.4 4.5 4.4 0.0 9.84 1,470 21 0.04<br />
Western Region 3,615,141 67.2 75.2 71.1 6.2 6.8 6.4 3.24 25,870 479 0.13<br />
Ratchaburi 823,438 65.5 74.1 69.7 6.8 7.6 26.7 0.00 4,463 135 0.16<br />
Kanchanaburi 789,148 68.5 76.5 72.3 5.0 5.6 0.0 4.72 2,780 77 0.10<br />
Suphan Buri 859,054 67.9 75.2 71.5 6.7 5.4 11.7 5.61 3,017 96 0.11<br />
Samutshongkhram 204,70 63.2 69.8 66.6 6.7 7.9 0.0 3.53 1,771 128 0.63<br />
Phetchaburi 457,968 65.2 74.0 69.6 7.0 6.5 0.0 2.64 1,512 9 0.02<br />
Prachuap Khiri khan 480,832 70.9 79.3 74.9 5.5 8.0 0.0 2.26 12,327 34 0.07<br />
Northeastern Region 21,449,224 69.2 75.7 72.4 5.1 6.2 9.8 10.26 105,358 2,774 0.13<br />
Nakon Ratchasima 2,555,998 69.4 76.6 72.9 5.0 7.4 10.2 10.58 10,556 960 0.38<br />
Buri Ram 1,531,041 70.6 77.2 73.9 4.3 4.1 5.3 13.38 938 31 0.02<br />
Surin 1,387,693 70.2 76.3 73.2 4.7 4.5 0.0 9.95 3,256 50 0.04<br />
Si Sa Ket 1,447,601 68.8 76.2 72.4 4.8 8.2 18.4 8.33 9,189 37 0.03<br />
Ubon Ratchathani 1,773,549 69.3 75.5 72.3 5.1 6.2 12.9 12.32 6,341 166 0.09<br />
Yasothon 553,349 68.4 73.0 70.7 5.8 5.7 0.0 9.22 4,795 7 0.01<br />
Chaiyaphum 1,129,940 73.0 79.1 76.0 4.9 4.2 46.9 7.24 1,691 136 0.12<br />
Amnat Charoen 367,563 68.3 74.4 71.2 5.1 3.9 0.0 13.27 93 0 0.00<br />
Nong Bua Lam Phu 495,405 68.2 76.9 72.3 4.9 5.7 0.0 0.82 437 66 0.13<br />
Khon Kaen 1,752,607 69.1 75.8 72.4 6.0 9.3 14.3 13.89 16,142 739 0.42<br />
<strong>THAILAND</strong> <strong>HUMAN</strong> <strong>DEVELOPMENT</strong> <strong>REPORT</strong> <strong>2003</strong>
Table 2 Health (Continued)<br />
Population Life expectancy at birth Crude death Infant mortality Maternal mortality Under 5 Sexually transmitted diseases 2001<br />
1996 (yrs) rate 2001 rate 2001 rate 2001 1 st degree<br />
Location Mid-year 2001 per 1,000 pop. per 1,000 per 100,000 malnutrition No. of patients No. of STD STD per<br />
Male Female Total live births live births 1997 (%) examined cases 1,000 pop.<br />
1 2 3 4 5 6 7 8 9 10 11<br />
Udon Thani 1,523,229 69.1 75.4 72.1 5.1 5.4 10.7 9.22 24,486 285 0.19<br />
Loei 631,864 72.6 78.2 75.2 5.1 4.0 0.0 10.96 4,361 23 0.04<br />
Nong Khai 904,346 69.6 75.7 72.5 4.8 7.2 0.0 7.00 931 47 0.05<br />
Maha Salakam 938,891 68.6 74.2 71.4 5.4 2.5 0.0 8.66 4,101 39 0.04<br />
Roi Et 1,318,689 68.2 74.4 71.3 5.7 7.1 7.9 10.18 4,044 25 0.02<br />
Kalasin 984,703 67.1 73.8 70.3 5.2 3.9 0.0 10.94 3,009 37 0.04<br />
Sakhon Nakhon 1,099,617 66.8 72.9 69.8 5.4 7.2 14.6 10.92 9,880 84 0.08<br />
Nakhon Phanom 718,013 67.5 73.2 70.3 5.3 8.4 11.4 9.66 963 20 0.03<br />
Mukdahan 335,126 68.6 74.5 71.5 5.0 3.8 0.0 11.21 145 22 0.07<br />
Northern Region 12,112,820 64.3 73.1 68.5 7.0 7.1 20.2 7.92 130,629 1,865 0.15<br />
Chiang Mai 1,595,589 57.7 69.0 62.9 9.4 8.1 33.1 10.21 29,797 444 0.28<br />
Lamphun 406,079 59.5 71.4 65.1 8.8 12.4 0.0 8.25 3,532 36 0.09<br />
Lampang 802,35 64.9 74.1 69.2 8.4 6.4 16.4 6.55 18,243 59 0.07<br />
Uttaradit 483,981 69.9 75.8 72.8 7.0 5.9 22.0 5.99 1,995 16 0.03<br />
Phrae 488,046 61.8 68.8 65.2 9.2 4.0 26.9 8.28 4,175 45 0.09<br />
Nan 486,650 68.9 74.5 71.6 6.3 8.3 0.0 15.24 1,987 6 0.01<br />
Phayao 510,346 56.5 67.8 61.7 9.0 3.8 47.7 10.36 6,025 18 0.04<br />
Chiang Rai 1,261,579 56.5 67.7 61.6 8.3 5.9 41.5 0.01 22,602 90 0.07<br />
Mae Hong Son 235,610 70.6 76.8 73.4 4.3 7.4 49.1 15.87 6,424 14 0.06<br />
Nakhon Sawan 1,127,071 69.5 76.6 73.0 6.2 8.4 9.1 7.23 8,253 613 0.54<br />
Uthai Thani 333,518 69.2 76.0 72.6 5.8 4.0 0.0 5.25 253 15 0.04<br />
Kamphaeng Phet 766,002 71.1 77.5 74.2 4.8 3.9 14.3 8.93 3,692 27 0.04<br />
Tak 494,473 72.0 77.6 74.6 5.2 6.6 39.6 13.17 2,299 171 0.35<br />
Sukhothai 624,699 66.6 73.4 70.0 5.9 2.9 18.3 7.17 2,441 57 0.09<br />
Phitsanulok 867,782 67.5 75.8 71.5 6.1 14.8 0.0 9.45 10,111 85 0.10<br />
Phichit 592,612 66.0 73.7 69.8 6.1 7.4 0.0 10.08 6,214 65 0.11<br />
Phetchabun 1,036,432 69.7 77.3 73.4 5.0 6.1 0.0 5.32 2,586 104 0.10<br />
Southern Region 8,264,613 72.3 80.6 76.3 5.0 6.6 19.9 6.55 108,517 2,065 0.25<br />
Nakhon Si Thammarat 1,525,916 74.8 82.6 78.7 4.4 4.6 5.3 6.08 17,627 276 0.18<br />
Krabi 368,65 73.9 80.3 77.0 4.4 7.3 16.6 4.32 4,077 30 0.08<br />
Phangnga 236,366 70.1 79.8 74.6 4.8 5.9 31.2 6.37 1,036 15 0.06<br />
Phuket 255,992 67.7 76.3 71.8 6.1 6.9 0.0 4.00 12,535 195 0.76<br />
Surat Thani 900,573 70.1 79.1 74.4 4.9 3.6 7.4 4.45 13,144 200 0.22<br />
Ranong 161,178 73.9 80.8 77.1 3.6 2.8 46.3 4.36 395 21 0.13<br />
Chumphon 466,070 71.8 82.4 76.9 5.1 3.5 15.9 5.52 7,007 106 0.23<br />
Songkhla 1,241,002 69.4 77.6 73.4 5.7 7.0 9.7 6.66 28,702 832 0.67<br />
Satun 265,306 73.2 81.2 77.0 4.3 4.9 89.6 7.68 786 81 0.31<br />
Trang 593,762 69.0 78.3 73.5 5.1 8.7 0.0 5.61 4,410 29 0.05<br />
Phattalung 503,277 72.0 80.7 76.4 4.5 3.8 17.9 3.55 4,177 77 0.15<br />
Pattani 615,198 73.8 81.6 77.6 5.5 10.4 48.5 6.53 3,270 85 0.14<br />
Yala 446,746 73.7 79.7 76.6 4.8 9.2 29.8 11.19 4,734 81 0.18<br />
Narathiwat 684,568 75.2 82.7 78.7 5.1 8.2 30.5 10.44 6,617 37 0.05<br />
DATA TABLES<br />
131
Table 2. Health (continued)<br />
132<br />
Total AIDS New AIDS AIDS Mental Unhealthy behaviour 2001 (%) Persons per Persons per Persons per Persons per Persons per<br />
patients patients incidence illness 2001 physician dentist pharmacist nurse hospital bed<br />
Location 1984-2002 Jan-Sep per 100,000 per 1,000 Male Female Total 2000 2000 2000 2000 2000<br />
2002 pop. pop.<br />
12 13 14 15 16 17 18 19 20 21 22 23<br />
Kingdom 201,268 5,088 8.19 22 60.5 10.2 35.2 3,433 14,941 9,692 616 454<br />
Bangkok Metropolis 21,280 766 13.43 6 51.7 6.7 28.0 793 3,529 2,551 271 202<br />
Bangkok Vicinity 14,094 398 13.38 21 63.0 6.1 34.4 3,245 13,541 11,881 610 273<br />
Nakhon Pathom 3,486 129 16.40 5 68.7 9.4 39.2 3,948 22,220 15,872 666 551<br />
Nonthaburi 3,134 0 0.00 49 63.8 4.9 34.6 3,044 10,485 11,324 448 165<br />
Pathum Thani 2,967 167 25.04 17 65.6 7.3 36.4 2,261 10,068 9,763 581 255<br />
Samut Prakan 2,777 48 4.78 15 59.2 5.9 31.7 3,915 14,094 12,032 899 299<br />
Samut Sakon 1,730 54 12.49 10 48.8 2.3 24.8 3,486 19,331 11,191 554 382<br />
Central Region 8,417 314 10.55 29 58.3 6.4 32.3 4,249 18,153 11,035 533 431<br />
Chai Nat 640 9 2.56 30 59.1 15.3 36.8 5,760 25,095 13,513 562 483<br />
Phra Nakhon Si Ayutthaya 2,615 128 17.35 39 69.4 16.2 43.3 4,520 15,254 10,612 681 601<br />
Lop Buri 1,708 77 10.09 8 60.7 11.2 35.9 4,848 19,517 14,096 569 428<br />
Saraburi 2,113 41 6.71 39 56.3 2.1 29.1 2,963 16,414 9,640 437 314<br />
Sing Buri 682 28 12.53 24 56.0 2.1 29.5 2,665 13,170 6,051 301 259<br />
Ang Thong 659 31 10.71 45 52.2 2.0 27.1 7,395 27,993 13,514 675 665<br />
Eastern Region 19,849 752 17.86 9 62.4 9.8 36.3 3,084 16,983 10,249 484 412<br />
Chanthaburi 3,396 196 39.47 4 55.0 10.0 33.4 2,320 17,562 8,627 419 356<br />
Chachoengsao 1,534 0 0.00 5 50.7 4.5 27.4 4,068 24,566 13,306 794 584<br />
Chon Buri 4,332 171 15.67 5 62.8 9.7 36.6 1,876 10,280 8,553 317 286<br />
Trat 1,747 82 36.59 14 67.3 16.1 41.7 4,073 12,444 9,333 386 394<br />
Nakhon Nayok 873 5 2.01 19 65.5 8.1 37.2 4,713 18,851 10,211 397 441<br />
Prachin Buri 912 14 3.14 5 63.3 4.5 34.1 4,471 19,247 8,854 607 462<br />
Rayong 6,184 272 51.33 11 67.6 26.4 47.4 3,242 25,938 9,788 566 411<br />
Sa Kaeo 871 12 2.25 18 49.7 4.1 27.0 12,066 40,837 21,235 1,314 985<br />
Western Region 14,241 457 12.64 19 60.8 10.3 35.4 4,373 21,046 11,647 566 432<br />
Ratchaburi 2,932 48 5.83 29 62.1 10.3 35.5 3,129 16,073 9,210 396 283<br />
Kanchanaburi 2,775 108 13.69 16 53.0 10.8 32.0 4,712 23,704 15,043 702 523<br />
Suphan Buri 2,596 102 11.87 24 57.9 5.7 31.8 6,444 27,646 14,776 761 526<br />
Samutshongkhram 1,023 30 14.66 6 47.2 2.5 23.7 4,889 15,796 7,898 400 379<br />
Phetchaburi 2,977 79 17.25 11 57.5 6.4 31.5 3,193 19,023 9,925 537 474<br />
Prachuap Khiri khan 1,938 90 18.72 9 70.5 15.5 43.2 6,209 25,161 12,581 698 600<br />
Northeastern Region 33,487 657 3.06 30 59.6 10.6 35.2 8,311 35,476 21,740 1,109 766<br />
Nakon Ratchasima 2,782 16 0.63 39 66.9 7.0 37.1 7,778 39,131 23,995 1,111 744<br />
Buri Ram 2,535 29 1.89 43 65.7 9.3 37.2 11,725 40,114 21,776 1,331 976<br />
Surin 2,217 40 2.88 45 50.4 3.5 28.0 13,164 53,161 28,796 1,444 773<br />
Si Sa Ket 1,460 60 4.14 27 54.2 6.5 29.5 19,007 60,190 36,114 1,850 1,063<br />
Ubon Ratchathani 3,076 2 0.11 55 48.6 3.2 26.2 7,504 30,938 20,270 892 600<br />
Yasothon 888 17 3.07 17 57.2 18.8 38.7 10,872 34,655 18,482 1,034 785<br />
Chaiyaphum 1,466 21 1.86 27 62.2 14.8 39.2 13,759 36,395 20,514 1,259 1,114<br />
Amnat Charoen 629 6 1.63 39 55.8 2.4 28.7 12,635 24,428 15,267 1,032 944<br />
Nong Bua Lam Phu 707 47 9.49 7 51.8 2.7 27.1 13,731 38,024 23,539 1,811 414<br />
Khon Kaen 3,941 38 2.17 26 53.1 7.2 30.5 2,928 26,484 20,092 748 507<br />
<strong>THAILAND</strong> <strong>HUMAN</strong> <strong>DEVELOPMENT</strong> <strong>REPORT</strong> <strong>2003</strong>
Table 2 Health (Continued)<br />
Udon Thani 3,270 183 12.01 27 56.4 2.8 29.4 6,180 29,236 17,474 1,027 726<br />
Loei 1,403 43 6.81 35 48.0 3.4 24.5 8,324 22,594 13,460 848 729<br />
Nong Khai 935 11 1.22 20 50.6 2.6 27.0 9,909 45,085 24,370 1,144 952<br />
Maha Salakam 1,650 25 2.66 15 71.2 31.1 51.8 11,049 44,721 24,080 1,213 943<br />
Roi Et 2,495 50 3.79 5 57.3 9.0 32.7 9,701 36,647 29,984 1,342 959<br />
Kalasin 1,365 34 3.45 13 52.3 9.2 31.0 14,261 42,783 22,364 1,232 902<br />
Sakhon Nakhon 812 14 1.27 6 57.3 5.4 31.4 10,244 31,318 22,370 1,075 736<br />
Nakhon Phanom 1,265 3 0.42 63 74.7 8.0 41.7 13,015 28,634 16,269 1,018 915<br />
Mukdahan 591 18 5.37 13 71.5 39.2 55.8 8,139 27,807 13,347 748 719<br />
Northern Region 33,487 657 5.42 23 62.1 13.6 37.8 4,501 17,037 11,012 632 493<br />
Chiang Mai 16,051 207 12.97 17 58.0 8.2 32.3 2,082 7,789 8,407 444 257<br />
Lamphun 3,990 75 18.47 15 60.5 11.2 36.2 5,647 19,362 11,959 688 588<br />
Lampang 7,700 98 24.68 25 59.0 10.9 34.1 4,193 15,786 8,386 432 423<br />
Uttaradit 581 26 5.37 8 46.4 3.2 24.6 6,292 18,633 12,749 648 485<br />
Phrae 2,153 26 5.33 30 58.6 11.7 35.2 5,710 19,644 9,266 451 670<br />
Nan 2,226 69 14.18 21 66.8 14.4 41.2 8,268 21,209 10,162 647 562<br />
Phayao 8,561 49 9.60 4 68.2 24.7 47.0 7,334 25,669 13,510 581 610<br />
Chiang Rai 15,093 197 15.62 8 53.8 7.5 29.8 7,652 30,060 16,834 929 611<br />
Mae Hong Son 1,102 29 12.31 23 51.0 3.3 25.7 4,488 16,668 10,607 533 491<br />
Nakhon Sawan 2,412 86 7.63 75 69.6 17.9 43.8 4,264 27,458 15,636 809 583<br />
Uthai Thani 537 7 2.10 32 50.7 6.7 29.3 6,652 20,787 11,878 608 545<br />
Kamphaeng Phet 2,079 62 8.09 21 56.5 5.9 31.7 12,980 31,909 24,704 1,247 981<br />
Tak 950 16 3.24 28 68.5 22.0 45.1 6,498 24,368 10,370 612 494<br />
Sukhothai 1,723 75 12.01 48 51.1 2.8 27.0 4,540 17,402 9,788 501 546<br />
Phitsanulok 1,959 58 6.68 9 73.2 27.8 50.5 2,350 9,323 5,223 575 373<br />
Phichit 1,486 54 9.11 10 66.5 10.2 38.2 4,621 17,533 10,645 590 611<br />
Phetchabun 2,248 55 5.31 9 55.2 4.7 29.0 14,629 49,459 24,154 1,400 967<br />
Southern Region 70,851 1,289 15.60 17 64.2 11.3 37.6 5,194 22,549 10,575 571 494<br />
Nakhon Si Thammarat 1,737 92 6.03 12 72.3 7.4 40.4 8,815 33,890 20,891 957 721<br />
Krabi 1,062 35 9.49 4 63.8 12.8 37.4 10,341 21,291 12,927 757 733<br />
Phangnga 486 5 2.12 28 69.3 19.6 45.1 4,258 13,776 7,097 373 413<br />
Phuket 1,804 13 5.08 49 73.0 29.3 51.6 2,103 13,669 7,237 396 298<br />
Surat Thani 2,030 37 4.11 41 61.7 2.5 31.8 3,561 17,456 5,975 357 334<br />
Ranong 1,861 36 22.34 32 66.5 13.8 40.2 4,831 15,941 8,856 408 430<br />
Chumphon 1,056 21 4.51 15 64.7 9.1 37.0 5,689 27,109 9,805 663 400<br />
Songkhla 3,475 25 2.01 17 47.6 3.5 24.7 3,086 18,062 9,448 469 352<br />
Satun 556 3 1.13 15 56.8 4.3 29.6 8,446 20,140 11,384 721 885<br />
Trang 1,678 71 11.96 4 66.5 13.6 40.0 5,262 21,050 8,930 661 510<br />
Phattalung 604 0 0.00 28 73.3 16.0 45.3 7,087 25,159 12,579 668 690<br />
Pattani 1,060 78 12.68 6 67.1 11.0 39.1 8,475 26,531 15,646 810 834<br />
Yala 472 6 1.34 15 56.2 15.1 35.2 4,880 24,400 8,784 397 357<br />
Narathiwat 1,168 33 4.82 5 73.1 17.1 46.1 11,645 37,522 15,350 704 923<br />
DATA TABLES<br />
Total AIDS New AIDS AIDS Mental Unhealthy behaviour 2001 (%) Persons per Persons per Persons per Persons per Persons per<br />
patients patients incidence illness 2001 physician dentist pharmacist nurse hospital bed<br />
Location 1984-2002 Jan-Sep per 100,000 per 1,000 Male Female Total 2000 2000 2000 2000 2000<br />
2002 pop. pop.<br />
12 13 14 15 16 17 18 19 20 21 22 23<br />
133
Table 3. Education<br />
134<br />
Mean years<br />
of schooling 2001 No formal education 2001 Education attainment 2001 Enrolment rate 2000<br />
Location Male Female Average Male Female Total Primary Lower Upper Vocational Tertiary Lower secondary (%)<br />
secondary secondary<br />
Years Years Years Number Number Number % % % % % % Male Female Total<br />
1 2 3 4 5 6 7 8 9 10 11 12 13 14 15<br />
Kingdom 7.5 7.0 7.3 854,161 1,723,561 2,577,722 5.5 56.7 14.2 8.0 3.7 11.9 73.4 74.1 73.8<br />
Bangkok Metropolis 9.8 9.4 9.6 94,767 157,214 251,982 4.0 36.2 15.5 9.0 7.1 28.3 67.3 59.6 63.4<br />
Bangkok Vicinity 8.8 8.1 8.4 39,718 86,023 125,742 4.2 45.9 16.1 9.1 6.2 18.5 86.6 86.4 86.5<br />
Nakhon Pathom 7.4 6.9 7.1 12,370 27,862 40,232 5.9 58.1 13.2 7.6 3.7 11.4 88.5 79.1 83.7<br />
Nonthaburi 10.6 9.9 10.3 3,470 14,356 17,825 2.6 31.9 14.4 9.6 8.6 32.7 77.8 80.3 79.0<br />
Pathum Thani 9.1 8.5 8.8 2,469 8,513 10,982 2.4 42.5 17.8 11.0 6.7 19.4 100.0 101.3 100.6<br />
Samut Prakan 8.7 8.1 8.4 14,174 22,658 36,832 4.3 45.1 18.7 9.6 6.5 15.7 90.1 90.9 90.5<br />
Samut Sakon 7.7 6.8 7.2 7,236 12,635 19,871 5.7 56.1 16.6 6.8 4.5 10.2 72.9 82.7 77.5<br />
Central Region 7.6 6.6 7.1 19,881 89,263 109,144 4.8 56.8 15.5 7.7 5.0 10.2 83.6 80.8 82.3<br />
Chai Nat 6.9 6.1 6.4 3,896 14,944 18,840 6.4 63.0 12.5 6.5 3.6 8.0 63.0 67.1 65.0<br />
Phra Nakhon Si Ayutthaya 7.8 6.7 7.2 3,619 21,803 25,422 4.5 54.5 17.4 8.7 5.5 9.4 86.4 81.3 83.9<br />
Lop Buri 7.3 6.4 6.9 5,760 28,066 33,826 5.8 57.8 15.8 6.6 4.4 9.7 83.4 83.0 83.2<br />
Saraburi 8.3 7.3 7.8 3,887 10,312 14,199 3.5 50.6 16.0 10.2 5.9 13.7 90.7 80.3 85.6<br />
Sing Buri 7.4 6.4 6.9 1,108 7,713 8,821 4.6 60.6 13.9 6.7 4.4 9.8 89.2 88.1 88.7<br />
Ang Thong 7.4 6.6 7.0 1,612 6,424 8,035 3.8 59.7 13.8 6.4 6.4 9.9 85.7 87.2 86.4<br />
Eastern Region 7.5 6.8 7.2 45,622 112,002 157,624 5.1 56.8 15.8 7.8 4.4 10.1 87.5 89.8 88.6<br />
Chanthaburi 7.2 6.8 7.0 6,220 9,476 15,697 4.4 59.3 17.3 6.9 2.6 9.5 88.4 94.5 91.4<br />
Chachoengsao 7.5 6.4 6.9 8,419 21,984 30,403 6.2 56.4 16.3 7.4 4.8 8.8 87.5 88.7 88.1<br />
Chon Buri 8.2 7.5 7.8 7,700 23,682 31,382 3.9 50.2 18.2 9.0 6.1 12.6 103.3 101.3 102.3<br />
Trat 6.6 5.9 6.3 4,755 9,236 13,991 9.4 60.9 11.9 8.0 3.7 6.1 74.6 81.6 78.0<br />
Nakhon Nayok 7.0 6.1 6.5 3,421 8,100 11,521 5.8 64.7 11.1 7.1 3.7 7.7 79.1 84.8 81.7<br />
Prachin Buri 7.3 6.4 6.9 4,379 14,759 19,138 6.1 58.0 15.7 7.5 3.7 9.0 70.7 73.0 71.8<br />
Rayong 8.1 7.4 7.8 4,164 8,040 12,204 3.0 55.2 13.7 8.4 5.4 14.4 84.6 85.0 84.8<br />
Sa Kaeo 6.6 6.2 6.4 6,564 16,724 23,288 6.4 64.1 15.0 6.8 1.6 6.1 87.9 94.8 91.3<br />
Western Region 7.0 6.4 6.7 51,833 135,731 187,563 7.1 60.2 13.0 7.0 3.5 9.2 77.1 77.0 77.1<br />
Ratchaburi 6.9 6.4 6.7 11,062 30,894 41,956 6.7 60.8 13.8 5.6 3.9 9.1 77.1 77.4 77.2<br />
Kanchanaburi 6.8 6.4 6.6 15,741 37,160 52,901 10.3 56.6 12.4 7.9 2.9 9.9 74.0 73.3 73.7<br />
Suphan Buri 6.7 6.0 6.4 15,180 41,053 56,233 8.3 63.4 11.1 6.4 2.9 7.9 76.2 75.5 75.9<br />
Samutshongkhram 6.6 6.5 6.6 3,776 6,504 10,279 6.2 63.1 11.2 7.6 3.4 8.4 68.7 73.4 71.0<br />
Phetchaburi 7.4 6.9 7.1 3,285 7,844 11,129 3.3 60.1 13.6 8.2 3.6 11.1 85.1 86.8 85.9<br />
Prachuap Khiri khan 7.6 6.8 7.2 2,789 12,277 15,065 4.6 57.1 16.5 7.5 4.5 9.7 80.4 77.3 78.9<br />
Northeastern Region 6.9 6.5 6.7 141,823 285,670 427,493 2.8 66.8 13.4 7.9 2.0 7.0 70.0 71.2 70.6<br />
Nakon Ratchasima 7.1 6.6 6.8 17,381 58,318 75,699 3.9 62.3 14.8 9.3 2.6 7.2 66.4 72.3 69.2<br />
Buri Ram 6.5 6.2 6.4 22,278 31,984 54,263 5.1 66.8 12.1 8.5 1.9 5.6 67.2 68.8 68.0<br />
Surin 6.5 5.9 6.2 11,856 31,774 43,629 4.6 68.5 12.1 7.8 0.9 6.1 76.3 76.5 76.4<br />
Si Sa Ket 6.6 6.1 6.4 12,374 28,712 41,086 4.1 69.5 12.1 7.5 1.1 5.8 67.0 75.6 71.1<br />
Ubon Ratchathani 7.0 6.5 6.8 8,735 14,296 23,031 1.9 68.2 12.7 7.8 2.0 7.4 69.0 67.3 68.2<br />
Yasothon 7.2 6.8 7.0 3,048 2,021 5,069 1.2 66.9 12.3 8.1 2.5 9.0 61.0 77.3 68.3<br />
Chaiyaphum 6.7 6.3 6.5 3,113 15,002 18,116 2.2 70.7 13.1 6.5 2.3 5.3 70.4 74.7 72.5<br />
Amnat Charoen 6.6 6.3 6.4 2,200 1,665 3,864 1.5 73.1 12.8 6.5 1.2 4.9 70.2 72.3 71.2<br />
Nong Bua Lam Phu 7.0 6.4 6.7 3,084 6,278 9,362 2.8 68.2 13.6 8.2 0.9 6.4 66.7 67.3 67.0<br />
Khon Kaen 7.3 6.9 7.1 7,803 14,021 21,825 1.6 63.5 14.3 8.5 3.2 8.8 83.5 80.1 81.8<br />
<strong>THAILAND</strong> <strong>HUMAN</strong> <strong>DEVELOPMENT</strong> <strong>REPORT</strong> <strong>2003</strong>
Table 3 Education (Continued)<br />
Udon Thani 7.0 6.7 6.9 9,773 15,774 25,547 2.4 66.9 14.8 6.5 2.1 7.3 81.7 73.3 77.4<br />
Loei 6.9 6.5 6.7 11,526 13,573 25,099 5.7 62.1 15.2 8.5 3.0 5.4 83.4 76.1 79.7<br />
Nong Khai 6.8 6.5 6.6 9,085 9,983 19,067 3.1 67.4 14.4 7.9 2.6 4.7 67.8 64.5 66.2<br />
Maha Salakam 7.4 6.8 7.1 2,315 5,406 7,720 1.1 67.0 11.8 8.1 1.5 10.4 74.6 74.3 74.4<br />
Roi Et 7.0 6.5 6.8 1,535 6,791 8,326 0.9 69.6 13.1 7.1 1.7 7.6 38.9 35.2 37.1<br />
Kalasin 7.0 6.6 6.8 2,076 3,114 5,190 0.8 69.5 13.3 7.9 2.7 5.9 76.3 88.4 82.1<br />
Sakhon Nakhon 7.0 6.6 6.8 2,780 6,951 9,732 1.3 70.4 12.2 6.9 1.9 7.3 68.9 68.0 68.4<br />
Nakhon Phanom 7.1 6.6 6.9 5,983 14,671 20,654 4.2 63.6 14.1 9.1 1.0 7.9 65.6 67.3 66.4<br />
Mukdahan 7.3 6.8 7.0 4,879 5,335 10,214 5.1 58.8 16.5 8.4 1.9 9.5 83.5 88.3 85.9<br />
Northern Region 6.7 6.1 6.4 306,485 562,390 868,875 10.0 58.9 12.5 7.1 2.8 8.7 74.9 75.6 75.2<br />
Chiang Mai 6.8 6.6 6.7 57,898 80,742 138,640 11.7 52.1 13.9 7.5 3.1 11.7 89.0 88.0 88.5<br />
Lamphun 6.6 6.4 6.5 15,782 21,036 36,818 10.4 55.8 13.2 8.2 3.0 9.4 99.2 95.5 97.4<br />
Lampang 6.9 6.2 6.6 16,735 43,074 59,809 9.6 56.7 13.0 6.7 3.0 10.9 88.9 93.6 91.1<br />
Uttaradit 7.1 6.6 6.9 4,430 9,186 13,616 3.8 64.9 12.1 7.0 4.0 8.1 71.3 73.8 72.5<br />
Phrae 7.0 6.3 6.6 10,392 17,049 27,442 6.6 61.5 11.6 7.7 3.8 8.7 81.3 81.6 81.5<br />
Nan 6.2 5.3 5.8 24,294 38,489 62,783 18.8 52.5 10.8 8.4 2.1 7.4 99.0 94.0 96.6<br />
Phayao 6.4 5.8 6.2 19,828 27,570 47,398 12.0 58.7 11.3 9.9 1.5 6.7 86.7 82.6 84.6<br />
Chiang Rai 6.2 5.4 5.8 59,150 95,763 154,913 17.8 54.1 10.6 6.5 2.9 8.2 77.4 80.3 78.8<br />
Mae Hong Son 4.9 4.0 4.5 22,006 24,981 46,987 37.5 41.4 8.6 5.8 1.1 5.4 77.9 81.9 79.9<br />
Nakhon Sawan 7.1 6.3 6.7 9,314 47,052 56,366 6.5 59.5 13.7 7.3 2.6 10.5 64.7 61.8 63.3<br />
Uthai Thani 6.9 5.9 6.4 4,146 9,471 13,616 5.8 65.5 11.7 6.3 2.7 8.0 71.9 75.3 73.5<br />
Kamphaeng Phet 6.4 5.6 6.0 13,346 34,703 48,049 9.6 62.3 15.2 3.6 2.9 6.3 60.7 63.6 62.1<br />
Tak 6.2 5.4 5.8 17,615 22,652 40,267 15.4 55.9 12.6 6.4 2.7 6.9 79.1 83.2 81.1<br />
Sukhothai 6.4 5.9 6.1 4,264 12,760 17,025 3.8 72.6 9.9 5.6 2.8 5.3 64.5 66.2 65.3<br />
Phitsanulok 7.0 6.6 6.8 7,357 20,524 27,880 4.6 62.0 13.0 7.9 3.0 9.5 71.0 71.8 71.4<br />
Phichit 6.9 6.1 6.5 6,380 28,335 34,715 7.8 61.0 12.8 8.0 2.7 7.7 59.2 59.3 59.2<br />
Phetchabun 6.6 6.3 6.5 13,549 29,002 42,551 6.2 64.1 12.7 7.7 1.8 7.6 63.6 66.7 65.1<br />
Southern Region 7.4 6.9 7.1 154,031 295,268 449,300 7.7 53.2 15.5 8.8 4.1 10.7 70.1 77.1 73.5<br />
Nakhon Si Thammarat 7.6 7.1 7.4 13,198 40,080 53,277 4.7 54.0 15.8 8.8 4.9 11.9 67.5 73.0 70.2<br />
Krabi 7.1 6.7 6.9 3,984 10,349 14,333 6.5 57.4 17.3 7.2 4.5 7.1 73.1 87.5 79.7<br />
Phangnga 6.7 6.4 6.6 7,548 7,535 15,083 8.5 61.5 14.3 6.1 2.6 7.0 68.5 71.1 69.8<br />
Phuket 8.4 8.5 8.4 2,711 4,341 7,052 4.7 42.5 19.6 9.4 6.5 17.3 82.9 85.4 84.1<br />
Surat Thani 7.5 7.0 7.2 5,804 19,889 25,694 4.0 55.3 18.0 10.0 4.5 8.2 70.2 78.5 74.2<br />
Ranong 7.6 7.3 7.4 3,560 3,316 6,876 7.2 49.9 16.8 12.3 4.3 9.5 80.3 74.4 77.3<br />
Chumphon 7.5 6.8 7.2 2,166 7,790 9,957 3.1 57.2 17.6 9.9 4.1 8.1 70.1 76.4 73.1<br />
Songkhla 8.0 7.5 7.7 19,950 42,714 62,664 6.6 49.3 15.6 8.1 4.3 16.2 67.5 72.4 69.9<br />
Satun 7.2 6.7 6.9 4,365 8,340 12,705 7.3 57.5 14.4 9.1 3.9 7.7 79.0 87.6 83.1<br />
Trang 7.3 6.9 7.1 5,858 15,816 21,674 5.0 57.8 14.3 9.8 3.8 9.1 67.4 71.0 69.2<br />
Phattalung 7.4 6.8 7.1 4,066 8,925 12,991 3.6 60.2 15.2 7.7 4.9 8.4 63.8 69.7 66.7<br />
Pattani 6.6 6.0 6.3 28,581 46,283 74,864 17.5 49.8 12.6 7.5 1.9 10.7 76.0 83.2 79.6<br />
Yala 7.1 6.7 6.9 18,257 22,400 40,657 14.1 46.7 13.6 9.2 5.0 11.2 93.6 107.5 100.4<br />
Narathiwat 6.4 5.5 5.9 33,982 57,490 91,472 20.1 47.8 13.6 9.9 1.9 6.5 59.8 73.8 66.6<br />
DATA TABLES<br />
Mean years<br />
of schooling 2001 No formal education 2001 Education attainment 2001 Enrolment rate 2000<br />
Location Male Female Average Male Female Total Primary Lower Upper Vocational Tertiary Lower secondary (%)<br />
secondary secondary<br />
Years Years Years Number Number Number % % % % % % Male Female Total<br />
1 2 3 4 5 6 7 8 9 10 11 12 13 14 15<br />
135
Table 3. Education (continued)<br />
136<br />
Quality of education<br />
Enrolment rate 2000 Transition rate 2000 (average score) 1997 Students per teacher 1999 Students per class room 1999 Population<br />
higher secondary attending<br />
Location (%) Primary Lower secondary Lower Upper Lower Upper Vocational Lower Upper Vocational training 1999<br />
to Lower to Upper secondary secondary secondary secondary secondary secondary secondary<br />
Male Female Total secondary & vocational % % Number Number Number Number Number Number Per 1,000 pop.<br />
16 17 18 19 20 21 22 23 24 25 26 27 28 29<br />
Kingdom 50.2 54.0 52.0 94.9 87.8 45.5 36.4 20 20 28 35 39 35 15<br />
Bangkok Metropolis 66.4 50.6 58.2 98.5 116.8 49.6 43.3 26 26 35 39 40 44 11<br />
Bangkok Vicinity 49.6 53.9 51.8 98.6 79.9 46.6 36.7 22 20 26 39 37 35 16<br />
Nakhon Pathom 58.8 66.9 62.8 96.8 111.5 49.0 38.4 18 15 19 37 32 31 19<br />
Nonthaburi 41.0 55.8 48.5 108.1 72.3 47.1 37.9 19 15 16 38 39 38 24<br />
Pathum Thani 60.2 64.5 62.3 102.2 81.8 41.2 33.7 21 20 24 37 37 29 16<br />
Samut Prakan 45.6 45.9 45.7 101.8 65.2 47.1 36.1 23 22 30 41 39 31 9<br />
Samut Sakon 42.0 34.9 38.3 79.2 72.9 48.5 37.2 26 23 32 40 37 35 8<br />
Central Region 59.9 63.3 61.5 97.8 96.3 44.0 37.1 17 18 23 33 35 32 15<br />
Chai Nat 42.1 46.9 44.4 93.5 85.0 41.8 33.0 15 19 31 30 35 35 8<br />
Phra Nakhon Si Ayutthaya 58.0 60.3 59.1 94.8 90.1 46.7 39.7 18 14 23 32 34 33 23<br />
Lop Buri 66.1 71.2 68.6 101.0 112.8 49.3 36.1 22 19 20 39 38 31 4<br />
Saraburi 56.0 55.4 55.7 92.8 90.3 43.3 37.0 21 21 24 36 35 34 23<br />
Sing Buri 71.2 78.0 74.4 107.0 97.0 40.8 39.9 14 18 20 27 34 24 17<br />
Ang Thong 70.4 78.1 74.0 106.0 98.0 42.2 36.9 15 18 21 32 34 37 10<br />
Eastern Region 54.0 62.6 58.2 94.2 89.3 45.9 36.1 20 22 22 35 36 32 20<br />
Chanthaburi 48.1 62.7 55.2 87.3 93.9 44.6 38.5 21 23 18 35 38 31 13<br />
Chachoengsao 47.9 55.5 51.6 96.6 83.3 42.4 36.5 19 18 19 34 33 34 35<br />
Chon Buri 69.7 75.2 72.4 100.7 104.7 46.2 39.3 21 18 27 37 35 33 27<br />
Trat 50.2 64.3 56.9 64.8 86.4 50.0 36.5 19 25 18 33 33 32 6<br />
Nakhon Nayok 54.3 64.9 59.2 97.3 80.2 44.9 35.9 16 22 19 34 38 31 25<br />
Prachin Buri 50.3 56.2 53.2 97.0 87.5 44.1 31.5 21 20 29 33 35 32 16<br />
Rayong 48.0 55.0 51.4 105.4 91.6 48.4 38.7 22 21 19 37 37 33 14<br />
Sa Kaeo 47.0 58.4 52.4 87.9 67.7 46.4 31.8 24 29 25 33 36 29 4<br />
Western Region 49.1 56.3 52.6 89.3 98.9 42.9 37.7 19 21 23 34 37 32 17<br />
Ratchaburi 52.2 60.7 56.4 90.8 89.9 39.8 37.8 19 22 23 37 38 34 22<br />
Kanchanaburi 44.9 49.4 47.1 84.0 89.3 45.7 38.0 21 25 21 33 38 32 14<br />
Suphan Buri 47.4 56.6 51.9 88.1 129.2 42.4 38.6 23 23 26 35 38 35 20<br />
Samutshongkhram 53.0 54.9 53.9 91.8 98.5 42.2 37.1 16 17 22 34 35 30 19<br />
Phetchaburi 53.9 69.7 61.6 95.3 103.9 42.7 37.6 18 19 19 34 36 34 17<br />
Prachuap Khiri khan 46.4 46.6 46.5 91.7 75.1 44.4 36.9 19 20 27 31 35 26 5<br />
Northeastern Region 43.4 48.2 45.7 95.2 76.8 45.6 33.2 20 23 24 33 35 33 11<br />
Nakon Ratchasima 40.4 50.2 45.1 102.3 80.7 43.8 32.4 20 20 26 33 31 34 7<br />
Buri Ram 39.8 46.6 43.1 92.9 76.2 44.2 31.0 18 26 19 32 37 25 19<br />
Surin 48.4 51.0 49.6 96.8 67.9 48.4 35.7 21 24 23 35 35 33 9<br />
Si Sa Ket 45.3 55.3 50.0 96.2 66.6 44.2 32.5 21 26 26 32 37 29 10<br />
Ubon Ratchathani 38.9 43.1 41.0 81.6 94.9 43.6 35.0 20 20 26 32 36 36 14<br />
Yasothon 40.9 51.6 46.0 90.4 70.7 44.5 34.6 18 22 32 32 37 36 19<br />
Chaiyaphum 27.4 33.5 30.3 88.6 71.9 47.0 33.2 21 22 31 33 34 37 6<br />
Amnat Charoen 45.8 46.4 46.1 88.9 74.8 45.3 32.4 21 25 21 31 34 38 10<br />
Nong Bua Lam Phu 29.8 33.2 31.5 93.6 58.1 47.4 30.7 23 28 34 34 36 25 5<br />
Khon Kaen 59.5 57.7 58.6 103.6 86.5 46.1 36.4 19 21 15 33 36 38 15<br />
<strong>THAILAND</strong> <strong>HUMAN</strong> <strong>DEVELOPMENT</strong> <strong>REPORT</strong> <strong>2003</strong>
Table 3 Education<br />
Quality of education<br />
Enrolment rate 2000 Transition rate 2000 (average score) 1997 Students per teacher 1999 Students per class room 1999 Population<br />
higher secondary attending<br />
Location (%) Primary Lower secondary Lower Upper Lower Upper Vocational Lower Upper Vocational training 1999<br />
to Lower to Upper secondary secondary secondary secondary secondary secondary secondary<br />
Male Female Total secondary & vocational % % Number Number Number Number Number Number Per 1,000 pop.<br />
16 17 18 19 20 21 22 23 24 25 26 27 28 29<br />
Udon Thani 42.6 43.5 43.0 99.0 70.0 44.5 36.8 23 21 25 34 37 38 12<br />
Loei 46.2 48.8 47.5 99.6 66.9 44.0 33.4 18 21 26 32 35 33 7<br />
Nong Khai 38.4 37.5 37.9 91.2 78.1 50.1 33.5 21 22 29 34 36 36 8<br />
Maha Salakam 51.2 55.8 53.4 103.5 79.1 47.1 31.4 20 23 23 33 37 31 13<br />
Roi Et 46.5 52.4 49.4 91.3 73.6 41.7 32.3 18 22 21 37 37 33 21<br />
Kalasin 46.4 53.9 50.0 97.0 83.8 44.4 31.0 20 23 20 32 34 34 7<br />
Sakhon Nakhon 41.7 45.6 43.7 93.0 71.7 42.8 33.7 16 18 23 33 37 24 8<br />
Nakhon Phanom 42.6 46.3 44.4 96.0 88.1 49.1 33.1 20 25 18 32 35 33 8<br />
Mukdahan 51.6 61.1 56.4 96.1 81.2 47.3 32.1 19 21 25 32 33 35 21<br />
Northern Region 51.6 58.6 55.0 93.6 86.3 45.6 36.8 18 21 24 32 36 34 17<br />
Chiang Mai 71.9 72.6 72.2 95.3 97.1 48.4 43.8 17 19 20 33 38 32 6<br />
Lamphun 78.8 80.9 79.8 100.6 113.3 48.6 38.3 16 19 24 34 32 34 19<br />
Lampang 68.9 74.1 71.4 97.8 79.9 46.3 39.4 21 16 18 36 35 37 41<br />
Uttaradit 46.6 54.4 50.4 95.4 87.3 40.0 37.6 17 21 27 32 36 40 7<br />
Phrae 63.0 96.8 79.1 97.6 96.8 43.3 41.7 17 21 17 32 39 35 18<br />
Nan 76.9 77.6 77.2 94.8 88.2 48.4 37.8 17 22 25 34 42 32 23<br />
Phayao 61.2 67.4 64.2 96.2 99.0 44.6 38.9 18 23 32 34 37 36 36<br />
Chiang Rai 49.6 57.9 53.6 90.1 75.6 45.9 38.3 19 23 31 34 35 34 22<br />
Mae Hong Son 39.1 43.3 41.2 82.1 87.1 41.8 32.5 20 22 18 29 35 33 6<br />
Nakhon Sawan 42.3 50.3 46.3 91.6 83.9 45.2 37.1 20 19 27 32 36 34 18<br />
Uthai Thani 52.3 55.2 53.8 92.3 82.2 45.2 39.5 20 22 26 31 34 32 30<br />
Kamphaeng Phet 32.0 39.2 35.5 84.4 73.1 46.4 35.0 18 23 30 33 35 31 7<br />
Tak 48.3 50.9 49.6 92.0 92.6 51.6 34.7 18 26 16 30 38 38 14<br />
Sukhothai 29.8 43.4 36.5 96.7 75.7 47.8 35.7 20 20 31 33 38 37 10<br />
Phitsanulok 50.8 56.4 53.5 97.4 97.0 45.2 31.6 15 17 22 30 36 31 21<br />
Phichit 43.4 48.0 45.6 92.7 84.1 42.2 35.2 16 20 25 31 32 31 15<br />
Phetchabun 38.8 46.1 42.4 93.2 72.7 44.2 28.7 20 21 20 32 37 35 9<br />
Southern Region 49.3 58.8 54.0 94.1 95.5 43.1 35.7 19 20 23 35 36 32 24<br />
Nakhon Si Thammarat 48.2 61.9 54.8 101.3 83.1 42.9 31.3 19 19 19 35 37 36 9<br />
Krabi 50.6 61.0 55.6 75.2 90.8 41.5 37.1 24 23 21 34 35 35 21<br />
Phangnga 43.2 45.6 44.4 84.1 78.8 45.7 36.0 19 19 27 32 34 30 17<br />
Phuket 73.3 84.6 79.0 100.3 132.6 48.7 38.8 22 18 35 34 38 36 49<br />
Surat Thani 44.4 56.1 50.1 90.8 87.9 41.9 35.5 20 21 24 35 37 32 31<br />
Ranong 57.1 54.3 55.7 88.0 85.5 42.0 36.8 18 25 23 31 32 26 4<br />
Chumphon 50.9 55.2 53.0 90.3 97.5 42.3 33.7 19 20 22 34 34 35 20<br />
Songkhla 50.7 59.8 55.2 89.7 99.0 40.6 34.6 17 17 25 36 36 32 31<br />
Satun 53.4 63.0 58.1 96.0 92.2 39.4 32.7 17 18 21 38 36 30 20<br />
Trang 55.6 63.8 59.6 90.1 99.6 46.5 34.0 20 20 22 35 37 32 9<br />
Phattalung 49.3 63.6 56.1 93.4 98.4 41.5 37.4 15 16 23 33 33 37 26<br />
Pattani 46.1 53.7 50.1 102.4 99.3 48.6 40.1 23 20 19 37 38 23 26<br />
Yala 65.0 55.6 60.3 119.8 167.3 42.1 39.1 22 20 18 37 36 34 28<br />
Narathiwat 34.1 48.2 40.9 85.5 88.5 39.8 32.4 18 20 16 34 35 23 46<br />
DATA TABLES<br />
137
Table 4. Employment<br />
138<br />
Employment 2001<br />
Population 2001 Population over 15 years 2001<br />
Location No. of employed persons<br />
Male Female Total Male Female Total Male Female Total<br />
1 2 3 4 5 6 7 8 9<br />
Kingdom 31,390,697 31,610,442 63,001,140 23,355,399 23,778,982 47,134,381 18,470,993 15,012,732 33,483,724<br />
Bangkok Metropolis 3,720,062 4,065,604 7,785,666 2,995,234 3,342,775 6,338,009 2,240,648 2,039,292 4,279,940<br />
Bangkok Vicinity 1,859,901 1,951,113 3,811,014 1,453,115 1,550,866 3,003,981 1,135,743 983,801 2,119,544<br />
Nakhon Pathom 429,932 454,500 884,431 323,889 352,411 676,300 262,891 240,724 503,615<br />
Nonthaburi 405,280 430,014 835,293 324,144 349,951 674,094 238,456 205,325 443,781<br />
Pathum Thani 289,790 296,928 586,717 225,263 233,164 458,427 168,005 134,365 302,370<br />
Samut Prakan 518,471 541,280 1,059,750 412,049 437,021 849,069 328,875 279,037 607,912<br />
Samut Sakon 216,429 228,393 444,822 167,771 178,320 346,091 137,516 124,351 261,867<br />
Central Region 1,437,726 1,487,208 2,924,934 1,103,534 1,160,765 2,264,299 820,192 694,230 1,514,423<br />
Chai Nat 181,967 193,226 375,193 140,700 152,304 293,004 105,105 94,690 199,795<br />
Phra Nakhon Si Ayutthaya 357,514 378,999 736,513 273,508 297,649 571,157 192,226 159,531 351,75<br />
Lop Buri 382,312 375,527 757,838 295,375 290,621 585,996 228,509 190,485 418,994<br />
Saraburi 267,450 266,756 534,206 204,906 205,200 410,106 156,186 119,582 275,768<br />
Sing Buri 116,388 128,264 244,652 89,672 101,998 191,670 65,426 60,262 125,688<br />
Ang Thong 132,096 144,437 276,533 99,374 112,994 212,368 72,742 69,680 142,421<br />
Eastern Region 2,037,623 1,991,461 4,029,084 1,551,199 1,518,280 3,069,479 1,245,635 959,661 2,205,296<br />
Chanthaburi 233,588 225,179 458,767 180,421 172,935 353,356 151,732 110,443 262,175<br />
Chachoengsao 319,708 323,694 643,402 240,635 246,285 486,920 190,467 150,214 340,681<br />
Chon Buri 512,275 499,425 1,011,699 404,232 397,509 801,740 318,803 247,108 565,911<br />
Trat 103,299 96,912 200,211 77,441 70,997 148,438 66,319 43,262 109,581<br />
Nakhon Nayok 129,282 134,597 263,879 97,024 101,477 198,501 72,100 60,288 132,389<br />
Prachin Buri 212,253 206,902 419,155 158,039 154,046 312,085 126,916 104,887 231,802<br />
Rayong 269,100 262,445 531,545 206,103 200,791 406,894 167,152 124,441 291,592<br />
Sa Kaeo 258,119 242,309 500,428 187,305 174,241 361,546 152,146 119,019 271,165<br />
Western Region 1,719,054 1,778,290 3,497,343 1,287,772 1,357,469 2,645,241 1,020,138 886,833 1,906,971<br />
Ratchaburi 397,619 416,563 814,181 300,876 323,403 624,279 237,530 216,719 454,249<br />
Kanchanaburi 350,200 346,518 696,718 257,311 256,405 513,716 205,949 174,379 380,328<br />
Suphan Buri 427,775 455,495 883,269 322,098 352,557 674,655 252,779 215,708 468,488<br />
Samutshongkhram 102,005 111,405 213,410 77,693 86,789 164,482 57,483 55,852 113,335<br />
Phetchaburi 216,676 226,961 443,637 163,551 174,835 338,386 127,311 112,095 239,406<br />
Prachuap Khiri khan 224,780 221,349 446,129 166,244 163,481 329,725 139,086 112,080 251,166<br />
Northeastern Region 10,684,649 10,528,244 21,212,893 7,675,854 7,585,409 15,261,264 6,153,164 4,725,452 10,878,616<br />
Nakon Ratchasima 1,343,556 1,330,504 2,674,061 979,550 971,227 1,950,776 793,243 618,242 1,411,484<br />
Buri Ram 760,358 748,095 1,508,453 537,179 531,177 1,068,355 406,665 303,045 709,711<br />
Surin 676,130 673,047 1,349,176 472,781 476,901 949,682 387,030 290,682 677,711<br />
Si Sa Ket 710,078 714,786 1,424,863 499,802 507,007 1,006,808 432,375 363,758 796,133<br />
Ubon Ratchathani 867,955 844,922 1,712,878 617,524 605,993 1,223,517 487,872 378,803 866,675<br />
Yasothon 293,680 293,562 587,242 211,590 210,424 422,014 179,824 136,252 316,076<br />
Chaiyaphum 566,937 558,338 1,125,274 421,217 415,477 836,693 352,616 294,913 647,528<br />
Amnat Charoen 182,825 180,441 363,266 129,054 128,393 257,447 106,265 84,059 190,324<br />
Nong Bua Lam Phu 245,511 237,998 483,509 173,085 166,986 340,071 137,312 101,039 238,350<br />
Khon Kaen 914,945 907,153 1,822,099 674,571 674,361 1,348,931 511,070 399,273 910,343<br />
<strong>THAILAND</strong> <strong>HUMAN</strong> <strong>DEVELOPMENT</strong> <strong>REPORT</strong> <strong>2003</strong>
Table 4 Employment (Continued)<br />
Employment 2001<br />
Population 2001 Population over 15 years 2001<br />
Location No. of employed persons<br />
Udon Thani 747,517 726,720 1,474,236 533,367 522,203 1,055,569 397,710 290,767 688,477<br />
Loei 307,500 287,973 595,473 229,608 208,431 438,039 184,436 133,847 318,282<br />
Nong Khai 452,918 436,680 889,598 319,917 304,620 624,537 246,145 154,820 400,965<br />
Maha Salakam 488,151 494,910 983,060 356,038 366,224 722,262 294,456 251,042 545,498<br />
Roi Et 631,751 627,572 1,259,322 457,925 459,414 917,338 372,149 281,709 653,858<br />
Kalasin 473,381 461,348 934,728 344,102 334,371 678,473 264,421 191,547 455,968<br />
Sakhon Nakhon 525,808 517,376 1,043,184 369,956 362,180 732,136 312,171 219,454 531,625<br />
Nakhon Phanom 347,066 344,783 691,848 244,911 241,545 486,456 196,846 161,435 358,281<br />
Mukdahan 148,584 142,040 290,624 103,682 98,479 202,161 90,559 70,767 161,325<br />
Northern Region 5,695,549 5,611,240 11,306,789 4,385,476 4,332,925 8,718,401 3,501,628 2,824,495 6,326,123<br />
Chiang Mai 750,802 719,335 1,470,138 604,025 578,237 1,182,261 469,590 385,590 855,180<br />
Lamphun 225,156 217,479 442,635 181,879 173,127 355,006 147,199 129,197 276,396<br />
Lampang 400,623 386,162 786,784 318,495 306,188 624,683 250,036 192,601 442,637<br />
Uttaradit 229,805 234,035 463,840 177,227 181,445 358,672 140,247 111,362 251,609<br />
Phrae 262,431 258,521 520,952 208,098 205,016 413,114 173,475 137,127 310,602<br />
Nan 224,346 215,599 439,945 171,020 163,608 334,628 146,919 113,205 260,124<br />
Phayao 260,284 244,555 504,839 204,462 190,757 395,219 162,655 120,947 283,602<br />
Chiang Rai 573,928 544,114 1,118,041 450,763 420,596 871,359 366,576 272,374 638,949<br />
Mae Hong Son 91,109 83,952 175,061 65,071 60,188 125,259 57,236 45,187 102,424<br />
Nakhon Sawan 550,375 565,864 1,116,238 420,356 440,943 861,299 342,355 297,495 639,850<br />
Uthai Thani 153,494 158,458 311,952 115,162 121,481 236,643 89,755 79,449 169,204<br />
Kamphaeng Phet 342,721 341,478 684,199 251,214 251,682 502,896 206,305 158,669 364,974<br />
Tak 182,049 175,398 357,447 133,530 127,368 260,898 110,303 83,423 193,727<br />
Sukhothai 291,252 301,895 593,147 220,504 233,020 453,524 176,822 156,492 333,315<br />
Phitsanulok 404,542 403,511 808,053 304,590 306,910 611,500 228,571 184,166 412,737<br />
Phichit 285,683 302,056 587,739 213,634 231,696 445,330 168,948 137,259 306,207<br />
Phetchabun 466,952 458,831 925,782 345,449 340,666 686,115 264,635 219,950 484,585<br />
Southern Region 4,236,134 4,197,282 8,433,416 2,903,214 2,930,494 5,833,708 2,353,844 1,898,967 4,252,811<br />
Nakhon Si Thammarat 838,098 834,683 1,672,780 563,485 578,776 1,142,260 433,208 368,556 801,764<br />
Krabi 169,660 163,272 332,932 110,867 109,781 220,648 93,710 72,271 165,981<br />
Phangnga 129,007 124,506 253,513 89,424 87,660 177,084 77,198 50,575 127,773<br />
Phuket 102,436 101,896 204,332 74,284 74,559 148,843 59,376 44,724 104,100<br />
Surat Thani 450,634 450,737 901,370 315,299 323,117 638,416 261,313 214,807 476,120<br />
Ranong 73,332 66,997 140,329 50,275 44,872 95,147 41,517 22,119 63,636<br />
Chumphon 229,833 224,820 454,653 163,615 160,996 324,611 136,913 105,099 242,013<br />
Songkhla 667,003 670,098 1,337,100 468,326 483,052 951,378 368,085 317,279 685,364<br />
Satun 131,625 129,389 261,014 86,775 86,205 172,980 73,622 55,142 128,764<br />
Trang 313,592 316,758 630,350 211,847 218,331 430,178 181,967 157,205 339,173<br />
Phattalung 261,101 266,340 527,441 179,475 183,392 362,867 155,704 131,847 287,551<br />
Pattani 315,028 312,190 627,217 212,136 215,457 427,593 170,938 133,945 304,883<br />
Yala 213,457 206,221 419,678 146,760 140,794 287,554 116,906 86,998 203,904<br />
Narathiwat 341,331 329,378 670,708 230,648 223,504 454,152 183,386 138,400 321,786<br />
DATA TABLES<br />
Male Female Total Male Female Total Male Female Total<br />
1 2 3 4 5 6 7 8 9<br />
139
Table 4. Employment (continued)<br />
140<br />
Employment 2001<br />
Location Unemployment Current labour force Unemployment No. of underemployed Underemployment<br />
Labour having<br />
social security 2001<br />
rate rate %<br />
Number Number Male Female Total<br />
10 11 12 13 14 15 16 17<br />
Kingdom 896,308 34,380,032 2.6 482,032 280,177 762,208 2.3 17.1<br />
Bangkok Metropolis 151,071 4,431,011 3.4 20,767 10,336 31,103 0.7 47.5<br />
Bangkok Vicinity 62,125 2,181,669 2.8 8,138 7,083 15,222 0.7 62.9<br />
Nakhon Pathom 10,075 513,690 2.0 2,262 1,401 3,664 0.7 29.4<br />
Nonthaburi 11,613 455,394 2.6 308 564 871 0.2 28.5<br />
Pathum Thani 8,302 310,672 2.7 318 419 737 0.2 78.2<br />
Samut Prakan 26,215 634,127 4.1 3,549 3,019 6,568 1.1 91.6<br />
Samut Sakon 5,920 267,787 2.2 1,701 1,680 3,381 1.3 99.6<br />
Central Region 42,783 1,557,206 2.7 27,620 13,392 41,011 2.7 24.6<br />
Chai Nat 7,185 206,979 3.5 6,901 4,308 11,209 5.6 4.3<br />
Phra Nakhon Si Ayutthaya 12,965 364,722 3.6 2,626 2,284 4,910 1.4 53.6<br />
Lop Buri 14,500 433,494 3.3 11,334 3,814 15,148 3.6 11.5<br />
Saraburi 4,528 280,295 1.6 3,604 606 4,211 1.5 39.1<br />
Sing Buri 2,025 127,713 1.6 375 274 650 0.5 9.3<br />
Ang Thong 1,581 144,002 1.1 2,778 2,106 4,884 3.4 5.4<br />
Eastern Region 36,743 2,242,039 1.6 7,642 6,912 14,554 0.7 29.1<br />
Chanthaburi 1,871 264,046 0.7 347 347 0.1 7.1<br />
Chachoengsao 8,310 348,990 2.4 66 390 456 0.1 32.3<br />
Chon Buri 7,322 573,233 1.3 192 192 0.0 49.7<br />
Trat 724 110,305 0.7 - 4.3<br />
Nakhon Nayok 3,240 135,628 2.4 961 735 1,696 1.3 6.9<br />
Prachin Buri 5,638 237,441 2.4 1,788 2,397 4,185 1.8 30.0<br />
Rayong 6,656 298,249 2.2 4,826 2,852 7,678 2.6 47.9<br />
Sa Kaeo 2,982 274,147 1.1 - 2.9<br />
Western Region 30,026 1,936,997 1.6 23,357 22,196 45,553 2.4 9.2<br />
Ratchaburi 12,217 466,466 2.6 9,403 7,863 17,266 3.8 12.9<br />
Kanchanaburi 10,095 390,423 2.6 4,702 7,608 12,310 3.2 7.0<br />
Suphan Buri 671 469,159 0.1 6,510 4,432 10,942 2.3 4.3<br />
Samutshongkhram 833 114,167 0.7 423 307 730 0.6 7.0<br />
Phetchaburi 2,423 241,829 1.0 - 9.9<br />
Prachuap Khiri khan 3,788 254,954 1.5 2,319 1,987 4,306 1.7 15.3<br />
Northeastern Region 356,601 11,235,217 3.2 239,510 121,236 360,746 3.3 3.4<br />
Nakon Ratchasima 51,588 1,463,072 3.5 20,217 5,415 25,632 1.8 9.1<br />
Buri Ram 21,548 731,259 2.9 14,993 3,195 18,188 2.6 2.1<br />
Surin 5,692 683,404 0.8 1,946 1,579 3,525 0.5 1.8<br />
Si Sa Ket 29,732 825,865 3.6 20,547 13,632 34,179 4.3 0.9<br />
Ubon Ratchathani 26,031 892,707 2.9 2,401 281 2,682 0.3 2.9<br />
Yasothon 9,128 325,204 2.8 3,252 1,498 4,750 1.5 1.6<br />
Chaiyaphum 14,018 661,547 2.1 22,402 19,212 41,614 6.4 1.8<br />
Amnat Charoen 10,271 200,595 5.1 8,151 4,629 12,781 6.7 1.4<br />
Nong Bua Lam Phu 16,994 255,345 6.7 4,394 3,865 8,258 3.5 1.7<br />
Khon Kaen 32,289 942,632 3.4 23,203 10,226 33,429 3.7 7.1<br />
<strong>THAILAND</strong> <strong>HUMAN</strong> <strong>DEVELOPMENT</strong> <strong>REPORT</strong> <strong>2003</strong>
Table 4 Employment<br />
Employment 2001<br />
Location Unemployment Current labour force Unemployment No. of underemployed Underemployment<br />
Labour having<br />
social security 2001<br />
rate rate %<br />
Number Number Male Female Total<br />
10 11 12 13 14 15 16 17<br />
Udon Thani 54,126 742,603 7.3 41,007 25,784 66,790 9.7 4.5<br />
Loei 9,374 327,657 2.9 5,314 1,785 7,099 2.2 2.2<br />
Nong Khai 6,969 407,934 1.7 8,579 1,140 9,719 2.4 2.0<br />
Maha Salakam 3,646 549,144 0.7 2,137 1,612 3,749 0.7 1.9<br />
Roi Et 22,623 676,482 3.3 18,721 9,686 28,406 4.3 1.9<br />
Kalasin 4,957 460,924 1.1 2,618 418 3,036 0.7 2.2<br />
Sakhon Nakhon 17,287 548,912 3.1 17,770 4,420 22,190 4.2 1.7<br />
Nakhon Phanom 19,019 377,301 5.0 15,772 10,550 26,322 7.3 1.4<br />
Mukdahan 1,307 162,633 0.8 6,086 2,310 8,396 5.2 2.6<br />
Northern Region 125,681 6,451,803 1.9 73,520 44,546 118,066 1.9 5.9<br />
Chiang Mai 23,508 878,688 2.7 15,096 13,396 28,492 3.3 12.8<br />
Lamphun 4,562 280,958 1.6 1,559 1,054 2,613 0.9 17.8<br />
Lampang 7,366 450,003 1.6 3,029 235 3,264 0.7 8.3<br />
Uttaradit 5,861 257,470 2.3 - 3.3<br />
Phrae 5,549 316,151 1.8 9,327 8,150 17,476 5.6 3.0<br />
Nan 2,188 262,312 0.8 611 1,470 2,081 0.8 2.5<br />
Phayao 2,564 286,166 0.9 2,381 1,580 3,960 1.4 2.8<br />
Chiang Rai 9,268 648,217 1.4 16,546 4,011 20,556 3.2 4.3<br />
Mae Hong Son 879 103,303 0.9 859 419 1,278 1.2 2.5<br />
Nakhon Sawan 15,178 655,028 2.3 5,573 1,993 7,567 1.2 4.9<br />
Uthai Thani 683 169,886 0.4 48 48 0.0 3.5<br />
Kamphaeng Phet 15,233 380,207 4.0 9,140 2,978 12,118 3.3 2.6<br />
Tak 3,924 197,650 2.0 904 551 1,454 0.8 6.4<br />
Sukhothai 4,604 337,919 1.4 4,528 4,792 9,320 2.8 2.4<br />
Phitsanulok 6,263 419,000 1.5 87 87 0.0 7.2<br />
Phichit 3,956 310,163 1.3 749 62 811 0.3 2.8<br />
Phetchabun 14,095 498,680 2.8 3,132 3,809 6,940 1.4 2.5<br />
Southern Region 91,278 4,344,089 2.1 81,478 54,475 135,953 3.2 9.4<br />
Nakhon Si Thammarat 26,620 828,384 3.2 13,253 17,611 30,865 3.8 4.2<br />
Krabi 1,305 167,286 0.8 4,967 3,171 8,137 4.9 10.7<br />
Phangnga 3,404 131,176 2.6 20,569 12,632 33,201 26.0 5.2<br />
Phuket 1,888 105,988 1.8 448 351 799 0.8 55.8<br />
Surat Thani 3,866 479,986 0.8 1,903 1,483 3,386 0.7 11.6<br />
Ranong 1,143 64,779 1.8 873 15 888 1.4 9.7<br />
Chumphon 1,673 243,686 0.7 63 63 0.0 7.0<br />
Songkhla 11,091 696,455 1.6 2,488 457 2,945 0.4 18.7<br />
Satun 3,565 132,329 2.7 7,785 4,443 12,228 9.5 4.3<br />
Trang 4,863 344,036 1.4 2,618 283 2,901 0.9 8.4<br />
Phattalung 9,925 297,476 3.3 13,613 6,643 20,256 7.0 2.1<br />
Pattani 7,640 312,523 2.4 5,964 3,564 9,528 3.1 4.8<br />
Yala 2,875 206,779 1.4 1,017 1,776 2,793 1.4 6.9<br />
Narathiwat 11,420 333,207 3.4 5,918 2,046 7,964 2.5 2.8<br />
DATA TABLES<br />
141
142<br />
Table 5. Income<br />
Household income 2000 (Baht/month) Household<br />
Household Household expenditure Household Poverty Number<br />
Location income Male Female income (Baht/month) expenditure incidence of<br />
1998 headed headed Household change % change % 2000 Poor<br />
(Baht/month) households households income 1998-2000 1998 2000 1998-2000 % 2000<br />
1 2 3 4 5 6 7 8 9 10<br />
Kingdom 12,765 12,416 10,760 11,988 -6.09 9,275 8,558 -0.08 14.2 8,891,459<br />
Bangkok Metropolis 25,790 28,392 22,691 26,831 4.04 17,732 17,413 -0.02 0.3 19,910<br />
Bangkok Vicinity 19,262 19,439 15,974 18,509 -3.91 13,563 13,553 -0.00 1.4 50,486<br />
Nakhon Pathom 15,861 20,026 13,249 18,205 14.78 12,485 13,121 0.05 1.3 11,125<br />
Nonthaburi 25,118 25,933 20,751 24,393 -2.88 18,372 16,606 -0.10 0.1 407<br />
Pathum Thani 20,720 20,573 15,479 19,160 -7.53 13,457 15,203 0.13 2.0 11,195<br />
Samut Prakan 17,973 15,704 15,563 15,672 -12.80 12,284 12,138 -0.01 0.6 6,109<br />
Samut Sakon 16,893 13,857 13,309 13,694 -18.93 10,553 9,765 -0.07 5.1 22,057<br />
Central Region 11,473 12,641 12,132 12,464 8.63 8,985 8,921 -0.01 6.1 177,450<br />
Chai Nat 10,403 9,618 18,805 12,475 19.91 8,473 7,702 -0.09 8.7 32,692<br />
Phra Nakhon Si Ayutthaya 13,045 15,890 13,295 14,812 13.55 10,415 10,405 -0.00 4.9 35,980<br />
Lop Buri 10,474 10,705 9,945 10,474 0.00 8,336 8,002 -0.04 8.2 62,020<br />
Saraburi 12,768 13,254 10,310 12,286 -3.77 9,488 9,042 -0.05 3.2 17,271<br />
Sing Buri 10,592 12,595 10,868 11,876 12.12 7,908 9,228 0.17 6.4 15,632<br />
Ang Thong 10,354 14,048 9,396 12,523 20.95 8,071 8,800 0.09 5.0 13,855<br />
Eastern Region 12,178 12,480 10,874 11,991 -1.53 9,893 9,447 -0.05 5.2 207,735<br />
Chanthaburi 15,203 11,973 8,502 11,162 -26.58 10,861 8,759 -0.19 7.4 33,788<br />
Chachoengsao 13,019 13,875 12,860 13,482 3.55 11,280 11,131 -0.01 0.4 2,319<br />
Chon Buri 13,851 14,429 12,703 13,778 -0.53 11,886 11,361 -0.04 0.1 501<br />
Trat 11,736 7,546 6,895 7,391 -37.02 7,788 6,983 -0.10 15.0 29,743<br />
Nakhon Nayok 11,110 12,432 10,790 11,977 7.80 8,653 9,037 0.04 4.8 12,586<br />
Prachin Buri 9,609 11,449 7,743 10,300 7.18 7,606 8,715 0.15 2.2 9,051<br />
Rayong 12,598 15,655 11,631 14,727 16.90 9,872 9,061 -0.08 1.3 6,718<br />
Sa Kaeo 6,845 8,152 7,655 8,035 17.40 6,220 6,511 0.05 22.9 113,531<br />
Western Region 12,461 14,310 9,801 12,849 3.11 8,551 7,941 -0.07 6.1 210,805<br />
Ratchaburi 13,206 17,365 11,043 14,717 11.44 9,881 10,152 0.03 1.7 13,558<br />
Kanchanaburi 12,829 13,447 7,620 11,578 -9.75 8,342 7,218 -0.13 10.2 71,099<br />
Suphan Buri 12,122 14,820 9,235 13,331 9.97 8,061 5,839 -0.28 7.7 67,555<br />
Samutshongkhram 11,239 13,091 12,416 12,856 14.38 9,196 10,366 0.13 0.1 116<br />
Phetchaburi 14,003 13,307 9,977 12,387 -11.54 8,061 8,086 0.00 3.8 16,762<br />
Prachuap Khiri khan 10,246 11,302 9,541 10,761 5.03 7,736 7,944 0.03 9.4 41,716<br />
Northeastern Region 8,411 7,823 6,871 7,604 -9.58 6,307 5,766 -0.09 28.1 5,930,040<br />
Nakon Ratchasima 9,464 8,334 8,393 8,348 -11.80 6,089 5,819 -0.04 21.3 565,731<br />
Buri Ram 8,192 8,122 7,894 8,069 -1.51 5,913 5,873 -0.01 25.8 386,432<br />
Surin 6,313 6,461 5,069 6,148 -2.62 5,639 4,615 -0.18 41.0 550,231<br />
Si Sa Ket 7,363 7,658 6,250 7,319 -0.60 6,286 5,401 -0.14 26.5 375,275<br />
Ubon Ratchathani 9,897 10,140 7,761 9,669 -2.30 7,437 6,978 -0.06 18.1 307,637<br />
Yasothon 7,614 4,949 4,090 4,753 -37.58 6,527 5,594 -0.14 50.3 293,592<br />
Chaiyaphum 6,328 7,088 8,688 7,492 18.40 4,441 5,274 0.19 16.5 183,759<br />
Amnat Charoen 8,026 8,007 5,733 7,666 -4.48 6,409 5,736 -0.10 21.6 78,104<br />
Nong Bua Lam Phu 8,283 5,035 6,887 5,358 -35.32 6,387 4,665 -0.27 50.0 240,445<br />
Khon Kaen 11,377 9,867 8,103 9,485 -16.63 7,981 6,236 -0.22 17.2 310,767<br />
<strong>THAILAND</strong> <strong>HUMAN</strong> <strong>DEVELOPMENT</strong> <strong>REPORT</strong> <strong>2003</strong>
Table 5 Income (Continued)<br />
Household income 2000 (Baht/month) Household<br />
Household Household expenditure Household Poverty Number<br />
Location income Male Female income (Baht/month) expenditure incidence of<br />
1998 headed headed Household change % change % 2000 Poor<br />
(Baht/month) households households income 1998-2000 1998 2000 1998-2000 % 2000<br />
1 2 3 4 5 6 7 8 9 10<br />
Udon Thani 7,873 6,896 6,496 6,815 -13.44 5,037 4,651 -0.08 34.5 505,681<br />
Loei 9,397 7,327 7,116 7,296 -22.35 7,905 5,989 -0.24 36.8 217,491<br />
Nong Khai 11,706 7,084 6,354 6,916 -40.92 9,017 6,792 -0.25 35.9 317,383<br />
Maha Salakam 8,322 8,921 6,303 8,285 -0.44 6,405 7,036 0.10 13.1 127,685<br />
Roi Et 6,021 7,216 6,323 7,003 16.31 4,556 5,512 0.21 22.2 278,207<br />
Kalasin 6,636 6,648 5,358 6,328 -4.63 6,383 6,108 -0.04 39.9 370,694<br />
Sakhon Nakhon 7,794 8,519 6,124 7,664 -1.66 6,275 5,393 -0.14 40.5 419,996<br />
Nakhon Phanom 7,748 5,138 5,404 5,209 -32.77 5,789 5,027 -0.13 48.1 331,087<br />
Mukdahan 9,359 9,735 6,065 9,114 -2.61 7,758 6,843 -0.12 24.2 69,844<br />
Northern Region 9,502 8,651 7,755 8,422 -11.37 7,040 6,357 -0.10 12.2 1,372,830<br />
Chiang Mai 10,005 9,241 8,280 9,012 -9.93 6,961 6,462 -0.07 5.2 75,755<br />
Lamphun 8,677 10,121 9,709 10,027 15.56 7,231 7,421 0.03 6.2 27,464<br />
Lampang 13,539 9,576 9,954 9,676 -28.53 7,624 6,685 -0.12 12.8 100,257<br />
Uttaradit 9,362 7,674 6,133 7,171 -23.40 6,631 6,071 -0.08 9.7 44,763<br />
Phrae 7,954 8,661 7,788 8,461 6.36 5,344 6,757 0.26 6.7 34,718<br />
Nan 7,548 7,142 7,498 7,220 -4.34 6,093 6,072 -0.00 19.3 84,835<br />
Phayao 7,393 6,195 4,684 5,865 -20.66 5,655 5,272 -0.07 9.6 48,404<br />
Chiang Rai 9,171 7,338 7,822 7,450 -18.76 6,787 5,739 -0.15 10.3 115,314<br />
Mae Hong Son 5,938 6,281 6,356 6,291 5.95 4,711 4,824 0.02 28.0 48,789<br />
Nakhon Sawan 9,349 7,484 7,255 7,417 -20.67 8,896 6,568 -0.26 19.0 211,739<br />
Uthai Thani 7,719 9,767 9,192 9,577 24.07 6,044 6,380 0.06 19.7 61,485<br />
Kamphaeng Phet 9,282 12,713 9,443 11,834 27.49 8,047 9,111 0.13 0.5 3,735<br />
Tak 9,392 10,141 7,948 9,542 1.60 6,617 6,488 -0.02 21.9 78,370<br />
Sukhothai 9,599 7,436 6,347 7,121 -25.82 5,807 5,152 -0.11 18.1 107,383<br />
Phitsanulok 11,677 8,828 8,576 8,762 -24.96 8,730 6,321 -0.28 14.6 117,407<br />
Phichit 10,580 9,110 6,214 8,212 -22.38 7,309 7,043 -0.04 15.7 92,351<br />
Phetchabun 7,868 8,785 6,575 8,326 5.83 6,323 5,080 -0.20 13.0 120,060<br />
Southern Region 11,368 11,536 9,275 11,012 -3.13 8,350 8,055 -0.04 11.0 922,204<br />
Nakhon Si Thammarat 11,029 11,535 7,985 10,675 -3.21 7,457 7,392 -0.01 13.6 224,632<br />
Krabi 12,047 10,189 7,723 9,847 -18.26 8,819 8,676 -0.02 7.4 24,533<br />
Phangnga 7,538 9,886 10,825 10,054 33.37 7,411 7,536 0.02 1.7 4,313<br />
Phuket 18,422 21,160 17,278 20,200 9.65 13,445 16,166 0.20 0.1 101<br />
Surat Thani 11,868 10,771 10,734 10,765 -9.30 8,720 8,744 0.00 2.4 21,597<br />
Ranong 9,279 10,319 6,150 9,318 0.42 8,462 8,519 0.01 10.0 13,969<br />
Chumphon 10,135 11,141 8,775 10,438 3.00 8,058 7,474 -0.07 4.6 20,555<br />
Songkhla 14,784 13,663 10,920 13,057 -11.68 9,906 8,465 -0.15 3.5 45,853<br />
Satun 9,051 10,003 8,517 9,710 7.28 7,095 6,923 -0.02 9.2 23,620<br />
Trang 12,879 12,122 13,462 12,518 -2.80 9,245 8,376 -0.09 3.0 18,788<br />
Phattalung 11,582 12,481 7,526 11,320 -2.26 8,167 7,951 -0.03 3.2 16,548<br />
Pattani 10,945 10,488 6,911 9,597 -12.31 7,187 8,043 0.12 25.5 157,895<br />
Yala 7,417 10,481 7,835 9,863 32.99 7,507 7,966 0.06 28.1 116,672<br />
Narathiwat 6,470 8,121 6,622 7,736 19.56 6,207 5,945 -0.04 35.1 233,227<br />
DATA TABLES<br />
143
Table 5. Income (continued)<br />
144<br />
Poverty line Welfare Per capita Per capita Per capita Per capita Per capita Household Debt 2000<br />
2000 2000 current consumption current consumption current<br />
Location income expenditure income expenditure income Household Average<br />
2000 2000 1998 1998 change (%) with debt debt<br />
Baht/person/month % Baht/month Baht/month Baht/month Baht/month 1998-2000 (%) Baht<br />
11 12 13 14 15 16 17 18 19<br />
Kingdom 882 372 3,462 2,461 3,448 2,505 0.41 56.3 121,569<br />
Bangkok Metropolis 1,101 748 8,246 5,352 7,807 5,368 5.63 37.2 363,674<br />
Bangkok Vicinity 948 585 5,613 4,120 5,396 3,800 4.01 45.1 216,952<br />
Nakhon Pathom 893 551 5,004 3,617 4,389 3,455 14.01 62.5 185,423<br />
Nonthaburi 1,014 721 7,395 5,029 6,586 4,817 12.29 39.6 260,232<br />
Pathum Thani 927 621 5,774 4,548 5,585 3,627 3.38 37.9 368,729<br />
Samut Prakan 963 551 5,295 4,104 5,407 3,696 -2.07 38.0 177,327<br />
Samut Sakon 925 430 4,030 2,886 4,818 3,010 -16.35 46.3 138,536<br />
Central Region 873 413 3,667 2,621 3,247 2,543 12.92 47.7 104,265<br />
Chai Nat 869 464 4,172 2,587 3,250 2,647 28.37 49.6 124,832<br />
Phra Nakhon Si Ayutthaya 884 488 4,340 3,046 3,483 2,781 24.58 35.7 66,233<br />
Lop Buri 854 357 3,081 2,352 2,985 2,376 3.21 58.6 81,550<br />
Saraburi 893 392 3,546 2,603 3,394 2,522 4.49 45.2 137,096<br />
Sing Buri 863 371 3,283 2,549 3,334 2,489 -1.52 42.9 115,984<br />
Ang Thong 876 381 3,363 2,368 2,963 2,310 13.50 56.3 143,855<br />
Eastern Region 887 394 3,584 2,826 3,424 2,781 4.67 50.3 150,887<br />
Chanthaburi 889 362 3,269 2,564 4,208 3,006 -22.32 54.9 210,344<br />
Chachoengsao 867 389 3,470 2,862 3,499 3,031 -0.82 67.8 177,050<br />
Chon Buri 930 495 4,709 3,930 4,122 3,537 14.23 28.0 238,169<br />
Trat 862 257 2,262 2,116 3,631 2,410 -37.70 34.6 67,390<br />
Nakhon Nayok 860 385 3,362 2,514 3,122 2,431 7.70 63.4 194,213<br />
Prachin Buri 848 328 2,835 2,393 2,546 2,015 11.34 49.7 67,620<br />
Rayong 910 484 4,428 2,720 3,533 2,769 25.33 51.4 120,562<br />
Sa Kaeo 856 242 2,121 1,717 1,848 1,679 14.78 66.6 73,584<br />
Western Region 874 409 3,606 2,230 3,393 2,328 6.30 55.7 124,591<br />
Ratchaburi 878 472 4,077 2,814 3,524 2,637 15.69 55.5 107,048<br />
Kanchanaburi 864 355 3,147 1,963 3,456 2,247 -8.95 65.3 129,096<br />
Suphan Buri 867 436 3,815 1,672 3,326 2,212 14.71 57.5 122,774<br />
Samutshongkhram 896 388 3,535 2,831 2,806 2,296 25.98 39.3 116,158<br />
Phetchaburi 885 389 3,516 2,295 3,978 2,290 -11.62 52.8 164,948<br />
Prachuap Khiri khan 876 354 3,177 2,334 2,882 2,176 10.25 48.8 116,262<br />
Northeastern Region 864 224 1,983 1,495 2,072 1,554 -4.29 69.1 75,923<br />
Nakon Ratchasima 882 249 2,257 1,568 2,462 1,584 -8.34 64.2 78,532<br />
Buri Ram 855 235 2,038 1,482 1,910 1,379 6.68 86.1 84,129<br />
Surin 851 186 1,609 1,205 1,663 1,486 -3.24 70.0 78,171<br />
Si Sa Ket 849 218 1,897 1,399 1,703 1,454 11.42 81.2 83,522<br />
Ubon Ratchathani 872 276 2,486 1,793 2,284 1,716 8.87 73.1 89,062<br />
Yasothon 852 146 1,274 1,451 1,785 1,530 -28.64 48.5 36,602<br />
Chaiyaphum 855 253 2,157 1,514 1,779 1,248 21.24 73.0 57,892<br />
Amnat Charoen 864 218 1,916 1,433 1,943 1,551 -1.35 75.1 71,302<br />
Nong Bua Lam Phu 847 154 1,316 1,143 1,826 1,408 -27.93 74.7 62,357<br />
Khon Kaen 885 282 2,580 1,686 2,931 2,056 -11.99 65.7 97,778<br />
<strong>THAILAND</strong> <strong>HUMAN</strong> <strong>DEVELOPMENT</strong> <strong>REPORT</strong> <strong>2003</strong>
Table 5 Income (Continued)<br />
Poverty line Welfare Per capita Per capita Per capita Per capita Per capita Household Debt 2000<br />
2000 2000 current consumption current consumption current<br />
Location income expenditure income expenditure income Household Average<br />
2000 2000 1998 1998 change (%) with debt debt<br />
Baht/person/month % Baht/month Baht/month Baht/month Baht/month 1998-2000 (%) Baht<br />
11 12 13 14 15 16 17 18 19<br />
Udon Thani 867 183 1,622 1,105 1,866 1,194 -13.09 62.0 54,960<br />
Loei 870 207 1,831 1,488 2,359 1,984 -22.36 79.4 78,745<br />
Nong Khai 858 198 1,728 1,691 2,731 2,104 -36.72 66.9 56,178<br />
Maha Salakam 862 238 2,092 1,760 2,059 1,585 1.60 70.6 78,293<br />
Roi Et 852 223 1,931 1,515 1,521 1,151 26.99 74.5 58,861<br />
Kalasin 865 184 1,627 1,553 1,573 1,513 3.41 71.1 58,258<br />
Sakhon Nakhon 859 217 1,911 1,333 1,873 1,508 2.00 50.3 88,458<br />
Nakhon Phanom 852 152 1,312 1,263 1,939 1,449 -32.31 50.9 61,907<br />
Mukdahan 884 258 2,380 1,787 2,183 1,810 9.02 71.5 165,251<br />
Northern Region 777 316 2,506 1,892 2,760 2,045 -9.19 58.7 95,726<br />
Chiang Mai 798 369 3,015 2,176 3,101 2,157 -2.76 53.0 99,171<br />
Lamphun 789 386 3,062 2,267 2,616 2,180 17.06 55.9 117,692<br />
Lampang 786 360 2,860 1,973 3,932 2,214 -27.25 49.9 138,649<br />
Uttaradit 768 286 2,227 1,886 2,705 1,916 -17.67 46.9 50,868<br />
Phrae 785 315 2,504 1,990 2,373 1,594 5.53 62.8 76,979<br />
Nan 770 271 2,157 1,807 2,044 1,650 5.52 69.0 76,027<br />
Phayao 772 230 1,789 1,608 2,330 1,783 -23.23 59.5 66,046<br />
Chiang Rai 777 268 2,118 1,628 2,651 1,962 -20.09 41.6 67,839<br />
Mae Hong Son 765 229 1,796 1,368 1,516 1,203 18.42 39.8 79,479<br />
Nakhon Sawan 782 282 2,249 1,989 2,757 2,624 -18.42 76.4 86,888<br />
Uthai Thani 758 359 2,788 1,852 2,340 1,832 19.13 52.3 91,093<br />
Kamphaeng Phet 760 435 3,387 2,603 2,482 2,151 36.46 70.2 122,094<br />
Tak 770 338 2,694 1,824 2,730 1,923 -1.31 54.7 101,868<br />
Sukhothai 760 266 2,052 1,481 2,712 1,641 -24.35 65.9 66,109<br />
Phitsanulok 780 307 2,488 1,793 3,311 2,475 -24.85 59.6 109,675<br />
Phichit 769 310 2,426 2,066 3,217 2,222 -24.58 58.5 107,978<br />
Phetchabun 765 294 2,284 1,392 2,079 1,671 9.87 69.1 122,198<br />
Southern Region 841 339 2,957 2,151 2,905 2,134 1.77 49.8 108,684<br />
Nakhon Si Thammarat 825 318 2,663 1,844 2,687 1,817 -0.87 56.6 96,519<br />
Krabi 818 303 2,600 2,266 2,893 2,117 -10.13 79.4 105,404<br />
Phangnga 815 318 2,627 1,958 2,045 2,011 28.46 26.4 107,555<br />
Phuket 912 690 6,239 5,008 5,660 4,131 10.22 35.1 116,028<br />
Surat Thani 861 343 3,065 2,470 3,032 2,228 1.09 45.0 127,597<br />
Ranong 832 322 2,750 2,490 2,467 2,250 11.46 47.9 104,223<br />
Chumphon 844 370 3,183 2,272 2,775 2,207 14.68 54.2 181,495<br />
Songkhla 879 410 3,741 2,421 4,202 2,815 -10.98 44.2 83,646<br />
Satun 816 297 2,520 1,776 2,118 1,660 18.97 50.5 143,881<br />
Trang 847 372 3,245 2,162 3,262 2,342 -0.53 65.1 78,857<br />
Phattalung 835 381 3,277 2,294 3,123 2,202 4.95 68.3 135,518<br />
Pattani 804 262 2,277 1,873 2,590 1,701 -12.11 49.3 94,407<br />
Yala 847 273 2,374 1,910 1,734 1,755 36.90 35.4 166,993<br />
Narathiwat 814 214 1,822 1,382 1,484 1,424 22.78 24.7 61,071<br />
DATA TABLES<br />
145
146<br />
Table 6. Housing and living conditions<br />
Housing conditions 2000 Living Conditions 2000<br />
Households<br />
Permanent Persons Persons per in slum Safe Clean Electricity Telephone Electric Refrigerator Cooking with<br />
Location building per sleeping 2001 sanitation drinking in in fan fuel gas or<br />
material room room water dwelling structure electric stove<br />
% Number Number % % % % % % % %<br />
1 2 3 4 5 6 7 8 9 10 11<br />
Kingdom 97.5 1.4 2.1 26.9 98.9 98.9 98.3 24.5 92.5 71.5 61.6<br />
Bangkok Metropolis 99.7 1.3 1.8 12.7 100.0 99.8 99.9 65.4 98.4 76.9 76.6<br />
Bangkok Vicinity 97.9 1.4 2.0 30.5 99.8 99.5 99.7 47.3 99.1 80.9 89.5<br />
Nakhon Pathom 97.7 1.3 2.0 5.5 99.3 98.6 99.4 36.5 98.2 82.3 89.8<br />
Nonthaburi 100.0 1.2 1.7 13.7 100.0 100.0 100.0 67.0 100.0 90.0 90.3<br />
Pathum Thani 97.8 1.6 2.2 29.1 100.0 100.0 99.5 47.3 98.6 81.5 81.9<br />
Samut Prakan 99.7 1.5 1.9 38.7 100.0 99.5 99.6 48.4 99.4 73.3 92.7<br />
Samut Sakon 90.8 1.7 2.3 83.6 100.0 100.0 100.0 30.6 99.0 76.9 90.8<br />
Central Region 97.1 1.6 2.2 33.5 99.7 97.8 98.0 26.5 96.9 82.8 80.6<br />
Chai Nat 96.3 1.3 2.0 11.0 98.8 98.2 96.4 12.8 92.8 71.5 65.4<br />
Phra Nakhon Si Ayutthaya 94.7 1.9 2.2 15.5 99.9 93.3 97.4 36.9 97.5 85.6 90.8<br />
Lop Buri 98.6 1.4 2.1 35.5 100.0 99.3 100.0 17.2 99.0 85.0 79.8<br />
Saraburi 98.3 1.8 2.1 50.5 100.0 99.9 97.2 33.0 97.0 82.9 82.8<br />
Sing Buri 94.8 2.0 2.6 47.2 100.0 100.0 97.2 31.9 95.4 81.8 66.1<br />
Ang Thong 100.0 1.6 2.8 38.3 99.2 99.2 98.9 26.8 97.5 86.5 87.4<br />
Eastern Region 98.0 1.7 2.3 22.3 99.0 99.5 97.9 27.7 95.0 79.5 81.5<br />
Chanthaburi 97.2 1.5 2.1 28.9 97.7 99.0 95.4 32.4 90.9 75.6 86.1<br />
Chachoengsao 98.8 2.4 2.6 10.8 100.0 100.0 97.5 29.6 95.0 76.0 83.8<br />
Chon Buri 98.9 1.4 1.9 8.9 100.0 99.3 99.7 35.4 98.9 82.9 82.9<br />
Trat 100.0 1.6 2.1 19.4 94.8 99.4 94.9 19.1 89.3 75.0 89.0<br />
Nakhon Nayok 95.7 1.8 2.4 10.4 100.0 98.9 96.6 20.8 95.2 79.9 68.0<br />
Prachin Buri 94.7 1.7 2.5 26.3 99.5 100.0 99.0 16.2 97.6 79.4 80.7<br />
Rayong 100.0 2.1 2.5 53.7 100.0 99.3 100.0 37.5 97.8 93.5 97.0<br />
Sa Kaeo 96.8 1.9 2.8 44.4 97.0 100.0 96.4 13.4 88.3 68.4 61.3<br />
Western Region 95.5 1.7 2.3 16.1 99.0 98.2 97.4 23.5 94.1 80.8 81.1<br />
Ratchaburi 96.8 1.6 2.1 16.2 99.2 99.9 98.6 31.3 96.5 82.9 74.1<br />
Kanchanaburi 89.6 1.6 2.4 6.3 98.3 97.5 96.9 17.2 94.4 81.9 73.5<br />
Suphan Buri 99.8 1.7 2.5 13.6 99.4 96.3 98.4 19.0 95.6 80.5 86.1<br />
Samutshongkhram 98.0 1.8 2.3 39.5 100.0 100.0 99.5 39.0 98.5 83.0 94.7<br />
Phetchaburi 97.4 2.1 2.4 5.7 99.1 98.8 94.9 25.4 87.2 74.2 82.8<br />
Prachuap Khiri Khan 90.4 1.6 2.1 32.5 98.0 98.7 95.1 18.4 91.3 81.4 87.0<br />
Northeastern Region 97.9 1.4 2.2 48.8 98.8 99.9 98.7 9.0 91.3 60.4 36.2<br />
Nakon Ratchasima 99.6 1.5 2.4 29.5 100.0 100.0 97.9 13.2 91.4 68.8 69.6<br />
Buri Ram 97.7 1.4 2.3 66.8 98.3 99.3 98.9 5.9 90.8 51.9 41.3<br />
Surin 94.8 1.7 2.5 18.7 97.4 99.6 99.6 8.4 90.2 40.0 27.8<br />
Si Sa Ket 99.4 1.5 2.2 53.0 96.2 100.0 99.5 6.7 86.4 39.6 26.7<br />
Ubon Ratchathani 96.0 1.3 2.0 53.1 96.2 100.0 96.4 13.3 85.9 51.2 22.7<br />
Yasothon 96.9 1.5 2.2 36.1 100.0 100.0 100.0 4.8 96.9 72.6 32.8<br />
Chaiyaphum 97.0 1.4 2.1 39.9 99.9 100.0 97.5 9.2 91.8 66.8 44.1<br />
Amnat Charoen 93.7 1.8 2.4 75.5 99.2 100.0 97.5 8.7 92.8 66.2 16.8<br />
Nong Bua Lam Phu 97.9 1.7 2.1 40.0 99.9 100.0 100.0 3.1 98.4 77.3 34.2<br />
Khon Kaen 98.3 1.0 1.8 66.0 99.9 100.0 99.4 12.5 94.8 71.4 36.7<br />
<strong>THAILAND</strong> <strong>HUMAN</strong> <strong>DEVELOPMENT</strong> <strong>REPORT</strong> <strong>2003</strong>
Table 6 Housing and living conditions<br />
Housing conditions 2000 Living Conditions 2000<br />
Households<br />
Permanent Persons Persons per in slum Safe Clean Electricity Telephone Electric Refrigerator Cooking with<br />
Location building per sleeping 2001 sanitation drinking in in fan fuel gas or<br />
material room room water dwelling structure electric stove<br />
% Number Number % % % % % % % %<br />
1 2 3 4 5 6 7 8 9 10 11<br />
Udon Thani 99.2 1.6 2.1 41.8 100.0 100.0 100.0 6.5 95.7 70.7 43.0<br />
Loei 99.9 1.7 2.1 41.0 100.0 100.0 100.0 7.1 88.6 65.4 47.5<br />
Nong Khai 99.1 1.5 2.1 58.7 98.9 98.7 98.6 9.8 94.0 63.3 32.4<br />
Maha Salakam 97.4 1.4 2.3 80.7 100.0 100.0 98.6 7.6 93.2 56.8 36.4<br />
Roi Et 97.0 1.3 2.0 30.6 100.0 100.0 99.3 4.6 96.4 66.9 25.6<br />
Kalasin 99.2 1.6 2.3 47.4 99.4 100.0 98.0 7.8 91.5 62.5 18.3<br />
Sakhon Nakhon 98.1 1.7 2.1 78.7 98.5 100.0 98.4 11.2 82.1 54.9 22.8<br />
Nakhon Phanom 96.9 1.6 2.3 52.9 96.3 100.0 98.0 4.9 88.9 53.4 10.9<br />
Mukdahan 97.3 1.3 2.0 65.2 95.4 98.5 98.5 8.6 86.5 62.9 20.3<br />
Northern Region 95.5 1.4 2.1 45.9 99.2 97.1 97.4 19.8 90.4 74.2 54.6<br />
Chiang Mai 90.6 1.1 1.6 59.1 99.9 96.7 98.7 27.3 86.5 79.0 48.7<br />
Lamphun 97.1 1.1 1.6 48.7 100.0 100.0 99.8 37.8 95.0 85.4 65.9<br />
Lampang 97.9 1.4 1.9 54.6 99.8 99.2 99.8 25.0 91.0 81.4 49.6<br />
Uttaradit 100.0 1.5 2.1 35.0 99.3 100.0 99.8 12.8 95.7 79.0 62.2<br />
Phrae 98.4 1.7 2.0 49.0 100.0 98.5 99.8 24.0 85.7 84.3 54.0<br />
Nan 98.1 1.0 1.7 22.4 100.0 97.2 98.0 15.8 89.9 77.2 45.0<br />
Phayao 98.3 1.2 1.8 45.3 100.0 100.0 100.0 14.0 92.7 81.5 63.7<br />
Chiang Rai 92.5 1.7 2.0 39.9 97.2 86.2 90.3 17.4 81.3 70.7 48.4<br />
Mae Hong Son 95.2 1.4 2.3 22.6 91.8 85.8 63.2 10.5 53.0 36.7 26.2<br />
Nakhon Sawan 93.7 1.5 2.7 41.6 98.8 100.0 97.8 20.4 94.3 69.7 57.6<br />
Uthai Thani 98.4 1.3 2.2 82.3 99.9 99.7 98.9 18.5 95.3 71.9 57.5<br />
Kamphaeng Phet 95.3 1.4 2.0 26.7 98.7 99.7 98.5 17.3 96.5 65.4 54.5<br />
Tak 94.9 1.2 2.1 52.4 100.0 98.6 96.8 20.1 84.7 73.0 52.6<br />
Sukhothai 97.8 1.8 2.4 49.7 100.0 100.0 97.3 14.4 94.2 80.3 75.2<br />
Phitsanulok 98.2 2.2 2.9 29.4 99.7 95.3 99.6 19.0 99.4 71.0 53.4<br />
Phichit 96.9 1.5 2.4 32.9 98.2 95.6 97.6 18.5 95.9 71.8 60.6<br />
Phetchabun 94.2 1.7 2.6 54.4 99.3 100.0 98.8 11.5 89.2 64.6 52.4<br />
Southern Region 97.9 1.4 2.2 24.8 96.6 98.7 97.2 20.3 86.4 73.9 83.7<br />
Nakhon Si Thammarat 96.8 1.4 2.2 22.9 96.2 99.9 97.5 17.2 86.7 78.4 83.3<br />
Krabi 98.0 1.3 2.3 112.9 98.2 98.8 94.2 18.9 81.5 75.7 90.8<br />
Phangnga 89.2 1.4 2.2 20.8 93.8 98.9 90.3 26.5 80.9 71.2 82.7<br />
Phuket 96.4 1.2 2.0 11.5 99.7 100.0 99.3 41.0 97.8 76.7 89.9<br />
Surat Thani 98.0 1.7 2.3 56.4 99.4 100.0 99.2 22.7 93.2 79.1 89.7<br />
Ranong 94.2 1.4 2.1 22.9 93.2 88.8 89.5 23.8 71.4 61.2 68.6<br />
Chumphon 98.8 1.3 1.9 2.2 99.0 97.6 94.2 20.9 85.4 77.1 86.9<br />
Songkhla 98.9 1.2 1.8 11.7 100.0 99.5 100.0 21.8 96.6 82.5 90.2<br />
Satun 100.0 1.6 2.5 7.7 98.5 100.0 98.7 15.7 80.6 74.6 90.1<br />
Trang 97.4 1.3 1.9 4.8 96.3 100.0 97.5 20.1 86.9 71.0 89.0<br />
Phattalung 99.3 0.9 1.7 11.8 99.4 100.0 98.6 15.8 85.2 75.9 82.8<br />
Pattani 99.4 2.1 2.7 34.9 89.9 98.7 97.2 20.3 75.0 54.0 70.7<br />
Yala 99.1 1.3 2.5 8.5 90.9 86.8 94.9 26.3 83.5 69.3 74.7<br />
Narathiwat 98.5 1.5 2.9 35.4 91.2 99.8 95.4 13.6 75.8 57.6 68.8<br />
DATA TABLES<br />
147
Table 7. Family and Community life<br />
148<br />
Family Life Safety 2000<br />
Female headed Elderly headed Children aged 15-17 Divorce Disability 2001 Violent Drug-related<br />
Location households households 2001 incidence crimes crimes<br />
2000 2000 per 1,000 Male Female % reported arrested<br />
Working Total Working marriages of per per<br />
Number % Number % number number % Number Number population 100,000 100,000<br />
1 2 3 4 5 6 7 8 9 10 11 12 13<br />
Kingdom 4,160,004 25.9 3,692,535 23.0 724,548 3,353,528 21.6 234 657,769 442,992 1.75 13 438<br />
Bangkok Metropolis 536,836 27.4 238,938 12.2 77,850 391,678 19.9 351 50,145 27,300 1.00 21 1,015<br />
Bangkok Vicinity 245,717 26.8 125,128 13.7 40,942 176,331 23.2 304 26,597 22,833 1.30 17 903<br />
Nakhon Pathom 57,111 26.9 37,883 17.8 13,035 41,101 31.7 241 7,853 6,662 1.65 17 1,043<br />
Nonthaburi 60,427 29.7 35,871 17.6 2,404 35,933 6.7 350 4,131 3,025 0.86 14 670<br />
Pathum Thani 40,787 27.7 20,985 14.3 4,162 26,767 15.5 318 2,509 5,116 1.31 20 963<br />
Samut Prakan 53,242 22.4 16,055 6.8 11,555 48,977 23.6 323 10,315 6,225 1.57 16 1,001<br />
Samut Sakon 34,150 29.6 14,333 12.4 9,786 23,553 41.5 221 1,790 1,804 0.81 23 794<br />
Central Region 275,301 34.9 263,757 33.4 25,223 141,617 17.8 243 37,633 23,751 2.10 13 626<br />
Chai Nat 34,170 31.1 33,224 30.2 3,633 17,492 20.8 229 8,109 2,743 2.89 13 469<br />
Phra Nakhon Si Ayutthaya 80,436 41.5 68,940 35.6 5,907 36,179 16.3 284 7,551 6,601 1.92 17 944<br />
Lop Buri 60,480 30.4 74,045 37.3 9,646 37,795 25.5 271 9,366 6,382 2.08 14 470<br />
Saraburi 47,633 32.9 39,864 27.5 2,798 27,988 10.0 179 7,243 4,134 2.13 15 705<br />
Sing Buri 28,062 41.6 28,874 42.8 2,147 10,212 21.0 303 3,264 1,658 2.01 8 458<br />
Ang Thong 24,520 32.8 18,810 25.1 1,092 11,951 9.1 299 2,099 2,234 1.57 6 487<br />
Eastern Region 316,762 30.4 211,710 20.3 54,502 201,490 27.0 247 33,743 24,759 1.46 15 523<br />
Chanthaburi 28,077 23.4 25,167 21.0 6,245 23,125 27.0 277 4,893 2,831 1.69 15 334<br />
Chachoengsao 63,109 38.7 49,404 30.3 11,410 31,522 36.2 197 5,394 4,572 1.55 17 637<br />
Chon Buri 97,562 37.8 30,931 12.0 11,646 50,396 23.1 302 10,073 7,861 1.78 19 871<br />
Trat 12,817 23.9 14,195 26.4 3,336 10,254 32.5 211 1,580 1,247 1.42 17 223<br />
Nakhon Nayok 19,461 27.7 21,070 30.0 2,501 11,644 21.5 253 2,066 747 1.07 15 427<br />
Prachin Buri 33,983 31.0 31,772 29.0 5,351 19,893 26.9 239 3,843 2,701 1.56 13 367<br />
Rayong 30,343 23.1 19,048 14.5 8,265 28,803 28.7 223 2,973 1,388 0.82 14 445<br />
Sa Kaeo 31,408 23.4 20,122 15.0 5,748 25,853 22.2 203 2,920 3,411 1.27 10 235<br />
Western Region 287,184 32.4 241,987 27.3 45,309 181,145 25.0 216 34,632 25,147 1.71 13 624<br />
Ratchaburi 87,376 41.9 77,643 37.2 12,301 42,044 29.3 236 8,335 9,295 2.17 13 598<br />
Kanchanaburi 54,466 32.1 34,209 20.1 11,171 38,444 29.1 192 11,570 4,989 2.38 15 630<br />
Suphan Buri 61,346 26.7 55,768 24.2 11,504 42,158 27.3 192 5,328 3,245 0.97 11 827<br />
Samutshongkhram 18,520 34.8 14,898 28.0 2,119 10,457 20.3 232 1,533 1,586 1.46 11 460<br />
Phetchaburi 31,175 27.6 31,683 28.1 4,062 24,020 16.9 244 3,129 3,755 1.55 14 578<br />
Prachuap Khiri khan 34,302 30.7 27,785 24.9 4,152 24,022 17.3 228 4,737 2,278 1.57 16 410<br />
Northeastern Region 1,196,554 23.0 1,257,183 24.1 266,454 1,208,679 22.0 179 246,355 162,825 1.93 7 211<br />
Nakon Ratchasima 157,230 23.1 174,809 25.7 32,989 138,432 23.8 237 31,017 33,669 2.42 7 283<br />
Buri Ram 81,473 23.3 78,059 22.4 19,212 89,244 21.5 146 28,247 10,420 2.57 5 98<br />
Surin 77,374 22.5 90,776 26.4 9,421 68,916 13.7 112 14,003 12,926 2.00 4 76<br />
Si Sa Ket 84,832 24.0 80,194 22.7 17,685 77,498 22.8 106 38,817 17,810 3.98 5 137<br />
Ubon Ratchathani 80,399 19.8 83,885 20.7 33,585 100,422 33.4 109 21,975 8,911 1.81 6 199<br />
Yasothon 32,586 22.8 28,900 20.2 4,356 32,086 13.6 170 5,399 4,464 1.68 4 214<br />
Chaiyaphum 72,512 25.3 93,774 32.7 12,603 61,284 20.6 182 17,785 8,772 2.36 6 306<br />
Amnat Charoen 13,128 15.0 25,689 29.3 5,699 20,016 28.5 113 2,787 3,055 1.61 4 350<br />
Nong Bua Lam Phu 19,432 17.4 20,282 18.2 10,301 31,694 32.5 200 1,863 2,406 0.88 9 95<br />
Khon Kaen 98,265 21.7 91,752 20.2 6,850 100,364 6.8 220 19,873 10,250 1.66 8 140<br />
<strong>THAILAND</strong> <strong>HUMAN</strong> <strong>DEVELOPMENT</strong> <strong>REPORT</strong> <strong>2003</strong>
Table 7 Familiy and Community life<br />
Udon Thani 71,036 20.3 88,549 25.4 22,178 92,434 24.0 254 6,720 4,943 0.79 11 167<br />
Loei 22,277 14.7 33,360 21.9 6,588 33,412 19.7 189 6,013 2,835 1.49 16 405<br />
Nong Khai 49,445 23.0 57,011 26.5 15,444 57,246 27.0 193 6,436 3,128 1.08 7 212<br />
Maha Salakam 59,409 24.3 65,628 26.8 13,211 54,992 24.0 137 4,260 5,338 0.98 11 188<br />
Roi Et 75,099 23.9 75,127 23.9 14,818 69,710 21.3 285 9,810 6,910 1.33 8 249<br />
Kalasin 57,888 24.8 53,217 22.8 8,924 55,729 16.0 113 10,486 9,012 2.09 9 255<br />
Sakhon Nakhon 87,949 35.7 67,199 27.3 16,612 64,813 25.6 162 7,806 7,096 1.43 5 307<br />
Nakhon Phanom 44,583 26.7 40,741 24.4 10,212 41,412 24.7 169 8,770 8,537 2.51 7 242<br />
Mukdahan 11,638 16.9 8,232 12.0 5,766 18,976 30.4 168 4,287 2,342 2.28 17 422<br />
Northern Region 813,284 25.6 870,123 27.3 115,072 579,084 19.9 283 151,974 105,477 2.28 11 405<br />
Chiang Mai 103,261 23.9 137,426 31.8 13,897 63,606 21.8 384 22,800 12,012 2.37 12 434<br />
Lamphun 27,984 22.8 38,409 31.3 3,866 17,705 21.8 313 5,838 4,397 2.31 7 280<br />
Lampang 59,828 26.6 73,980 32.9 3,918 35,135 11.2 361 6,287 5,669 1.52 7 337<br />
Uttaradit 42,057 32.6 31,918 24.8 3,208 25,243 12.7 279 6,778 3,604 2.24 10 330<br />
Phrae 35,085 22.9 41,334 27.0 1,156 24,699 4.7 366 10,556 6,886 3.35 14 306<br />
Nan 27,550 21.9 31,882 25.3 6,494 21,867 29.7 219 4,476 2,942 1.69 10 258<br />
Phayao 31,501 21.8 40,523 28.0 1,907 25,623 7.4 330 5,497 4,062 1.89 7 317<br />
Chiang Rai 73,862 23.1 64,638 20.2 13,635 57,056 23.9 362 19,107 10,239 2.63 12 489<br />
Mae Hong Son 6,527 13.8 9,746 20.6 4,758 9,903 48.0 159 833 371 0.69 7 246<br />
Nakhon Sawan 91,063 29.3 75,044 24.2 11,420 59,230 19.3 231 19,059 12,478 2.83 12 422<br />
Uthai Thani 29,394 33.0 22,284 25.0 2,380 16,565 14.4 229 2,708 2,229 1.58 13 382<br />
Kamphaeng Phet 51,182 26.9 50,051 26.3 9,714 39,854 24.4 188 5,293 1,312 0.97 10 517<br />
Tak 27,068 27.3 23,592 23.8 8,100 20,146 40.2 192 3,975 4,067 2.25 14 553<br />
Sukhothai 49,033 28.9 39,257 23.1 5,847 33,724 17.3 209 8,499 6,714 2.56 13 466<br />
Phitsanulok 59,220 26.4 63,035 28.1 6,565 44,494 14.8 346 9,653 8,513 2.25 12 341<br />
Phichit 47,978 31.0 52,516 33.9 6,703 29,057 23.1 173 10,483 8,383 3.21 6 325<br />
Phetchabun 50,692 20.8 74,487 30.5 11,504 55,177 20.8 193 10,131 11,600 2.35 15 484<br />
Southern Region 488,363 23.2 483,712 23.0 99,196 473,504 20.9 163 76,691 50,901 1.52 23 273<br />
Nakhon Si Thammarat 102,992 24.2 116,012 27.3 17,084 95,412 17.9 151 14,142 10,870 1.50 21 254<br />
Krabi 11,435 13.9 14,458 17.5 7,169 19,635 36.5 143 1,960 1,678 1.10 30 280<br />
Phangnga 12,469 17.9 14,547 20.9 4,556 13,182 34.6 175 754 2,391 1.24 15 270<br />
Phuket 12,165 24.7 5,643 11.5 2,596 11,062 23.5 280 1,221 1,012 1.10 16 634<br />
Surat Thani 39,883 17.4 57,374 25.1 7,597 51,098 14.9 186 9,454 4,410 1.54 29 428<br />
Ranong 9,031 24.0 5,845 15.5 838 8,053 10.4 181 985 1,513 1.78 15 543<br />
Chumphon 37,146 29.7 39,390 31.5 5,330 24,057 22.2 163 3,928 2,250 1.36 23.1 393.8<br />
Songkhla 73,052 22.1 63,770 19.3 15,433 73,701 20.9 193 8,369 1,689 0.75 27.9 223.5<br />
Satun 12,059 19.7 13,816 22.6 2,933 15,581 18.8 125 2,846 1,652 1.73 31.5 340.8<br />
Trang 46,089 29.6 33,529 21.5 9,824 35,831 27.4 150 6,504 5,326 1.88 33.8 178.4<br />
Phattalung 32,256 23.4 29,150 21.2 6,270 31,287 20.0 173 6,219 6,123 2.35 23.8 86.4<br />
Pattani 35,913 24.9 38,280 26.5 7,644 35,452 21.6 95 9,773 6,478 2.60 12.4 185.6<br />
Yala 24,205 23.4 22,378 21.6 3,706 22,790 16.3 100 3,736 1,534 1.26 21.5 199.0<br />
Narathiwat 39,670 25.7 29,520 19.1 8,216 36,363 22.6 95 6,799 3,975 1.61 14.9 235.6<br />
DATA TABLES<br />
Family Life Safety 2000<br />
Female headed Elderly headed Children aged 15-17 Divorce Disability 2001 Violent Drug-related<br />
Location households households 2001 incidence crimes crimes<br />
2000 2000 per 1,000 Male Female % reported arrested<br />
Working Total Working marriages of per per<br />
Number % Number % number number % Number Number population 100,000 100,000<br />
1 2 3 4 5 6 7 8 9 10 11 12 13<br />
149
Table 8. Transport and Communication<br />
150<br />
Transportation 2001 Communication<br />
Villages Villages with Vehicle Television Radio Telephone 2002 Internet access 2000<br />
Location convenient registration 2000 2000 (%)<br />
access to per Available Leased Persons<br />
Number nearest district 1,000 population % % lines lines per leased household population<br />
% line<br />
1 2 3 4 5 6 7 8 9 10<br />
Kingdom 66,153 82.3 344 89.3 71.8 7,873,202 6,434,950 10 14.1 5.6<br />
Bangkok Metropolis na. 100.0 734 91.6 85.4 3,041,118 2,406,000 2 34.4 16.0<br />
Bangkok Vicinity 2,134 92.7 196 90.3 82.9 1,514,663 1,207,684 3 25.0 9.8<br />
Nakhon Pathom 850 95.2 347 92.0 81.6 93,512 79,561 10 16.1 5.9<br />
Nonthaburi 291 91.1 155 96.3 95.7 469,523 371,466 2 39.5 15.9<br />
Pathum Thani 432 93.8 109 92.9 83.3 360,830 285,473 2 23.8 10.3<br />
Samut Prakan 316 85.8 118 81.2 78.1 537,298 425,086 2 27.2 10.1<br />
Samut Sakon 245 93.1 320 91.8 72.1 53,500 46,097 9 12.8 5.1<br />
Central Region 4,360 91.4 367 90.1 80.1 266,401 242,718 12 11.0 3.9<br />
Chai Nat 476 96.4 346 84.0 83.2 22,602 19,346 18 9.2 3.3<br />
Phra Nakhon Si Ayutthaya 1,210 89.8 308 91.1 75.7 81,960 72,957 10 13.0 4.6<br />
Lop Buri 1,051 87.3 352 89.4 86.1 50,360 42,727 18 10.1 3.3<br />
Saraburi 885 90.4 411 92.5 72.8 65,821 56,649 11 14.1 5.2<br />
Sing Buri 292 98.3 518 90.1 81.4 23,370 19,734 11 9.3 3.2<br />
Ang Thong 446 97.5 376 93.1 83.8 22,288 31,305 9 6.4 2.0<br />
Eastern Region 4,326 70.7 436 91.3 74.7 515,514 428,875 10 14.0 5.1<br />
Chanthaburi 632 91.5 461 89.3 71.2 57,575 45,297 11 18.3 6.5<br />
Chachoengsao 813 89.3 297 88.5 65.4 68,092 56,789 11 10.8 3.9<br />
Chon Buri 549 94.9 621 94.1 87.9 206,972 175,996 6 23.2 8.6<br />
Trat 247 87.0 383 85.9 67.4 21,113 16,218 14 13.6 4.5<br />
Nakhon Nayok 393 84.0 334 94.0 85.7 21,592 18,829 13 7.0 2.4<br />
Prachin Buri 665 83.3 302 88.2 76.7 27,391 23,415 19 10.1 3.8<br />
Rayong 380 96.6 633 97.0 80.4 92,186 76,180 7 15.6 4.9<br />
Sa Kaeo 647 76.5 184 88.6 53.9 20,593 16,151 33 2.1 0.9<br />
Western Region 3,831 91.1 387 89.6 77.2 300,229 243,407 15 11.6 4.1<br />
Ratchaburi 822 94.6 395 92.6 71.5 78,671 68,943 12 15.8 6.4<br />
Kanchanaburi 832 88.9 350 88.0 69.8 46,335 39,900 20 12.8 3.8<br />
Suphan Buri 949 91.0 347 87.8 88.1 60,904 38,807 22 5.8 2.0<br />
Samutshongkhram 270 86.3 218 96.1 81.5 22,865 20,437 10 17.1 5.5<br />
Phetchaburi 585 92.5 441 86.1 74.8 49,877 41,079 11 11.7 4.2<br />
Prachuap Khiri khan 373 89.3 526 90.3 77.1 41,577 34,241 14 11.2 3.8<br />
Northeastern Region 29,253 75.4 206 90.1 63.6 724,541 612,985 35 7.4 2.6<br />
Nakon Ratchasima 3,277 74.1 236 91.0 74.2 127,747 113,510 23 6.2 2.4<br />
Buri Ram 2,270 74.5 178 88.4 61.5 35,440 29,507 52 4.4 1.4<br />
Surin 1,972 68.5 151 87.9 62.1 30,684 24,366 57 5.6 1.7<br />
Si Sa Ket 2,413 61.3 151 81.4 50.7 31,549 24,973 58 7.6 2.3<br />
Ubon Ratchathani 2,405 75.1 222 86.2 64.7 66,568 57,278 31 9.2 3.3<br />
Yasothon 809 77.6 248 94.4 53.7 13,937 12,073 46 11.0 3.6<br />
Chaiyaphum 1,356 78.8 168 90.7 60.4 34,662 29,379 38 5.6 1.9<br />
Amnat Charoen 554 84.5 162 92.4 56.9 8,625 8,201 45 5.4 2.2<br />
Nong Bua Lam Phu 545 81.1 115 95.2 72.2 10,806 8,198 61 3.6 1.0<br />
Khon Kaen 2,030 82.1 313 93.8 64.8 94,340 83,353 21 13.0 5.4<br />
<strong>THAILAND</strong> <strong>HUMAN</strong> <strong>DEVELOPMENT</strong> <strong>REPORT</strong> <strong>2003</strong>
Table 8 Transport and Communication<br />
Udon Thani 1,522 75.8 236 92.7 66.4 61,531 50,844 30 6.2 3.4<br />
Loei 789 82.3 249 95.5 67.5 21,674 17,814 35 10.1 3.5<br />
Nong Khai 1,122 80.7 163 91.4 59.4 34,338 25,885 35 3.8 1.2<br />
Maha Salakam 1,846 78.4 185 86.7 68.3 29,819 25,369 37 11.3 3.6<br />
Roi Et 2,228 76.0 244 91.0 65.6 34,650 28,448 46 7.1 2.6<br />
Kalasin 1,328 73.6 176 88.7 60.5 26,977 19,808 50 6.1 2.0<br />
Sakhon Nakhon 1,320 81.1 165 93.0 62.9 29,286 26,124 42 5.8 1.8<br />
Nakhon Phanom 996 78.8 190 94.3 50.2 19,625 17,216 42 7.5 2.4<br />
Mukdahan 471 73.9 219 85.1 69.9 12,283 10,639 32 8.9 2.7<br />
Northern Region 14,249 82.7 364 87.6 72.0 874,810 762,914 16 12.0 4.6<br />
Chiang Mai 1,749 79.5 532 86.7 78.2 232,906 195,536 8 16.6 6.4<br />
Lamphun 456 89.0 586 95.2 76.4 45,019 41,685 10 17.2 5.8<br />
Lampang 758 89.4 445 88.3 70.1 67,896 62,954 13 17.8 6.5<br />
Uttaradit 536 86.9 335 89.0 63.4 24,516 22,899 21 13.3 5.1<br />
Phrae 588 87.2 400 93.9 75.2 39,899 37,455 13 18.2 7.2<br />
Nan 805 77.3 315 84.0 73.8 22,666 19,656 25 9.9 3.5<br />
Phayao 622 92.0 384 92.2 74.6 28,480 27,511 19 9.9 5.1<br />
Chiang Rai 1,450 79.2 376 85.4 78.8 88,930 77,515 16 15.2 5.6<br />
Mae Hong Son 392 41.1 114 51.2 62.5 10,237 8,703 27 5.8 2.1<br />
Nakhon Sawan 1,293 85.8 341 84.8 61.2 77,068 64,278 18 15.1 6.1<br />
Uthai Thani 575 89.6 400 87.4 71.6 15,716 12,919 26 10.9 3.9<br />
Kamphaeng Phet 858 77.9 254 88.6 68.9 26,352 23,053 33 5.4 2.3<br />
Tak 468 79.3 256 81.3 61.7 31,080 28,125 18 8.0 2.7<br />
Sukhothai 740 88.6 318 92.7 73.5 32,238 28,133 22 9.6 3.3<br />
Phitsanulok 913 83.8 324 87.6 77.3 56,856 49,720 17 6.5 2.6<br />
Phichit 818 91.0 331 89.6 68.0 33,548 27,606 21 5.4 2.1<br />
Phetchabun 1,228 81.7 231 90.0 70.0 41,403 35,166 29 4.5 1.9<br />
Southern Region 8,000 92.2 398 85.8 67.2 635,926 530,367 16 12.5 4.7<br />
Nakhon Si Thammarat 1,419 84.2 310 88.3 61.3 80,572 68,591 22 15.4 6.1<br />
Krabi 370 91.6 356 84.8 53.9 18,159 16,934 22 7.0 2.4<br />
Phangnga 313 96.2 229 79.1 57.7 20,765 16,643 14 7.0 2.8<br />
Phuket 94 97.9 888 87.7 76.7 80,012 64,925 4 21.1 10.6<br />
Surat Thani 946 96.4 413 92.6 67.5 83,548 69,598 13 12.0 3.3<br />
Ranong 166 89.2 270 80.6 56.8 18,046 15,368 11 13.9 5.6<br />
Chumphon 683 90.5 405 88.1 73.6 29,976 24,914 19 12.7 4.6<br />
Songkhla 940 94.9 502 92.3 72.5 138,759 114,243 11 19.2 7.6<br />
Satun 253 98.0 328 85.5 62.6 15,065 12,888 21 9.8 4.2<br />
Trang 699 98.3 414 88.7 65.9 40,660 32,261 18 9.5 3.2<br />
Phattalung 635 96.7 384 90.9 70.9 24,345 18,808 27 6.3 2.0<br />
Pattani 603 87.7 261 67.2 71.4 27,239 24,707 25 11.7 4.1<br />
Yala 345 91.3 449 77.3 77.6 32,748 26,759 17 11.7 4.8<br />
Narathiwat 534 91.2 424 73.0 66.7 26,032 23,728 29 4.6 1.5<br />
DATA TABLES<br />
Transportation 2001 Communication<br />
Villages Villages with Vehicle Television Radio Telephone 2002 Internet access 2000<br />
Location convenient registration 2000 2000 (%)<br />
access to per Available Leased Persons<br />
Number nearest district 1,000 population % % lines lines per leased household population<br />
% line<br />
1 2 3 4 5 6 7 8 9 10<br />
151
Table 9. Participation<br />
152<br />
Political participation 2001 Civil society participation 2001<br />
Location Eligible voters Vote turnout Community groups Households participate Households participate<br />
per 100,000 pop. in local groups in social services<br />
Number % Number % %<br />
1 2 3 4 5<br />
Kingdom 42,707,241 69.8 203 88.3 96.0<br />
Bangkok Metropolis 3,900,578 66.7 8 37.8 88.2<br />
Bangkok Vicinity 2,554,221 68.5 47 69.1 95.9<br />
Nakhon Pathom 542,571 75.1 103 94.9 98.8<br />
Nonthaburi 626,739 69.9 33 88.5 98.3<br />
Pathum Thani 344,997 70.9 42 57.8 95.8<br />
Samut Prakan 749,766 60.8 19 37.8 98.3<br />
Samut Sakon 290,148 70.5 40 66.3 88.2<br />
Central Region 2,126,948 70.5 127 88.0 96.2<br />
Chai Nat 261,829 68.8 132 85.1 95.6<br />
Phra Nakhon Si Ayutthaya 526,021 72.4 135 92.5 97.9<br />
Lop Buri 553,392 67.6 98 86.6 95.7<br />
Saraburi 406,673 71.6 145 83.4 95.6<br />
Sing Buri 167,100 73.6 201 91.8 95.8<br />
Ang Thong 211,933 70.6 93 88.4 96.5<br />
Eastern Region 2,803,922 70.9 99 86.5 95.2<br />
Chanthaburi 339,574 73.4 140 91.0 95.4<br />
Chachoengsao 451,259 68.7 66 86.8 96.3<br />
Chon Buri 741,921 66.7 43 84.5 95.0<br />
Trat 148,047 70.1 253 92.0 97.4<br />
Nakhon Nayok 179,070 72.0 95 77.9 94.1<br />
Prachin Buri 222,942 94.8 112 81.8 93.8<br />
Rayong 356,794 71.8 73 87.0 93.4<br />
Sa Kaeo 364,315 64.5 167 90.8 96.0<br />
Western Region 2,565,231 70.5 100 88.5 95.3<br />
Ratchaburi 576,825 72.1 72 85.1 94.8<br />
Kanchanaburi 573,849 70.3 95 85.9 95.2<br />
Suphan Buri 610,544 67.9 100 87.9 96.2<br />
Samutshongkhram 147,841 68.5 107 96.5 97.9<br />
Phetchaburi 325,119 75.5 149 87.0 93.4<br />
Prachuap Khiri khan 331,053 68.5 107 88.6 94.0<br />
Northeastern Region 14,857,905 67.4 117 92.6 97.8<br />
Nakon Ratchasima 1,774,057 69.6 84 87.5 97.6<br />
Buri Ram 1,071,367 66.8 128 83.9 95.6<br />
Surin 943,046 65.3 118 93.6 98.9<br />
Si Sa Ket 1,053,151 64.3 148 93.8 98.0<br />
Ubon Ratchathani 1,175,559 70.2 122 89.3 97.5<br />
Yasothon 388,801 68.7 171 93.8 96.6<br />
Chaiyaphum 799,715 67.1 101 90.2 96.9<br />
Amnat Charoen 258,180 67.9 166 93.7 99.0<br />
Nong Bua Lam Phu 333,169 68.1 159 93.0 98.6<br />
Khon Kaen 1,230,970 69.6 109 93.3 97.4<br />
<strong>THAILAND</strong> <strong>HUMAN</strong> <strong>DEVELOPMENT</strong> <strong>REPORT</strong> <strong>2003</strong>
Table 9 Participation<br />
Udon Thani 1,038,644 66.7 97 93.5 98.5<br />
Loei 435,189 74.2 113 93.9 97.6<br />
Nong Khai 617,586 62.3 70 92.4 97.1<br />
Maha Salakam 676,282 69.7 146 95.1 99.1<br />
Roi Et 929,390 66.7 162 92.3 97.6<br />
Kalasin 684,775 70.7 106 93.8 97.1<br />
Sakhon Nakhon 747,106 66.4 93 94.6 98.1<br />
Nakhon Phanom 475,231 69.0 107 96.3 98.5<br />
Mukdahan 225,687 37.4 150 94.7 98.2<br />
Northern Region 8,462,722 72.0 132 91.8 95.4<br />
Chiang Mai 1,106,980 78.8 123 92.4 96.5<br />
Lamphun 306,187 83.8 169 96.8 98.6<br />
Lampang 595,624 76.1 163 98.4 99.1<br />
Uttaradit 356,150 71.7 172 92.9 96.1<br />
Phrae 370,242 77.7 136 97.9 98.4<br />
Nan 337,653 79.5 211 95.6 99.0<br />
Phayao 371,932 74.8 221 97.9 97.1<br />
Chiang Rai 803,294 73.6 117 93.5 97.3<br />
Mae Hong Son 136,183 75.9 174 85.0 94.5<br />
Nakhon Sawan 794,246 66.5 77 87.5 94.5<br />
Uthai Thani 235,072 72.6 137 95.0 97.8<br />
Kamphaeng Phet 525,395 61.6 126 86.5 92.2<br />
Tak 297,126 70.6 109 89.6 96.2<br />
Sukhothai 460,735 68.6 163 90.9 92.2<br />
Phitsanulok 612,660 67.2 100 83.2 88.3<br />
Phichit 419,157 65.7 82 91.0 93.5<br />
Phetchabun 734,086 66.3 124 87.3 91.3<br />
Southern Region 5,435,714 74.8 102 80.5 93.1<br />
Nakhon Si Thammarat 1,040,126 70.1 97 78.4 92.2<br />
Krabi 232,417 77.4 83 81.3 92.8<br />
Phangnga 161,228 76.5 175 88.7 97.1<br />
Phuket 171,943 76.1 35 88.6 97.3<br />
Surat Thani 596,657 74.5 106 81.9 90.0<br />
Ranong 103,220 73.9 134 76.2 92.2<br />
Chumphon 320,902 74.8 97 79.3 89.5<br />
Songkhla 824,476 76.9 106 88.9 94.6<br />
Satun 168,012 82.2 151 70.8 93.4<br />
Trang 394,513 76.5 113 80.4 89.3<br />
Phattalung 352,058 78.0 149 83.5 89.0<br />
Pattani 384,489 74.3 71 72.8 92.4<br />
Yala 267,882 76.3 70 78.5 96.5<br />
Narathiwat 417,791 72.8 85 77.2 96.8<br />
DATA TABLES<br />
Political participation 2001 Civil society participation 2001<br />
Location Eligible voters Vote turnout Community groups Households participate Households participate<br />
per 100,000 pop. in local groups in social services<br />
Number % Number % %<br />
1 2 3 4 5<br />
153
United Nations Development Programme<br />
United Nations Building, 12 th Floor<br />
Rajdamnern Nok Avenue<br />
Bangkok 10200, Thailand<br />
Tel: (66-2) 2881234<br />
Fax: (66-2) 2800556<br />
E-mail: registry.th@undp.org<br />
154 Web site: http://www.undp.or.th<br />
��<br />
��<br />
<strong>THAILAND</strong> <strong>HUMAN</strong> <strong>DEVELOPMENT</strong> <strong>REPORT</strong> <strong>2003</strong>