Classification of rice cultivars based on cluster analysis of hydration ...
Classification of rice cultivars based on cluster analysis of hydration ...
Classification of rice cultivars based on cluster analysis of hydration ...

You also want an ePaper? Increase the reach of your titles
YUMPU automatically turns print PDFs into web optimized ePapers that Google loves.
time, pasting temperature, peak viscosity, trough viscosity, final<br />
viscosity, breakdown, and setback. Other important parameters<br />
which represent processability are hydrati<strong>on</strong> properties: water<br />
absorpti<strong>on</strong> index, water solubility, and swelling power (Crosbie,1991;<br />
Li & Yeh, 2001). The hydrati<strong>on</strong> properties <str<strong>on</strong>g>of</str<strong>on</strong>g> starches can be correlated<br />
with their pasting behaviors which are important for the determinati<strong>on</strong><br />
<str<strong>on</strong>g>of</str<strong>on</strong>g> starch quality. In many cases, a single parameter from<br />
different measures rarely reflects whole characteristics <str<strong>on</strong>g>of</str<strong>on</strong>g> a starch. In<br />
additi<strong>on</strong>, it is difficult to classify the <str<strong>on</strong>g>rice</str<strong>on</strong>g> starches intuitively <str<strong>on</strong>g>based</str<strong>on</strong>g> <strong>on</strong><br />
the parameters because <str<strong>on</strong>g>of</str<strong>on</strong>g> the complexity <str<strong>on</strong>g>of</str<strong>on</strong>g> them.<br />
To overcome these issues, statistical categorizati<strong>on</strong> such as<br />
<strong>cluster</strong>ing can be used as an alternative approach to obtain<br />
a comm<strong>on</strong> pattern from complex data sets <str<strong>on</strong>g>of</str<strong>on</strong>g> hydrati<strong>on</strong> and pasting<br />
parameters. Cluster <strong>analysis</strong> is a statistical method to c<strong>on</strong>vert<br />
various characteristics <str<strong>on</strong>g>of</str<strong>on</strong>g> objects to quantitative measures (so<br />
called similarity distance) and corresp<strong>on</strong>dingly to <strong>cluster</strong> them at<br />
relatively close distances into a category (Endo, Okada, Nagao, &<br />
D’appl<strong>on</strong>ia, 1990). We hypothesize that the <strong>cluster</strong> <strong>analysis</strong> can be<br />
used to categorize the <str<strong>on</strong>g>rice</str<strong>on</strong>g> <str<strong>on</strong>g>cultivars</str<strong>on</strong>g> having similar hydrati<strong>on</strong> and<br />
pasting parameters into single group. In this approach, starches<br />
from different <str<strong>on</strong>g>cultivars</str<strong>on</strong>g> but with similar processability properties<br />
can be assumed as a single commodity for easy identificati<strong>on</strong> and<br />
selecti<strong>on</strong> by starch industry for specific applicati<strong>on</strong> purposes.<br />
In this study, <str<strong>on</strong>g>rice</str<strong>on</strong>g> starches were extracted from 12 different<br />
<str<strong>on</strong>g>cultivars</str<strong>on</strong>g> and their processability parameters were measured; they<br />
are categorized into several groups by <strong>cluster</strong> <strong>analysis</strong> <str<strong>on</strong>g>of</str<strong>on</strong>g> the processability<br />
parameters. In additi<strong>on</strong>, the texture properties <str<strong>on</strong>g>of</str<strong>on</strong>g> these <str<strong>on</strong>g>rice</str<strong>on</strong>g><br />
starches were also determined to validate the categorizati<strong>on</strong>.<br />
2. Materials and methods<br />
2.1. Materials<br />
Twelve <str<strong>on</strong>g>rice</str<strong>on</strong>g> <str<strong>on</strong>g>cultivars</str<strong>on</strong>g> are listed in Table 1 and were grown at the<br />
Nati<strong>on</strong>al Institute <str<strong>on</strong>g>of</str<strong>on</strong>g> Crop Science, Rural Development Administrati<strong>on</strong>,<br />
Korea in 2009. The grains <str<strong>on</strong>g>of</str<strong>on</strong>g> each <str<strong>on</strong>g>rice</str<strong>on</strong>g> cultivar was polished<br />
to separate husk and bran and subsequently stored for further<br />
starch preparati<strong>on</strong>.<br />
2.2. Rice starch preparati<strong>on</strong><br />
Rice starch from each cultivar was isolated by an alkaline<br />
steeping method (Yamamoto, Sawada, & Onogaki, 1973).<br />
2.3. Amylose c<strong>on</strong>tent measurement<br />
Amylose c<strong>on</strong>tent <str<strong>on</strong>g>of</str<strong>on</strong>g> the <str<strong>on</strong>g>rice</str<strong>on</strong>g> starches was determined by using<br />
the iodine test (Williams, Kuzina, & Hlynka, 1970).<br />
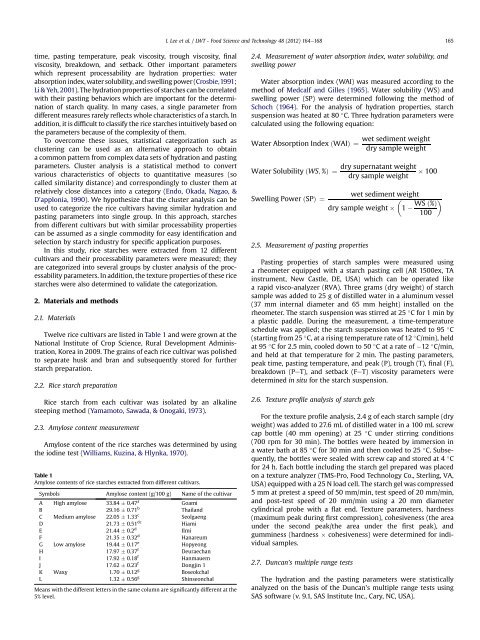
Table 1<br />
Amylose c<strong>on</strong>tents <str<strong>on</strong>g>of</str<strong>on</strong>g> <str<strong>on</strong>g>rice</str<strong>on</strong>g> starches extracted from different <str<strong>on</strong>g>cultivars</str<strong>on</strong>g>.<br />
Symbols Amylose c<strong>on</strong>tent (g/100 g) Name <str<strong>on</strong>g>of</str<strong>on</strong>g> the cultivar<br />
A High amylose 33.84 0.47 a<br />
Goami<br />
B 29.16 0.71 b<br />
Thailand<br />
C Medium amylose 22.05 1.33 c<br />
Seolgaeng<br />
D 21.73 0.51 dc<br />
Hiami<br />
E 21.44 0.2 d<br />
Ilmi<br />
F 21.35 0.32 d<br />
Hanareum<br />
G Low amylose 19.44 0.17 e<br />
Hopye<strong>on</strong>g<br />
H 17.97 0.37 f<br />
Deuraechan<br />
I 17.92 0.18 f<br />
Hanmauem<br />
J 17.62 0.23 f<br />
D<strong>on</strong>gjin 1<br />
K Waxy 1.70 0.12 g<br />
Boseokchal<br />
L 1.32 0.56 g<br />
Shinse<strong>on</strong>chal<br />
Means with the different letters in the same column are significantly different at the<br />
5% level.<br />
I. Lee et al. / LWT - Food Science and Technology 48 (2012) 164e168 165<br />
2.4. Measurement <str<strong>on</strong>g>of</str<strong>on</strong>g> water absorpti<strong>on</strong> index, water solubility, and<br />
swelling power<br />
Water absorpti<strong>on</strong> index (WAI) was measured according to the<br />
method <str<strong>on</strong>g>of</str<strong>on</strong>g> Medcalf and Gilles (1965). Water solubility (WS) and<br />
swelling power (SP) were determined following the method <str<strong>on</strong>g>of</str<strong>on</strong>g><br />
Schoch (1964). For the <strong>analysis</strong> <str<strong>on</strong>g>of</str<strong>on</strong>g> hydrati<strong>on</strong> properties, starch<br />
suspensi<strong>on</strong> was heated at 80 C. Three hydrati<strong>on</strong> parameters were<br />
calculated using the following equati<strong>on</strong>:<br />
Water Absorpti<strong>on</strong> Index ðWAIÞ ¼<br />
Water Solubility ðWS; %Þ ¼<br />
wet sediment weight<br />
dry sample weight<br />
dry supernatant weight<br />
dry sample weight<br />
100<br />
wet sediment weight<br />
Swelling Power ðSPÞ ¼<br />
WS ð%Þ<br />
dry sample weight 1<br />
100<br />
2.5. Measurement <str<strong>on</strong>g>of</str<strong>on</strong>g> pasting properties<br />
Pasting properties <str<strong>on</strong>g>of</str<strong>on</strong>g> starch samples were measured using<br />
a rheometer equipped with a starch pasting cell (AR 1500ex, TA<br />
instrument, New Castle, DE, USA) which can be operated like<br />
a rapid visco-analyzer (RVA). Three grams (dry weight) <str<strong>on</strong>g>of</str<strong>on</strong>g> starch<br />
sample was added to 25 g <str<strong>on</strong>g>of</str<strong>on</strong>g> distilled water in a aluminum vessel<br />
(37 mm internal diameter and 65 mm height) installed <strong>on</strong> the<br />
rheometer. The starch suspensi<strong>on</strong> was stirred at 25 C for 1 min by<br />
a plastic paddle. During the measurement, a time-temperature<br />
schedule was applied; the starch suspensi<strong>on</strong> was heated to 95 C<br />
(starting from 25 C, at a rising temperature rate <str<strong>on</strong>g>of</str<strong>on</strong>g> 12 C/min), held<br />
at 95 C for 2.5 min, cooled down to 50 C at a rate <str<strong>on</strong>g>of</str<strong>on</strong>g> 12 C/min,<br />
and held at that temperature for 2 min. The pasting parameters,<br />
peak time, pasting temperature, and peak (P), trough (T), final (F),<br />
breakdown (PeT), and setback (FeT) viscosity parameters were<br />
determined in situ for the starch suspensi<strong>on</strong>.<br />
2.6. Texture pr<str<strong>on</strong>g>of</str<strong>on</strong>g>ile <strong>analysis</strong> <str<strong>on</strong>g>of</str<strong>on</strong>g> starch gels<br />
For the texture pr<str<strong>on</strong>g>of</str<strong>on</strong>g>ile <strong>analysis</strong>, 2.4 g <str<strong>on</strong>g>of</str<strong>on</strong>g> each starch sample (dry<br />
weight) was added to 27.6 mL <str<strong>on</strong>g>of</str<strong>on</strong>g> distilled water in a 100 mL screw<br />
cap bottle (40 mm opening) at 25 C under stirring c<strong>on</strong>diti<strong>on</strong>s<br />
(700 rpm for 30 min). The bottles were heated by immersi<strong>on</strong> in<br />
a water bath at 85 C for 30 min and then cooled to 25 C. Subsequently,<br />
the bottles were sealed with screw cap and stored at 4 C<br />
for 24 h. Each bottle including the starch gel prepared was placed<br />
<strong>on</strong> a texture analyzer (TMS-Pro, Food Technology Co., Sterling, VA,<br />
USA) equipped with a 25 N load cell. The starch gel was compressed<br />
5 mm at pretest a speed <str<strong>on</strong>g>of</str<strong>on</strong>g> 50 mm/min, test speed <str<strong>on</strong>g>of</str<strong>on</strong>g> 20 mm/min,<br />
and post-test speed <str<strong>on</strong>g>of</str<strong>on</strong>g> 20 mm/min using a 20 mm diameter<br />
cylindrical probe with a flat end. Texture parameters, hardness<br />
(maximum peak during first compressi<strong>on</strong>), cohesiveness (the area<br />
under the sec<strong>on</strong>d peak/the area under the first peak), and<br />
gumminess (hardness cohesiveness) were determined for individual<br />
samples.<br />
2.7. Duncan’s multiple range tests<br />
The hydrati<strong>on</strong> and the pasting parameters were statistically<br />
analyzed <strong>on</strong> the basis <str<strong>on</strong>g>of</str<strong>on</strong>g> the Duncan’s multiple range tests using<br />
SAS s<str<strong>on</strong>g>of</str<strong>on</strong>g>tware (v. 9.1, SAS Institute Inc., Cary, NC, USA).