2021-03 -- Real Estate of Northern Virginia Market Report - March 2021 Real Estate Trends - Michele Hudnall
2021 - Dare I Say Bidding Wars - Highly Competitive Market and a Unique Sellers Market! The Real Estate of Northern Virginia Report is a comprehensive residential real estate update for the Northern Virginia (NVA) region. The report is a unique report for the region that is both wide and deep, focused locally with actionable advice. The data is drawn from the local listing service, Bright MLS, compiled and presented with my opinion and advice as the author, knowledge as a Realtor and lifetime resident of this region.
2021 - Dare I Say Bidding Wars - Highly Competitive Market and a Unique Sellers Market!
The Real Estate of Northern Virginia Report is a comprehensive residential real estate update for the Northern Virginia (NVA) region. The report is a unique report for the region that is both wide and deep, focused locally with actionable advice.
The data is drawn from the local listing service, Bright MLS, compiled and presented with my opinion and advice as the author, knowledge as a Realtor and lifetime resident of this region.
- TAGS
- fauquier-county-real-estate
- prince-william-real-estate
- loudoun-county-real-estate
- fairfax-county-real-estate
- arlington-real-estate
- alexandria-real-estate
- fairfax-real-estate
- falls-church-real-estate
- manassas-real-estate
- best-northern-virginia-realtor
- you-northern-virginia-realto
- northern-virginia-home-trends
- norther-virginia-home-prices
- real-estate-of-nva
- nva-real-estate-trends
- nova-real-estate-trends
- northern-virginia-real-estate
- michele-hudnall
- realestatofnva

Create successful ePaper yourself
Turn your PDF publications into a flip-book with our unique Google optimized e-Paper software.
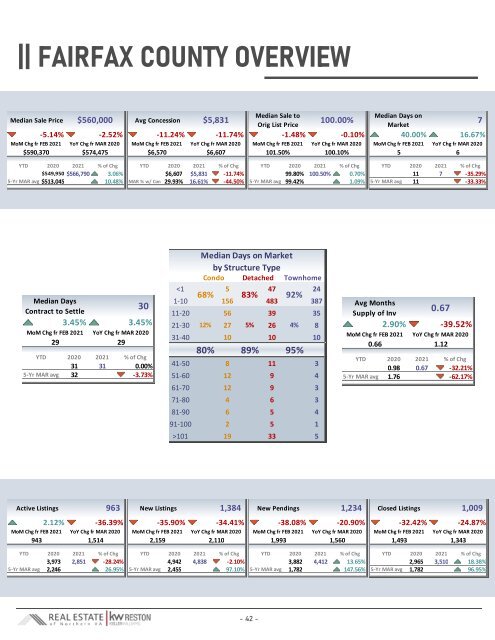
|| FAIRFAX COUNTY OVERVIEW<br />
Median Sale to<br />
Median Days on<br />
Median Sale Price $560,000 Avg Concession $5,831<br />
100.00%<br />
Orig List Price<br />
<strong>Market</strong><br />
7<br />
-5.14% -2.52% -11.24% -11.74%<br />
-1.48% -0.10% 40.00% 16.67%<br />
MoM Chg fr FEB <strong>2021</strong> YoY Chg fr MAR 2020 MoM Chg fr FEB <strong>2021</strong> YoY Chg fr MAR 2020 MoM Chg fr FEB <strong>2021</strong> YoY Chg fr MAR 2020 MoM Chg fr FEB <strong>2021</strong> YoY Chg fr MAR 2020<br />
$590,370 $574,475 $6,570 $6,607 101.50% 100.10%<br />
5 6<br />
YTD 2020 <strong>2021</strong> % <strong>of</strong> Chg YTD 2020 <strong>2021</strong> % <strong>of</strong> Chg YTD 2020 <strong>2021</strong> % <strong>of</strong> Chg YTD 2020 <strong>2021</strong> % <strong>of</strong> Chg<br />
$549,950 $566,790 3.06% $6,607 $5,831 -11.74% 99.80% 100.50% 0.70% 11 7 -35.29%<br />
5-Yr MAR avg $513,045 10.48% MAR % w/ Con 29.93% 16.61% -44.50% 5-Yr MAR avg 99.42% 1.09% 5-Yr MAR avg 11 -33.33%<br />
Median Days<br />
30<br />
Contract to Settle<br />
3.45%<br />
3.45%<br />
MoM Chg fr FEB <strong>2021</strong> YoY Chg fr MAR 2020<br />
29 29<br />
YTD 2020 <strong>2021</strong> % <strong>of</strong> Chg<br />
31 31 0.00%<br />
5-Yr MAR avg 32 -3.73%<br />
Median Days on <strong>Market</strong><br />
by Structure Type<br />
Condo Detached Townhome<br />
101 19 33 5<br />
Avg Months<br />
Supply <strong>of</strong> Inv<br />
0.67<br />
2.90% -39.52%<br />
MoM Chg fr FEB <strong>2021</strong> YoY Chg fr MAR 2020<br />
0.66 1.12<br />
YTD 2020 <strong>2021</strong> % <strong>of</strong> Chg<br />
0.98 0.67 -32.21%<br />
5-Yr MAR avg 1.76 -62.17%<br />
Active Listings 963<br />
New Listings 1,384 New Pendings 1,234 Closed Listings<br />
2.12% -36.39% -35.90% -34.41% -38.08% -20.90% -32.42% -24.87%<br />
MoM Chg fr FEB <strong>2021</strong> YoY Chg fr MAR 2020 MoM Chg fr FEB <strong>2021</strong> YoY Chg fr MAR 2020 MoM Chg fr FEB <strong>2021</strong> YoY Chg fr MAR 2020 MoM Chg fr FEB <strong>2021</strong> YoY Chg fr MAR 2020<br />
943 1,514 2,159 2,110 1,993 1,560 1,493 1,343<br />
YTD 2020 <strong>2021</strong> % <strong>of</strong> Chg YTD 2020 <strong>2021</strong> % <strong>of</strong> Chg YTD 2020 <strong>2021</strong> % <strong>of</strong> Chg YTD 2020 <strong>2021</strong> % <strong>of</strong> Chg<br />
3,973 2,851 -28.24% 4,942 4,838 -2.10% 3,882 4,412 13.65% 2,965 3,510 18.38%<br />
5-Yr MAR avg 2,246 26.95% 5-Yr MAR avg 2,455 97.10% 5-Yr MAR avg 1,782 147.56% 5-Yr MAR avg 1,782 96.95%<br />
1,009<br />
- 42 -