PCC June July 2021 e

Create successful ePaper yourself
Turn your PDF publications into a flip-book with our unique Google optimized e-Paper software.
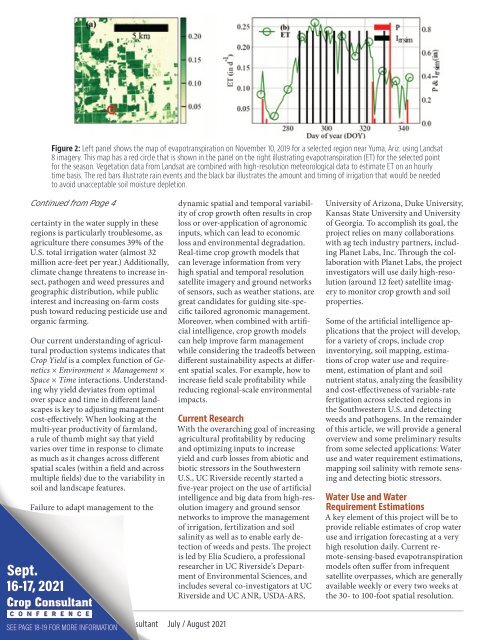
Figure 2: Left panel shows the map of evapotranspiration on November 10, 2019 for a selected region near Yuma, Ariz. using Landsat<br />
8 imagery. This map has a red circle that is shown in the panel on the right illustrating evapotranspiration (ET) for the selected point<br />
for the season. Vegetation data from Landsat are combined with high-resolution meteorological data to estimate ET on an hourly<br />
time basis. The red bars illustrate rain events and the black bar illustrates the amount and timing of irrigation that would be needed<br />
to avoid unacceptable soil moisture depletion.<br />
Continued from Page 4<br />
certainty in the water supply in these<br />
regions is particularly troublesome, as<br />
agriculture there consumes 39% of the<br />
U.S. total irrigation water (almost 32<br />
million acre-feet per year.) Additionally,<br />
climate change threatens to increase insect,<br />
pathogen and weed pressures and<br />
geographic distribution, while public<br />
interest and increasing on-farm costs<br />
push toward reducing pesticide use and<br />
organic farming.<br />
Our current understanding of agricultural<br />
production systems indicates that<br />
Crop Yield is a complex function of Genetics<br />
× Environment × Management ×<br />
Space × Time interactions. Understanding<br />
why yield deviates from optimal<br />
over space and time in different landscapes<br />
is key to adjusting management<br />
cost-effectively. When looking at the<br />
multi-year productivity of farmland,<br />
a rule of thumb might say that yield<br />
varies over time in response to climate<br />
as much as it changes across different<br />
spatial scales (within a field and across<br />
multiple fields) due to the variability in<br />
soil and landscape features.<br />
Failure to adapt management to the<br />
Sept.<br />
16-17, <strong>2021</strong><br />
dynamic spatial and temporal variability<br />
of crop growth often results in crop<br />
loss or over-application of agronomic<br />
inputs, which can lead to economic<br />
loss and environmental degradation.<br />
Real-time crop growth models that<br />
can leverage information from very<br />
high spatial and temporal resolution<br />
satellite imagery and ground networks<br />
of sensors, such as weather stations, are<br />
great candidates for guiding site-specific<br />
tailored agronomic management.<br />
Moreover, when combined with artificial<br />
intelligence, crop growth models<br />
can help improve farm management<br />
while considering the tradeoffs between<br />
different sustainability aspects at different<br />
spatial scales. For example, how to<br />
increase field scale profitability while<br />
reducing regional-scale environmental<br />
impacts.<br />
Current Research<br />
With the overarching goal of increasing<br />
agricultural profitability by reducing<br />
and optimizing inputs to increase<br />
yield and curb losses from abiotic and<br />
biotic stressors in the Southwestern<br />
U.S., UC Riverside recently started a<br />
five-year project on the use of artificial<br />
intelligence and big data from high-resolution<br />
imagery and ground sensor<br />
networks to improve the management<br />
of irrigation, fertilization and soil<br />
salinity as well as to enable early detection<br />
of weeds and pests. The project<br />
is led by Elia Scudiero, a professional<br />
researcher in UC Riverside’s Department<br />
of Environmental Sciences, and<br />
includes several co-investigators at UC<br />
Riverside and UC ANR, USDA-ARS,<br />
University of Arizona, Duke University,<br />
Kansas State University and University<br />
of Georgia. To accomplish its goal, the<br />
project relies on many collaborations<br />
with ag tech industry partners, including<br />
Planet Labs, Inc. Through the collaboration<br />
with Planet Labs, the project<br />
investigators will use daily high-resolution<br />
(around 12 feet) satellite imagery<br />
to monitor crop growth and soil<br />
properties.<br />
Some of the artificial intelligence applications<br />
that the project will develop,<br />
for a variety of crops, include crop<br />
inventorying, soil mapping, estimations<br />
of crop water use and requirement,<br />
estimation of plant and soil<br />
nutrient status, analyzing the feasibility<br />
and cost-effectiveness of variable-rate<br />
fertigation across selected regions in<br />
the Southwestern U.S. and detecting<br />
weeds and pathogens. In the remainder<br />
of this article, we will provide a general<br />
overview and some preliminary results<br />
from some selected applications: Water<br />
use and water requirement estimations,<br />
mapping soil salinity with remote sensing<br />
and detecting biotic stressors.<br />
Water Use and Water<br />
Requirement Estimations<br />
A key element of this project will be to<br />
provide reliable estimates of crop water<br />
use and irrigation forecasting at a very<br />
high resolution daily. Current remote-sensing-based<br />
evapotranspiration<br />
models often suffer from infrequent<br />
satellite overpasses, which are generally<br />
available weekly or every two weeks at<br />
the 30- to 100-foot spatial resolution.<br />
SEE PAGE 618-19 FOR MORE Progressive INFORMATION Crop Consultant <strong>July</strong> / August <strong>2021</strong>