PCC June July 2021 e

You also want an ePaper? Increase the reach of your titles
YUMPU automatically turns print PDFs into web optimized ePapers that Google loves.
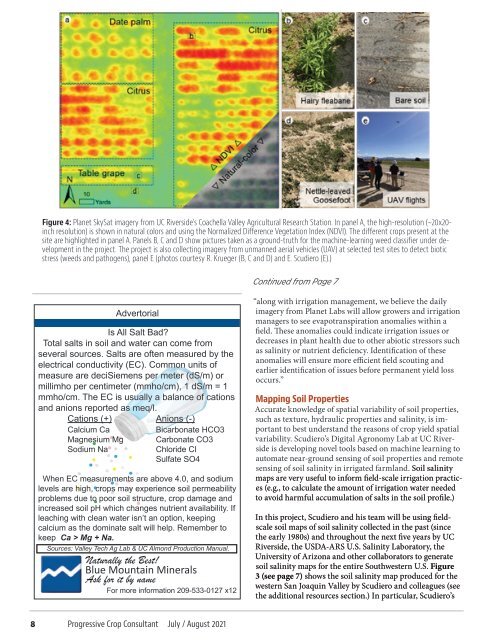
Figure 4: Planet SkySat imagery from UC Riverside’s Coachella Valley Agricultural Research Station. In panel A, the high-resolution (~20x20-<br />
inch resolution) is shown in natural colors and using the Normalized Difference Vegetation Index (NDVI). The different crops present at the<br />
site are highlighted in panel A. Panels B, C and D show pictures taken as a ground-truth for the machine-learning weed classifier under development<br />
in the project. The project is also collecting imagery from unmanned aerial vehicles (UAV) at selected test sites to detect biotic<br />
stress (weeds and pathogens), panel E (photos courtesy R. Krueger (B, C and D) and E. Scudiero (E).)<br />
Continued from Page 7<br />
Advertorial<br />
Is All Salt Bad?<br />
Total salts in soil and water can come from<br />
several sources. Salts are often measured by the<br />
electrical conductivity (EC). Common units of<br />
measure are deciSiemens per meter (dS/m) or<br />
millimho per centimeter (mmho/cm), 1 dS/m = 1<br />
mmho/cm. The EC is usually a balance of cations<br />
and anions reported as meq/l.<br />
Cations (+) Anions (-)<br />
Calcium Ca<br />
Bicarbonate HCO3<br />
Magnesium Mg<br />
Sodium Na<br />
Carbonate CO3<br />
Chloride CI<br />
Sulfate SO4<br />
When EC measurements are above 4.0, and sodium<br />
levels are high, crops may experience soil permeability<br />
problems due to poor soil structure, crop damage and<br />
increased soil pH which changes nutrient availability. If<br />
leaching with clean water isn’t an option, keeping<br />
calcium as the dominate salt will help. Remember to<br />
keep Ca > Mg + Na.<br />
Sources: Valley Tech Ag Lab & UC Almond Production Manual.<br />
Naturally the Best!<br />
Blue Mountain Minerals<br />
Ask for it by name<br />
For more information 209-533-0127 x12<br />
“along with irrigation management, we believe the daily<br />
imagery from Planet Labs will allow growers and irrigation<br />
managers to see evapotranspiration anomalies within a<br />
field. These anomalies could indicate irrigation issues or<br />
decreases in plant health due to other abiotic stressors such<br />
as salinity or nutrient deficiency. Identification of these<br />
anomalies will ensure more efficient field scouting and<br />
earlier identification of issues before permanent yield loss<br />
occurs.”<br />
Mapping Soil Properties<br />
Accurate knowledge of spatial variability of soil properties,<br />
such as texture, hydraulic properties and salinity, is important<br />
to best understand the reasons of crop yield spatial<br />
variability. Scudiero’s Digital Agronomy Lab at UC Riverside<br />
is developing novel tools based on machine learning to<br />
automate near-ground sensing of soil properties and remote<br />
sensing of soil salinity in irrigated farmland. Soil salinity<br />
maps are very useful to inform field-scale irrigation practices<br />
(e.g., to calculate the amount of irrigation water needed<br />
to avoid harmful accumulation of salts in the soil profile.)<br />
In this project, Scudiero and his team will be using fieldscale<br />
soil maps of soil salinity collected in the past (since<br />
the early 1980s) and throughout the next five years by UC<br />
Riverside, the USDA-ARS U.S. Salinity Laboratory, the<br />
University of Arizona and other collaborators to generate<br />
soil salinity maps for the entire Southwestern U.S. Figure<br />
3 (see page 7) shows the soil salinity map produced for the<br />
western San Joaquin Valley by Scudiero and colleagues (see<br />
the additional resources section.) In particular, Scudiero’s<br />
8 Progressive Crop Consultant <strong>July</strong> / August <strong>2021</strong>