

Introduction to Environmental Science, 2nd Edition, 2018a
Introduction to Environmental Science, 2nd Edition, 2018a
Introduction to Environmental Science, 2nd Edition, 2018a

You also want an ePaper? Increase the reach of your titles
YUMPU automatically turns print PDFs into web optimized ePapers that Google loves.
Yeast is a microscopic fungus, used <strong>to</strong> make bread and alcoholic beverages, that exhibits the<br />
classical S-shaped logistic growth curve when grown in a test tube (Figure 2.3). Its growth levels off<br />
as the population depletes the nutrients that are necessary for its growth. In the real world, however,<br />
there are variations <strong>to</strong> this idealized curve. For example, a population of harbor seals may exceed the<br />
carrying capacity for a short time and then fall below the carrying capacity for a brief time period and<br />
as more resources become available, the population grows again (Figure 2.4). This fluctuation in<br />
population size continues <strong>to</strong> occur as the population oscillates around its carrying capacity. Still, even<br />
with this oscillation, the logistic model is exhibited.<br />
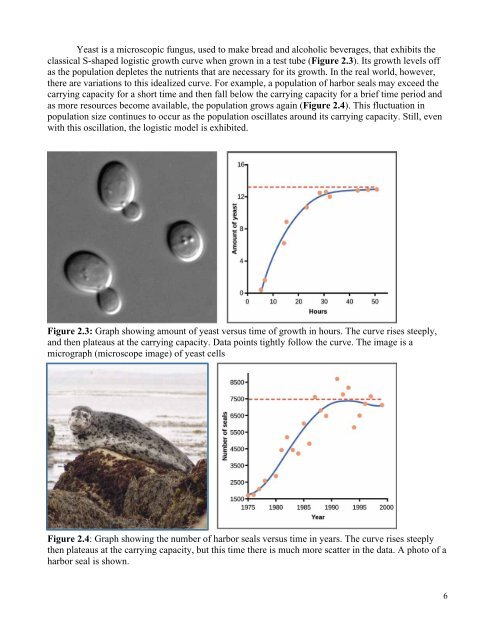
Figure 2.3: Graph showing amount of yeast versus time of growth in hours. The curve rises steeply,<br />
and then plateaus at the carrying capacity. Data points tightly follow the curve. The image is a<br />
micrograph (microscope image) of yeast cells<br />
Figure 2.4: Graph showing the number of harbor seals versus time in years. The curve rises steeply<br />
then plateaus at the carrying capacity, but this time there is much more scatter in the data. A pho<strong>to</strong> of a<br />
harbor seal is shown.<br />
6


