

Introduction to Environmental Science, 2nd Edition, 2018a
Introduction to Environmental Science, 2nd Edition, 2018a
Introduction to Environmental Science, 2nd Edition, 2018a

Create successful ePaper yourself
Turn your PDF publications into a flip-book with our unique Google optimized e-Paper software.
surviving). As the population ages, individuals die and the curves goes down. A survivorship curve<br />
never goes up.<br />
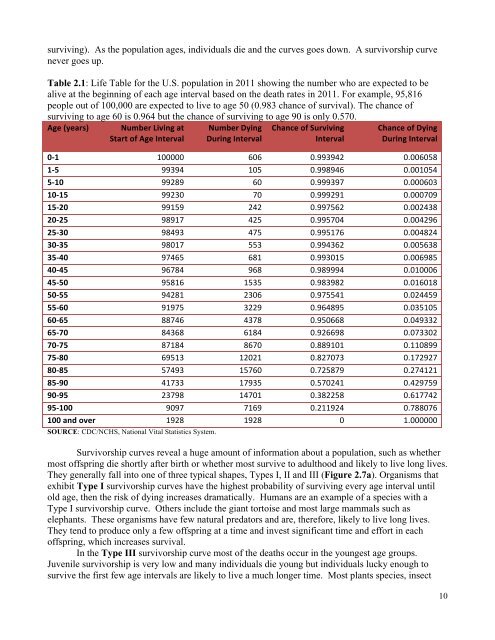
Table 2.1: Life Table for the U.S. population in 2011 showing the number who are expected <strong>to</strong> be<br />
alive at the beginning of each age interval based on the death rates in 2011. For example, 95,816<br />
people out of 100,000 are expected <strong>to</strong> live <strong>to</strong> age 50 (0.983 chance of survival). The chance of<br />
surviving <strong>to</strong> age 60 is 0.964 but the chance of surviving <strong>to</strong> age 90 is only 0.570.<br />
<br />
<br />
<br />
<br />
<br />
<br />
<br />
<br />
<br />
<br />
<br />
<br />
<br />
<br />
<br />
<br />
<br />
<br />
<br />
<br />
<br />
<br />
<br />
<br />
SOURCE: CDC/NCHS, National Vital Statistics System.<br />
Survivorship curves reveal a huge amount of information about a population, such as whether<br />
most offspring die shortly after birth or whether most survive <strong>to</strong> adulthood and likely <strong>to</strong> live long lives.<br />
They generally fall in<strong>to</strong> one of three typical shapes, Types I, II and III (Figure 2.7a). Organisms that<br />
exhibit Type I survivorship curves have the highest probability of surviving every age interval until<br />
old age, then the risk of dying increases dramatically. Humans are an example of a species with a<br />
Type I survivorship curve. Others include the giant <strong>to</strong>r<strong>to</strong>ise and most large mammals such as<br />
elephants. These organisms have few natural preda<strong>to</strong>rs and are, therefore, likely <strong>to</strong> live long lives.<br />
They tend <strong>to</strong> produce only a few offspring at a time and invest significant time and effort in each<br />
offspring, which increases survival.<br />
In the Type III survivorship curve most of the deaths occur in the youngest age groups.<br />
Juvenile survivorship is very low and many individuals die young but individuals lucky enough <strong>to</strong><br />
survive the first few age intervals are likely <strong>to</strong> live a much longer time. Most plants species, insect<br />
10


