Breakeven extraction factors for the Merensky Reef using stope ...
Breakeven extraction factors for the Merensky Reef using stope ...
Breakeven extraction factors for the Merensky Reef using stope ...

Create successful ePaper yourself
Turn your PDF publications into a flip-book with our unique Google optimized e-Paper software.
40<br />
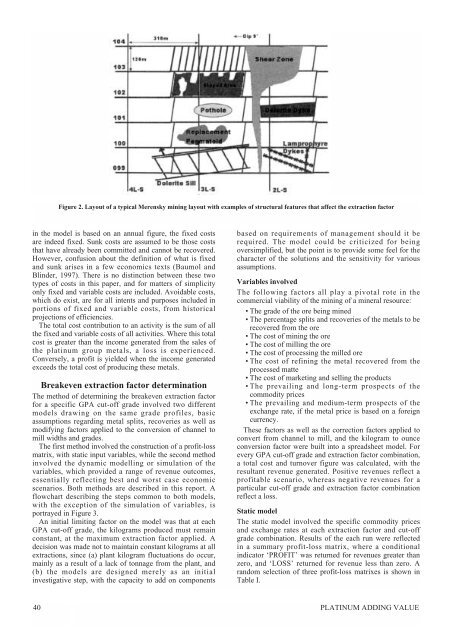
Figure 2. Layout of a typical <strong>Merensky</strong> mining layout with examples of structural features that affect <strong>the</strong> <strong>extraction</strong> factor<br />
in <strong>the</strong> model is based on an annual figure, <strong>the</strong> fixed costs<br />
are indeed fixed. Sunk costs are assumed to be those costs<br />
that have already been committed and cannot be recovered.<br />
However, confusion about <strong>the</strong> definition of what is fixed<br />
and sunk arises in a few economics texts (Baumol and<br />
Blinder, 1997). There is no distinction between <strong>the</strong>se two<br />
types of costs in this paper, and <strong>for</strong> matters of simplicity<br />
only fixed and variable costs are included. Avoidable costs,<br />
which do exist, are <strong>for</strong> all intents and purposes included in<br />
portions of fixed and variable costs, from historical<br />
projections of efficiencies.<br />
The total cost contribution to an activity is <strong>the</strong> sum of all<br />
<strong>the</strong> fixed and variable costs of all activities. Where this total<br />
cost is greater than <strong>the</strong> income generated from <strong>the</strong> sales of<br />
<strong>the</strong> platinum group metals, a loss is experienced.<br />
Conversely, a profit is yielded when <strong>the</strong> income generated<br />
exceeds <strong>the</strong> total cost of producing <strong>the</strong>se metals.<br />
<strong>Breakeven</strong> <strong>extraction</strong> factor determination<br />
The method of determining <strong>the</strong> breakeven <strong>extraction</strong> factor<br />
<strong>for</strong> a specific GPA cut-off grade involved two different<br />
models drawing on <strong>the</strong> same grade profiles, basic<br />
assumptions regarding metal splits, recoveries as well as<br />
modifying <strong>factors</strong> applied to <strong>the</strong> conversion of channel to<br />
mill widths and grades.<br />
The first method involved <strong>the</strong> construction of a profit-loss<br />
matrix, with static input variables, while <strong>the</strong> second method<br />
involved <strong>the</strong> dynamic modelling or simulation of <strong>the</strong><br />
variables, which provided a range of revenue outcomes,<br />
essentially reflecting best and worst case economic<br />
scenarios. Both methods are described in this report. A<br />
flowchart describing <strong>the</strong> steps common to both models,<br />
with <strong>the</strong> exception of <strong>the</strong> simulation of variables, is<br />
portrayed in Figure 3.<br />
An initial limiting factor on <strong>the</strong> model was that at each<br />
GPA cut-off grade, <strong>the</strong> kilograms produced must remain<br />
constant, at <strong>the</strong> maximum <strong>extraction</strong> factor applied. A<br />
decision was made not to maintain constant kilograms at all<br />
<strong>extraction</strong>s, since (a) plant kilogram fluctuations do occur,<br />
mainly as a result of a lack of tonnage from <strong>the</strong> plant, and<br />
(b) <strong>the</strong> models are designed merely as an initial<br />
investigative step, with <strong>the</strong> capacity to add on components<br />
based on requirements of management should it be<br />
required. The model could be criticized <strong>for</strong> being<br />
oversimplified, but <strong>the</strong> point is to provide some feel <strong>for</strong> <strong>the</strong><br />
character of <strong>the</strong> solutions and <strong>the</strong> sensitivity <strong>for</strong> various<br />
assumptions.<br />
Variables involved<br />
The following <strong>factors</strong> all play a pivotal rote in <strong>the</strong><br />
commercial viability of <strong>the</strong> mining of a mineral resource:<br />
• The grade of <strong>the</strong> ore being mined<br />
• The percentage splits and recoveries of <strong>the</strong> metals to be<br />
recovered from <strong>the</strong> ore<br />
• The cost of mining <strong>the</strong> ore<br />
• The cost of milling <strong>the</strong> ore<br />
• The cost of processing <strong>the</strong> milled ore<br />
• The cost of refining <strong>the</strong> metal recovered from <strong>the</strong><br />
processed matte<br />
• The cost of marketing and selling <strong>the</strong> products<br />
• The prevailing and long-term prospects of <strong>the</strong><br />
commodity prices<br />
• The prevailing and medium-term prospects of <strong>the</strong><br />
exchange rate, if <strong>the</strong> metal price is based on a <strong>for</strong>eign<br />
currency.<br />
These <strong>factors</strong> as well as <strong>the</strong> correction <strong>factors</strong> applied to<br />
convert from channel to mill, and <strong>the</strong> kilogram to ounce<br />
conversion factor were built into a spreadsheet model. For<br />
every GPA cut-off grade and <strong>extraction</strong> factor combination,<br />
a total cost and turnover figure was calculated, with <strong>the</strong><br />
resultant revenue generated. Positive revenues reflect a<br />
profitable scenario, whereas negative revenues <strong>for</strong> a<br />
particular cut-off grade and <strong>extraction</strong> factor combination<br />
reflect a loss.<br />
Static model<br />
The static model involved <strong>the</strong> specific commodity prices<br />
and exchange rates at each <strong>extraction</strong> factor and cut-off<br />
grade combination. Results of <strong>the</strong> each run were reflected<br />
in a summary profit-loss matrix, where a conditional<br />
indicator ‘PROFIT’ was returned <strong>for</strong> revenues greater than<br />
zero, and ‘LOSS’ returned <strong>for</strong> revenue less than zero. A<br />
random selection of three profit-loss matrixes is shown in<br />
Table I.<br />
PLATINUM ADDING VALUE