Breakeven extraction factors for the Merensky Reef using stope ...
Breakeven extraction factors for the Merensky Reef using stope ...
Breakeven extraction factors for the Merensky Reef using stope ...

You also want an ePaper? Increase the reach of your titles
YUMPU automatically turns print PDFs into web optimized ePapers that Google loves.
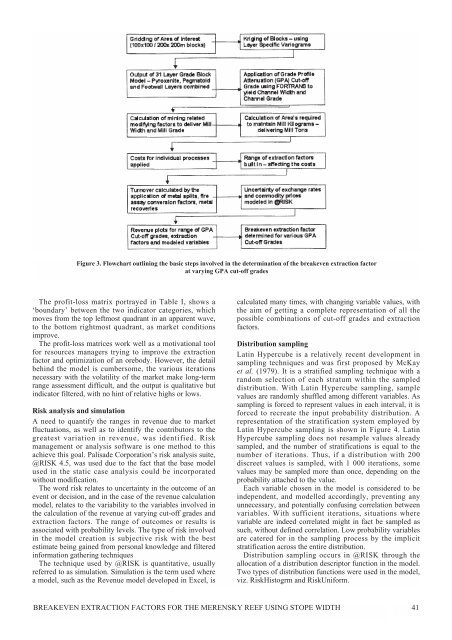
Figure 3. Flowchart outlining <strong>the</strong> basic steps involved in <strong>the</strong> determination of <strong>the</strong> breakeven <strong>extraction</strong> factor<br />
at varying GPA cut-off grades<br />
The profit-loss matrix portrayed in Table I, shows a<br />
‘boundary’ between <strong>the</strong> two indicator categories, which<br />
moves from <strong>the</strong> top leftmost quadrant in an apparent wave,<br />
to <strong>the</strong> bottom rightmost quadrant, as market conditions<br />
improve.<br />
The profit-loss matrices work well as a motivational tool<br />
<strong>for</strong> resources managers trying to improve <strong>the</strong> <strong>extraction</strong><br />
factor and optimization of an orebody. However, <strong>the</strong> detail<br />
behind <strong>the</strong> model is cumbersome, <strong>the</strong> various iterations<br />
necessary with <strong>the</strong> volatility of <strong>the</strong> market make long-term<br />
range assessment difficult, and <strong>the</strong> output is qualitative but<br />
indicator filtered, with no hint of relative highs or lows.<br />
Risk analysis and simulation<br />
A need to quantify <strong>the</strong> ranges in revenue due to market<br />
fluctuations, as well as to identify <strong>the</strong> contributors to <strong>the</strong><br />
greatest variation in revenue, was identified. Risk<br />
management or analysis software is one method to this<br />
achieve this goal. Palisade Corporation’s risk analysis suite,<br />
@RISK 4.5, was used due to <strong>the</strong> fact that <strong>the</strong> base model<br />
used in <strong>the</strong> static case analysis could be incorporated<br />
without modification.<br />
The word risk relates to uncertainty in <strong>the</strong> outcome of an<br />
event or decision, and in <strong>the</strong> case of <strong>the</strong> revenue calculation<br />
model, relates to <strong>the</strong> variability to <strong>the</strong> variables involved in<br />
<strong>the</strong> calculation of <strong>the</strong> revenue at varying cut-off grades and<br />
<strong>extraction</strong> <strong>factors</strong>. The range of outcomes or results is<br />
associated with probability levels. The type of risk involved<br />
in <strong>the</strong> model creation is subjective risk with <strong>the</strong> best<br />
estimate being gained from personal knowledge and filtered<br />
in<strong>for</strong>mation ga<strong>the</strong>ring techniques<br />
The technique used by @RISK is quantitative, usually<br />
referred to as simulation. Simulation is <strong>the</strong> term used where<br />
a model, such as <strong>the</strong> Revenue model developed in Excel, is<br />
calculated many times, with changing variable values, with<br />
<strong>the</strong> aim of getting a complete representation of all <strong>the</strong><br />
possible combinations of cut-off grades and <strong>extraction</strong><br />
<strong>factors</strong>.<br />
Distribution sampling<br />
Latin Hypercube is a relatively recent development in<br />
sampling techniques and was first proposed by McKay<br />
et al. (1979). It is a stratified sampling technique with a<br />
random selection of each stratum within <strong>the</strong> sampled<br />
distribution. With Latin Hypercube sampling, sample<br />
values are randomly shuffled among different variables. As<br />
sampling is <strong>for</strong>ced to represent values in each interval, it is<br />
<strong>for</strong>ced to recreate <strong>the</strong> input probability distribution. A<br />
representation of <strong>the</strong> stratification system employed by<br />
Latin Hypercube sampling is shown in Figure 4. Latin<br />
Hypercube sampling does not resample values already<br />
sampled, and <strong>the</strong> number of stratifications is equal to <strong>the</strong><br />
number of iterations. Thus, if a distribution with 200<br />
discreet values is sampled, with 1 000 iterations, some<br />
values may be sampled more than once, depending on <strong>the</strong><br />
probability attached to <strong>the</strong> value.<br />
Each variable chosen in <strong>the</strong> model is considered to be<br />
independent, and modelled accordingly, preventing any<br />
unnecessary, and potentially conf<strong>using</strong> correlation between<br />
variables. With sufficient iterations, situations where<br />
variable are indeed correlated might in fact be sampled as<br />
such, without defined correlation. Low probability variables<br />
are catered <strong>for</strong> in <strong>the</strong> sampling process by <strong>the</strong> implicit<br />
stratification across <strong>the</strong> entire distribution.<br />
Distribution sampling occurs in @RISK through <strong>the</strong><br />
allocation of a distribution descriptor function in <strong>the</strong> model.<br />
Two types of distribution functions were used in <strong>the</strong> model,<br />
viz. RiskHistogrm and RiskUni<strong>for</strong>m.<br />
BREAKEVEN EXTRACTION FACTORS FOR THE MERENSKY REEF USING STOPE WIDTH 41