annual financial statements - Nedbank Group Limited
annual financial statements - Nedbank Group Limited
annual financial statements - Nedbank Group Limited

You also want an ePaper? Increase the reach of your titles
YUMPU automatically turns print PDFs into web optimized ePapers that Google loves.
1<br />
finAnciAl<br />
environmentAl<br />
sociAl<br />
culturAl<br />
Volume<br />
NedNamibia<br />
HoldiNgs<br />
limited<br />
AnnuAl report 2010
contents<br />
overview<br />
<strong>Group</strong> Profile 03<br />
Highlights 05<br />
<strong>Group</strong> Structure 06<br />
Retail Branch Network 07<br />
Board of Directors 08<br />
Executive Committee 10<br />
group reports<br />
Chairman’s Report 12<br />
Managing Director’s Review 14<br />
operational reviews<br />
A Review of Retail Operations 17<br />
Corporate governance<br />
Corporate Governance 21<br />
<strong>annual</strong> <strong>financial</strong> <strong>statements</strong><br />
Value Added Statement 45<br />
Directors’ Responsibility 46<br />
Independent Auditor’s Report 47<br />
Statutory Actuary’s Report 48<br />
Report of the Directors 50<br />
<strong>Group</strong> Annual<br />
Financial Statements 52<br />
other information<br />
Contact Details 135
group profile<br />
nednAmiBiA Holdings limited is tHe<br />
Holding compAny for suBsidiAries<br />
engAged in finAnciAl services, including<br />
commerciAl BAnking, corporAte And<br />
speciAlised finAnce, micro-lending,<br />
WeAltH mAnAgement, life AssurAnce,<br />
property And Asset finAnce, foreign<br />
excHAnge And securities trAding. tHe<br />
group HAs totAl Assets of n$7,15 Billion<br />
(2009: n$6,45 Billion).<br />
the principal subsidiary, nedbank namibia limited, is a registered namibian<br />
bank with assets of n$6,98 billion (2009: n$6,3 billion). it provides a<br />
full range of domestic and global services to individual, corporate and<br />
international clients through a widespread branch network and a business<br />
centre and head office in Windhoek. An innovative approach to providing<br />
<strong>financial</strong> services, coupled with in-depth knowledge of the namibian<br />
market, a commitment to namibian development, strong support from<br />
its shareholders, and adherence to international best practice in risk<br />
management, has enabled the Bank to achieve consistent growth.<br />
nednamibia life Assurance company limited provides life cover for clients<br />
for their credit and overdraft commitments. nedplan insurance Brokers<br />
namibia (proprietary) limited provides insurance and assurance cover for<br />
individual and corporate clients.<br />
nedcapital namibia (proprietary) limited, the specialist non-banking<br />
<strong>financial</strong> services unit within nednamibia Holdings limited, offers<br />
specialised finance, syndication and advisory services to corporates, stateowned<br />
enterprises and empowerment entities.<br />
1
2<br />
NEDNAMIBIA HOLDINGS LIMItED ANNUAL REPORt 2010
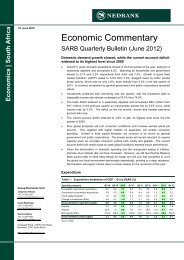
2010 HigHligHts<br />
solid performance in A cHAllenging<br />
economic environment<br />
HEADLINE EARNINGS<br />
PER SHARE<br />
200,96 cents<br />
23%<br />
NEt ASSEt VALUE PER SHARE<br />
n$<br />
47,38<br />
22%<br />
PRoFit aFteR taXatioN uP 23% to N$143,3 millioN<br />
group’s roe increased to 18,9%<br />
net asset value per share grows to 1 184,9 cents from 970,6 cents<br />
capital adequacy ratio improved to 14,2%<br />
Advances up 7,2% to n$5,20 billion<br />
net interest income increased by 13,1%<br />
further growth in non-interest revenue streams<br />
efficiency ratio reduced to 61,6% from 63,3%<br />
DILUtED HEADLINE<br />
EARNINGS PER SHARE<br />
200,96 cents<br />
23%<br />
NON-INtERESt REVENUE<br />
n$<br />
202,173m<br />
8,0%<br />
decrease in impairment of advances through disciplined credit practices<br />
3
4<br />
NEDNAMIBIA HOLDINGS LIMItED ANNUAL REPORt 2010<br />
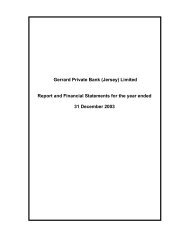
group structure<br />
AS At 31 DECEMBER 2010<br />
100%<br />
NAMIBIA<br />
NEDBANK LIMITED<br />
Full Spectrum Banking<br />
100%<br />
100%<br />
NEDBANK GROUP LIMITED<br />
100% 100% 100%<br />
100%<br />
100% 25% 80% 50% 50%<br />
CBN NOMINEES<br />
(PROPRIETARY)<br />
LIMITED<br />
Safe Custodian Services<br />
NEDPROPERTIES<br />
(PROPRIETARY)<br />
LIMITED<br />
Property Holding<br />
Company<br />
NAMCLEAR<br />
(PROPRIETARY)<br />
LIMITED<br />
Clearing Service<br />
Provider<br />
NIB MINING<br />
FINANCE<br />
(PROPRIETARY)<br />
LIMITED<br />
Special purpose<br />
vehicle for a<br />
project finance<br />
transaction<br />
NEDLOANS<br />
(PROPRIETARY)<br />
LIMITED<br />
Microlending<br />
Administration<br />
100%<br />
NEDNAMIBIA HOLDINGS LIMITED<br />
NEDPLAN<br />
INSURANCE BROKERS<br />
NAMIBIA<br />
(PROPRIETARY)<br />
LIMITED<br />
Insurance Brokers<br />
TEN KAISER<br />
WILHELM STRASSE<br />
(PROPRIETARY)<br />
LIMITED<br />
Property Holding<br />
NEDNAMIBIA LIFE<br />
ASSURANCE<br />
COMPANY<br />
LIMITED<br />
Long-term insurance<br />
TUNGA<br />
MANAGEMENT<br />
COMPANY<br />
(PROPRIETARY)<br />
LIMITED<br />
Administration and<br />
management company<br />
WALVIS BAY LAND<br />
SYNDICATE<br />
(PROPRIETARY)<br />
LIMITED<br />
Property Holding<br />
NEDCAPITAL<br />
NAMIBIA<br />
(PROPRIETARY)<br />
LIMITED<br />
Specialised Financial<br />
Services
oVeRView<br />
group<br />
reports<br />
oPeRatioNal<br />
ReViews<br />
retail BrAncH netWork<br />
governAnce<br />
AnnuAl finAnciAl<br />
stAtements<br />
5
6<br />
NEDNAMIBIA HOLDINGS LIMItED ANNUAL REPORt 2010<br />
board of directors<br />
At 31 DECEMBER 2010<br />
theo J frank (sc)<br />
Chairman<br />
Independent non-executive director<br />
BA law, llB, dip Bus man, cert tax law<br />
senior counsel and former judge of the High court of namibia. chairperson of a fishing<br />
company and director of a number of other companies. He is the chairperson of both<br />
nednamibia Holdings and nedbank namibia.<br />
stanley beyers<br />
Non-executive director<br />
cAiB (sA) (ioB); fiBsA (ioB), H.dip. Advanced Banking (rAu); dipl. fin. man. (dms),<br />
edp (WBs)<br />
stan is a seasoned banker who brings considerable banking and <strong>financial</strong> experience to<br />
the Board.<br />
erastus t Hoveka<br />
Managing director<br />
Executive director<br />
cpA (illinois, usA); mBA (Bradley university, peoria, illinois usA); B.s.(Acc) (Bradley<br />
university, peoria, illinois, usA)<br />
Has held the position of chief <strong>financial</strong> officer of the development Bank of namibia<br />
prior to his appointment as deputy managing director of nedbank namibia on<br />
1 April 2007 and subsequently as managing director of nednamibia Holdings and<br />
nedbank namibia, both with effect from 1 January 2008.<br />
sebulon i Kankondi<br />
Independent non-executive director<br />
Btech (unisa); sen man prog (usB); exec dev prog (usB); market man prog (uct);<br />
nat. dip in mech eng (peninsula technicon)<br />
sebulon was the managing director of namport for six years. since march 2009 he is<br />
holding the position of managing director of Bidvest namibia (proprietary limited).<br />
He has vast expertise in logistics and freight management.
oVeRView<br />
group<br />
reports<br />
oPeRatioNal<br />
ReViews<br />
christopher J pearce<br />
Independent non-executive director<br />
Bcom, cA(sA), Amp (Harvard)<br />
governAnce<br />
AnnuAl finAnciAl<br />
stAtements<br />
over 30 years’ experience in the banking industry and a former managing director of<br />
nedcor investment Bank limited.<br />
rolf H peters<br />
Independent non-executive director<br />
Bcom, Bcompt (Hons), cA (sA), cA (namibia)<br />
managing partner of grant thornton neuhaus, with many years’ experience in the<br />
auditing profession across all sectors of the namibian economy. He is a past president<br />
of the public Accountants and Auditors Board of namibia and of the institute of<br />
chartered Accountants of namibia.<br />
martin K shipanga<br />
Independent non-executive director<br />
Bcom (Wits); msc public policy and Administration (iss); leadership and management<br />
(university of virginia); exec dev prog (Harvard university)<br />
martin has over 10 years’ executive management experience in both the public and<br />
private sectors and is an entrepreneur in his own right.<br />
7
8<br />
NEDNAMIBIA HOLDINGS LIMItED ANNUAL REPORt 2010<br />
eXecutiVe committee<br />
erastus Hoveka<br />
Managing Director<br />
george goldridge<br />
Executive: Shared Services<br />
grant marais<br />
Executive: Head of Sales<br />
neville beckmann<br />
Executive: treasury<br />
erastus, who qualified as a certified public Accountant and attained his mBA (distinction)<br />
in the united states, served as chief <strong>financial</strong> officer at the development Bank of namibia<br />
before his appointment as deputy managing director and then managing director of<br />
nedbank namibia. He currently serves in noteworthy capacities in the Housing trust of<br />
namibia, government institutions pension fund (gipf) and the international federation<br />
of the red cross & red crescent societies, among others.<br />
george has close to 20 years’ experience in the banking industry with in-depth<br />
understanding of nedbank’s operations in Africa, having headed the technology and<br />
support services divisions of nedbank swaziland and the operations division of nedbank<br />
lesotho, before joining nedbank namibia in december 2006. His mandate is to establish<br />
and manage a shared services model for the Bank, which includes centralised operations,<br />
technology and electronic banking.<br />
grant’s career over the past 30 years has included responsibilities as deputy managing<br />
director of standard Bank namibia and executive director at stanbic Botswana. A B.com<br />
graduate, he is a certified Associate of the institute of Bankers in sA, and has experience<br />
across bancassurance, treasury management, corporate, business and retail banking,<br />
custody and trusteeship, asset and liability management and foreign exchange. grant<br />
drives nedbank’s sales activities across Business and corporate Banking, global trade,<br />
retail Banking, which includes bancassurance, micro-lending, branch network and private<br />
Banking.<br />
neville oversees nedbank namibia’s treasury activities, supporting the sales team to<br />
optimise financing solutions for clients. in a 23-year career, neville has distinguished<br />
himself in treasury management, structured and project finance, asset and liability<br />
management, custodial and trusteeship and foreign exchange. A certified Associate of<br />
the institute of Bankers in sA and a B.com (unisA) graduate, he was instrumental in<br />
nampower’s expansion drive and also in namibia’s largest corporate bond issue.
oVeRView<br />
group<br />
reports<br />
debbie smit<br />
Chief Financial Officer<br />
rector mutelo<br />
Executive: Marketing and<br />
Communications<br />
andré J Venter<br />
Chief Risk Officer<br />
oPeRatioNal<br />
ReViews<br />
governAnce<br />
AnnuAl finAnciAl<br />
stAtements<br />
debbie was appointed to the executive as chief <strong>financial</strong> officer after her predecessor,<br />
vaatjie Jurgens, resigned after many years’ service to nedbank namibia. she joined the<br />
Bank in november 2005 in the group finance department. Before joining nedbank<br />
namibia, debbie [cA (nAm), cA (sA)] was employed by the group’s auditors, deloitte<br />
and touche. she completed her degrees, B. Acc and B. Acc (Hons), at the university of<br />
stellenbosch, south Africa.<br />
rector holds a masters degree in management from emerson college, Boston, usA.<br />
in a lengthy career with the namibian Broadcasting corporation, rector was general<br />
manager for corporate marketing, communication and business development. He is<br />
spearheading an active marketing campaign in the Bank, in tandem with an expanding<br />
branch network and broadening customer base. rector was seconded to nedbank south<br />
Africa for a year on a skills exchange programme to gain exposure to the retail, business,<br />
corporate banking and treasury operations. He also gained invaluable insights into sales,<br />
credit, operations, compliance, risk and strategy formulation.<br />
André is responsible for credit risk, internal audit, operational risk and legal services and<br />
compliance. over the past 18 years, Andre has developed broad expertise in finance and<br />
risk management, particularly in business banking and micro-lending. He has a B.com<br />
managerial accounting degree and has completed various management and leadership<br />
courses in recent years.<br />
9
10 NEDNAMIBIA HOLDINGS LIMItED ANNUAL REPORt 2010<br />
cHairman’s report<br />
NEt PROFIt AFtER tAx<br />
N$143,3m<br />
23%<br />
REtURN ON SHAREHOLDERS EqUIty<br />
18,9%<br />
tHe nAmiBiAn economy enJoyed positive if<br />
unspectAculAr groWtH in 2010. tHere WAs A<br />
recovery in diAmond output from tHe loW<br />
of 2009 And gold, copper And mAngAnese<br />
production HAd A good yeAr As internAtionAl<br />
gold And copper prices reAcHed record HigHs.<br />
urAnium And zinc production remAined flAt,<br />
HoWever. tHe fisHing industry HAd A poor yeAr.<br />
a solid YeaR… but RegulatoRY PRessuRe gRows<br />
overall credit and money supply growth picked up over the year but remained weaker<br />
than expected, thus helping to prompt further cuts in interest rates by the Bank of<br />
namibia. there was an improvement in passenger vehicle sales over 2009, signalling<br />
a wider strengthening of consumer spending. there were also steady increases in<br />
a range of other indicators, including commercial vehicle sales and building plan<br />
approvals in Windhoek and Walvis Bay, though completions in these two locations<br />
were lower for most of 2010.<br />
With the economy moving off the lows of 2009, nednamibia Holdings was able to<br />
record another year of growth. the group achieved a 23% increase in net profit after<br />
tax to n$143,3 million and an 18,9% return on shareholder’s equity. there were<br />
solid contributions from the major subsidiary, nedbank namibia, and the revitalised<br />
life assurance business, nednamibia life Assurance company, which extended the<br />
scope of its operations. the specialist finance business, nedcapital namibia, had a<br />
less impressive year and will be realigned to meet market expectations.<br />
the managing director’s review on the following pages provides insight into the<br />
group’s <strong>financial</strong> and operational performance. the Board appreciates the efforts<br />
of management and staff in recording the commendable overall gains. their focus<br />
on even better client service and expense management resulted in a further<br />
improvement in the efficiency ratio.<br />
Amidst increased regulatory pressure and legislative activity, the banking industry has<br />
successfully responded to the challenge of the governor of the Bank of namibia to<br />
reduce the spread between banks’ prime rate and the namibian repo rate. An issue<br />
of continuing concern to the industry relates to the Banking institutions Act. this<br />
confers wide powers that need to be applied judiciously if the industry’s relationships<br />
with the regulator are not to be subjected to further challenges.<br />
on the legislative front, amendments to exemption no. 189 of 2004 issued under<br />
the usury Act, governing micro-lending, were proposed and it is likely the <strong>financial</strong><br />
institutions and markets Bill will be promulgated in 2011.
oVeRView<br />
group<br />
reports<br />
the Bill in essence consolidates and harmonises the laws regulating<br />
<strong>financial</strong> institutions and <strong>financial</strong> markets in namibia, such as<br />
retirement funds, long- and short-term insurers, etc, and also<br />
introduces the concept of responsible lending. A draft regulation 29<br />
in the pension funds Act relating to unlisted investments was also<br />
circulated for comment and is expected to come into force during<br />
the year. during 2010 the Bankers’ Association of namibia also<br />
submitted its commentary to the office of the prime minister on<br />
a draft national broad-based transformational economic and social<br />
empowerment framework (“tesef”).<br />
for its part, our group and its subsidiaries will continue to engage<br />
constructively with the authorities.<br />
in contributing to a greater namibia, in addition to its normal<br />
business operations, nedbank namibia took an important step to<br />
ensure greater co-ordination and focus of its efforts as a caring bank<br />
with a decision to establish the nedbank namibia foundation. the<br />
foundation, to be established by a deed of trust, will bring under<br />
one umbrella the Bank’s corporate social investment activity,<br />
sponsorships and the go green fund which supports projects to<br />
conserve and develop natural resources and protect a fragile ecology.<br />
governed by a board of trustees, the foundation will support initiatives<br />
focusing on job creation, health care, community involvement,<br />
training and education, entrepreneurship, empowerment of women,<br />
environment and conservation, arts and culture, road safety and<br />
sports development.<br />
outlooK<br />
namibia is expected to continue on the road to economic normality<br />
following last year’s solid advances and the setback of 2009 in the<br />
wake of the global <strong>financial</strong> crisis.<br />
gdp growth for 2011 has been forecast at 4%, slightly ahead of<br />
the 2010 figure and inflation (based on the consumer price index)<br />
at 6%. government spending will continue to be robust and the<br />
indications in the last quarter of 2010 of a greater commitment to<br />
corporate investment and a strengthening of consumer spending<br />
were promising.<br />
Although margins will remain under pressure and regulatory<br />
interventions are likely to increase, the momentum gained by<br />
the group’s major subsidiary, nedbank namibia, has left it well<br />
positioned to make further strides towards its goal of being namibia’s<br />
most admired bank. this positioning, together with contributions<br />
from nednamibia life Assurance company and nedplan insurance<br />
oPeRatioNal<br />
ReViews<br />
governAnce<br />
AnnuAl finAnciAl<br />
stAtements<br />
11<br />
Brokers, is expected to enable the group to record further growth<br />
in 2011.<br />
aPPReCiatioN<br />
We gratefully acknowledge the continued support of clients across<br />
the group and the contribution of many public-spirited namibians<br />
in guiding our initiatives for sustainable development. i thank my<br />
fellow directors for sharing their knowledge, wisdom and insight. the<br />
performance in another testing year was a credit to management<br />
and staff. on behalf of the Board, i thank them for their efforts and<br />
our suppliers and business partners for their support. the constructive<br />
engagement with regulatory authorities was also appreciated.<br />
theo frank<br />
Chairman<br />
With the economy moving<br />
off the lows of 2009,<br />
nednamibia Holdings was<br />
able to record another<br />
year of growth. the<br />
group achieved a 23%<br />
increase in net profit after<br />
tax to n$143,3 million<br />
and an 18,9% return on<br />
shareholders’ equity.
12 NEDNAMIBIA HOLDINGS LIMItED ANNUAL REPORt 2010<br />
managing director’s revieW<br />
NEDNAMIBIA LIFE ASSURANCE COMPANy<br />
NEt INCOME AFtER tAx<br />
N$12,2m<br />
50%<br />
NEDPLAN INSURANCE BROkERS PROFIt<br />
AFtER tAx<br />
N$0.8m<br />
62%<br />
10 000<br />
new policies added to<br />
nednamibia life Assurance<br />
portfolio<br />
tHe group’s strAtegic focus in 2010 yielded<br />
commendABle results, WitH groWtH exceeding<br />
Budgets. in A tougH BAnking environment,<br />
nedBAnk nAmiBiA mAde furtHer strides in<br />
retAil And privAte BAnking operAtions, But<br />
corporAte Business BAnking greW BeloW pAr<br />
As Businesses Were circumspect ABout spending<br />
on development And deployed surplus cAsH to<br />
retire or reduce deBt.<br />
maKiNg FuRtHeR stRides<br />
the debate about appropriate interest rates for namibia, in the wake of the call on<br />
banks by the governor of the Bank of namibia to reduce the spread between banks’<br />
prime rate and the namibian repo rate, affected income.<br />
the assurance and insurance operations delivered an excellent performance.<br />
nednamibia life Assurance company grew premium income substantially to<br />
n$28,1 million after adding nearly 10 000 new policies to the portfolio. net income<br />
advanced by 50% to n$12,2 million. nedplan insurance Brokers boosted the group’s<br />
non-interest revenue with a 62% leap in profit after tax to n$0,8 million. nedloans,<br />
the micro-loans operation, performed according to plan.<br />
the achievements of these results again underscored the commitment of a<br />
dedicated team of personnel. significantly, nedbank namibia’s growth came in the<br />
wake of a continued focus on efficiencies and on improving service to clients. the<br />
number of staff who received informal recognition throughout the year for their<br />
contributions increased markedly to 203, out of an overall complement of 492<br />
(down from 518 in 2009).<br />
in a year in which nedbank namibia (which has no formal recognition of a union),<br />
signed an interim agreement with the namibian <strong>financial</strong> institutions union, there<br />
were fewer industrial relations cases in 2010 than in 2009.<br />
in the <strong>annual</strong> surveys of staff and of the organisational culture, bank employees gave<br />
a high rating to investment in training and development. this activity ranged from a<br />
revamp of the induction programme for new employees to programmes for selected<br />
executives on leadership and skills improvement of middle and senior managers, as well<br />
as specialised training of branch managers, administrative controllers, service teams<br />
and tellers. this stemmed from an identification of skills and talent for succession<br />
planning and retention initiatives.<br />
As a result, out of 103 appointments made in 2010, 71 were from existing staff and<br />
were mostly women, one of whom was promoted to chief <strong>financial</strong> officer and
oVeRView<br />
group<br />
reports<br />
membership of the Bank’s executive committee. the Bank’s enhanced<br />
position as an employer of choice, at a time when shortage of skilled,<br />
experienced people is acute, was also reflected in the successful<br />
recruitment of chartered accountants for the risk management team.<br />
even though there was an overall reduction in risk management<br />
staff, the Bank’s risk profile was improved. the non-performing loans<br />
position was better than in 2009 and impairments as a percentage of<br />
loans and advances were reduced, as were balance sheet impairments.<br />
Arrears excesses were well within targets. given the competition in<br />
the credit arena, the Bank acted proactively to determine future<br />
needs with clients.<br />
the legal team also won praise from regulatory authorities for<br />
suggesting changes to proposed legislation – in one particularly<br />
important instance, to the <strong>financial</strong> intelligence centre before<br />
promulgation of legislation.<br />
Although key staff were lost, the internal audit team successfully<br />
completed its audit plan, with 100% acceptable audit results across<br />
operations, for the third year in a row – the only team in the wider<br />
nedbank group to achieve this.<br />
the client verification process required in terms of anti-money<br />
laundering legislation continued across group subsidiaries. the drive<br />
to verify retail clients in banking will be intensified to meet the<br />
challenge of completion by the end of 2011.<br />
looKiNg aHead<br />
the group’s goals for 2011 include:<br />
• further growth in non-interest revenue from nednamibia life<br />
Assurance company and nedplan insurance Brokers through a<br />
wider broker network;<br />
• a continuation of the niched approach at nedbank namibia and<br />
growth of the Bank’s book, at appropriate credit risk levels, by<br />
tapping into new market segments;<br />
• expansion of the private Banking platform;<br />
• a continuation of a focus on funding for selected state-owned<br />
enterprises;<br />
• increasing transactional banking volumes;<br />
• successful introduction of the banking card solution based on the<br />
issuing of new debit and credit cards;<br />
• improving the results of surveys of staff and the organisational<br />
culture;<br />
oPeRatioNal<br />
ReViews<br />
governAnce<br />
AnnuAl finAnciAl<br />
stAtements<br />
13<br />
• continuing progress towards transformation targets and the goals<br />
of the <strong>financial</strong> services charter;<br />
• further reduction in the cost efficiency ratio; and<br />
• stepping up training to further improve client service across the<br />
group.<br />
the credit structure and processes will be re-engineered to further<br />
improve efficiencies and develop the competitive edge in retail credit.<br />
the group anticipates that further changes from regulatory<br />
authorities will add to costs and that competition, particularly in<br />
banking, will be keener. A low-interest low-inflation rate environment<br />
is expected to prevail. nonetheless, the group expects to continue the<br />
momentum of past years and to record another solid performance<br />
in 2011.<br />
aPPReCiatioN<br />
As a group, we are as good as our people. the dedication of staff in<br />
winning and ensuring the support of clients was again a key driver of<br />
our performance; their efforts – and the loyalty of our clients – are<br />
sincerely appreciated. i thank the Board of directors for its guidance<br />
and support in what was a testing year.<br />
erastus Hoveka<br />
Managing Director<br />
As a group, we are as good as<br />
our people. the dedication of<br />
staff in winning and ensuring<br />
the support of clients was<br />
again a key driver of our<br />
performance; their efforts –<br />
and the loyalty of our clients<br />
– are sincerely appreciated.
14 NEDNAMIBIA HOLDINGS LIMItED ANNUAL REPORt 2010<br />
retail Banking, including private Banking, saw<br />
advances grow by 12,2% to n$2,99 billion.<br />
the biggest growth areas were home loans (up<br />
15,5%), business loans (up 15,1%), nedloans<br />
(up 9,0%) and instalment credit (up 7,6%).
oVeRView<br />
group<br />
reports<br />
oPeRatioNal<br />
ReViews<br />
governAnce<br />
a reView of retAil operAtions<br />
aNotHeR YeaR oF gRowtH<br />
in the business environment, all units in nedbank namibia recorded<br />
growth in 2010, with total loans increasing by more than 8% to<br />
n$5,18 billion.<br />
retail Banking, including private Banking, saw advances grow by<br />
12,2% to n$2,99 billion. the biggest growth areas were home<br />
loans (up 15,5%), business loans (up 15,1%), nedloans (up 9,0%)<br />
and instalment credit (up 7,6%). private Banking continued its<br />
remarkable growth and plans for a second phase of its development,<br />
in which wealth management and fiduciary services will be offered,<br />
were completed.<br />
Bancassurance had an outstanding year and provided the noninterest<br />
revenue stream with a substantial boost, with commission<br />
income comfortably exceeding target.<br />
growth in advances at corporate Business Banking was muted at<br />
4,1%. following on the recessionary conditions of 2009 and amidst<br />
continuing concerns about the state of economies, both domestically<br />
and internationally, most corporates adopted a cautious approach.<br />
they were unwilling to invest in development, preferring rather to<br />
tap into only the soundest of growth prospects and to deploy cash<br />
resources to offset debt, though there was an uptick in the business<br />
sector towards the end of 2010 as confidence levels improved.<br />
AnnuAl finAnciAl<br />
stAtements<br />
BAnking in nAmiBiA reAcHed A milestone At tHe stArt of tHe yeAr WitH tHe<br />
implementAtion of BAsel ii, tHe Accord on cApitAl plAnning, mAnAgement<br />
And reporting. nedBAnk nAmiBiA WAs A memBer of tHe proJect steering<br />
committee, WHicH reported A successful implementAtion, to tHe<br />
sAtisfAction of tHe BAnk of nAmiBiA. tHe centrAl BAnk Also upgrAded<br />
tecHnology driving nAmiBiAn inter-BAnk settlement (nis), to tHe Benefit<br />
of BAnk clients.<br />
n$ 5,18bn<br />
total loan booK<br />
in particular, treasury found that appreciation of the namibian<br />
dollar had a major influence on exporter companies, especially those<br />
in fishing. nevertheless, an increase in foreign exchange turnover,<br />
through improved client service and a greater sales focus, entrenched<br />
treasury’s position in a competitive market.<br />
there was tight management of the asset and liability portfolio.<br />
treasury reduced rates ahead of the interest rate curve, maintained<br />
its margins in the face of reductions totalling 5% in interest rates<br />
and exceeded target on interest income. A reduction by the Bank<br />
of namibia in the cheque limit – to n$500 000 – allowed better<br />
management of daily cash and also improved security. A market<br />
surplus through the year ensured the Bank was adequately funded.<br />
in collaboration with other banks, an inter-bank reference rate<br />
(“WiBAr”) was established for introduction in 2011. opportunities<br />
for new treasury products were explored, and sessions on customised<br />
trade solutions were scheduled with clients for the first quarter of<br />
2011.<br />
Ahead of the issue of new debit and credit cards in 2011, the shared<br />
services division began a roll-out to merchants on the state-ofthe-art<br />
platform. this further step in localisation of card operations<br />
and retention of income off card volumes in namibia entailed a<br />
substantial investment. the platform is fully compliant with the<br />
15
16 NEDNAMIBIA HOLDINGS LIMItED ANNUAL REPORt 2010<br />
europay, mastercard and visa (“emv”) global standard for credit and<br />
debit payment cards based on chip card technology.<br />
further investments were made in the nedbank namibia/nedloans<br />
distribution network. three Atms were added in Windhoek and<br />
swakopmund, bringing the total of machines to 36 across namibia.<br />
the number of outlets increased to 21 with the opening of nedbank<br />
namibia and nedloans premises in rundu. the outlets in lüderitz,<br />
keetmanshoop and Walvis Bay were fully refurbished. the offices<br />
of the group’s executive committee were relocated, and shared<br />
services moved to the nedbank namibia head office building after<br />
expiry of its lease in a nearby location.<br />
improvements to work flow processes were made. the centralisation<br />
of branch back office functions in one Windhoek location, which was<br />
completed in 2010, resulted in the saving of 16 positions and the<br />
deployment of these personnel into other areas needing capacity.<br />
the establishment of a client contact centre helped improve service<br />
levels. the installation of a document imaging system improved<br />
document flow and availability of documents.<br />
the branch network was modelled and benchmarked to determine<br />
sizing and staffing according to account numbers. in a further<br />
development of the technology infrastructure, the Bank’s network<br />
was fully aligned to nedbank group standards.<br />
miNiNg CHaRteR will boost emPoweRmeNt<br />
tRaNsaCtioNs<br />
A development in 2010 of long-term significance for namibia<br />
was the move to introduce a mining charter to contribute to the<br />
country’s economic transformation.<br />
given its role in mining, as reflected in its reach into the multibillion<br />
dollar pipeline of projects in namibia, the adoption of a<br />
mining charter will present the group with an opportunity to build<br />
on its well-established record in empowerment transactions. the<br />
involvement of the group economist in the initial drafting of the<br />
charter was a further illustration of the group’s commitment to build<br />
a stable and sustainably prosperous society.<br />
in addition to the existing project pipeline, additional opportunities<br />
are expected to flow from the need for infrastructure for mining,<br />
power generation and water supply. these infrastructure needs range<br />
from a second harbour to cater for bulk imports – that on top of<br />
the expansion at Walvis Bay, primarily for containers – and a second<br />
desalination plant.<br />
to address these opportunities and provide depth of expertise,<br />
capacity in the specialist finance arena is being built.<br />
given its role in mining, as reflected in its reach<br />
into the multi-billion dollar pipeline of projects<br />
in namibia, the adoption of a mining charter will<br />
present the group with an opportunity to build on its<br />
well-established record in empowerment transactions.
18 NEDNAMIBIA HOLDINGS LIMItED ANNUAL REPORt 2010
oVeRView<br />
group<br />
reports<br />
operAtionAl<br />
revieWs<br />
corporate governAnce<br />
goVeRNaNCe<br />
AnnuAl finAnciAl<br />
stAtements<br />
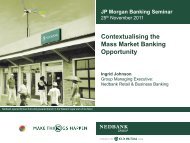
NEDBANk NAMIBIA LIMItED - CORPORAtE GOVERNANCE StRUCtURE AS At 31 DECEMBER 2010<br />
RISk AND CAPItAL<br />
MANAGEMENt COMMIttEE<br />
cHair: pearce c<br />
- Beyers s<br />
- frAnk t<br />
- peters r<br />
- BeckmAnn n<br />
- Burger W<br />
- goldridge g<br />
- kAtJitAe c<br />
- coetzee k<br />
- lisse m<br />
- mArAis g<br />
- miller m<br />
- mutelo r<br />
- retief J<br />
- smit d<br />
- venter A<br />
- BeckmAnn n<br />
- mArAis g<br />
- smit d<br />
- venter A<br />
RISk AND CAPItAL<br />
MANAGEMENt COMMIttEE<br />
cHair: pearce c<br />
- Beyers s<br />
- frAnk t<br />
- mAttHeWs l<br />
- peters r<br />
ENtERPRISE-WIDE RISk<br />
COMMIttEE(ERCO)<br />
cHair: HoVeKa e<br />
ASSEt AND LIABILIty<br />
COMMIttEE (ALCO)<br />
cHair: HoVeKa e<br />
CREDIt RISk AND<br />
MONItORING COMMIttEE<br />
(MONItORING CRAM)<br />
cHair: sorgdrager a<br />
- dAmon J<br />
- HovekA e<br />
- lisse m<br />
- mArAis g<br />
- rApscH u<br />
- stAfford-evAns A<br />
- venter A<br />
BANk CREDIt COMMIttEE<br />
cHair:<br />
stafford-eVans a<br />
- dAmon J<br />
- de Wet c<br />
- HovekA e<br />
- mArAis g<br />
- venter A<br />
- HAmunyelA n<br />
- mcleAn m<br />
- venter A<br />
- Beyers s<br />
- geBHArdt A<br />
- muAtungA l<br />
- HoeBel i<br />
- HoffmAn H<br />
- mArAis g<br />
- miller m<br />
- venter A<br />
NEDLOANS (Pty) LtD<br />
BOARD OF DIRECtORS<br />
cHair: HoVeKa e<br />
DIRECtORS’ AFFAIRS<br />
COMMIttEE<br />
cHair: franK t<br />
NEDBANk NAMIBIA LtD<br />
ExECUtIVE COMMIttEE<br />
(ExCO)<br />
cHair: HoVeKa e<br />
OPERAtIONAL<br />
DIStRIBUtION<br />
COMMIttEE<br />
cHair: goldridge g<br />
- BeckmAnn n<br />
- kAtJitAe c<br />
- goldridge g<br />
- mArAis g<br />
- mutelo r<br />
- smit d<br />
- venter A<br />
NEDNAMBIA HOLDINGS LtD<br />
BOARD OF DIRECtORS<br />
cHair: franK t<br />
- BeckmAnn n<br />
- goldridge g<br />
- HovekA e<br />
- mArAis g<br />
- mutelo r<br />
- venter A<br />
- Beyers s<br />
- HovekA e<br />
- kAnkondi s<br />
- peArce c<br />
- peters r<br />
- sHipAngA m<br />
NEDBANk NAMBIA LtD<br />
BOARD OF DIRECtORS<br />
cHair: franK t<br />
PRICING COMMIttEE<br />
cHair: smit d<br />
- Beyers s<br />
- geBHArdt A<br />
- HovekA e<br />
- kAnkondi s<br />
- mAttHeWs l<br />
- muAtungA l<br />
- peArce c<br />
- peters r<br />
- sHipAngA m<br />
- WHitfield k<br />
- coetzee k<br />
- de JAger m<br />
- HArmse A<br />
- HAttingH e<br />
- kAmBrude H<br />
- kAtJitAe c<br />
- lisse m<br />
- venter A<br />
SOCIAL INVEStMENt<br />
COMMIttEE<br />
cHair: smit d<br />
- HovekA e<br />
- mArAis g<br />
- mutelo r<br />
- venter A<br />
NEDLOANS (Pty) LtD<br />
MANAGING COMMIttEE<br />
cHair: HamunYela n<br />
REMUNERAtION, NOMINAtION,<br />
EMPLOyMENt EqUIty AND SkILLS<br />
REtENtION COMMIttEE<br />
cHair: muatunga l<br />
- BeckmAnn n<br />
- Brink g<br />
- lisse m<br />
- mArAis g<br />
- miller m<br />
- mutelo r<br />
- smit d<br />
- venter A<br />
- Beyers s<br />
- frAnk t<br />
- geBHArdt A<br />
PRODUCt COMMIttEE<br />
cHair: goldridge g<br />
INFORMAtION<br />
tECHNOLOGy<br />
cHair: goldridge g<br />
- Brink g<br />
- venter A<br />
AUDIt COMMIttEE<br />
cHair: peters r<br />
- lisse m<br />
- smit d<br />
- vAn zyl A<br />
- venter A<br />
19<br />
- Beyers s<br />
- peArce c<br />
- sHipAngA m<br />
AUDIt COMMIttEE<br />
cHair: peters r<br />
- Beyers s<br />
- mAttHeWs l<br />
- peArce c<br />
- sHipAngA m<br />
GLOBUS PRIORItISAtION<br />
COMMIttEE<br />
cHair: goldridge g
20 NEDNAMIBIA HOLDINGS LIMItED ANNUAL REPORt 2010<br />
corporate governAnce<br />
tHis governAnce And compliAnce report covers mAinly tHe governAnce And<br />
compliAnce structures/functions of nedBAnk nAmiBiA limited (“tHe BAnk”<br />
or “nedBAnk nAmiBiA”) Being tHe mAin operAtionAl entity WitHin nednAmiBiA<br />
Holdings limited (“tHe group” or “nednAmiBiA Holdings”).<br />
nednamibia Holdings, as part of nedbank group limited, has<br />
incorporated competitive governance and compliance practices as<br />
core strategic imperatives for the sustainable development of our<br />
organisation. our governance and compliance philosophy recognises<br />
the importance of ensuring continual adherence to legislative,<br />
regulatory and supervisory requirements as a critical part of effective<br />
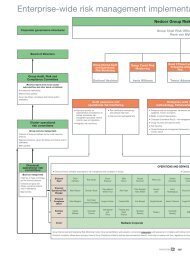
risk management and sound enterprise governance. the nednamibia<br />
Holdings group of companies embraces an enterprise governance<br />
framework that covers both the corporate governance and business<br />
governance aspects of an organisation. it encompasses governance<br />
structures that are strategically linked with performance management,<br />
enabling companies to focus on the key areas that drive their business.<br />
enterprise governance and compliance constitute part of the entire<br />
accountability framework of the organisation and require a balance<br />
between accountability and assurance (conformance) and value<br />
creation and resource utilisation (performance).<br />
conformance includes corporate governance and covers issues such as<br />
board structures and roles. performance includes business governance<br />
and focuses on strategy and value creation.<br />
the enterprise governance and compliance functions operate, among<br />
others, at the following levels within the organisation:<br />
• Boards (including boards of subsidiaries and joint ventures);<br />
• executive management (dealing with business governance and<br />
internal controls);<br />
• employees (ensuring, for example, work ethics and business<br />
governance); and<br />
• social and environmental integration (creating a sustainable bank).<br />
CoRPoRate goVeRNaNCe aNd RisK<br />
moNitoRiNg<br />
the Board of directors continues to advocate an integrated approach<br />
to corporate governance and recognises that good governance<br />
practices form an integral part of developing and sustaining any<br />
successful business.<br />
the directors’ Affairs committee monitors corporate governance<br />
quarterly to ensure that it complies with the regulatory, legal and<br />
king code corporate governance requirements.<br />
CoRPoRate goVeRNaNCe stRategY<br />
formalised governance objectives<br />
the king report on corporate governance details the importance of<br />
corporate governance in achieving <strong>financial</strong> objectives and fulfilling<br />
corporate responsibilities. the Board diligently strives to adhere to<br />
the recommendations detailed in the code of corporate practice and<br />
conduct set out by the king report on corporate governance for<br />
south Africa in 2003 (king ii) and is, with the guidance of nedbank<br />
group, reviewing the implications of adopting the requirements<br />
of king iii, going forward. A king iii gap analysis was performed on<br />
the Bank with the use of the sA institute of directors’ governance<br />
Assessment instrument (giA) in the form of an automated web-based<br />
assessment. An overall result of AA was achieved, meaning that the<br />
Bank already had a “high application” of king iii.<br />
the Board <strong>annual</strong>ly assesses and documents whether the process<br />
of corporate governance implemented by the group successfully<br />
achieves the objectives, measured as part of the regulation 39(18)<br />
report on the state of corporate governance in the group, as prepared<br />
and submitted to the south African reserve Bank, in accordance with<br />
the south African Banks Act requirement.<br />
boaRd oF diReCtoRs<br />
the nednamibia Holdings Board comprises one executive and six<br />
non-executive directors, five of whom are independent non-executive<br />
directors. the Board’s diversity and demographic mix comprises four<br />
white and three black directors.<br />
the members of the nednamibia Holdings Board at 1 January 2011,<br />
classified in terms of the king code definition around independence,<br />
were:<br />
INDEPENDENt NON-ExECUtIVE DIRECtORS (5)<br />
• frank theo J<br />
• kankondi sebulon i<br />
• pearce christopher J<br />
• peters rolf H<br />
• shipanga martin k<br />
NON-ExECUtIVE DIRECtORS (1)<br />
• Beyers stanley
oVeRView<br />
ExECUtIVE DIRECtOR (1)<br />
• Hoveka erastus t<br />
group<br />
reports<br />
the nedbank namibia Board comprises one executive and ten non-<br />
executive directors, seven of whom are independent non-executive<br />
directors. the nedbank namibia Board’s diversity and demographic<br />
mix comprises six black directors, two of whom being women, and<br />
five white directors.<br />
the directors come from diverse backgrounds and bring to the Boards<br />
a wide range of experience in commerce, industry and banking.<br />
An independent non-executive director chairs both Boards. there is a<br />
clear distinction between the roles of the chairperson of the Board and<br />
the managing director, who is in charge of day-to-day operations and<br />
executive management. Both Boards meet quarterly, but additional<br />
meetings may be held when necessary.<br />
the profiles of the members of the nednamibia Holdings Board can<br />
be found on page 8 of this <strong>annual</strong> report.<br />
boaRd CHaRteR<br />
the Board has its own charter, which is subordinate to the Articles of<br />
Association and any governing legislation. it is designed to serve as a<br />
guide to the performance by the directors of their duties within the<br />
governing legislation and the Articles of Association and in accordance<br />
with principles of good corporate governance.<br />
the primary objectives of the Board charter are hence to ensure that:<br />
• all Board members are aware of their duties and responsibilities as<br />
members of the Board;<br />
• applicable legislation and regulations affecting directors’ conduct<br />
are clearly understood; and<br />
• sound principles of corporate governance and ethical behaviour<br />
are applied in all dealings on behalf of the group.<br />
the Board is responsible to shareholders for setting the direction of<br />
the group through the establishment of objectives, strategies and<br />
key policies, which are then cascaded throughout the organisation. it<br />
monitors the implementation of its strategies and policies through a<br />
structured reporting approach, approves the <strong>annual</strong> budget, accepts<br />
accountability and recognises its responsibility for relationships with<br />
various stakeholders. it ensures that an effective enterprise-wide<br />
risk management framework is established in the group to properly<br />
manage, control and mitigate risks. the directors have a fiduciary<br />
duty to act in good faith, with due diligence and care and in the best<br />
interests of the group and its stakeholders.<br />
progress against strategic objectives is tracked through the balancedscorecard<br />
methodology.<br />
operAtionAl<br />
revieWs<br />
goVeRNaNCe<br />
boaRd aPPoiNtmeNt<br />
AnnuAl finAnciAl<br />
stAtements<br />
21<br />
Board appointments are conducted in a formal and transparent<br />
manner by the Board as a whole, assisted by the directors’ Affairs<br />
committee. details regarding changes to the composition of the<br />
nednamibia Holdings Board can be found on page 24 of this <strong>annual</strong><br />
report.<br />
in appointing directors, emphasis is placed on retaining the balance<br />
of skills, knowledge and experience necessary for achieving strategic<br />
objectives. the non-executive directors are actively involved in Board<br />
deliberations and discussions and bring independent judgement to<br />
the Board.<br />
in general, directors are given no fixed term of appointment. With<br />
the exception of the managing director, who is subject to shortterm<br />
notice periods, all directors retire on a rotational basis and,<br />
where available for re-election, are evaluated and assessed against<br />
predetermined criteria that serve as a benchmark for assessment,<br />
prior to submission of their names for election at the <strong>annual</strong> general<br />
meeting. the retirement age of a non-executive director is 70. the<br />
managing directors’ retirement is subject to the terms and conditions<br />
of his contract of employment.<br />
boaRd eFFeCtiVeNess<br />
the Board and Board committees have completed a self-evaluation<br />
and evaluated the chairperson of the Board for the period 1 July 2009<br />
to 31 June 2010. overall, respondents feel that the Board and Board<br />
committees function well and are satisfied with the composition,<br />
diversity and independence of the Board and Board committees and<br />
the effectiveness of the respective chairpersons.<br />
boaRd tRaiNiNg<br />
during 2010 the director development was continued. the newly<br />
appointed director, mr lionel matthews, attended induction training<br />
at company secretariat and was provided with an induction pack with<br />
essential Board, Bank and legislative information. He also attended a<br />
three-day Board training workshop offered by the gordon institute<br />
of Business science (“giBs”) in Johannesburg, from 6 to 8 september<br />
2010.<br />
on 4 August 2010 a one-day board training session was attended by<br />
Board members and presentations were given on the following topics:<br />
• government’s economic programme;<br />
• Board governance and king iii /third party assurance by nedbank<br />
Africa;<br />
• Basel ii and defining of risk appetite;<br />
• credit extension and evaluation of loan application; and<br />
• the Banking institutions Amendment Bill.
22 NEDNAMIBIA HOLDINGS LIMItED ANNUAL REPORt 2010<br />
ComPaNY seCRetaRY<br />
the Board appoints the company secretary who provides support and guidance to the Board in matters relating to governance and statutory<br />
practices across the group. the company secretary assists the Board as a whole and directors individually with detailed guidance on how to<br />
discharge their responsibilities in the best interest of the group. All directors have access to the advice and services of the company secretary.<br />
the company secretary plays a vital role in the assessment process of the Board and Board committees as well as board training. new directors<br />
are informed of their duties and responsibilities by way of an induction course that is run by the company secretary and each newly appointed<br />
director is provided with an induction pack containing essential documentation and background material aimed at deepening their understanding<br />
of the business of the group and in particular the business of the Bank as the main operational entity within the nednamibia Holdings group.<br />
the company secretary is responsible for corporate governance on Board, Board committee and executive committee level.<br />
atteNdaNCe oF boaRd aNd boaRd Committee meetiNgs FoR tHe FiNaNCial<br />
YeaR eNded 31 deCembeR 2010<br />
directors’ attendance of Board and Board committee meetings is monitored by the directors’ Affairs committee quarterly and by the nedbank<br />
group limited Board bi-<strong>annual</strong>ly. the chairperson of the Board deals with any irregular attendances of meetings.<br />
for the period under review, none of the directors attended less than 75% of Board or Board committee meetings. the Bank is therefore<br />
compliant with determination Bid-1 of the Banking institutions Act, which defines that a non-executive director shall attend at least 75% of the<br />
board meetings of a banking institution in any particular year.<br />
the following attendances of Board and Board committee meetings have been recorded for 2010:<br />
NedNamibia HoldiNgs limited<br />
Board of directors Board Audit committee<br />
risk and capital<br />
management committee<br />
meetings held:<br />
Attendance<br />
4 5 4<br />
frank t J 4 (chairperson) 4<br />
Beyers s H (1) 3 3 3<br />
denya d (2)<br />
!gawaxab J (3)<br />
2 3<br />
Hoveka e t (4) 4 (managing director) 5 4<br />
kankondi s i 3<br />
pearce c J 4 5 4 (chairperson)<br />
peters r H 4 5 (chairperson) 4<br />
shipanga m k 4 4<br />
Weilert H m (5) 2 2 1<br />
1 Appointed as member of the Board and Board Committees 28/05/2010<br />
2 Resigned as member of the Board and Board Committees 30/04/2010<br />
3 Resigned as member of the Board and Audit Committee 28/2/2010<br />
4 Attended Board Committee meetings by invitation<br />
5 Resigned as member of the Board and Board Committees 4/08/2010
oVeRView<br />
NedbaNK Namibia limited<br />
Board of directors Board<br />
group<br />
reports<br />
Audit<br />
committee<br />
operAtionAl<br />
revieWs<br />
risk and capital<br />
management<br />
committee<br />
goVeRNaNCe<br />
remuneration,<br />
nomination,<br />
employment equity<br />
and skills retention<br />
committee (“remco”)<br />
AnnuAl finAnciAl<br />
stAtements<br />
directors’ Affairs<br />
committee<br />
meetings held: 4 4 4 4 4<br />
Attendance<br />
frank t J 4 (chairperson) 4 4 4 (chairperson)<br />
Beyers s H (1) 3 3 3 3 3<br />
denya d (2) 1 1 1 1 1<br />
!gawaxab J (3) 1<br />
gebhardt A t m 4 3 3<br />
Hoveka e t (4) 4 4 4 4 4<br />
kankondi s i 3<br />
matthews l J (5) 1 1 1<br />
muatunga l m 3 3 (chairperson) 3<br />
pearce c J 4 3 4 (chairperson)<br />
peters r H 4 4 (chairperson) 4<br />
shipanga m k 4 3<br />
Weilert H m (6) 2 1 1 2<br />
Whitfield k 4<br />
1 Appointed as member of the Board and Board Committees 28/05/2010<br />
2 Resigned as member of the Board and Board Committees 30/04/2010<br />
3 Resigned as member of the Board and Audit Committee 28/02/2010<br />
4 Attended Board Committee meetings by invitation<br />
5 Appointed as member of the Board and Audit Committee 1/10/2010<br />
6 Resigned as member of the Board and Board Committees 4/08/2010<br />
diReCtoRs’ Fees<br />
directors’ and Board committee fees are paid quarterly to local non-executive directors only and the quarterly amounts payable are rounded up<br />
to the nearest n$500.<br />
nednamibia Holdings limited<br />
the following directors’ fees were paid for the 2010 <strong>financial</strong> year:<br />
• chairperson n$38 000 per annum<br />
• members n$19 000 per annum<br />
fees paid for 2010 <strong>financial</strong> year to individual directors<br />
Name of director N$ paid per annum<br />
frank t J (chairperson) 38 000<br />
Beyers s H nil<br />
denya d nil<br />
!gawaxab J 3 500<br />
Hoveka e t (managing director) nil<br />
kankondi s i 20 000<br />
pearce c J nil<br />
peters r H 20 000<br />
shipanga m k 20 000<br />
Weilert H m nil<br />
23
24 NEDNAMIBIA HOLDINGS LIMItED ANNUAL REPORt 2010<br />
NedbaNK Namibia limited<br />
the following directors’ and board committee fees were paid for the <strong>financial</strong> year 2010:<br />
<strong>annual</strong> directors’ and board committee remuneration<br />
Name of director<br />
cHAirperson<br />
(fees per annum)<br />
MEMBERS<br />
(fees per annum)<br />
directors’ fees n$140 000 n$70 000<br />
Audit committee<br />
n$85 000<br />
n$42 500<br />
risk and capital management committee<br />
remuneration, nomination, employment equity and<br />
skills retention committee<br />
n$85 000<br />
n$50 500<br />
directors’ Affairs committee<br />
n$17 000<br />
fees for time spent by directors on bank-related matters that fall<br />
outside the normal course of Board/Board committee business/<br />
preparation. n$1 385 per hour<br />
fees paid for 2010 <strong>financial</strong> year to individual directors<br />
Name of director N$ paid per annum<br />
frank t J (chairperson) 232 232<br />
Beyers s H nil<br />
denya d nil<br />
!gawaxab J 12 000<br />
gebhardt A t m 104 000<br />
Hoveka e t (managing director) n$2 103 171 (salary & bonus)<br />
kankondi s i 90 000<br />
matthews l J 39 000<br />
muatunga l m 134 155<br />
pearce c J nil<br />
peters r H 224 315<br />
shipanga m k 114 000<br />
Weilert H m nil<br />
Whitfield k nil<br />
no directors’ fees are paid to directors of any of the other subsidiaries within the nednamibia Holdings group.<br />
n$42 500<br />
n$25 250<br />
n$8 500
oVeRView<br />
group<br />
reports<br />
diReCtoRs’ QualiFiCatioNs<br />
board members have the following academic qualifications:<br />
operAtionAl<br />
revieWs<br />
Name Academic qualifications<br />
goVeRNaNCe<br />
frank t J BA law; llB; dip. Bus. man.; cert. tax law<br />
AnnuAl finAnciAl<br />
stAtements<br />
Beyers s cAiB (sA) (ioB); fiBsA (ioB), H.dip. Advanced Banking (rAu);<br />
dipl. fin. man. (dms), edp (WBs)<br />
Hoveka e t cpA (illinois, usA); mBA (Bradley university, peoria, illinois usA);<br />
B.s.(Acc) (Bradley university, peoria, illinois, usA)<br />
kankondi s i Btech (unisa); sen. man. prog. (usB); exec. dev. prog. (usB); market<br />
man. prog. (uct); nat. dip. in mech. eng. (peninsula technicon)<br />
pearce c J Bcom; cA (sA); Amp (Harvard)<br />
peters r H Bcom; Bcompt (Hons); cA (sA); cA (namibia)<br />
shipanga m k Bcom (Wits); msc public policy and Administration (iss); leadership<br />
and management (university of virginia); exec. dev. prog. (Harvard<br />
university)<br />
declaration of outside interests<br />
directors disclose their outside interest on a quarterly basis to the<br />
Board. the Board, through the directors’ Affairs committee, addresses<br />
directors’ conflicts of interest when these arise.<br />
A policy for conflicts of interest has been introduced in the group and<br />
all staff and directors have disclosed their outside interests. All staff<br />
members have signed a declaration, confirming that they have read<br />
and understood the contents of the policy and that they agree to be<br />
bound by the terms thereof. A structured process is in place for the<br />
consideration and approval of staff’s outside interests.<br />
A register of directors’ interests in contracts is kept at the company’s<br />
registered address.<br />
boaRd Committees<br />
the Board committee structure is designed to assist the Board in the<br />
discharge of its duties and responsibilities.<br />
the current Board committees:<br />
– nednamibia Holdings Board committees:<br />
■ Audit committee; and<br />
■ risk and capital management committee.<br />
– nedbank namibia Board committees:<br />
■ Audit committee;<br />
■ risk and capital management committee;<br />
25<br />
■ remuneration, nomination, employment equity and skills<br />
retention committee; and<br />
■ directors’ Affairs committee.<br />
the Board is responsible for the appointment of Board committee<br />
members. All members retire after two years from appointment but<br />
will be eligible for re-appointment. Any Board member who ceases<br />
to be a director for any reason whatsoever, ipso facto ceases to be a<br />
member of the Board committees on which he/she serves.<br />
All Board committees meet quarterly, but additional meetings may<br />
be held when necessary. the Bank’s Board committees report into the<br />
nedbank namibia Board while the group’s Board committees report<br />
into the nednamibia Holdings Board.<br />
the managing director is not a member of Board committees but<br />
attends all meetings by invitation. other invitees that attend Board<br />
committee meetings are the chief risk officers of nedbank namibia<br />
and nedbank Africa; the chief <strong>financial</strong> officer; chief internal Auditor;<br />
enterprise risk officer; the Head of legal, governance and compliance;<br />
the external Auditors and in the case of the nednamibia Holdings<br />
Audit committee, the managing director of nedcapital namibia.<br />
other members of the executive committee and management attend<br />
the above committees’ meetings as invitees where relevant.<br />
the Board and Board committees have their own charters, which<br />
are subordinate to the Articles of Association and any governing<br />
legislation.
26 NEDNAMIBIA HOLDINGS LIMItED ANNUAL REPORt 2010<br />
REMUNERAtION, NOMINAtION, EMPLOyMENt EqUIty<br />
AND SkILLS REtENtION COMMIttEE (“REMCO”)<br />
the committee operates in terms of a mandate approved by the<br />
Board and its primary objectives are to ensure that:<br />
An environment is created and a human resources philosophy<br />
maintained to attract, retain, motivate and reward staff to<br />
successfully implement the group’s strategy and achieve the<br />
group’s objectives; and<br />
A competitive human resources strategy is developed and<br />
implemented, to comply with the guidelines provided by the equity<br />
commissioner as well as affirmative action initiatives, to support<br />
superior business performance.<br />
the committee comprises four non-executive directors, one of<br />
whom is the chairperson. the chairperson of the Board is not the<br />
chairperson of remco.<br />
DIRECtORS’ AFFAIRS COMMIttEE<br />
the primary objectives of the committee are to consider, monitor<br />
and report to the Board on compliance with the king code and the<br />
regulations and corporate governance provisions of the Banking<br />
institutions Act, to act as nominations committee for Board<br />
appointments and to make recommendations to the Board on all<br />
matters relating to directors’ affairs, i.e. directors’ fees, Board/Board<br />
committee evaluation, board training, directors’ outside interests,<br />
etc. the committee has no decision-making powers but makes<br />
recommendations to the Board for approval. the committee comprises<br />
four non-executive directors, one of whom is the chairperson.<br />
AUDIt COMMIttEES<br />
the group Audit committee attends to the matters of all<br />
nednamibia Holdings’ subsidiaries, except for the Bank’s matters,<br />
which are being attended to by the Bank’s Audit committee. the<br />
group’s and the Bank’s Audit committees comprise four and five nonexecutive<br />
directors respectively. Both Audit committees have three<br />
independent members. the chairperson of both Audit committees<br />
is the same person and an independent non-executive director, but<br />
not the chairperson of the Board. the composition of the Audit<br />
committee is non-compliant with king iii since not all the members<br />
are independent. the directors’ Affairs committee resolved not to<br />
change the constitution of the Audit committee at this stage, given<br />
that the Bank of namibia presently requires local banks to comply<br />
with king ii. the Board is satisfied that this area of non-compliance<br />
does not impair the governance in the Bank or the group.<br />
the internal and external auditors have unrestricted access to the<br />
chairperson of the Audit committees. the group Audit committee’s<br />
primary objective is to assist the Board of directors in its evaluation<br />
and review of the adequacy and efficiency of the internal control<br />
system, accounting practices, information systems and auditing<br />
processes applied within the group in the day-to-day management<br />
of its business, and to introduce measures to enhance the credibility<br />
and objectivity of <strong>financial</strong> <strong>statements</strong> and reports prepared with<br />
reference to the affairs of the group. the Bank’s Audit committee has<br />
the same objective but it relates to the Bank and its subsidiaries. Both<br />
committees meet separately at least four times a year.<br />
external auditors<br />
the group’s external auditors are deloitte and touche.<br />
the report of the independent auditors on page 47 sets out the<br />
responsibilities of the external auditors with regard to reviewing the<br />
<strong>financial</strong> <strong>statements</strong> and the group’s compliance with both statutory<br />
and accounting standard requirements.<br />
the external audit is structured to provide sufficient evidence to give<br />
reasonable assurance that the <strong>financial</strong> <strong>statements</strong> are free from<br />
material misstatement. the audit review also considers the external<br />
auditors’ support of the directors’ <strong>statements</strong> on the group as a going<br />
concern and adequacy of the internal control environment.<br />
internal audit<br />
internal Audit is an independent assurance function, the purpose,<br />
authority and responsibility of which have formally defined in a<br />
charter approved by the Board. the objective of the internal Audit<br />
function is to provide independent, objective assurance and consulting<br />
services designed to add value and improve the operations of the<br />
group and the Bank. it helps the group accomplish its objectives by<br />
bringing a systematic, disciplined approach to evaluate and improve<br />
the effectiveness of systems of control, the management of risk<br />
and governance processes. to provide for the independence of the<br />
Bank’s internal Audit, the chief internal Auditor is accountable to the<br />
chairperson of the Audit committee, reports functionally to the chief<br />
internal Auditor of nedbank group limited, administratively to the<br />
chief risk officer of nedbank namibia and has unrestricted access to<br />
the chairperson of the Board. By virtue of its mandate any material or<br />
significant control weakness is brought to the attention of the chief<br />
risk officer, the managing director and the Audit committee for<br />
consideration and the necessary remedial action.<br />
there were solid contributions from the<br />
major subsidiary, nedbank namibia, and<br />
the revitalised life assurance business,<br />
nednamibia life Assurance company, which<br />
extended the scope of its operations.
n$ 143,3m<br />
profit before taXation<br />
27
28 NEDNAMIBIA HOLDINGS LIMItED ANNUAL REPORt 2010<br />
internal control<br />
for the Board to discharge its responsibilities to ensure the accuracy<br />
and integrity of the <strong>financial</strong> <strong>statements</strong>, management has<br />
developed and continues to maintain adequate accounting records<br />
and an effective system of internal control. the Board has ultimate<br />
responsibility for the systems of internal control and reviews their<br />
operation primarily through the Audit committees and various other<br />
risk-monitoring committees.<br />
As part of the systems of internal control, the internal Audit function<br />
conducts operational, <strong>financial</strong> and specific audits and coordinates<br />
audit coverage with the external auditors.<br />
the internal controls include risk-based systems of internal accounting<br />
and administrative controls, designed to provide reasonable, but not<br />
absolute, assurance that assets are safeguarded and that transactions<br />
are executed and recorded in accordance with generally accepted<br />
business practices and the group’s policies and procedures. these<br />
internal controls are based on established and written policies and<br />
procedures and are implemented by trained, skilled staff, with an<br />
appropriate segregation of duties, are monitored by management and<br />
include a comprehensive budgeting and reporting system, operating<br />
within strict deadlines and an appropriate control framework that has<br />
been developed in accordance with the group’s activities. internal<br />
control issues are regularly discussed with the managing director and<br />
at Board level.<br />
the Board and Board committees continuously identify operational<br />
control areas and implement suitable processes and technology to<br />
enhance this important component of the operations of the business.<br />
minutes of the Bank’s Audit committee meetings are regularly<br />
submitted to the nednamibia Holdings group’s Audit committee<br />
meeting.<br />
RisK aNd CaPital maNagemeNt Committee<br />
the risk and capital management committee is a supporting<br />
committee of the Board and is required to assist the Board of directors<br />
with the following:<br />
• evaluating the adequacy and efficiency of risk policies, procedures,<br />
practices and controls;<br />
• identifying the build-up and concentration of risk;<br />
• developing risk mitigation strategies;<br />
• ensuring formal risk assessment;<br />
• ensuring adequate provisioning for potential loss exposures;<br />
• identifying and monitoring key risks;<br />
• facilitating and promoting communication through reporting<br />
structures;<br />
• ensuring the establishment of an independent risk management<br />
function and other related functions;<br />
• overseeing policies and procedures to ensure compliance with<br />
Basel ii;<br />
• ensuring the establishment and maintenance of an internal capital<br />
Adequacy Assessment process (“icAAp”);<br />
• monitoring all aspects of credit management, including the quality<br />
of the Bank’s loan portfolio;<br />
• monitoring the adequacy of the asset and liability (“Alco”)<br />
management, capital management processes, market trading risks,<br />
derivatives and investments;<br />
• monitoring compliance with regulatory and statutory<br />
requirements; and<br />
• monitoring any other risks brought to the attention of the<br />
committee.<br />
minutes of the Bank’s risk and capital management committee<br />
meetings are regularly submitted to the nednamibia Holdings<br />
group’s risk and capital management committee meetings.<br />
RisK maNagemeNt<br />
risk management in the <strong>financial</strong> services industry is a fundamentally<br />
important process in ensuring profitability, growth and long-term<br />
sustainability. the Board acknowledges its responsibility for the entire<br />
process of risk management and for evaluating the effectiveness<br />
thereof. management is accountable to the Board for designing,<br />
implementing and monitoring the process of risk management and<br />
integrating it with day-to-day business operations. the nedbank<br />
namibia and nednamibia Holdings risk and capital management<br />
committees are assisting the Bank and Holding company Boards<br />
in reviewing the risk management process and any significant risks<br />
facing the Bank and the nednamibia Holdings group. the Board,<br />
supported by the risk and capital management committee, sets the<br />
risk strategy, decides on the company’s tolerance for risk and makes<br />
use of generally recognised risk management and internal control<br />
models and frameworks.<br />
the risk management function is embedded in the enterprise-wide<br />
risk management framework (“ermf”) that sets out the major risk<br />
classifications. the ermf forms the basis of risk governance and is<br />
underpinned by the three lines of defence that are now deeply<br />
entrenched in the organisation. risk management is embedded in<br />
business processes and committees operate effectively. the risk<br />
management function monitors compliance with the ermf. the<br />
group risk division is independent of the operational business units<br />
and headed by the chief risk officer who reports directly to the<br />
managing director and is a member of the executive committee<br />
(“exco”). strong emphasis in the ermf is placed on individual<br />
accountability and not undue reliance is placed on committees. A key<br />
issue control log has been developed as a tool to assist in achieving<br />
good governance. it represents a holistic, yet focused, view of any<br />
issues that require attention, raising concerns around these and the<br />
actions taken to address them.
oVeRView<br />
group<br />
reports<br />
in the normal course of business operations, the group, and in<br />
particular the Bank, is primarily exposed to the following risks:<br />
• accounting and taxation risk;<br />
• capital risk;<br />
• compliance risk;<br />
• credit risk;<br />
• information technology risk;<br />
• insurance and assurance risk;<br />
• market risk in the trading book;<br />
• investment risk;<br />
• liquidity risk;<br />
• market risk in the banking book;<br />
• new business risk;<br />
• operational risk;<br />
• people risk;<br />
• reputational risk;<br />
• strategic risk;<br />
• social and environmental risk; and<br />
• transformation risk.<br />
these risks are managed through the comprehensive ermf,<br />
encompassing infrastructure, policies and methods that support<br />
active and effective control.<br />
Chief Risk Officer<br />
the risk management function is headed by the chief risk officer,<br />
who is a member of the Bank’s executive committee. He has a dual<br />
reporting line to the managing director of the Bank and the chief<br />
risk officer of nedbank Africa, respectively. the chief risk officer has<br />
unrestricted access to the chairpersons of both the Audit and the risk<br />
and capital management committees.<br />
Financial risk management<br />
the most significant <strong>financial</strong> risks for the group are credit risk,<br />
liquidity risk and market risk. market risk includes interest rate and<br />
foreign exchange risk.<br />
the group’s policies are designed to identify the risks, to set<br />
appropriate risk limits and controls and to continuously monitor these<br />
risks and limits through effective information systems.<br />
High-level risk policies for managing <strong>financial</strong> risks are formulated<br />
and updated regularly at nedbank group limited level. the <strong>financial</strong><br />
risk policies of the group form part of nedbank group limited’s<br />
overall <strong>financial</strong> risk policies and fall within the parameters of these<br />
policies. those policies are then aligned with local operations and<br />
circumstances and implemented locally.<br />
operAtionAl<br />
revieWs<br />
goVeRNaNCe<br />
AnnuAl finAnciAl<br />
stAtements<br />
29<br />
credit risk<br />
credit risk refers to the risk that a counterparty will default on its<br />
contractual obligations resulting in <strong>financial</strong> loss to the group.<br />
Credit risk management<br />
Objectives in managing risk<br />
the long-term credit strategy is to maintain the necessary balance<br />
between capital preservation and capital optimisation. the group’s<br />
pursuit is for quality facilities, soundly based, with good income<br />
returns for the group.<br />
Exposure to risk and how it arises<br />
the group is exposed to credit risk through granting of credit to<br />
clients, which can take the form of one of many products offered<br />
by the group, including overdrafts, instalment sale facilities, home<br />
loans, commercial loans, micro-loans, letters of guarantee and certain<br />
foreign exchange products such as letters of credit and foreign<br />
exchange contracts.<br />
As a result, credit risk is managed within the overall risk management<br />
framework of the group, due to the importance thereof.<br />
Concentration of credit<br />
the Bank seeks to avoid significant exposures in areas (of whatever<br />
nature), which are inherently fraught with risk or very sensitive to for<br />
example changes in economy, politics, legislation, demographics, climate,<br />
etc. internal limits are set to limit the Bank’s exposure to concentration<br />
risk. As a benchmark the exposure to any one specific industry should<br />
not exceed 20% of the total lending book, and in line with Bank of<br />
namibia regulations exposure to a single client or a group of associated<br />
companies should not exceed 30% of the Bank’s qualifying capital, and<br />
the aggregate of all large exposures (i.e. an exposure which individually<br />
equals or exceeds 10% of the Bank’s qualifying capital) shall not exceed<br />
80% of the Bank’s qualifying capital.<br />
Methods used to measure risk<br />
credit risk is measured during the credit granting process by rating the<br />
potential client in terms of the group’s risk rating criteria to enable<br />
the identification of a realistic risk level at all times. the group’s policy<br />
requires that all obligators are rated at inception, and re-rated at least<br />
once <strong>annual</strong>ly thereafter. currently the existing risk rating model<br />
is based on the nedbank group rating, utilising the middle market<br />
rating model and the corporate rating model.<br />
Mandates and authority levels<br />
A mandate structure is in place with delegated levels of lending<br />
authority. All facilities, irrespective of amount, fall under the control of<br />
the Bank credit committee. maximum levels of lending authority have<br />
been set for the credit department and the Bank credit committee,<br />
subject to risk rating and with specific limits for certain industries and<br />
product types. Applications in excess of lending authorities are referred<br />
to the next higher level for approval, with excesses of the Bank credit<br />
committee being referred to the Africa credit risk management<br />
committee of nedbank group limited (“AfcrAm”) for approval.
30 NEDNAMIBIA HOLDINGS LIMItED ANNUAL REPORt 2010<br />
Monitoring<br />
the group has adequate systems of control in place for the monitoring<br />
of facilities. diary systems, which are monitored at a suitable senior<br />
level, are in place to manage the expiry of limits, revaluation of<br />
collateral, continual review of risk categories, periodic review of the<br />
terms and conditions of approval, identification of any irregularities<br />
in conduct of the account or utilisation of the facility, monitoring<br />
systems of daily usage and any other key events requiring monitoring.<br />
regular internal audits are carried out to ensure the application of<br />
sound lending principles as well as the adequate administration of<br />
security documents and key credit information.<br />
liquidity risk<br />
liquidity risk is the risk that an entity will encounter difficulty in<br />
meeting obligations associated with <strong>financial</strong> liabilities.<br />
Liquidity risk management<br />
the liquidity of the group is subject to the mix and liquidity<br />
preferences of both borrowers and depositors as well as the structure<br />
of the market in which the group operates. in most instances a Bank<br />
acts as a liquidity transformer between the liquidity needs of the<br />
borrowers and depositors.<br />
the final responsibility for the management of liquidity risk rests<br />
with the Board of directors who has delegated the day-to-day<br />
accountability to the Asset and liability committee (“Alco”). Alco<br />
is responsible for ensuring that the necessary policies, frameworks and<br />
processes and procedures to manage liquidity risk within the group<br />
are developed and implemented. it is also responsible for monitoring<br />
the group’s compliance with the policy as well as the agreed risk<br />
limits. Alco reports, as a sub-committee of the exco, to the risk<br />
and capital management committee. the Board’s responsibility with<br />
regard to adequate liquidity management includes the development<br />
and implementation of a liquidity management policy that clearly<br />
establishes the responsibilities for managing liquidity, includes a<br />
comprehensive set of liquidity limits that define acceptable levels of<br />
cash outflow, includes a liquidity contingency plan and complies with<br />
local legislation and liquidity requirements.<br />
liquidity risk is measured using liquidity risk gaps. A liquidity risk gap<br />
is generated using the contractual cash in- and outflows for each<br />
balance sheet item and placing these flows into designated time<br />
buckets. the contractual cash flows are then subjected to behavioural<br />
adjustments dependent on the liquidity risk scenario being modeled.<br />
the liquidity risk gap is calculated by deducting cash outflows from<br />
cash inflows in each bucket and then calculating the cumulative cash<br />
outflow. for liquidity risk management purposes the liquidity gaps<br />
are calculated using a sight to one-week bucket and monthly buckets<br />
from 1 to 12 months.<br />
the group’s liquidity risk management is based on the following<br />
principals:<br />
• management of cash flows, especially in the sight to three month<br />
horizon;<br />
• diversification of the depositor base; and<br />
• maintaining a stock of surplus liquefiable assets.
oVeRView<br />
group<br />
reports<br />
liquidity risk limits are approved by Alco and submitted to the<br />
Board for ratification. By monitoring the maturity profile of the<br />
current balance sheet as well as its expected future structure Alco is<br />
proactively monitoring this risk and is able to manage any potential<br />
mismatches in accordance with best banking practice.<br />
the group manages its liquidity by managing the liquidity of those<br />
components of the balance sheet over which it has direct control. the<br />
controllable components consist of:<br />
In the shorter term:<br />
• the size and composition of the liquid asset and prudential asset<br />
portfolios;<br />
• the size and maturity structure of the professional funding<br />
portfolio; and<br />
• maintaining an effective liquidity buffer consisting of high quality<br />
liquefiable money market instruments.<br />
In the medium term:<br />
• by encouraging business units to broaden the depositor base<br />
(especially retail type deposits) and to increase the group’s share<br />
of transactional banking balances (current and savings accounts).<br />
in the longer term:<br />
• the management of its operations generally to ensure that there<br />
are no unexpected large losses which could give rise to liquidity<br />
stress;<br />
• ongoing management of relationships with major sources of<br />
liquidity;<br />
• only accepting a prudent level of risk and neutralising all excess<br />
risks in all portfolios where possible;<br />
• diversification of the depositor base wherever possible; and<br />
• developing the group’s franchise to improve both its reputation<br />
and customer spread.<br />
A comprehensive liquidity risk management reporting system is in<br />
place, which includes:<br />
• daily reporting to executive and senior management of the<br />
Bank’s liquidity risk position as well as reasons for any significant<br />
changes in the liquidity risk position;<br />
• ongoing monthly reporting of the liquidity risk and funding<br />
structure of the Bank including significant shifts in the liquidity<br />
risk and explanations thereof; and<br />
• analysis of the long-term changes in the liquidity risk and funding<br />
structure of the Bank with explanations and plans to rectify any<br />
adverse change in the composition of deposits.<br />
the group furthermore reports to nedbank group limited Alco on a<br />
monthly basis the liquidity risk limit utilisation and an assessment of<br />
the liquidity risk conditions.<br />
operAtionAl<br />
revieWs<br />
goVeRNaNCe<br />
AnnuAl finAnciAl<br />
stAtements<br />
31<br />
the Bank of namibia via a determination requires the Bank to<br />
maintain a statutory liquidity based on liabilities to the public reduced<br />
by monies on lend to other namibian banks. A portion of this buffer<br />
takes the form of an interest-free deposit with the Bank of namibia.<br />
to accommodate daily liquidity flows and in order to participate<br />
at the Bank of namibia repurchase window, a surplus buffer stock<br />
position of namibian government gilts is held. this also supports the<br />
intra-day clearing requirements of the national payment system.<br />
the Bank also holds an additional liquidity buffer at all times. this<br />
buffer may take the form of any combination of the following:<br />
• surplus liquid assets in excess of those needed for normal intraday<br />
and statutory requirements;<br />
• loans to other clearing banks in namibia;<br />
• any other immediately liquefiable instrument with the approval<br />
of Alco; and<br />
• the liquidity buffer will be reviewed and confirmed at monthly<br />
Alco meetings.<br />
A liquidity risk contingency plan is in place, which includes procedures<br />
to be followed and communication required when the plan is triggered.<br />
market risk in the trading book<br />
market risk is the risk that the fair value or future cash flows of a<br />
<strong>financial</strong> instrument will fluctuate because of changes in the market<br />
prices. market risk comprises three types of risk: currency risk, interest<br />
rate risk and concentration risk. the group is exposed to both currency<br />
and interest rate risk.<br />
Interest rate risk<br />
interest rate risk is the risk that the fair value or future cash flows of<br />
a <strong>financial</strong> instrument will fluctuate because of changes in market<br />
interest rates.<br />
Interest rate risk management<br />
the group has identified the following four sources of interest rate<br />
risk to which the group is exposed:<br />
Change in the level of interest rates<br />
this is the risk associated with a general decline or increase in the<br />
level of interest rates. All interest rates will move by approximately<br />
the same amount – the so-called “parallel shift” in interest rates.<br />
Change in the slope of the yield curve<br />
under this risk there is a change in a certain class of interest rates.<br />
for example all short-term rates might change without any change<br />
to long-term rates.<br />
Basis or margin risk<br />
this is the risk that interest rates with the same or similar tenors do<br />
not move by the same amount. An example would be a change in<br />
short-term interest rates but no change in the prime rate.
32 NEDNAMIBIA HOLDINGS LIMItED ANNUAL REPORt 2010<br />
Embedded customer options in product<br />
under this risk the customer may have an early termination option<br />
on a fixed rate contract. the group may be unable to recover any<br />
penalty or the penalty is small compared to the loss suffered should<br />
the option be exercised.<br />
interest rate risk is measured using the following methodologies:<br />
Interest rate repricing gap<br />
All assets, liabilities and off-balance sheet items at the measurement<br />
date are analysed into predefined time buckets. the bucket selected<br />
is the earlier of the maturity or next repricing date for each item.<br />
A net repricing balance (gap) for each bucket is calculated as well<br />
as cumulative repricing balances (cumulative gap). limits on the<br />
quantum of mismatch in a bucket are set to manage the interest rate<br />
risk of the balance sheet, in particular a cumulative limit for the 0 to<br />
3 month bucket.<br />
Sensitivity of forecast earnings to interest rate shock<br />
earnings for the next twelve months are projected using a ‘base case’<br />
interest rate scenario. the earnings for the same period are recalculated<br />
but with all interest rates shocked by a standard 100 basis point parallel<br />
decrease in the yield curve and all other rates. the difference between<br />
the earnings figures of the ‘base case’ and each shock scenario is the<br />
earnings sensitivity to the selected interest rate shock.<br />
interest rate risk management entails identifying and quantifying the<br />
sensitivity of the group’s income to each of these sources of risk.<br />
After the interest rate risks have been quantified, strategies to manage<br />
or immunise the group from these risks are implemented.<br />
the final responsibility for the management of interest rate risk<br />
rests with the Board of directors who has delegated the day-to-day<br />
accountability to the Alco. Alco is responsible for ensuring that<br />
the necessary policies, frameworks and processes and procedures<br />
to manage interest rate risk within the Bank are developed and<br />
implemented. it is also responsible for monitoring the Bank’s<br />
compliance with the policy as well as the agreed risk limits. Alco<br />
reports, as a sub-committee of the executive committee, to the<br />
risk and capital management committee. the Board’s responsibility<br />
with regard to adequate interest rate risk management includes the<br />
development and implementation of an interest rate management<br />
policy that clearly establishes the responsibilities for managing<br />
interest rate risk and complies with local legislation and liquidity<br />
requirements.<br />
Alco reports as a sub-committee of the executive committee<br />
regarding the Bank’s interest rate risk management. the report<br />
includes current exposure to interest rate changes, high-level<br />
strategies adopted to hedge interest rate risk, major assumptions used<br />
to derive the interest rate risk and major process and/or policy issues<br />
or shortcomings and plans for their elimination. Alco is responsible<br />
for implementing this framework throughout nedbank namibia and<br />
for ensuring compliance by all operating units with the limits and<br />
other provisions of this framework.<br />
interest rate risk is assessed through the use of traditional gap analysis<br />
techniques. gap analysis measures the volumes of assets and liabilities<br />
subject to repricing within a given period. for this purpose assets<br />
and liabilities are classified according to their contractual repricing<br />
characteristics. through the use of balance sheet stress testing and<br />
net interest income scenarios the impact of interest rate movements<br />
and risk concentrations can be identified and measured. strategies are<br />
then developed for mitigating such risks.<br />
net interest margin (‘nim’) is split into the following components,<br />
each of which should be separately managed and reported:<br />
• lending spread comprising the difference between the incremental<br />
cost of funds and the interest rate earned on interest-paying<br />
balances;<br />
• funding spread comprising the difference between the interest<br />
rates paid on liability balances and the incremental cost of funds;<br />
• endowment spread comprising the net interest paid or received at<br />
the incremental cost of funds rate on the net assets or liabilities<br />
not earning or paying interest; and<br />
• mismatch spread being the difference between the incremental<br />
cost of funds on lending transactions and the incremental cost<br />
of funds on deposits raised and adjusted for strategies that have<br />
been implemented.<br />
the business units responsible for originating transactions manage<br />
the lending, funding and endowment spread. staff having the required<br />
skills and access to the necessary resources analyse, report and<br />
manage mismatch spread. All new products launched by the group<br />
are subject to an approval process in order to ensure that the interest<br />
rate risk has been correctly identified and is being properly managed.<br />
no fixed rate lending is performed unless it is fully hedged.<br />
maximum exposures to interest rate risk are monitored by setting<br />
interest rate risk limits within which the group must operate. limits<br />
are set for the net interest income impact of parallel changes in<br />
interest rates and for mismatches and are periodically reviewed.<br />
Currency risk<br />
currency risk is the risk that the fair value or future cash flows of a<br />
<strong>financial</strong> instrument will fluctuate because of changes in the foreign<br />
exchange rates.<br />
Currency risk management<br />
the group undertakes a wide variety of transactions denominated in<br />
foreign currency resulting in exposure to exchange rate fluctuations.<br />
transactions that result in currency risk include among others foreign<br />
exchange cash dealing, transactions with foreign banks, transactions<br />
on customer accounts denominated in foreign currency and forward<br />
exchange contracts. the revaluation of asset or liability balances<br />
denominated in foreign currencies at day end (referred to as the net<br />
open position) also results in exposure to changes in foreign exchange<br />
rate. the main currencies to which the group is exposed are us dollar,<br />
euro and British pound.
oVeRView<br />
group<br />
reports<br />
exposure to currency risk is measured as follows:<br />
• intraday position, being the foreign exchange risk exposure, in<br />
either single currency or as a sum of all currencies, which the<br />
group incurs between the opening and closing of business on the<br />
same day; and<br />
• net open position, being the net balance between assets and<br />
liabilities held in a foreign currency at close of business each day.<br />
the final responsibility for the management of currency risk rests with<br />
the Board of directors who has delegated the accountability to the<br />
Alco. Alco has in turn delegated the day-to-day accountability to<br />
the treasury department. Alco is responsible for ensuring that the<br />
necessary policies, frameworks, processes and procedures to manage<br />
currency risk within the Bank are developed and implemented and<br />
that the Bank complies with local legislation and regulations. it is also<br />
responsible for monitoring the group’s compliance with the policy as<br />
well as the agreed risk limits.<br />
exposure to currency risk is managed through the setting of exposure<br />
limits and monitoring of compliance to the set exposure limits. these<br />
limits include:<br />
• Aggregate net open position limits<br />
the aggregate net open spot position is managed and monitored<br />
not to exceed the limits as determined by the Bank of namibia<br />
regulations. these limits are set not to expose the group to single<br />
currency risk in major currencies (us dollar, euro and British<br />
pound) exceeding 10% of capital and reserves, single currency risk<br />
on other currencies in excess of 5% of capital and reserves and<br />
for overall foreign exchange exposure, not to exceed 20% of the<br />
Bank’s capital and reserves.<br />
• Limits on aggregate dealings with counterparties<br />
A limit has been set per counterparty and dealers monitor<br />
exposures daily to ensure that aggregate deals with a counterparty<br />
do not exceed the set limit.<br />
• Limits on single day delivery by counterparty<br />
A limit is set and monitored for the aggregate limit per<br />
counterparty, which may be utilised for a single day delivery.<br />
• Trading limits for dealers<br />
the executive: treasury assigns a limit for trading to each dealer<br />
authorised to deal in foreign exchange. dealers are only allowed<br />
to trade with approved counterparty banks and in amounts not<br />
exceeding the limits set per counterparty and per currency.<br />
• Stop loss limits<br />
dealers leave a stop loss order for any open position exceeding a set<br />
limit, thereby limiting the potential losses from foreign exchange<br />
rate fluctuations. stop loss limits are set for both the net open<br />
position at close of business each and for any intra-day open position.<br />
dealers are only allowed to trade with approved counterparty<br />
banks and in amounts not exceeding the limits set per counterparty<br />
and per currency.<br />
operAtionAl<br />
revieWs<br />
goVeRNaNCe<br />
DEFINItIONS OF OtHER SIGNIFICANt RISkS<br />
AnnuAl finAnciAl<br />
stAtements<br />
33<br />
Operational risk<br />
operational risk is the risk of direct or indirect loss resulting from<br />
inadequate or failed internal processes, people and systems or from<br />
external events. effective operational risk management enhances<br />
and protects shareholder value, specifically against unexpected or<br />
unwanted events. the management of operational risk is based on<br />
a system of internal controls. this system includes a documented<br />
organisational structure, with policies, procedures and reasonable<br />
segregation of duties that are communicated throughout the group.<br />
the corporate governance framework for operational risk management<br />
includes monitoring bodies such as the Audit committees, the internal<br />
Audit department, the risk and capital management committee as<br />
well as the enterprise-wide risk committee (“erco”). operational<br />
risk is reported to the Board of directors via the risk and capital<br />
management committee. line management is responsible for the dayto-day<br />
management of individual operational risks and holds collective<br />
responsibility for all aspects of risk management, including operational risk.<br />
the internal controls in place are designed to provide assurance that<br />
transactions, records and management information are complete,<br />
valid and accurate, and that business objectives will be achieved.<br />
internal Audit independently and continuously monitors the<br />
adequacy, appropriateness and effectiveness of these internal controls<br />
and reports its findings to management and the Audit committees.<br />
Information technology risk<br />
information technology risk is the risk resulting from system malfunction<br />
and unavailability, security breaches and inadequate systems investment,<br />
development, implementation, support and capacity.<br />
information technology risk is managed through the information<br />
technology as well as the globus prioritisation committees, assisted<br />
by group technology at nedbank group limited.<br />
Accounting and taxation risk<br />
Accounting risk is the risk that the integrity of the <strong>financial</strong><br />
<strong>statements</strong> and related information cannot be upheld and that the<br />
internal <strong>financial</strong> controls of accounting and administration do not<br />
provide reasonable assurance that assets are safeguarded and that<br />
transactions are executed and recorded in accordance with generally<br />
accepted business practices and approved policies and procedures.<br />
taxation risk is the risk that effective tax planning, co-ordination<br />
and strategy, compliance with tax laws and regulations, proactive<br />
identification and management of taxation risks are not enforced or a<br />
poor relationship with revenue authorities exists, resulting in <strong>financial</strong><br />
loss due to excessive tax liabilities, penalties or reputational damage<br />
to the group.<br />
tax compliance is monitored by the Audit committee.
34 NEDNAMIBIA HOLDINGS LIMItED ANNUAL REPORt 2010<br />
People risk<br />
people risk can be defined as possible inadequacies in human capital.<br />
this may stem from lack of adequate skills or knowledge, lack of<br />
clear consequences of not meeting performance standards, lack of<br />
alignment with strategy or a reward system that fails to motivate<br />
properly.<br />
policies for the development of human capital are in place to ensure<br />
that the required skills and experience are developed, consistently and<br />
methodically retained and enhanced to create value for the group.<br />
staff surveys are completed by staff <strong>annual</strong>ly and shortcomings<br />
identified in the surveys are addressed by way of action plans that<br />
are put in place.<br />
Reputational risk<br />
reputational risk can be defined as the risk that an activity, action or<br />
stance taken by the group or its officials will impair its image in the<br />
community and the long-term trust placed in the organisation by its<br />
stakeholders, which will result in the loss of business and/or threaten<br />
legal action.<br />
Compliance risk<br />
compliance risk is the risk of legal or regulatory sanctions, material<br />
<strong>financial</strong> loss, or loss to reputation the group may suffer as a result<br />
of its failure to comply with laws, regulations, rules, related selfregulatory<br />
organisational standards, and codes of conduct applicable<br />
to its banking and other activities.<br />
compliance risk is the current and prospective risk of damage to the<br />
organisation’s business model or objectives, reputation and <strong>financial</strong><br />
soundness arising from non-adherence to regulatory requirements<br />
and expectations of key stakeholders such as customers, employees<br />
and society as a whole. it exposes the organisation to fines, civil claims,<br />
loss of authorisation to operate and an inability to enforce contracts.<br />
Compliance risk management<br />
the group is committed to, and requires all its employees to display,<br />
the highest standards of integrity, professionalism and ethical<br />
behaviour, and to comply with all relevant laws, rules and standards<br />
when conducting the business of the group.<br />
the Bank’s compliance function is an independent function that<br />
identifies, evaluates and advises, monitors and reports on primarily<br />
the Bank’s compliance risk and secondary also the group’s compliance<br />
risk. the group’s compliance methodology is adapted from the<br />
guidelines of the compliance institute of south Africa as well as<br />
international best practices.<br />
the group’s relationships with regulators are of paramount importance,<br />
specifically the relationship with the Bank supervision department of<br />
the Bank of namibia and the south African reserve Bank. the group<br />
follows a policy of constructive engagement with regulators.<br />
the group manages compliance risk through the following key<br />
activities:<br />
• creating awareness through the training of employees and other<br />
affected stakeholders on the impact and responsibilities related to<br />
legislative requirements;<br />
• monitoring and reporting on the level of compliance with legislative<br />
requirements;<br />
• providing assurance that the risks relating to regulatory requirements<br />
are identified, understood and effectively managed; and<br />
• consulting with the business units and providing compliance<br />
opinions with regard to new business ventures and processes.<br />
Governance and compliance function<br />
the Bank’s governance and compliance function ensures the creation<br />
of a formal structures system in accordance with both regulations<br />
and local and international best practice that is continually enhanced<br />
to ensure compliance, the proper management of overall regulatory<br />
risk and best-practice corporate governance within the group.<br />
the Bank’s compliance function is an independent function that<br />
identifies, evaluates, advises on, monitors and reports on the group’s<br />
compliance risk and ensures that all new legislation and other<br />
regulatory prescripts are analysed and implemented in a uniform and<br />
effective manner throughout the organisation. the approach ensures<br />
that policies and procedures are formulated and monitored at the<br />
centre while implementation takes place within the businesses.<br />
Strategic risk<br />
strategic risk is the risk of an unattractive or adverse impact on<br />
capital and earnings due to business policy decisions (made or not<br />
made), changes in the economic environment, deficient or insufficient<br />
implementation of decisions, or a failure to adapt to changes in the<br />
environment.<br />
strategic risk is either the failure to do the right thing, doing the right<br />
thing poorly, or doing the wrong thing.<br />
Strategic risk includes:<br />
• the risk associated with the deployment of large chunks of<br />
capital into strategic investments that subsequently fail to meet<br />
stakeholders’ expectations;<br />
• the risk that the strategic processes to perform the environmental<br />
scan, align various strategies, formulation of vision, strategies,<br />
goals, objectives and the allocation of resources for achieving,<br />
implementing, monitoring and measuring the strategic objectives<br />
are not properly in place or are defective; and<br />
• failure to adequately review and understand the environment in<br />
which the group operates, leading to underperformance against<br />
its strategic and business objectives. specific environmental<br />
components include industry, political, economic, government,<br />
competitive and regulatory factors.<br />
Brand positioning is a subrisk of strategic risk.
oVeRView<br />
group<br />
reports<br />
Insurance and assurance risk<br />
Insurance and assurance risk comprises:<br />
• the failure to re-insure with other acceptable quality insurers,<br />
beyond the level of risk appetite (excessive risk) mandated by<br />
the Board of directors, risks underwritten by the short-term<br />
insurance and/or life assurance activities of the group, including<br />
catastrophe insurance (i.e. more than one insurance claim on the<br />
group arising from the same event), leading to disproportionate<br />
losses to the group (reinsurance risk);<br />
• the risk of no or inadequate insurance cover for insurable business<br />
risks (insurance risk); and<br />
• the risk of loss caused by events that result in predetermined<br />
exposures being exceeded (underwriting risk).<br />
New business risk<br />
new business risk is the risk that new product and business lines<br />
do not generate anticipated revenue or cost savings to the group.<br />
this could be as a result of providing inappropriate products and<br />
business lines to clients or potential clients, which fail to meet their<br />
requirements or otherwise fail to impress, compete with competitors’<br />
products or provide nedbank namibia with a leading edge in product<br />
development and delivery. management of this risk requires that<br />
new products and business development do not reach the client<br />
distribution channel without the appropriate signoff for compliance<br />
with the risk management requirements for all ermf risks.<br />
Capital risk<br />
capital risk is the risk that the group will become unable to absorb<br />
losses, maintain public confidence and support the competitive growth<br />
of the business. capital risk includes failure of the group’s entities to<br />
maintain the minimum regulatory capital requirements laid down by<br />
the Bank of namibia and the south African reserve Bank and namifsa.<br />
the management of capital risk is described in note 43 to the <strong>annual</strong><br />
<strong>financial</strong> <strong>statements</strong> on page 106 of this report.<br />
Solvency risk<br />
solvency risk is defined as the inability of the group to honour its<br />
debts in full. the Board and management, as well as banking regulators,<br />
monitor this risk through the assessment of the Bank’s capital<br />
adequacy. the internal requirements of the group are substantially<br />
more conservative than those imposed by the regulatory authorities.<br />
Social and environmental risk<br />
social and environmental risk is the risk of reputational impairment<br />
and ultimately loss of business and profitability as a result of nonachievement<br />
of a balanced and integrated social and environment<br />
performance, which together with economic performance are referred<br />
to as the ‘triple bottom line’.<br />
Investment risk<br />
investment risk can be defined as the risk of a decline in the net<br />
realisable value of investment assets arising from adverse movements<br />
in market prices or factors specific to the investment itself<br />
operAtionAl<br />
revieWs<br />
goVeRNaNCe<br />
AnnuAl finAnciAl<br />
stAtements<br />
35<br />
(e.g. reputation, quality of management). market prices are<br />
independent variables, which include interest rates, property values,<br />
exchange rates, and equity and commodity prices.<br />
Investment risk has the following subrisks:<br />
• equity risk in the banking book (also termed investment risk); and<br />
• property market risk (also termed property risk).<br />
maNagemeNt Committees<br />
Executive Committee (“EXCO”)<br />
the exco is the highest-ranking management committee in the Bank.<br />
the exco assists the managing director in managing the business<br />
of the Bank, subject to regulatory and statutory limits, the Board’s<br />
limitations on delegation of authority and the Board-approved policies<br />
and authority levels of the Bank. the committee furthermore assists<br />
the managing director to guide and control the overall direction of<br />
the business of the Bank and acts as a medium of communication and<br />
co-ordination between business units and the Board. responsibility<br />
for material management decision-making in the Bank is delegated<br />
by the Board to the exco, which in turn is accountable to the Board<br />
through the managing director, who is the chairperson of exco and a<br />
member of the Board. the committee comprises seven members who<br />
are appointed by the Bank’s Board of directors in conjunction with<br />
the managing director. exco meets monthly but additional meetings<br />
may be held when necessary.<br />
mr Johann Jurgens resigned as chief <strong>financial</strong> officer (“cfo”) with<br />
effect from 15 may 2010. A smooth and effective cfo succession<br />
process was achieved with mrs dorethy smit succeeding mr Jurgens<br />
as acting cfo with effect from 28 may 2010 and as cfo effective<br />
3 August 2010. the executive retail, mr mark vivier, resigned with<br />
effect from 1 october 2010. His functions were taken over by the<br />
executive Head of sales.<br />
the exco is supported by the following management committees,<br />
which are governed by charters, incorporating standard principles of<br />
good business governance:<br />
Enterprise-wide Risk Committee (“ERCO”)<br />
the erco forms part of the group’s enterprise-wide risk governance<br />
structure and focuses on creating awareness and identifying, assessing,<br />
managing and monitoring all risks in the group. the committee has<br />
a dual reporting line, one into the risk and capital management<br />
committee and the other one into the nedbank Africa divisional<br />
erco. the managing director is the chairperson of erco.<br />
<strong>Nedbank</strong> Namibia Credit Committee<br />
the Bank’s credit committee is responsible for the approval of all<br />
third party risks, excluding sovereign and counterparty risks, up to an<br />
authorised limit. Any facility in excess of such authorised limit has to<br />
be referred to the nedbank Africa credit committee. the nedbank<br />
group limited sovereign and <strong>financial</strong> institutions risk committee<br />
(“sirc”) is responsible for the approval of sovereign and <strong>financial</strong><br />
institutions’ facilities as well as counterparty and correspondent<br />
banking risk.
36 NEDNAMIBIA HOLDINGS LIMItED ANNUAL REPORt 2010<br />
Credit Risk and Monitoring Committee (“monitoring CRAM”)<br />
the monitoring crAm supports the risk and capital management<br />
committee in executing its responsibility. the committee affords the<br />
opportunity to monitor the efficiency of credit risk and operational<br />
issues impacting on credit risk on an in-depth level with reference to<br />
accounts and units contributing on the 80/20-contribution principle to<br />
credit risk. the committee also serves as a forum to improve operational<br />
credit risk processes and procedures in the Bank. the monitoring crAm<br />
is presently chaired by the chief risk officer of nedbank Africa and has<br />
a dual reporting line into the Africa credit committee and the risk and<br />
capital management committee respectively.<br />
Asset and Liability Committee (“ALCO”)<br />
the primary objective of the Alco is to ensure that the impact of the<br />
following risks, including the impact of changes in either or both the<br />
level of the market factors and/or the volatility of the market factors are<br />
being effectively managed in the group and in particular in the Bank:<br />
• liquidity risk;<br />
• market risk;<br />
• foreign exchange rate risk including currency translation risk;<br />
• investment risk; and<br />
• capital risk.<br />
Alco meets monthly, or more frequently if necessary. the committee<br />
is chaired by the managing director and reports to the exco and via<br />
the Bank’s risk and capital management committee to the Bank’s<br />
Board.<br />
Operational Distribution Committee<br />
the primary role of the distribution committee is to ratify the 3-year<br />
business plans as they pertain to the distribution plan and to approve:<br />
• amendments to the 3-year business plans pertaining to the<br />
distribution plan;<br />
• new concepts that have a direct impact on the distribution plan;<br />
and<br />
• the formation and mandate of the project team charged with<br />
delivery of distribution and infrastructure relating to specific<br />
channels.<br />
Pricing Committee<br />
the primary objective of the pricing committee is to assist the exco<br />
in discharging its responsibility to ensure that the Bank’s pricing of the<br />
various components of non-interest revenue are set in an objective,<br />
disciplined and co-ordinated manner and that they are properly<br />
implemented in terms of systems changes, communication to clients,<br />
timing and appropriately aligned to the Bank’s strategy and budget<br />
imperatives. the pricing committee is accountable to the exco.<br />
Social Investment Committee<br />
the social investment committee’s primary objective is to manage<br />
the group’s corporate social investment initiatives aimed at building<br />
sustainable development in the fields of entrepreneurship, education and<br />
health. the committee reports via the exco to the Board of directors.<br />
through its corporate social investment programme, nedbank<br />
namibia supported the following projects and initiatives in 2010:<br />
namibia Junior golf foundation, global united football club,<br />
nedbank cycle challenge, nedbank/cymot training camp, the fish<br />
river marathon, the nedbank sme development project with the<br />
polytechnic of namibia, Women’s Action for development field<br />
days, voices of namibia, 2010 <strong>annual</strong> conference of the namibian<br />
Association of medical Aid funds, the swakopmund pre-primary<br />
school wine auction, and have made other selected sponsorships. A<br />
sustainability report is submitted to the Board <strong>annual</strong>ly.<br />
through its go green fund, nedbank namibia is helping to conserve<br />
and develop the natural resources of namibia, and to support the<br />
country’s fragile ecology. for every home loan funded, and for every<br />
vehicle financed above a predetermined amount, nedbank namibia<br />
donates to the go green fund – at no cost to the client. some of<br />
the key projects supported by the go green fund in 2010 include<br />
the namib desert environment education trust, the spotted Hyena in<br />
the caprivi region, Holistic management strategy for the fisheries of<br />
the zambezi river and eastern caprivi flood plains and the namibia<br />
dolphin project.<br />
Product Committee<br />
this committee is responsible for the monitoring of the Bank’s product<br />
strategies (including the execution thereof), product development, the<br />
Bank’s competitive position in the local market as well as technology<br />
issues which have an impact on the Bank’s products.<br />
Information Technology Committee<br />
the principle role of this committee is to distil the views and priorities of<br />
the various information technology (“it”) stakeholders in order to arrive<br />
at a coherent it strategy for the group, which the committee reviews<br />
<strong>annual</strong>ly. the committee also reviews developments in the market and<br />
amongst competitors, oversees the implementation of it projects/<br />
upgrades and advises on the optimum allocation of it resources.<br />
Globus Prioritisation Committee<br />
this committee is responsible for reviewing and updating the top five<br />
globus issues list, to co-ordinate issues completed by group software<br />
services and for advising on and escalating to exco and the Board the<br />
current outstanding globus issues and progress in solving these issues.<br />
tHe basel CaPital aCCoRd (“basel ii”)<br />
the Bank’s management places significant focus on risk management<br />
and compliance with Basel ii. nedbank namibia applies the<br />
standardised approach for regulatory purposes in line with the rest<br />
of the industry. However, for credit risk management the Bank makes<br />
use of south African data to follow the Advanced internal ratings<br />
Based (AirB) approach in assessing and managing credit risk within<br />
the corporate and Business banking book. the reasonableness of the<br />
ratings are quarterly checked with the divisional credit committee<br />
(“dcc”) in nedbank south Africa and reported to the risk and<br />
capital management committee. the Bank complies with the <strong>annual</strong><br />
submission of its internal capital Adequacy Assessment process
38 NEDNAMIBIA HOLDINGS LIMItED ANNUAL REPORt 2010<br />
(“icAAp”) reporting to the Bank of namibia. the icAAp report is<br />
submitted to the Board of directors for approval before submitting<br />
it to the Bank of namibia. the Basel ii steering committee has<br />
recently been disbanded, after the successful implementation of<br />
Basel ii reporting to the local regulator, but a technical forum under<br />
the guidance of the chief risk officer continues to evaluate the<br />
assumptions and results of the Basel ii calculations.<br />
sCHedule oF delegated autHoRities (“soda”)<br />
A schedule of delegated authorities, setting out the mandates, powers<br />
and authority levels that apply to the various decision-making bodies<br />
and officers who are responsible for governance and management of<br />
the group, is in place.<br />
the Board subscribes to the ‘four eye’ principle of management, in<br />
terms of which no individual officer of the group (including the<br />
managing director) acting alone, is empowered to bind the group in<br />
relation to material matters.<br />
emPloYmeNt eQuitY<br />
the group continuously strives to achieve employment equity in the<br />
workplace and to enhance competitiveness. it is a carefully planned,<br />
managed and monitored process, incorporating strategies aimed<br />
at transforming the employment environment within the group.<br />
these mechanisms provide for the recruitment, development and<br />
promotion of competent individuals, especially those from previously<br />
disadvantaged groups, to allow them to gain access to opportunities<br />
based on their suitability, while ensuring the maintenance of core<br />
standards within the organisation. A committee has been established<br />
to deal with employment equity matters.<br />
Code oF etHiCs<br />
the nednamibia Holdings group, as part of nedbank group limited,<br />
is a value-driven organisation, which is committed to organisational<br />
integrity and high standards of ethical behaviour in its dealings with all<br />
the group’s stakeholders. its values of integrity, respect, accountability,<br />
pushing beyond boundaries and being people-centered have been<br />
incorporated into a code of ethics as the foundation of the nedbank<br />
namibia culture. training and awareness on the code is ongoing.<br />
failure to maintain ethical standards may result in disciplinary action.<br />
the Board of directors is confident that high ethical standards are<br />
maintained in the group and that business is conducted in a manner,<br />
which under all reasonable circumstances, is beyond reproach.<br />
goVeRNaNCe stRuCtuRes witHiN otHeR<br />
oPeRatiNg subsidiaRies<br />
NedLoans (Proprietary) <strong>Limited</strong> (“NedLoans”)<br />
As the Bank’s subsidiary, nedloans’ internal control, risk management<br />
and compliance environments are monitored by the Bank’s Audit and<br />
risk and capital management committees, which in turn report into<br />
the Bank’s Board of directors.<br />
NedCapital Namibia (Proprietary) <strong>Limited</strong> (“NedCapital”)<br />
nedcapital, a 100% owned subsidiary of nednamibia Holdings, has<br />
a matrix reporting structure, whereby statutory reporting is done<br />
to the nednamibia Holdings Board, while nedbank capital south<br />
Africa assumes responsibility for the technical risk and compliance<br />
functions. the nednamibia Holdings Audit committee monitors<br />
nedcapital’s internal control environment while the group risk and<br />
capital management committee monitors the company’s capital<br />
management as well as its risk management, information technology<br />
and compliance environments. Both committees report into the<br />
nednamibia Holdings Board of directors. nedcapital’s governance<br />
and control structures are constantly refined.<br />
NedNamibia Life Assurance Company <strong>Limited</strong><br />
nednamibia life Assurance company is a 100% subsidiary of<br />
nednamibia Holdings. the company’s internal control environment<br />
is monitored by the nednamibia Holdings Audit committee while<br />
the group risk and capital management committee monitors the<br />
company’s capital management as well as its risk management,<br />
information technology and compliance environments.<br />
FiNaNCial statemeNts<br />
the directors are responsible for the <strong>annual</strong> <strong>financial</strong> <strong>statements</strong>,<br />
which are prepared in accordance with and comply with international<br />
<strong>financial</strong> reporting standards (“ifrs”) adopted by the international<br />
Accounting standards Board (“iAsB”), and interpretations issued by<br />
the international <strong>financial</strong> reporting interpretations committee<br />
(“ifric”) of the iAsB and the namibian companies Act. the accounting<br />
policies used are consistently applied and supported by reasonable<br />
and prudent judgements and estimates. the directors are responsible<br />
for ensuring that the <strong>financial</strong> <strong>statements</strong> fairly present the state<br />
of affairs of the group at the <strong>financial</strong> year-end and the results of<br />
its operations for the year under review. the external auditors are<br />
responsible for independently reviewing and reporting on the fair<br />
presentation of these <strong>financial</strong> <strong>statements</strong>.
oVeRView<br />
diReCtoRs’ deClaRatioN<br />
group<br />
reports<br />
the directors of nednamibia Holdings group confirm and<br />
acknowledge that:<br />
• it is the directors’ responsibility to prepare <strong>financial</strong> <strong>statements</strong> that<br />
fairly present the state of affairs of the company at the end of the<br />
<strong>financial</strong> year and the profit or loss and cash flows for that period;<br />
• the auditors are responsible for reporting on whether the <strong>financial</strong><br />
<strong>statements</strong> are fairly presented;<br />
• adequate accounting records and an effective system of internal<br />
control and risk management have been maintained;<br />
operAtionAl<br />
revieWs<br />
goVeRNaNCe<br />
AnnuAl finAnciAl<br />
stAtements<br />
39<br />
• appropriate accounting policies, supported by reasonable and<br />
prudent judgements and estimates have been applied consistently,<br />
except as otherwise disclosed; and<br />
• applicable accounting standards have been adhered to or, if there<br />
has been any departure in the interest of fair presentation, this has<br />
been disclosed, explained and quantified.<br />
goiNg CoNCeRN deClaRatioN<br />
the directors have no reason to doubt that the group has adequate<br />
resources to continue in operational existence for the foreseeable<br />
future. the going-concern basis in preparing <strong>annual</strong> <strong>financial</strong><br />
<strong>statements</strong> is therefore considered appropriate.
40<br />
NEDNAMIBIA HOLDINGS LIMItED ANNUAL REPORt 2010<br />
NOtES tO tHE CONSOLIDAtED<br />
ANNUAL FINANCIAL STATEMENTS<br />
FOR THE YEAR ENDED 31 DEcEmbER 2010 (cONTINUED)
CoNTENTS<br />
Annual <strong>financial</strong> <strong>statements</strong><br />
Value Added Statement 45<br />
Directors’ Responsibility 46<br />
Independent Auditor’s Report 47<br />
Statutory Actuary’s Report 48<br />
Report of the Directors 50<br />
consolidated Statement of<br />
Financial Position 52<br />
consolidated Statement of<br />
comprehensive Income 53<br />
consolidated Statement of<br />
changes in Equity 54<br />
consolidated Statement of<br />
cash Flows 56<br />
41<br />
Notes to the<br />
Annual <strong>financial</strong> <strong>statements</strong> 57<br />
Notes to the company<br />
Annual <strong>financial</strong> <strong>statements</strong> 128<br />
Contact Details 135
42<br />
NEDNAMIBIA HOLDINGS LIMItED ANNUAL REPORt 2010<br />
VALUE ADDED StAtEMENt<br />
FOR THE YEAR ENDED 31 DEcEmbER 2010
2010 2009<br />
N$’000 % N$’000 %<br />
Value Added<br />
Value added is the wealth created by NedNamibia<br />
Holdings <strong>Limited</strong> through the provision of services to clients<br />
Interest income and non-interest revenue 819,035 813,401<br />
Interest paid and other expenditure 438,431 489,916<br />
380,604 323,485<br />
Value Allocated<br />
Employees<br />
Salaries, wages and other benefits 160,652 42% 147,989 46%<br />
Government<br />
Taxation 51,392 14% 47,063 14%<br />
Shareholders<br />
Dividends 0 0% 0 0%<br />
Retentions for expansion and growth 168,560 44% 128,433 40%<br />
Retained income 143,341 115,015<br />
Depreciation 25,219 13,418<br />
14%<br />
42%<br />
EmPLOYEES<br />
RETENTIONS FOR<br />
EXPANSION AND<br />
GROWTH<br />
GOVERNmENT<br />
SHAREHOLDERS<br />
380,604 100% 323,485 100%<br />
VALUE ADDED 2010 VALUE ADDED 2009<br />
44%<br />
DATA SErIES 2010 2009<br />
Employees 160,652 147,989<br />
Government 51,392 47,063<br />
Shareholders 0 0<br />
Retentions for expansion and growth 168,560 129,920<br />
14%<br />
40%<br />
46%<br />
EmPLOYEES<br />
RETENTIONS FOR<br />
EXPANSION AND<br />
GROWTH<br />
GOVERNmENT<br />
SHAREHOLDERS<br />
43
44<br />
NEDNAMIBIA HOLDINGS LIMItED ANNUAL REPORt 2010<br />
DIrECTorS’ RESPONSIBILItY<br />
FOR THE YEAR ENDED 31 DEcEmbER 2010<br />
The directors are responsible for the preparation and fair presentation of<br />
the <strong>Group</strong> <strong>annual</strong> <strong>financial</strong> <strong>statements</strong> and related information included<br />
in this <strong>annual</strong> report. The <strong>annual</strong> <strong>financial</strong> <strong>statements</strong> presented on<br />
pages 30 to 35 and 50 to 134 have been prepared in accordance with,<br />
and comply with, International Financial Reporting Standards (“IFRS”)<br />
adopted by the International Accounting Standards board (“IASb”),<br />
and interpretations issued by the International Financial Reporting<br />
Interpretations committee of the IASb and the Namibian companies<br />
Act and include amounts based on judgements and estimates made by<br />
management. The directors have also prepared the other information<br />
included in the <strong>annual</strong> report and are responsible for both its accuracy<br />
and its consistency with the <strong>annual</strong> <strong>financial</strong> <strong>statements</strong>.<br />
To enable the board to discharge its responsibilities, management has<br />
developed and continues to maintain a system of internal <strong>financial</strong><br />
control. The board has ultimate responsibility for this system of internal<br />
control and reviews the effectiveness of its operation primarily through<br />
the Audit and Risk and capital management committees and other risk<br />
monitoring functions.<br />
The internal <strong>financial</strong> controls include risk-based systems of accounting<br />
and administrative controls designed to provide reasonable, but not<br />
absolute, assurance that assets are safeguarded and that transactions<br />
are executed and recorded in accordance with generally accepted<br />
business practices and the <strong>Group</strong>’s written policies and procedures.<br />
These controls are implemented by trained, skilled staff, with clearly<br />
defined lines of accountability and an appropriate segregation of<br />
duties. The controls are monitored by management and include a<br />
comprehensive budgeting and reporting system operating within<br />
strict deadlines and an appropriate control framework. As part of the<br />
system of internal <strong>financial</strong> control the <strong>Nedbank</strong> Namibia’s Internal<br />
Audit function conducts operational, <strong>financial</strong> and specific audits and<br />
coordinates audit coverage with the external auditors.<br />
The <strong>annual</strong> <strong>financial</strong> <strong>statements</strong> have been audited by the independent<br />
Auditors, Deloitte & Touche, who were given unrestricted access to all<br />
<strong>financial</strong> records and related data, including minutes of all meetings<br />
of shareholders, the board of Directors and committees of the board.<br />
The directors believe that all representations made to the independent<br />
auditors during the audit are valid and appropriate.<br />
The going-concern basis has been adopted in preparing the <strong>financial</strong><br />
<strong>statements</strong>. The directors have no reason to believe that the <strong>Group</strong><br />
or any company within the <strong>Group</strong> will not be a going concern in<br />
the year ahead, based on forecasts and available cash resources.<br />
These <strong>annual</strong> <strong>financial</strong> <strong>statements</strong> support the viability of the company<br />
and the <strong>Group</strong>.<br />
The audit report of the independent auditors is presented on page 47.<br />
The <strong>annual</strong> <strong>financial</strong> <strong>statements</strong> were approved and authorised for issue<br />
by the board of Directors on 25 February 2011 and are signed on its<br />
behalf by:<br />
T J Frank (SC) E T Hoveka<br />
chairman managing Director
INDEPENDENT AUDItOR’S REPORt<br />
TO THE mEmbER OF NEDNAmIbIA HOLDINGS LImITED<br />
We have audited the group <strong>annual</strong> <strong>financial</strong> <strong>statements</strong> of<br />
NedNamibia Holdings <strong>Limited</strong>, which comprise the report of the<br />
directors, and consolidated and separate <strong>statements</strong> of <strong>financial</strong><br />
position as at 31 December 2010; the consolidated and separate<br />
<strong>statements</strong> of comprehensive income; the consolidated and separate<br />
<strong>statements</strong> of changes in equity and consolidated and separate<br />
<strong>statements</strong> of cash flows for the year then ended; a summary of<br />
significant accounting policies and other explanatory notes as set<br />
out on pages 30 to 35 and 50 to 134.<br />
Directors’ responsibility for the <strong>financial</strong> <strong>statements</strong><br />
The company’s directors are responsible for the preparation and<br />
fair presentation of these <strong>financial</strong> <strong>statements</strong> in accordance with<br />
International Financial Reporting Standards and in the manner<br />
required by the companies Act in Namibia and the banking<br />
Institutions Act, 1998 as amended and for such internal control<br />
as the directors determine is necessary to enable the preparation<br />
of <strong>financial</strong> <strong>statements</strong> that are free from material misstatement,<br />
whether due to fraud or error.<br />
Auditors’ responsibility<br />
Our responsibility is to express an opinion on these <strong>financial</strong><br />
<strong>statements</strong>, based on our audit. We conducted our audit in accordance<br />
with International Standards on Auditing. Those standards require<br />
that we comply with ethical requirements and plan and perform<br />
the audit to obtain reasonable assurance whether the <strong>financial</strong><br />
<strong>statements</strong> are free from material misstatement.<br />
An audit involves performing procedures to obtain audit evidence<br />
about the amounts and disclosures in the <strong>financial</strong> <strong>statements</strong>. The<br />
procedures selected depend on the auditor’s judgement, including<br />
the assessment of the risks of material misstatement of the <strong>financial</strong><br />
<strong>statements</strong>, whether due to fraud or error. In making those risk<br />
assessments, the auditor considers internal control relevant to the<br />
entity’s preparation and fair presentation of the <strong>financial</strong> <strong>statements</strong><br />
in order to design audit procedures that are appropriate in the<br />
circumstances, but not for the purpose of expressing an opinion<br />
on the effectiveness of the entity’s internal control. An audit also<br />
45<br />
includes evaluating the appropriateness of accounting principles used<br />
and reasonableness of accounting estimates made by the directors,<br />
as well as evaluating the overall <strong>financial</strong> statement presentation.<br />
We believe that the audit evidence we have obtained is sufficient and<br />
appropriate to provide a basis for our audit opinion.<br />
opinion<br />
In our opinion, these <strong>financial</strong> <strong>statements</strong> present fairly, in all<br />
material respects, the consolidated and separate <strong>financial</strong> position<br />
of NedNamibia Holdings <strong>Limited</strong> as at 31 December 2010 and<br />
its consolidated and separate <strong>financial</strong> performance and its<br />
consolidated and separate cash flows for the year then ended in<br />
accordance with International Financial Reporting Standards and<br />
in the manner required by the companies Act in Namibia and the<br />
banking Institutions Act, 1998 as amended.<br />
Deloitte & Touche<br />
Registered Accountants and Auditors<br />
chartered Accountants (Namibia)<br />
IcAN practice number: 9407<br />
PO box 47, Windhoek, Namibia<br />
Per J Mungunda – Partner<br />
Windhoek, 29 August 2011<br />
regional Executives: G Gelink (chief Executive),<br />
A Swiegers (chief Operating Officer), Gm Pinnock<br />
resident Partners: VJ mungunda (managing Partner),<br />
RH mc Donald, J Kock, H de bruin, J cronje<br />
Director: G brand
46<br />
NEDNAMIBIA HOLDINGS LIMItED ANNUAL REPORt 2010<br />
STATUTorY ACtUARY’S REPORt<br />
TO THE mEmbERS OF NEDNAmIbIA LIFE ASSURANcE cOmPANY LImITED<br />
1. Financial Soundness<br />
I have conducted an actuarial valuation of NedNamibia Life<br />
Assurance company <strong>Limited</strong> in accordance with generally<br />
accepted actuarial principles. These principles require reasonable<br />
provision for future outgo under in-force policies, generally based<br />
on the assumption that current conditions will continue. Provision<br />
is therefore not made for all possible contingencies.<br />
The liability has been based on cash flow projections, on a per<br />
policy basis, using the assumptions contained in note 3 below.<br />
Statement of Assets, Liabilities, Excess Assets and Capital<br />
requirements<br />
Statutory reporting Basis<br />
2010<br />
N$’000s<br />
2009<br />
N$’000s<br />
Total value of assets as per<br />
statement of <strong>financial</strong> position 54,711,213 32 624,060<br />
Value of liabilities 30,195,760 20 454,840<br />
current and other liabilities as per<br />
statement of <strong>financial</strong> position 72,500 173,085<br />
Total value of liabilities 30,268,260 20,627,925<br />
Excess assets 24,442,953 11,996,135<br />
The value of the assets, liabilities and excess assets on the Published<br />
Reporting basis are identical to the Statutory Reporting basis.<br />
2. Analysis of Change in Excess Assets<br />
The excess of the value of the assets over the liabilities has<br />
changed as follows over the reporting period.<br />
Analysis of Change in Excess Assets<br />
2010 2009<br />
Excess assets as at end<br />
of reporting period 24,442,953 11,996,135<br />
Excess assets as at<br />
beginning of reporting<br />
period 11,996,135 6,341,118<br />
Change in excess<br />
assets over the<br />
reporting period 12,446,818 5,655,017<br />
This change in excess assets is due to the following factors:<br />
Investment return 2,884,849 1,119,918<br />
Total investment return 2,884,849 1,119,918<br />
Operating profit 5,445,611 2,803,549<br />
changes in valuation<br />
methods and<br />
assumptions 4,504,218 1,888,339<br />
Taxation (387,860) (156,789)<br />
Total earnings 12,446,818 5,655,017<br />
capital raised – –<br />
Dividends paid – –<br />
Total change in excess<br />
assets 12,446,818 5,655,017<br />
reconciliation to reported earnings<br />
Total earnings as per<br />
above table 12,446,818 5,655,017<br />
Reported earnings in the<br />
<strong>financial</strong> <strong>statements</strong> 12,446,818 5,655,017<br />
Difference – –<br />
The excess assets on the Statutory (and Published) Reporting<br />
basis increased to N$12,446,818. This is an improvement from the<br />
previous year’s earnings of N$5,655,017. The increase in earnings<br />
is attributable to good expense and mortality experience, reducing<br />
expense and mortality assumptions and another strong year of<br />
new business flows.<br />
3. Changes in Valuation Methods or Assumptions<br />
The value of liabilities decreased by N$1,022,991 as a result of the<br />
renewal expense assumptions reducing from N$191,70 per annum<br />
to N$170 per annum. This assumption is reduced to reflect the<br />
expense basis that Nedgroup Life will use when administering this<br />
tranche of business after transfer in 2011.<br />
The value of the liabilities decreased by N$3,481,227 as a result of<br />
the mortality, morbidity and retrenchment assumptions reducing<br />
25%. claims have been small over the last two years and there is<br />
strong motivation to drop the assumptions despite a small cohort<br />
of data. The 25% reduction was asserted with the view that there<br />
may be scope to further decrease this over time as the statistical<br />
credibility grows.
4. Valuation basis of assets<br />
Assets are valued at <strong>financial</strong> position values i.e. at market or<br />
directors’ value as described in the <strong>annual</strong> <strong>financial</strong> <strong>statements</strong>.<br />
VALUATIoN oF PoLICY LIABILITIES<br />
The valuation of the policy liabilities was conducted based on the<br />
assumptions below.<br />
The assumptions are based on best estimates of the expected<br />
experience. The main assumptions, before allowing for prescribed<br />
margins, were as follows:<br />
Investment 6.91% per annum (net of tax)<br />
Return<br />
mortality 75% x SA85/90 Heavy (ULT) + 37.5% of AIDS<br />
extra mortality (High Risk <strong>Group</strong> males with 2<br />
year progression)<br />
Permanent cSI Skilled Lives x 0.9375<br />
Disability<br />
Dread Disease cSI 1997 Dread Disease x 0.9375<br />
Temporary<br />
Disability<br />
cmIR12 Inception Rates (4 week deferred<br />
period) x 0.375, 6 months payment on<br />
average<br />
Retrenchment 3.75% Inception Rate, 6 months payment on<br />
average<br />
Withdrawals Year 1 = 15%<br />
Year 2 = 10%<br />
Year 3+ = 5%<br />
NAmFISA 0.15% of Outstanding Liability<br />
Levy<br />
Renewal N$170 per annum<br />
Expenses<br />
Expense 5.5% per annum<br />
Inflation<br />
Taxation 40% Investment income is taxed at 34%. All<br />
investment income assumed to be taxable<br />
• No negative reserves were held.<br />
• An incurred but not reported reserve of 6/12ths of the <strong>annual</strong><br />
expected claims was established.<br />
5. Capital adequacy requirement<br />
The capital adequacy requirement (“cAR”) is calculated, in<br />
accordance with PGN 104, to determine whether the excess of<br />
assets over liabilities is sufficient to provide for the possibility<br />
of actual future experience departing negatively from the<br />
assumptions made in calculating policy liabilities and against<br />
fluctuations in the value of assets.<br />
In line with changes to PGN 104 guidelines, cAR now includes<br />
operational risk and credit risk components.<br />
47<br />
For the purpose of grossing up the intermediate ordinary capital<br />
adequacy requirements (“IOcAR”) to determine the ordinary<br />
capital adequacy requirements (“OcAR”), it has been assumed<br />
that assets backing the capital adequacy requirements are<br />
invested 100% in cash or cash equivalents. This is in line with a<br />
decision taken by the board.<br />
The OcAR exceeded the termination capital adequacy requirement<br />
(“TcAR”) at the valuation date, and thus the capital adequacy<br />
requirements have been based on the OcAR. This amounts to<br />
N$1,693,360.<br />
However regulation requires that a life company with multiple<br />
products, hold at least N$4m in capital. It is therefore required<br />
that NedNamibia Life Assurance hold N$4m in capital.<br />
The surplus is 6.1 times the capital adequacy requirement.<br />
Certification of Statutory Financial Position<br />
I hereby certify that:<br />
• the valuation on the Statutory basis of NedNamibia Life<br />
Assurance company as at 31 December 2010, the results of<br />
which are summarised above, has been conducted in and this<br />
Statutory Actuary’s report has been produced in accordance<br />
with applicable Actuarial Society of South Africa Professional<br />
Guidance Notes;<br />
• I have accepted that the <strong>annual</strong> <strong>financial</strong> <strong>statements</strong> comply<br />
with the requirements of the Namibian companies Act and<br />
Long-term Insurance Act in Namibia;<br />
• my Statutory Actuary’s Report, read together with the <strong>annual</strong><br />
<strong>financial</strong> <strong>statements</strong>, fairly presents the <strong>financial</strong> position of the<br />
company; and<br />
• the company was <strong>financial</strong>ly sound on the Statutory basis as<br />
at the valuation date, and in my opinion, is likely to remain<br />
<strong>financial</strong>ly sound for the foreseeable future.<br />
Sc Dippnall<br />
Statutory Actuary of NedNamibia Life Assurance co Ltd<br />
February 2011
48<br />
NEDNAMIBIA HOLDINGS LIMItED ANNUAL REPORt 2010<br />
rEPorT OF tHE DIRECtORS<br />
FOR THE YEAR ENDED 31 DEcEmbER 2010<br />
The directors have pleasure in submitting their report together with<br />
the <strong>annual</strong> <strong>financial</strong> <strong>statements</strong> of NedNamibia Holdings <strong>Limited</strong><br />
(“the company”) and its subsidiaries (“the <strong>Group</strong>”) for the year<br />
ended 31 December 2010.<br />
NATUrE oF THE BUSINESS<br />
NedNamibia Holdings is a registered holding company that,<br />
through its subsidiaries, provides a wide range of <strong>financial</strong> services,<br />
including: corporate and retail banking; property and asset finance;<br />
private banking; micro-lending; insurance and foreign exchange and<br />
securities trading. The <strong>Group</strong>’s head office is in Windhoek and its<br />
operations are confined to Namibia.<br />
HoLDING CoMPANY<br />
The holding company of NedNamibia Holdings is <strong>Nedbank</strong> <strong>Group</strong><br />
<strong>Limited</strong>, a South African incorporated company that holds 100% of<br />
the issued ordinary shares, and its ultimate controlling shareholder is<br />
Old mutual plc, incorporated in England and Wales.<br />
The <strong>Group</strong> structure of NedNamibia Holdings is set out on page 6<br />
of this report.<br />
FINANCIAL rESULTS For THE YEAr<br />
Full details of the <strong>financial</strong> results are set out on pages 50 to 134 of<br />
these <strong>annual</strong> <strong>financial</strong> <strong>statements</strong>.<br />
SHArE CAPITAL<br />
NedNamibia Holdings has an authorised share capital of<br />
80 000 000 ordinary shares of 25 cents each. The company’s issued<br />
share capital comprises 70 381 644 ordinary shares.<br />
At the <strong>annual</strong> general meeting, held 25 June 2010, the shareholder<br />
placed the unissued share capital of 9 618 356 ordinary shares under<br />
the control of the directors until the next <strong>annual</strong> general meeting.<br />
DIVIDENDS<br />
Details of the dividend appear in note 35 to these <strong>annual</strong> <strong>financial</strong><br />
<strong>statements</strong>.<br />
ACCoUNTING TrEATMENT oF LoANS AND ADVANCES<br />
The accounting treatment of loans and advances disclosed in the<br />
<strong>annual</strong> <strong>financial</strong> <strong>statements</strong> complies with IFRS. The impairment<br />
determined in compliance with the requirements of bID-2<br />
(determinations on the classification of loans and the suspension<br />
of interest on non-performing loans and the provisions for bad and<br />
doubtful debts) issued pursuant to Section 71(3) of the banking<br />
Institutions Act, 1998 as amended, is recorded in the returns to the<br />
bank of Namibia. The excess impairment, determined in compliance<br />
with bID-2 over the impairment determined based on IFRS, is<br />
recorded as a general risk reserve in the <strong>annual</strong> <strong>financial</strong> <strong>statements</strong>.<br />
BoArD oF DIrECTorS AND SECrETArY<br />
The following directors, who retired by rotation in terms of the Articles<br />
of Association, were reappointed as directors on 25 June 2010:<br />
messrs: martin K Shipanga<br />
christopher J Pearce<br />
Heinz m Weilert<br />
During the period under review, and subsequent to year-end, the<br />
following changes occurred to the NedNamibia Holdings board:<br />
messrs Johannes !Gawaxab, Denys Denya and Heinz Weilert resigned<br />
as directors of the company with effect from 28 February 2010,<br />
30 April 2010 and 4 August 2010 respectively. mr Stanley beyers<br />
joined the board on 28 may 2010. The board conveys its appreciation<br />
to the resigning directors for their dedicated services.<br />
The newly appointed director, mr Stanley beyers, retired in terms<br />
of the Articles of Association and was reappointed by the sole<br />
shareholder, <strong>Nedbank</strong> <strong>Group</strong> <strong>Limited</strong>, on 25 June 2010.<br />
The company’s board of Directors currently comprises the following<br />
members:<br />
Frank Theo J (Sc) (chairman) Independent<br />
non-executive<br />
director<br />
beyers Stanley H* Non-executive<br />
director<br />
Hoveka Erastus<br />
(managing director)<br />
Executive<br />
director<br />
Kankondi Sebulon I Independent<br />
non-executive<br />
director<br />
Pearce christopher J* Independent<br />
non-executive<br />
director<br />
Peters Rolf H ** Independent<br />
non-executive<br />
director<br />
Shipanga martin K Independent<br />
non-executive<br />
director<br />
* South African<br />
** German<br />
Appointment<br />
date<br />
11 February<br />
2005<br />
28 may<br />
2010<br />
1 January<br />
2008<br />
11 February<br />
2005<br />
23 march<br />
2000<br />
11 February<br />
2005<br />
1 January<br />
2004
The composition of board committees appear in the corporate<br />
governance structure on page 11 of this report.<br />
SECrETArY AND rEGISTErED oFFICE<br />
The secretary of the company is mrs mechthild meiring, whose<br />
business address as well as that of the registered office is<br />
12-20 Dr Frans Indongo Street, Windhoek. The postal address of<br />
the registered office is PO box 1, Windhoek, and the company’s<br />
registration number is 91/075.<br />
TrANSFEr SECrETArIES<br />
Transfer Secretaries (Proprietary) <strong>Limited</strong> will remain the company’s<br />
transfer secretaries until such time that most of the minority<br />
shareholders have surrendered their original documents of title, as<br />
defined in the Scheme of Arrangement that was concluded between<br />
<strong>Nedbank</strong> <strong>Group</strong> <strong>Limited</strong> and the minority shareholders in 2007. Their<br />
business address is Shop 8, Kaiserkrone centre, Post Street mall,<br />
Windhoek, Namibia, P O box 2401, Windhoek, Namibia.<br />
DIrECTorS’ INTErEST IN THE CAPITAL oF THE CoMPANY<br />
None of the directors have an interest in the share capital of the<br />
company.<br />
INTErEST oF DIrECTorS IN CoNTrACTS<br />
<strong>Nedbank</strong> Namibia continues leasing the premises in which the<br />
Oshikango and Outapi branches are located from Tusk Investments<br />
(Proprietary) <strong>Limited</strong>. The sole shareholder of Tusk Investments<br />
(Proprietary) <strong>Limited</strong> is the m&N Shipanga Family Trust, of which<br />
mr martin Shipanga, a director of <strong>Nedbank</strong> Namibia and NedNamibia<br />
Holdings, is a trustee/beneficiary. mr Shipanga has declared his<br />
interest in Tusk Investments (Proprietary) <strong>Limited</strong> to the board of<br />
Directors.<br />
SUBSIDIArIES<br />
As at 31 December 2010, NedNamibia Holdings had the following directly held subsidiaries:<br />
more details on direct and indirect subsidiaries of the <strong>Group</strong> are set<br />
out in note 11 to these <strong>annual</strong> <strong>financial</strong> <strong>statements</strong>.<br />
SPECIAL rESoLUTIoNS<br />
Special resolutions passed by the Company<br />
No special resolutions were passed by the company during the year<br />
under review.<br />
Special resolutions passed by subsidiaries<br />
At its <strong>annual</strong> general meeting on 25 June 2010, <strong>Nedbank</strong> Namibia<br />
<strong>Limited</strong> passed a special resolution entirely replacing its Articles of<br />
Association.<br />
49<br />
No special resolutions were passed by any of the other subsidiaries.<br />
PoST-BALANCE SHEET EVENTS<br />
The directors are not aware of any material post-balance sheet<br />
events that have occurred.<br />
APPrECIATIoN<br />
The board of Directors extends its sincere appreciation to all the<br />
employees and esteemed clients of the <strong>Group</strong> and the company for<br />
their loyalty and continued support.<br />
Its appreciation is also extended to the ministry of Finance; the bank<br />
of Namibia; the local authorities; the Namibia Financial Institutions<br />
Supervisory Authority (“Namfisa”) and our attorneys and auditors<br />
for their assistance and co-operation.<br />
NAME oF SUBSIDIArY TYPE oF BUSINESS ISSUED SHArE CAPITAL ProPorTIoN HELD<br />
<strong>Nedbank</strong> Namibia <strong>Limited</strong> commercial banking 67 758 596 ordinary shares 100%<br />
Nedcapital Namibia<br />
(Proprietary) <strong>Limited</strong><br />
Specialised finance service 8 000 ordinary shares 100%<br />
NedNamibia Life Assurance<br />
company <strong>Limited</strong><br />
Long-term insurance 4 000 000 ordinary shares 100%<br />
NedPlan Insurance brokers<br />
Namibia (Proprietary) <strong>Limited</strong><br />
Insurance broker 100 ordinary shares 100%<br />
NedProperties (Proprietary)<br />
<strong>Limited</strong><br />
Property holding company 100 ordinary shares 100%
50<br />
NEDNAMIBIA HOLDINGS LIMItED ANNUAL REPORt 2010<br />
CONSOLIDAtED StAtEMENt OF<br />
FINANCIAL PoSITIoN<br />
AS At 31 DECEMBER 2010<br />
ASSETS<br />
2010 2009<br />
Notes N$’000 N$’000<br />
cash and balances with central bank 4 135,678 129,841<br />
Due from other banks 5 605,101 440,238<br />
Other short-term securities 6 342,068 157,223<br />
Derivative <strong>financial</strong> instruments 7 9,200 3,782<br />
Government and public sector securities 8 506,549 499,303<br />
Loans and advances to customers 9 5,169,727 4,846,359<br />
Other assets 10 156,834 139,721<br />
Investment in subsidiaries, associates, joint venture and listed investments 11 31,137 29,595<br />
Property and equipment 12 136,390 127,468<br />
computer software and development cost 13 39,187 51,047<br />
Goodwill 14 27,623 27,623<br />
Total assets 7,159,494 6,452,200<br />
EQUITY AND LIABILITIES<br />
Capital and reserves<br />
Share capital 15 17,595 17,595<br />
Share premium 15 99,536 99,536<br />
General risk reserve 16 43,248 38,370<br />
Revaluation reserve 17 33,217 27,452<br />
Share-based payment reserve 18 18,883 19,835<br />
Available-for-sale reserve 19 7,444 6,198<br />
Retained income 607,578 468,394<br />
Shareholder’s interest 827,501 677,380<br />
Non-controlling interest 6,269 5,776<br />
Total shareholder’s equity and non-controlling interest 833,770 683,156<br />
LIABILITIES<br />
Derivative <strong>financial</strong> instruments 7 8,864 3,786<br />
Due to other banks 20 23,257 104<br />
Due to customers 21 4,550,688 4,188,985<br />
Negotiable certificates of deposits 22 1,447,000 1,354,320<br />
Other liabilities 23 138,693 88,376<br />
Deferred taxation liabilities 24 117,122 103,774<br />
Policyholder liabilities under insurance contracts 25 30,196 20,427<br />
Provision for post-retirement medical benefits 26 7,540 7,223<br />
Long-term subordinated debt instruments 27 2,364 2,049<br />
Total liabilities 6,325,724 5,769,044<br />
Total equity and liabilities 7,159,494 6,452,200
CONSOLIDAtED StAtEMENt OF<br />
CoMPrEHENSIVE INCoME<br />
FOR tHE YEAR ENDED 31 DECEMBER 2010<br />
2010 2009<br />
Notes N$’000 N$’000<br />
Interest and similar income 616,101 626,572<br />
Interest expense and similar charges 261,612 313,150<br />
Net interest income 28 354,489 313,422<br />
Impairment of loans and advances 30 19,568 19,966<br />
Income from lending related activities 334,921 293,456<br />
Non-interest income 29 202,173 186,566<br />
Share of profit from associate 11 761 263<br />
Net income 537,855 480,285<br />
Operating expenditure 31 331,289 290,185<br />
Transfers to policyholders’ liability 32 9,769 20,294<br />
bEE transaction cost 33 2,064 6,241<br />
Profit before taxation 194,733 163,565<br />
Taxation 34 51,392 47,063<br />
Total profit after taxation 143,341 116,502<br />
other comprehensive income net of taxation<br />
Gain on revaluation of property 6,353 –<br />
Adjustment to tax rate 343 –<br />
Deferred taxation effect of release of property revaluation reserve 677 494<br />
Other movements affecting non-controlling interest (1,409) (316)<br />
Available-for-sale <strong>financial</strong> instrument reserve 1,246 6,198<br />
Total other comprehensive income net of taxation 7,210 6,376<br />
Total comprehensive income for the year 150,551 122,878<br />
Total profit after tax attributable to:<br />
Non-controlling interest 1,902 1,487<br />
Owners of the parent 141,439 115,015<br />
Total profit after taxation 143,341 116,502<br />
Total comprehensive income attributable to:<br />
Non-controlling interest 493 1,171<br />
Owners of the parent 150,058 121,707<br />
Total comprehensive income for the year 150,551 122,878<br />
Earnings per share (cents) 36 200.96 163.42<br />
Diluted earnings per share (cents) 36 200.96 163.42<br />
51
52<br />
NEDNAMIBIA HOLDINGS LIMItED ANNUAL REPORt 2010<br />
CONSOLIDAtED StAtEMENt OF<br />
CHANGES IN EQUITY<br />
FOR THE YEAR ENDED 31 DEcEmbER 2010<br />
Share<br />
capital<br />
Share<br />
premium<br />
General risk<br />
reserve<br />
N$’000 N$’000 N$’000<br />
balance at 1 January 2009 17,595 99,536 29,711<br />
Total comprehensive income for the year – – –<br />
Profit for the year – – –<br />
Other comprehensive income for the year – – –<br />
General risk reserve – – 8,659<br />
Share-based payments reserve movement – – –<br />
balance at 31 December 2009 17,595 99,536 38,370<br />
Total comprehensive income for the year – – –<br />
Profit for the year – – –<br />
other comprehensive income for the year – – –<br />
General risk reserve – – 4,878<br />
Share-based payments reserve movement – – –<br />
Balance at 31 December 2010 17,595 99,536 43,248
Revaluation<br />
reserve<br />
Share-based<br />
payment<br />
reserve<br />
Available-for<br />
sale-reserve<br />
Retained<br />
income<br />
Total<br />
shareholder’s<br />
interest<br />
Noncontrolling<br />
interest Total<br />
N$’000 N$’000 N$’000 N$’000 N$’000 N$’000 N$’000<br />
28,370 18,488 – 360,626 554,326 4,605 558,931<br />
(918) – 6,198 116,427 121,707 1,171 122,878<br />
– – – 115,015 115,015 1,487 116,502<br />
(918) – 6,198 1,412 6,692 (316) 6,376<br />
– – – (8,659) – – –<br />
– 1,347 – – 1,347 – 1,347<br />
27,452 19,835 6,198 468,394 677,380 5,776 683,156<br />
5,765 – 1,246 143,047 150,058 493 150,551<br />
– – – 141,439 141,439 1,902 143,341<br />
5,765 – 1,246 1,608 8,619 (1,409) 7,210<br />
– – – (4,878) – – –<br />
– (952) – 1,015 63 – 63<br />
33,217 18,883 7,444 607,578 827,501 6,269 833,770<br />
53
54<br />
NEDNAMIBIA HOLDINGS LIMItED ANNUAL REPORt 2010<br />
CONSOLIDAtED StAtEMENt OF<br />
CASH FLoWS<br />
FOR THE YEAR ENDED 31 DEcEmbER 2010<br />
2010 2009<br />
Notes N$’000 N$’000<br />
Cash generated by operating activities 37.1 378,907 262,143<br />
cash received from customers 37.2 781,266 754,310<br />
cash paid to customers 37.3 (221,382) (273,765)<br />
cash paid to employees and suppliers (231,397) (447,723)<br />
Dividends received 872 5,280<br />
Taxation paid 37.4 (55,313) (44,004)<br />
Recoveries of loans previously written off 30.1 7,621 13,578<br />
cash movements in advances and other accounts (317,228) (552,243)<br />
cash movements in operating liabilities 37.5 414,468 806,710<br />
Cash flow from investment activities (208,207) (139,383)<br />
Investment in property, equipment, computer software<br />
and development cost<br />
(17,035) (38,332)<br />
Proceeds on sale of property and equipment 1,881 126<br />
Acquisition of listed investments – (3,598)<br />
Proceeds from share premium repayment 11 – 3,000<br />
Purchase of non-dealing securities 37.6 (193,053) (100,579)<br />
Cash and short-term funds generated 170,700 122,760<br />
Cash and short-term funds at beginning of the year 570,079 447,319<br />
Cash and short-term funds at end of the year 37.7 740,779 570,079
NOtES tO tHE CONSOLIDAtED<br />
ANNUAL FINANCIAL STATEMENTS<br />
FOR THE YEAR ENDED 31 DEcEmbER 2010<br />
1. Basis of preparation<br />
The <strong>financial</strong> <strong>statements</strong> of NedNamibia Holdings (the ”company”) and its subsidiaries (the ”<strong>Group</strong>”) are prepared in accordance with and<br />
comply with International Financial Reporting Standards (“IFRS”) adopted by the International Accounting Standards board (“IASb”), and<br />
interpretations issued by the International Financial Reporting Interpretations committee (“IFRIc”) of the IASb and the requirements of the<br />
Namibian companies Act and the Namibian bank’s Act.<br />
The <strong>financial</strong> <strong>statements</strong> are presented in Namibian Dollar (“N$”), the functional currency, and are rounded to the nearest thousand<br />
Namibian Dollar. The <strong>financial</strong> <strong>statements</strong> are prepared on the historical cost basis except that the following assets and liabilities are stated<br />
at their fair value:<br />
– <strong>financial</strong> assets and <strong>financial</strong> liabilities at fair value through profit or loss;<br />
– <strong>financial</strong> assets classified as available-for-sale; and<br />
– owner-occupied properties.<br />
The accounting policies set out below have been applied consistently to all years presented in these <strong>financial</strong> <strong>statements</strong>.<br />
Critical accounting judgements and key sources of estimation uncertainty<br />
In the preparation of the <strong>financial</strong> <strong>statements</strong> the <strong>Group</strong> has recorded various assets and liabilities on the presumption that the <strong>Group</strong> is an<br />
ongoing business and as such, certain key sources of estimation have been assumed:<br />
Credit impairment<br />
The <strong>Group</strong> applies an incurred loss approach to impairment. Impairment losses are incurred only if there is objective evidence of impairment<br />
as a result of one or more past events that have occurred since initial recognition. This necessitates the establishment of “impairment<br />
triggers” on the occurrence of which an impairment loss is recognised.<br />
credit impairment is based on discounted estimated future cash flows on an asset or group of assets, where such objective evidence of<br />
impairment exists. The discount rate used to calculate the recoverable amount excludes consideration of any anticipated future credit losses.<br />
The <strong>Group</strong> has also raised an impairment for incurred but not reported (“IbNR”) losses. The purpose of the IbNR reserve is to allow for latent<br />
losses on a portfolio of loans and advances that have not yet been individually evidenced. Generally, a period of time will elapse between the<br />
incurrence of an impairment event and objective evidence of the impairment becoming evident, which is known as the “emergence period”.<br />
The IbNR reserve is based on the probability that loans that are ostensibly performing at the calculation date are impaired, and objective<br />
evidence of that impairment becomes evident during the emergence period.<br />
Fair value of <strong>financial</strong> instruments<br />
Directors anticipate that changing one or more of the assumptions used in the determination of fair value of <strong>financial</strong> instruments to<br />
reasonably possible alternative assumptions will not change the fair value of these <strong>financial</strong> instruments significantly.<br />
55
56<br />
NEDNAMIBIA HOLDINGS LIMItED ANNUAL REPORt 2010<br />
NOtES tO tHE CONSOLIDAtED<br />
ANNUAL FINANCIAL STATEMENTS<br />
FOR THE YEAR ENDED 31 DEcEmbER 2010 (cONTINUED)<br />
2. Adoption of new and revised standards<br />
Standards and interpretations effective in the current year<br />
The following standards and interpretations issued by the International Financial Reporting Interpretations committee are effective<br />
for the current year:<br />
Effective for<br />
<strong>annual</strong> periods<br />
beginning on<br />
New/revised International Financial reporting Standards Issued/revised or after<br />
IFRS 1 First-time Adoption of International Financial Reporting Standards —<br />
Amendments relating to oil and gas assets and determining whether an<br />
arrangement contains a lease<br />
IFRS 2 Share-based Payment – Amendments resulting from April 2009 Annual<br />
Improvements to IFRSs<br />
IFRS 2 Share-based Payment – Amendments relating to group cash-settled share-based<br />
payment transactions<br />
IFRS 3 business combinations comprehensive revision on applying the acquisition<br />
method<br />
IFRS 5 Non-current Assets Held for Sale and Discontinued Operations – Amendments<br />
resulting from may 2008 Annual Improvements to IFRSs<br />
IFRS 5 Non-current Assets Held for Sale and Discontinued Operations – Amendments<br />
resulting from April 2009 Annual Improvements to IFRSs<br />
IFRS 8 Operating Segments – Amendments resulting from April 2009 Annual<br />
Improvements to IFRSs<br />
IAS 1 Presentation of Financial Statements – Amendments resulting from April 2009<br />
Annual Improvements to IFRSs<br />
IAS 7 Statement of cash Flows – Amendments resulting from April 2009 Annual<br />
Improvements to IFRSs<br />
Revised July 2009 1 January 2010<br />
April 2009 1 July 2009<br />
June 2009 1 January 2010<br />
Revised 2008 1 July 2009<br />
Revised may 2008 1 July 2009<br />
April 2009 1 January 2010<br />
April 2009 1 January 2010<br />
April 2009 1 January 2010<br />
April 2009 1 January 2010<br />
IAS 17 Leases – Amendments resulting from April 2009 Annual Improvements to IFRSs April 2009 1 January 2010<br />
IAS 36 Impairment of Assets – Amendments resulting from April 2009 Annual<br />
Improvements to IFRSs<br />
IAS 39 Financial Instruments: Recognition and measurement – Amendments for eligible<br />
hedged items<br />
IAS 39 Financial Instruments: Recognition and measurement – Amendments for embedded<br />
derivatives when reclassifying <strong>financial</strong> instruments<br />
IAS 39 Financial Instruments: Recognition and measurement – Amendments resulting<br />
from April 2009 Annual Improvements to IFRSs<br />
April 2009 1 January 2010<br />
July 2008 1 July 2009<br />
march 2009 30 June 2009<br />
April 2009 1 January 2010<br />
The adoptions of the above Standards and Interpretations have introduced a number of terminology changes and have resulted in a<br />
number of changes in presentation and disclosure. The revised Standards and Interpretations had no impact on the reported results or<br />
<strong>financial</strong> position of the <strong>Group</strong>.
2. Adoption of new and revised standards (continued)<br />
recent amendments to standards and interpretations not effective in the current year<br />
The following table contains effective dates of IFRSs and recently revised IASs, which have not been early adopted by the <strong>Group</strong> and<br />
that might affect future <strong>financial</strong> periods:<br />
New/revised International Financial reporting Standards Issued/revised<br />
IFRS 1 First-time Adoption of International Financial Reporting Standards – <strong>Limited</strong><br />
Exemption from comparative IFRS 7 Disclosures for First-time Adopters<br />
IFRS 1 First-time Adoption of International Financial Reporting Standards – Amendments<br />
resulting from may 2010 Annual Improvements to IFRSs<br />
IFRS 1 First-time Adoption of International Financial Reporting Standards – Replacement<br />
of ‘fixed dates’ for certain exceptions with ‘the date of transition to IFRSs’<br />
IFRS 1 First-time Adoption of International Financial Reporting Standards – Additional<br />
exemption for entities ceasing to suffer from severe hyperinflation<br />
IFRS 3 business combinations – Amendments resulting from may 2010 Annual<br />
Improvements to IFRSs<br />
IFRS 7 Financial Instruments: Disclosures – Amendments resulting from may 2010 Annual<br />
Improvements to IFRSs<br />
IFRS 7 Financial Instruments: Disclosures – Amendments enhancing disclosures about<br />
transfers of <strong>financial</strong> assets<br />
Revised January<br />
2010<br />
57<br />
Effective for<br />
<strong>annual</strong> periods<br />
beginning on or<br />
after<br />
1 July 2010<br />
may 2010 1 January 2011<br />
December 2010 1 July 2011<br />
December 2010 1 July 2011<br />
may 2009 1 July 2010<br />
may 2010 1 January 2011<br />
October 2010 1 July 2011<br />
IFRS 9 Financial Instruments – classification and measurement November 2009 1 January 2013<br />
IAS 1 Presentation of Financial Statements – Amendments resulting from may 2010<br />
Annual Improvements to IFRSs<br />
may 2010 1 January 2011<br />
IAS 12 Income Taxes – <strong>Limited</strong> scope amendment (recovery of underlying assets) December 2010 1 January 2012<br />
IAS 24 Related Party Disclosures – Revised definition of related parties November 2009 1 January 2011<br />
IAS 27 consolidated and Separate Financial Statements – Amendments resulting from<br />
may 2010 Annual Improvements to IFRSs<br />
IAS 32 Financial Instruments: Presentation – Amendments relating to classification of<br />
rights issues<br />
IAS 34 Interim Financial Reporting – Amendments resulting from may 2010 Annual<br />
Improvements to IFRSs<br />
may 2010 1 July 2010<br />
2009 1 February 2010<br />
may 1 January 2011<br />
Effective for<br />
<strong>annual</strong> periods<br />
beginning on or<br />
International Financial reporting Interpretations Committee Interpretations issued but not yet effective<br />
after<br />
IAS 19 – The Limit on a Defined benefit Asset, minimum Funding Requirements and their Interaction – November 1 January 2011<br />
2009 Amendments with respect to voluntary prepaid contributions<br />
Extinguishing Financial Liabilities with Equity Instruments 1 July 2010<br />
A reliable estimate of the impact of the adoption of the recent amendments for the <strong>Group</strong> cannot yet be determined. Directors<br />
anticipate that the adoption of the recent standards and interpretations will have no material impact on the <strong>annual</strong> <strong>financial</strong> <strong>statements</strong><br />
in future periods, except for disclosure to the <strong>annual</strong> <strong>financial</strong> <strong>statements</strong>.
58<br />
NEDNAMIBIA HOLDINGS LIMItED ANNUAL REPORt 2010<br />
NOtES tO tHE CONSOLIDAtED<br />
ANNUAL FINANCIAL STATEMENTS<br />
FOR THE YEAR ENDED 31 DEcEmbER 2010 (cONTINUED)<br />
3. Significant accounting policies<br />
The following significant accounting policies have been applied consistently in dealing with items that are considered material in<br />
relation to the <strong>Group</strong>’s <strong>financial</strong> <strong>statements</strong>.<br />
3.1 Basis of consolidation<br />
The consolidated <strong>annual</strong> <strong>financial</strong> <strong>statements</strong> incorporate the <strong>annual</strong> <strong>financial</strong> <strong>statements</strong> of the company and entities controlled by<br />
the company. control is achieved where the <strong>Group</strong> has the power to govern the <strong>financial</strong> and operating policies of an entity so as to<br />
obtain benefits from its activities. control is presumed to exist when the <strong>Group</strong> owns directly or indirectly through its subsidiaries, more<br />
than half of the voting power of an entity, unless, in exceptional circumstances, it can be clearly demonstrated that such ownership<br />
does not constitute control. The <strong>Group</strong> considers the existence and effect of potential voting rights that are currently exercisable or<br />
convertible when assessing whether it has control. Entities in which the <strong>Group</strong> holds half or less of the voting rights, but are controlled<br />
by the <strong>Group</strong> by retaining the majority of risks or benefits, are also included in the consolidated <strong>financial</strong> <strong>statements</strong>.<br />
Subsidiary undertakings include special-purpose entities (“SPEs”) that are created to accomplish a narrow, well-defined objective, and<br />
may take the form of a company, corporation, trust, partnership or unincorporated entity. The assessment of control for SPEs is based<br />
on the substance of the relationship between the <strong>Group</strong> and the SPE. SPEs in which the <strong>Group</strong> holds half or less of the voting rights,<br />
but which are controlled by the <strong>Group</strong> by retaining the majority of risks or benefits, are also included in the <strong>Group</strong> <strong>financial</strong> <strong>statements</strong>.<br />
Acquisitions of subsidiaries and businesses are accounted for using the purchase method. The cost of the business combination is<br />
measured as the aggregate of the fair values (at the date of exchange) of assets given, liabilities incurred or assumed, and equity<br />
instruments issued by the <strong>Group</strong> in exchange for control of the acquiree, plus any costs directly attributable to the business<br />
combination. The acquiree’s identifiable assets, liabilities and contingent liabilities that meet the conditions for recognition under<br />
IFRS 3: business combinations are recognised at their fair values at the acquisition date, except for non-current assets (or disposal<br />
groups) that are classified as held for sale in accordance with IFRS 5: Non-current Assets Held for Sale and Discontinued Operations,<br />
which are measured at fair value less cost to sell.<br />
Goodwill arising on acquisition is recognised as an asset and initially measured at cost, being the excess of the cost of the business<br />
combination over the <strong>Group</strong>’s interest in the fair value of the acquiree’s identifiable assets, liabilities and contingent liabilities<br />
recognised. If, after reassessment, the <strong>Group</strong>’s interest in the fair value of the acquiree’s identifiable assets, liabilities and contingent<br />
liabilities exceeds the costs of the business combination, the excess is immediately recognised in profit or loss. The interest of minority<br />
shareholders in the acquiree is initially measured at the minority’s proportion of the net fair value of the assets, liabilities and contingent<br />
liabilities recognised.<br />
The <strong>Group</strong> consolidated <strong>financial</strong> <strong>statements</strong> include the assets, liabilities and results of NedNamibia Holdings <strong>Limited</strong> and its<br />
subsidiaries (including SPEs) controlled by the <strong>Group</strong>. The results of subsidiaries acquired or disposed of during the year are included<br />
in the consolidated statement of comprehensive income from the effective date of acquisition or up to the effective date of disposal,<br />
as appropriate.<br />
Where necessary, adjustments are made to the <strong>annual</strong> <strong>financial</strong> <strong>statements</strong> of subsidiaries to bring their accounting policies into<br />
line with those of the <strong>Group</strong>. All intra-group transactions, balances, and profits and losses arising from intra-group transactions, are<br />
eliminated in the preparation of the <strong>Group</strong> consolidated <strong>annual</strong> <strong>financial</strong> <strong>statements</strong>. Unrealised losses are not eliminated to the extent<br />
that they provide evidence of impairment.<br />
The difference between the proceeds from the disposal of a subsidiary and its carrying amount as of the date of disposal, including the<br />
cumulative amount of any exchange differences that relate to the subsidiary in equity, is recognised in the consolidated statement of<br />
comprehensive income as the gain or loss on the disposal of the subsidiary.<br />
Non-controlling interest in the net assets of consolidated subsidiaries are identified separately from the <strong>Group</strong>’s equity therein. Noncontrolling<br />
interest consists of the amount of those interests at the date of the original business combination and the minority’s share<br />
of changes in the equity since the date of the combination. Losses applicable to the minority in excess of the minority’s interest in the<br />
subsidiary’s equity are allocated against the interest of the <strong>Group</strong> except to the extent that the minority has a binding obligation and<br />
is able to make an additional investment to cover the losses.
3. Significant accounting policies (continued)<br />
3.1 Basis of consolidation (continued)<br />
3.1.1 Investment in associate<br />
An associate is an entity, including an unincorporated entity such as a partnership, over which the <strong>Group</strong> has significant influence<br />
and that is neither a subsidiary nor an interest in a joint venture. Significant influence is the power to participate in the <strong>financial</strong> and<br />
operating policy decisions of the investee, but is not control or joint control over those policies.<br />
The results and assets and liabilities of associates are incorporated in the <strong>Group</strong> <strong>financial</strong> <strong>statements</strong> using the equity method of<br />
accounting, from the date significant influence commences until the date significant influence ceases. Under the equity method,<br />
investments in associates are carried in the consolidated statement of <strong>financial</strong> position at the cost as adjusted for post-acquisition<br />
changes in the <strong>Group</strong>’s share of the net assets of the associate, less any impairment in the value of individual investments. Losses of an<br />
associate in excess of the <strong>Group</strong>’s interest in that associate are not recognised. When the <strong>Group</strong>’s share of losses exceeds the carrying<br />
amount of the associate, the carrying amount is reduced to nil, inclusive of any debt outstanding, and recognition of further losses is<br />
discontinued, except to the extent that the <strong>Group</strong> has incurred or guaranteed obligations in respect of the associate.<br />
Any excess of the cost of acquisition over the <strong>Group</strong>’s share of the net fair value of the identifiable assets, liabilities and contingent<br />
liabilities of the associate recognised at the date of acquisition is recognised as goodwill. The goodwill is included within the carrying<br />
amount of the investment and is assessed for impairment as part of the investment. Any excess of the <strong>Group</strong>’s share of the net fair<br />
value of the identifiable assets, liabilities and contingent liabilities over the cost of acquisition, after reassessment, is recognised<br />
immediately in profit or loss.<br />
Where a <strong>Group</strong> entity transacts with an associate of the <strong>Group</strong>, unrealised profits and losses are eliminated to the extent of the <strong>Group</strong>’s<br />
interest in the relevant associate.<br />
3.1.2 Interests in joint ventures<br />
A joint venture is a contractual arrangement whereby the <strong>Group</strong> and other parties undertake an economic activity that is subject to<br />
joint control, that is when the strategic <strong>financial</strong> and operating policy decisions relating to the activities of the joint venture require the<br />
unanimous consent of the parties sharing control.<br />
Where a group entity undertakes its activities under joint venture arrangements directly, the <strong>Group</strong>’s share of jointly controlled assets<br />
and any liabilities incurred jointly with other venturers are recognised in the <strong>financial</strong> <strong>statements</strong> of the relevant entity and classified<br />
according to their nature. Liabilities and expenses incurred directly in respect of interests in jointly controlled assets are accounted for<br />
on an accrual basis. Income from the sale or use of the <strong>Group</strong>’s share of the output of jointly controlled assets, and its share of joint<br />
venture expenses, are recognised when it is probable that the economic benefits associated with the transactions will flow to/from the<br />
<strong>Group</strong> and their amount can be measured reliably.<br />
Joint venture arrangements that involve the establishment of a separate entity in which each venturer has an interest are referred to as<br />
jointly controlled entities. The <strong>Group</strong> reports its interests in jointly controlled entities using proportionate consolidation, except when<br />
the investment is classified as held-for-sale, in which case it is accounted for in accordance with IFRS 5: Non-current Assets Held for<br />
Sale and Discontinued Operations. The <strong>Group</strong>’s share of the assets, liabilities, income and expenses of jointly controlled entities are<br />
combined with the equivalent items in the consolidated <strong>financial</strong> <strong>statements</strong> on a line-by-line basis.<br />
Any goodwill arising on the acquisition of the <strong>Group</strong>’s interest in a jointly controlled entity is accounted for in accordance with the<br />
<strong>Group</strong>’s accounting policy for goodwill arising on the acquisition of a subsidiary (see 3.2 below). Where the <strong>Group</strong> transacts with its<br />
jointly controlled entities, unrealised profits and losses are eliminated to the extent of the <strong>Group</strong>’s interest in the joint venture.<br />
3.1.3 Goodwill<br />
Goodwill arises on the acquisition of subsidiaries, associates or a jointly controlled entity. Goodwill is measured at cost less accumulated<br />
impairment losses. In respect of equity accounted investments, the carrying amount of goodwill is included in the carrying amount of<br />
the investment.<br />
All business combinations are accounted for by applying the purchase method. At acquisition date, the <strong>Group</strong> recognises the fair value<br />
of the acquiree’s identifiable assets, liabilities and contingent liabilities that satisfy the recognition criteria at their respective fair values.<br />
59
60<br />
NEDNAMIBIA HOLDINGS LIMItED ANNUAL REPORt 2010<br />
NOtES tO tHE CONSOLIDAtED<br />
ANNUAL FINANCIAL STATEMENTS<br />
FOR THE YEAR ENDED 31 DEcEmbER 2010 (cONTINUED)<br />
3. Significant accounting policies (continued)<br />
3.1 Basis of consolidation (continued)<br />
3.1.3 Goodwill (continued)<br />
The cost of a business combination is the fair value of purchase consideration due at date of acquisition plus any directly attributable<br />
transaction costs. Any contingent purchase consideration is recognised to the extent that it is probable and can be measured reliably.<br />
Any excess between the cost of the business combination and the <strong>Group</strong>’s interest in the net fair value of the identifiable assets,<br />
liabilities and contingent liabilities acquired, is recognised as goodwill in the statement of <strong>financial</strong> position. Goodwill is adjusted for<br />
any subsequent remeasurement of contingent purchase consideration.<br />
For the purpose of impairment testing, goodwill is allocated to each of the <strong>Group</strong>’s cash-generating units expected to benefit from<br />
the synergies of the combination. A cash-generating unit is the smallest identifiable group of assets that generates cash inflows that<br />
are largely independent of the cash inflows from other assets or group of assets. cash-generating units to which goodwill has been<br />
allocated are tested for impairment <strong>annual</strong>ly, or more frequently when there is an indication that the unit may be impaired. If the<br />
recoverable amount of the cash-generating unit is less than the carrying amount of the unit, the impairment loss is allocated first to<br />
reduce the carrying amount of any goodwill allocated to the unit and then to the assets of the unit pro rata on the basis of the carrying<br />
amount of each asset in the unit.<br />
The recoverable amount of a cash-generating unit is the higher of its fair value less cost to sell and its value in use. The fair value less<br />
cost to sell is determined by ascertaining the current market value of an asset and deducting any costs related to the realisation of<br />
the asset. In assessing value in use, the expected future cash flows from the cash-generating unit are discounted to their present value<br />
using a discount rate that reflects current market assessments of the time value of money and the risks specific to the cash-generating<br />
unit. Impairment losses relating to goodwill are not reversed in a subsequent period and all impairment losses are recognised in profit<br />
and loss.<br />
On disposal of a subsidiary or jointly controlled entity, the attributable amount of goodwill is included in the determination of the<br />
profit or loss on disposal. The <strong>Group</strong>’s policy for goodwill arising on the acquisition of an associate is described under “Investment in<br />
associate” above.<br />
3.2 Financial instruments<br />
Financial instruments as reflected on the statement of <strong>financial</strong> position include all assets and liabilities, including derivative instruments,<br />
but exclude investments in subsidiaries and associate companies, employee benefit plans, property and equipment, provisions, deferred<br />
taxation, taxation payable/receivable, intangible assets and leases. Financial instruments are accounted for under IAS 32: Financial<br />
Instruments: Presentation, IAS 39: Financial Instruments: Recognition and measurement and IFRS 7: Financial Instruments: Disclosures.<br />
The <strong>Group</strong> does not apply hedge accounting. This accounting policy should be read in conjunction with the categorised statement of<br />
<strong>financial</strong> position.<br />
(i) Initial recognition<br />
Financial assets are recognised on the statement of <strong>financial</strong> position when the <strong>Group</strong> becomes a party to the contractual provisions of<br />
a <strong>financial</strong> instrument. All purchases of <strong>financial</strong> assets that require delivery within the time frame established by regulation or market<br />
convention (“regular way” purchases) are recognised at trade date, which is the date on which the <strong>Group</strong> commits to purchase the<br />
asset. Financial liabilities are recognised on trade date, which is when the <strong>Group</strong> becomes a party to the contractual provisions of the<br />
<strong>financial</strong> instruments.<br />
(ii) Initial measurement<br />
Financial instruments are initially recognised at fair value plus, in the case of a <strong>financial</strong> asset or liability not at fair value through profit<br />
and loss, transaction costs that are incremental to the <strong>Group</strong> and directly attributable to the acquisition or issue of the <strong>financial</strong> asset<br />
or <strong>financial</strong> liability.<br />
(iii) Subsequent measurement<br />
Subsequent to initial measurement, <strong>financial</strong> instruments are either measured at fair value or amortised cost, depending on their<br />
classification:
3. Significant accounting policies (continued)<br />
3.2 Financial instruments (continued)<br />
(iii) Subsequent measurement (continued)<br />
• Financial assets and <strong>financial</strong> liabilities at fair value through profit or loss<br />
Financial instruments at fair value through profit or loss consist of trading instruments and instruments that the <strong>Group</strong> has elected,<br />
on initial recognition date, to designate as at fair value through profit or loss.<br />
Trading instruments are <strong>financial</strong> assets or <strong>financial</strong> liabilities that were acquired or incurred principally for the purpose of sale or<br />
repurchase in the near term, form part of a portfolio with a recent pattern of short-term profit-taking or are derivatives. The <strong>Group</strong>’s<br />
derivative transactions include foreign exchange contracts, currency and interest rate swaps.<br />
Financial assets and <strong>financial</strong> liabilities that the <strong>Group</strong> has elected, on initial recognition date, to designate as at fair value through<br />
profit or loss are those that meet any one of the following criteria:<br />
– where the fair value through profit or loss designation eliminates or significantly reduces a measurement or recognition<br />
inconsistency that would otherwise arise from using different bases to measure and recognise the gains and losses on <strong>financial</strong><br />
assets and <strong>financial</strong> liabilities; or<br />
– the instrument forms part of a group of <strong>financial</strong> instruments that is managed, evaluated and reported on using a fair value basis<br />
in accordance with a documented risk management or investment strategy; or<br />
– the <strong>financial</strong> instrument contains an embedded derivative, which significantly modifies the cash flows of the host contract or<br />
where the embedded derivative would clearly require separation.<br />
Financial assets and <strong>financial</strong> liabilities at fair value through profit or loss are measured at fair value, with fair value gains and<br />
losses (excluding impairment losses, interest income and interest expense calculated on the amortised cost basis relating to those<br />
interest-bearing instruments that have been designated as at fair value through profit or loss) reported in non-interest revenue as<br />
they arise. Impairment losses calculated on the amortised cost basis are recognised in the statement of comprehensive income<br />
in impairment losses on loans and advances. Interest income and interest expense calculated on the amortised cost basis are<br />
reported in interest income and expense.<br />
• Other <strong>financial</strong> liabilities<br />
All <strong>financial</strong> liabilities, other than those at fair value through profit and loss, are classified as other <strong>financial</strong> liabilities and are<br />
measured at amortised cost. The carrying amounts are disclosed in the notes to the <strong>financial</strong> <strong>statements</strong>. The approximation of the<br />
fair value of other <strong>financial</strong> liabilities have proven to be reasonably close to the carrying value of such instruments and in terms<br />
of IFRS 7.29(a) the <strong>Group</strong> is not required to disclose the fair value of these instruments in the notes to the <strong>financial</strong> <strong>statements</strong>.<br />
• Held-to-maturity <strong>financial</strong> assets<br />
Held-to-maturity <strong>financial</strong> assets are non-derivative <strong>financial</strong> assets with fixed or determinable payments and fixed maturity that<br />
the <strong>Group</strong> has the intent and ability to hold to maturity, other than those that meet the definition of loans and receivables or those<br />
that were designated as at fair value through profit or loss or available-for-sale. Held-to-maturity <strong>financial</strong> assets are measured at<br />
amortised cost, with interest income recognised in profit or loss.<br />
• Loans and receivables<br />
Loans and receivables are non-derivative <strong>financial</strong> assets with fixed or determinable payments that are not quoted in an active<br />
market, other than those classified by the <strong>Group</strong> as at fair value through profit or loss or available-for-sale. Financial assets classified<br />
as loans and receivables are carried at amortised cost less any impairment, with interest income recognised in profit or loss. The<br />
majority of the <strong>Group</strong>’s advances are included in the loans and receivables category. The carrying amounts are disclosed in the<br />
notes to the <strong>financial</strong> <strong>statements</strong>. The approximation of the fair value of loans and receivables have proven to be reasonable close<br />
to the carrying value of such instruments and in terms of IFRS 7.29(a) the <strong>Group</strong> is not required to disclose the fair value of these<br />
instruments in the notes to the <strong>financial</strong> <strong>statements</strong>.<br />
61
62<br />
NEDNAMIBIA HOLDINGS LIMItED ANNUAL REPORt 2010<br />
NOtES tO tHE CONSOLIDAtED<br />
ANNUAL FINANCIAL STATEMENTS<br />
FOR THE YEAR ENDED 31 DEcEmbER 2010 (cONTINUED)<br />
3. Significant accounting policies (continued)<br />
3.2 Financial instruments (continued)<br />
(iii) Subsequent measurement (continued)<br />
• Available-for-sale assets<br />
Financial assets are classified as available-for-sale where the intention, origination and designation of the instrument do not fall<br />
within the ambit of the other <strong>financial</strong> asset classifications. Available-for-sale instruments are typically assets that are held for a<br />
longer period and in respect of which short-term fluctuations in value do not affect the <strong>Group</strong>’s hold or sell decision.<br />
Available-for-sale <strong>financial</strong> assets are measured at fair value, with fair value gains and losses recognised directly in other comprehensive<br />
income along with the associated deferred taxation. Any foreign currency translation gains and losses or interest revenue, measured<br />
on an effective-yield basis, are reclassified to profit and loss as they arise. When available-for-sale equity instruments are determined<br />
to be impaired to the extent that the fair value declines below its original cost, the resultant losses are recognised in profit or loss.<br />
(iv) Embedded derivatives<br />
An embedded derivative arises when derivatives are a component of a <strong>financial</strong> instrument in such a way that the cash flows in respect<br />
of the instrument vary in a similar way to those in respect of a standalone derivative.<br />
Where the value of embedded derivatives can be reliably measured, embedded derivatives are accounted for separately at their fair<br />
value.<br />
certain derivatives embedded in other <strong>financial</strong> and non-<strong>financial</strong> instruments, such as the conversion option in a convertible bond, are<br />
treated as separate derivatives and recognised as such on a standalone basis, when their risks and characteristics are not closely related<br />
to those of the host contract and the host contract is not carried at fair value with unrealised gains and losses reported in profit or loss.<br />
If it is not possible to determine the fair value of the embedded derivative, the entire hybrid instrument is categorised as fair value<br />
through profit or loss and measured at fair value.<br />
(v) Measurement basis of <strong>financial</strong> instruments<br />
• Amortised cost<br />
Amortised cost <strong>financial</strong> assets and <strong>financial</strong> liabilities are measured at fair value on initial recognition, plus or minus the cumulative<br />
amortisation using the effective interest rate method of any difference between that initial amount and the maturity amount, less<br />
any cumulative impairment losses.<br />
For <strong>financial</strong> assets, the effective interest rate method calculates the amortised cost of a <strong>financial</strong> asset and allocates the interest<br />
income over the relevant period. The effective interest rate is the rate that exactly discounts estimated future cash receipts through<br />
the expected life of the <strong>financial</strong> asset. cash receipts include all fees that form an integral part of the effective interest rate,<br />
transaction costs and other premiums or discounts.<br />
For <strong>financial</strong> liabilities, the effective interest rate method calculates the amortised cost of a <strong>financial</strong> liability and allocating the<br />
interest expense over the relevant period. The effective interest rate is the rate that exactly discounts estimated future cash payments<br />
through the expected life of the <strong>financial</strong> liability.<br />
• Fair value<br />
Direct and incremental transaction costs are included in the initial fair value of <strong>financial</strong> assets and <strong>financial</strong> liabilities, other than<br />
those at fair value through profit or loss. The best evidence of the fair value of a <strong>financial</strong> asset or <strong>financial</strong> liability at initial<br />
recognition is the transaction price, unless the fair value of the instrument is evidenced by comparison with other current observable<br />
market transactions in the same instrument or based on a valuation technique whose variables include market observable data.<br />
Where quoted market prices are available, such market data is used to determine the fair value of <strong>financial</strong> assets and <strong>financial</strong><br />
liabilities that are measured at fair value. The bid price is used to measure <strong>financial</strong> assets held and the offer price is used to measure<br />
the fair value of <strong>financial</strong> liabilities. mid-market prices are used to measure fair value only to the extent that the <strong>Group</strong> has assets<br />
and liabilities offsetting risk positions (refer to note 3.2 (ix)).
3. Significant accounting policies (continued)<br />
3.2 Financial instruments (continued)<br />
(v) Measurement basis of <strong>financial</strong> instruments (continued)<br />
• Fair value (continued)<br />
If quoted bid prices are unavailable, the fair value of the <strong>financial</strong> asset is estimated using pricing models or discounted cash<br />
flow techniques. Where discounted cash flow techniques are used, estimated future cash flows are based on management’s best<br />
estimates and the discount rate used is a market-related rate at the reporting date for an instrument with similar terms and<br />
conditions. Where pricing models are used, inputs are based on market-related measures (prices from observable current market<br />
transaction in the same instrument without modification or other observable market data) at the reporting date.<br />
When market-related measures are not available, observable market data is modified to incorporate relevant factors that a market<br />
participant in an arm’s length exchange motivated by normal business considerations would consider in determining the fair<br />
value of the <strong>financial</strong> instrument (non-observable market inputs). The International Private Equity and Venture capital Valuation<br />
Guidelines and industry practice, which have demonstrated the capability to provide reliable estimates of prices obtained in actual<br />
market transactions, are used to determine the adjustments to observable market data. consideration is given to the nature and<br />
circumstances of the <strong>financial</strong> instrument in determining the appropriate non-observable market input.<br />
Non-observable market inputs are used to determine the fair values of, among others, private equity investments, management<br />
buyouts and development capital. Valuation techniques applied by the <strong>Group</strong> and that incorporate non-observable market inputs<br />
include, among others, earnings multiples, the price of recent investments, the value of the net assets of the underlying business<br />
and discounted cashflows.<br />
The fair value of a <strong>financial</strong> liability with a demand feature is not less that the amount payable on demand, discounted from the<br />
first date on which the amount could be required to be paid. In cases where the fair value of <strong>financial</strong> liabilities cannot be reliably<br />
determined, these liabilities are recorded at the amount due.<br />
Investments in equity instruments that do not have a quoted market price in an active market and whose fair value cannot be<br />
reliably measured, and derivatives that are linked to and have to be settled by delivery of such unquoted equity instruments, are not<br />
measured at fair value but at cost. Fair value is considered reliably measured if:<br />
– the variability in the range of reasonable fair value estimates is not significant for that instrument; or<br />
– the probabilities of the various estimates within the range can be reasonably assessed and used in estimating fair value.<br />
(vi) Derecognition<br />
All <strong>financial</strong> assets and <strong>financial</strong> liabilities are derecognised on trade date, which is when the <strong>Group</strong> commits to selling a <strong>financial</strong> asset<br />
or redeeming a <strong>financial</strong> liability.<br />
The <strong>Group</strong> derecognises a <strong>financial</strong> asset when and only when:<br />
– the contractual rights to the cash flows arising from the <strong>financial</strong> assets have expired or been forfeited by the <strong>Group</strong>; or<br />
– it transfers the <strong>financial</strong> asset including substantially all the risks and rewards of ownership of the asset; or<br />
– it transfers the <strong>financial</strong> asset, neither retaining nor transferring substantially all the risks and rewards of ownership of the asset, but<br />
no longer retains control of the asset.<br />
A <strong>financial</strong> liability (or part of a <strong>financial</strong> liability) is derecognised when and only when the liability is extinguished, that is, when the<br />
obligation specified in the contract is discharged, cancelled or has expired.<br />
The difference between the carrying amount of a <strong>financial</strong> liability (or part thereof) extinguished or transferred to another party and<br />
the consideration paid, including any non-cash assets transferred or liabilities assumed, is recognised in profit or loss for the year.<br />
The difference between the carrying amount of a <strong>financial</strong> asset (or part thereof) derecognised and the consideration received, including<br />
any non-cash assets received or liabilities extinguished, is recognised in profit or loss for the year.<br />
63
64<br />
NEDNAMIBIA HOLDINGS LIMItED ANNUAL REPORt 2010<br />
NOtES tO tHE CONSOLIDAtED<br />
ANNUAL FINANCIAL STATEMENTS<br />
FOR THE YEAR ENDED 31 DEcEmbER 2010 (cONTINUED)<br />
3. Significant accounting policies (continued)<br />
3.2 Financial instruments (continued)<br />
(vii) Impairment of <strong>financial</strong> assets<br />
The <strong>Group</strong> assesses at each reporting date whether there is objective evidence that a <strong>financial</strong> asset or group of <strong>financial</strong> assets is<br />
impaired. A <strong>financial</strong> asset or a group of <strong>financial</strong> assets is impaired and impairment losses are incurred if, and only if, there is objective<br />
evidence of impairment as a result of one or more events that occurred after the initial recognition of the asset (a ‘loss event’) and that<br />
loss event (or events) has an impact on the estimated future cash flows of the <strong>financial</strong> asset or group of <strong>financial</strong> assets that can be<br />
reliably estimated. Objective evidence that a <strong>financial</strong> asset or group of assets is impaired includes observable data that comes to the<br />
attention of the <strong>Group</strong> about the following loss events:<br />
– significant <strong>financial</strong> difficulty of the issuer or obligor;<br />
– a breach of contract, such as a default or delinquency in interest or principal payments;<br />
– the <strong>Group</strong>, for economic or legal reasons relating to the borrower’s <strong>financial</strong> difficulty, a concession that the lender would not<br />
otherwise consider;<br />
– it becoming probable that the borrower will enter bankruptcy or other <strong>financial</strong> reorganisation;<br />
– the disappearance of an active market for that <strong>financial</strong> asset because of <strong>financial</strong> difficulties; or<br />
– observable data indicating that there is a measurable decrease in the estimated future cash flows from a group of <strong>financial</strong> assets<br />
since the initial recognition of those assets, although the decrease cannot yet be identified with the individual <strong>financial</strong> assets in<br />
the group, including:<br />
• adverse changes in the payment status of borrowers in the <strong>Group</strong>; or<br />
• national or local economic conditions that correlate with defaults on the assets in the <strong>Group</strong>.<br />
• Assets carried at amortised cost<br />
If there is objective evidence that an impairment loss on loans and receivables or held-to-maturity investments carried at amortised<br />
cost has been incurred, the amount of the loss is measured as the difference between the asset’s carrying amount and the present<br />
value of estimated future cash flows (excluding future credit losses that have not been incurred) discounted at the <strong>financial</strong> asset’s<br />
original effective interest rate. The carrying amount of the asset is reduced through the use of an allowance account and the amount<br />
of the loss is recognised in profit or loss.<br />
The <strong>Group</strong> first assesses whether objective evidence of impairment exists individually for <strong>financial</strong> assets that are individually<br />
significant, and individually or collectively for <strong>financial</strong> assets that are not individually significant. If the <strong>Group</strong> determines that no<br />
objective evidence of impairment exists for an individually assessed <strong>financial</strong> asset, whether significant or not, it includes the asset<br />
in a group of <strong>financial</strong> assets with similar credit risk characteristics and collectively assesses them for impairment.<br />
If, in a subsequent year, the amount of the impairment loss decreases and the decrease can be related objectively to an event<br />
occurring after the impairment was recognised (such as an improvement in the debtor’s credit rating), the previously recognised<br />
impairment loss is reversed by adjusting the allowance account. The reversal does not result in a carrying amount of the <strong>financial</strong><br />
asset that exceeds what the amortised cost would have been had the impairment not been recognised at the date on which the<br />
impairment is reversed. The amount of the reversal is recognised in profit or loss for the year.
3. Significant accounting policies (continued)<br />
3.2 Financial instruments (continued)<br />
(vii) Impairment of <strong>financial</strong> assets (continued)<br />
• Financial assets carried at cost<br />
If there is objective evidence that an impairment loss has been incurred on an unquoted equity instrument that is not carried at fair<br />
value, because its fair value cannot be reliably measured, or on a derivative asset that is linked to and has to be settled by delivery<br />
of such an unquoted equity instrument, the amount of the impairment loss is measured as the difference between the carrying<br />
amount of the <strong>financial</strong> asset and the present value of estimated future cash flows discounted at the current market rate of return<br />
for a similar <strong>financial</strong> asset. Such impairment losses are not reversed.<br />
• Available-for-sale <strong>financial</strong> assets<br />
When a decline in the fair value of an available-for-sale <strong>financial</strong> asset has been recognised directly in other comprehensive<br />
income and there is objective evidence that the asset is impaired, the cumulative loss that has been recognised directly in other<br />
comprehensive income is removed from other comprehensive income and recognised in profit or loss even though the <strong>financial</strong><br />
asset has not been derecognised.<br />
The amount of the cumulative loss that is removed from other comprehensive income and recognised in profit or loss is the difference<br />
between the acquisition cost (net of any principal repayment and amortisation) and current fair value, less any impairment loss on<br />
that <strong>financial</strong> asset previously recognised in profit or loss. Impairment losses recognised in profit and loss for an investment in an<br />
equity instrument classified as available-for-sale are not reversed through profit or loss.<br />
If, in a subsequent period, the fair value of a debt instrument classified as available-for-sale increases and the increase can be<br />
objectively related to an event occurring after the impairment loss was recognised in profit and loss, the impairment loss is reversed,<br />
with the amount of the reversal recognised in profit or loss for the year.<br />
• Maximum credit risk<br />
credit risk arises principally from loans and advances to clients, investment securities derivatives and irrevocable commitments to<br />
provide facilities. The maximum credit risk is typically the gross carrying amount, net of any amounts offset and impairment losses.<br />
The maximum credit exposure for loan commitments is the full amount of the commitment if the loan cannot be settled net in<br />
cash or using another <strong>financial</strong> asset.<br />
• Renegotiated <strong>financial</strong> assets<br />
Financial assets are deemed as renegotiated <strong>financial</strong> assets when the terms of <strong>financial</strong> assets that would otherwise be past due or<br />
impaired have been renegotiated and restructured in an effort to reduce the risk of the borrower defaulting and the <strong>Group</strong> ultimately<br />
incurring a loss. Restructuring is done by granting a concession to the borrower, such as restructuring the repayment terms or<br />
interest rate to improve the borrower’s cash flow position, and then obtaining further or better security, subsequently reducing the<br />
risk of default.<br />
Renegotiation of asset-based finance accounts are only done in exceptional circumstances and after the asset has been inspected<br />
and found to be in an acceptable condition.<br />
An arrangement for repayment of arrears or legal collections matters, whether by means of an increased debit order against<br />
un-adjusted instalment, or by means of a borrower’s transfer or deposit of additional funds into the account, does not constitute a<br />
restructuring. Only short-term arrangements (i.e. arrears to be rectified within two to three months) are accepted on active accounts<br />
in arrears.<br />
65
66<br />
NEDNAMIBIA HOLDINGS LIMItED ANNUAL REPORt 2010<br />
NOtES tO tHE CONSOLIDAtED<br />
ANNUAL FINANCIAL STATEMENTS<br />
FOR THE YEAR ENDED 31 DEcEmbER 2010 (cONTINUED)<br />
3. Significant accounting policies (continued)<br />
3.2 Financial instruments (continued)<br />
(vii) Impairment of <strong>financial</strong> assets (continued)<br />
• Credit ratings<br />
The grades and the description of the grades utilised by the <strong>Group</strong> in grading the loans and advances are detailed in the table below:<br />
GrADE<br />
Performing<br />
DESCrIPTIoN DESCrIPTIoN oF rATING QUALITY<br />
NGR 0 No risk (political grade) No risk<br />
NGR 1 - 12 Investment grade Extremely good creditworthiness<br />
NGR 13 Transition: Investment to subinvestment Satisfactory average creditworthiness<br />
NGR 14 Subinvestment grade Still satisfactory creditworthiness<br />
NGR 15 Subinvestment grade Still satisfactory creditworthiness<br />
NGR 16 Subinvestment grade Still satisfactory creditworthiness<br />
NGR 17 Subinvestment grade Generally still sufficient creditworthiness<br />
NGR 18 Subinvestment grade Generally still sufficient creditworthiness<br />
NGR 19 Subinvestment grade Increased risk<br />
NGR 20 Subinvestment grade Increased risk<br />
NGR 22 Watchlist High risk<br />
NGR 23 Watchlist High risk<br />
NGR 24 Watchlist Default imminent<br />
Non-performing<br />
NGR 25 Default Sub-standard to loss<br />
(viii) Financial liabilities and equity instruments issued by the <strong>Group</strong><br />
Classification as debt or equity<br />
Debt and equity instruments are classified as either <strong>financial</strong> liabilities or as equity in accordance with the substance of the contractual<br />
arrangement.<br />
Equity instruments<br />
An equity instrument is any contract that evidences a residual interest in the assets of an entity after deducting all of its liabilities.<br />
Equity instruments issued by the <strong>Group</strong> are recorded at the proceeds received, net of direct issue costs.<br />
Compound instruments<br />
The component parts of compound instruments issued by the <strong>Group</strong> are classified separately as <strong>financial</strong> liabilities and equity in<br />
accordance with the substance of the contractual arrangement. At the date of issue, the fair value of the liability component is<br />
estimated using the prevailing market interest rate for similar non-convertible instruments.<br />
This amount is recorded as a liability on an amortised cost basis using the effective interest method until extinguished upon conversion<br />
or at the instrument’s maturity date. The equity component is determined by deducting the amount of the liability component from<br />
the fair value of the compounded instrument as a whole. This is recognised and included in equity, net of income taxation effects, and<br />
is not subsequently remeasured.<br />
(ix) Offsetting <strong>financial</strong> instruments and related income<br />
Financial assets and liabilities are offset and the net amount reported in the statement of <strong>financial</strong> position only when there is a legally<br />
enforceable right to set-off and there is intention to settle on a net basis or to realise the asset and settle the liability simultaneously.
3. Significant accounting policies (continued)<br />
3.2 Financial instruments (continued)<br />
(ix) Offsetting <strong>financial</strong> instruments and related income (continued)<br />
Income and expense items are offset only to the extent that their related instruments have been offset in the statement of <strong>financial</strong><br />
position.<br />
(x) Collateral<br />
Financial and non-<strong>financial</strong> assets are held as collateral in respect of certain recognised <strong>financial</strong> assets. Such collateral is not recognised<br />
by the <strong>Group</strong>, as the <strong>Group</strong> does not retain the risks and rewards of ownership, and is obliged to return such collateral to counterparties<br />
on settlement of the related obligations. Should a counterparty be unable to settle its obligations, the <strong>Group</strong> takes possession of<br />
collateral or calls on other credit enhancements as full or part settlement of such amounts. These assets are recognised when the<br />
applicable recognition criteria under IFRS are met, and the <strong>Group</strong>’s accounting policies are applied from the date of recognition (refer<br />
to note 49.5 to the <strong>annual</strong> <strong>financial</strong> <strong>statements</strong>).<br />
collateral is also given to counterparties under certain <strong>financial</strong> arrangements, but such assets are not derecognised where the <strong>Group</strong><br />
retains the risks and rewards of ownership. Such assets are at risk to the extent that the <strong>Group</strong> is unable to fulfil its obligations to<br />
counterparties (refer to note 8 to the <strong>annual</strong> <strong>financial</strong> <strong>statements</strong>).<br />
(xi) Acceptances<br />
Acceptances comprise undertakings by the <strong>Group</strong> to pay bills of exchange drawn on clients. The <strong>Group</strong> expects most acceptances to<br />
be settled simultaneously with the reimbursement from clients. Acceptances are disclosed as liabilities with the corresponding asset<br />
recorded in the statement of <strong>financial</strong> position.<br />
(xii) Financial guarantee contracts<br />
Financial guarantee contracts are recognised as insurance contracts. Liability adequacy testing is performed to ensure that the carrying<br />
amount of the liability for <strong>financial</strong> guarantee contracts is sufficient.<br />
3.3 Instalment transactions<br />
Instalment credit agreements are regarded as financing transactions and the total instalments, less unearned finance charges, are<br />
included in advances and other accounts. Finance charges are computed at the commencement of the contractual periods and are<br />
recognised in income in proportion to the net cash investment capital balances outstanding. Unearned finance charges are carried<br />
forward as deferred income and deducted from advances.<br />
3.4 Property and equipment<br />
3.4.1 Initial recognition and subsequent expenditure<br />
Items of property and equipment are initially recognised at cost if it is probable that any future economic benefits associated with the<br />
items will flow to the <strong>Group</strong> and it has a cost that can be measured reliably.<br />
Subsequent expenditure is capitalised when it is measurable and will result in probable future economic benefits. Expenditure incurred<br />
to replace a component of an item of property or equipment is capitalised to the cost of the item of property and equipment and the<br />
part replaced is derecognised. All other expenditure is recognised in profit or loss as an expense when incurred.<br />
certain items of property and equipment that had been revalued to fair value on 1 January 2004, the date of transition to IFRSs, are<br />
measured on the basis of deemed cost, being the revalued amount at the date of that revaluation.<br />
67
68<br />
NEDNAMIBIA HOLDINGS LIMItED ANNUAL REPORt 2010<br />
NOtES tO tHE CONSOLIDAtED<br />
ANNUAL FINANCIAL STATEMENTS<br />
FOR THE YEAR ENDED 31 DEcEmbER 2010 (cONTINUED)<br />
3. Significant accounting policies (continued)<br />
3.4 Property and equipment (continued)<br />
3.4.2 Measurement after recognition<br />
Equipment<br />
Subsequent to initial recognition, equipment, consisting principally of computer equipment, motor vehicles, fixtures and furniture, are<br />
stated at cost less accumulated depreciation and impairment losses.<br />
Property<br />
Property, whose fair values can be reliably measured, are stated at revalued amounts, being fair value at the date of revaluation less<br />
subsequent accumulated depreciation and accumulated impairment losses.<br />
Revaluations are performed with sufficient regularity such that the carrying amounts do not differ materially from those that would be<br />
determined using fair values at the reporting date. In the event of a material change in the market conditions between the valuation<br />
date and the reporting date an internal valuation is performed and adjustments made to reflect any material changes in value.<br />
An independent valuation of the <strong>Group</strong>’s land and buildings was performed during the current year to determine the fair value of land<br />
and buildings. The effective date of the revaluation was 31 December 2010. The revaluation of the <strong>Group</strong>’s properties has been done,<br />
where appropriate for the specific property being valued, with reference to one of the income capitalisation method or the depreciated<br />
replacement cost method.<br />
The fair value is dependent on the method of valuation and assumptions utilised by the independent valuator, being key sources of<br />
estimation uncertainty. The valuation methodology adopted is dependent upon the nature of the property. Income-generating assets are<br />
valued using discounted cash flows. Vacant land, land holdings and residential flats are valued according to sales of comparable properties.<br />
Near vacant properties are valued at land value less the estimated cost of demolition. Where neither of the income capitalisation method<br />
or sales value of comparable properties is available or reasonable, the depreciated replacement cost method is utilised.<br />
Significant assumptions used by the independent valuators under the income capitalisation method include a capitalisation rate of<br />
10.5%, rental income of N$85 per m2 and total expenditure being 15% of rental income. Where the depreciated cost method was<br />
appropriate a depreciation rate of between 20% to 65% was used depending on the specific property and the component of the<br />
building being evaluated.<br />
When an individual property is revalued, any increase in its carrying amount (as a result of the revaluation) is transferred to a revaluation<br />
reserve, except to the extent that it reverses a revaluation decrease of the same property previously recognised as an expense in profit<br />
or loss.<br />
When the value of an individual property is decreased as a result of a revaluation, the decrease is charged against any related credit<br />
balance in the revaluation reserve in respect of that property. However, to the extent that it exceeds any surplus, it is recognised as an<br />
expense in profit or loss.<br />
3.4.3 reclassifications of property and equipment<br />
Where properties are reclassified during the year from property and equipment to investment properties any revaluation gain arising<br />
is initially recognised in profit or loss to the extent of previously charged impairment losses. Any residual excess is taken to the<br />
revaluation reserve. Revaluation deficits are recognised in the revaluation reserve to the extent of previously recognised gains and any<br />
residual deficit is accounted for in profit or loss.<br />
Investment properties that are reclassified to owner-occupied property are revalued at the date of transfer, with any difference being<br />
taken to profit or loss.
3. Significant accounting policies (continued)<br />
3.4 Property and equipment (continued)<br />
3.4.4 Depreciation<br />
Each part of an item of property and equipment with a cost that is significant in relation to the total cost of the item is depreciated<br />
separately. The depreciable amounts of property and equipment are charged to profit or loss on a straight-line basis over the estimated<br />
useful lives of items of property and equipment, unless they are included in the carrying amount of another asset. Useful lives and<br />
residual values are assessed on an <strong>annual</strong> basis.<br />
In the case of owner-occupied property, on revaluation any accumulated depreciation at the date of the revaluation is eliminated<br />
against the gross carrying amount of the property concerned and the net amount restated to the revalued amount. Subsequent<br />
depreciation charges are adjusted based on the revalued amount for each property. Any difference between the depreciation charge<br />
on the revalued amount and that which would have been charged under historic cost is transferred net of any related deferred tax,<br />
between the revaluation reserve and retained earnings as the property is utilised.<br />
Land is not depreciated.<br />
The maximum estimated useful lives are as follows:<br />
Freehold land and buildings<br />
Years<br />
50<br />
Leasehold land and buildings 20<br />
Furniture, fittings and equipment 10<br />
computer equipment<br />
3.4.5 Derecognition<br />
5<br />
Items of property and equipment are derecognised on disposal or when no future economic benefits are expected from their use or<br />
disposal.<br />
On derecognition of a property or equipment, any gain or loss on disposal, determined as the difference between the net disposal<br />
proceeds and the carrying amount of the asset, is recognised in profit or loss in the period of the derecognition. In the case of property,<br />
any surplus in the revaluation reserve in respect of the individual property is transferred directly to other comprehensive income.<br />
compensation from third parties for items of property and equipment that were impaired, lost or given up is included in profit or loss<br />
when the compensation becomes receivable.<br />
3.5 Impairment of assets<br />
The <strong>Group</strong> assesses all assets, other than <strong>financial</strong> instruments, for indications of an impairment loss or the reversal of a previously<br />
recognised impairment at each reporting date. Should there be indications of impairment, the assets’ recoverable amounts are<br />
estimated. These impairments (where the carrying amount of an asset exceeds its recoverable amount) or the reversal of a previously<br />
recognised impairment are recognised in profit or loss for the year.<br />
Intangible assets not yet available for use are tested <strong>annual</strong>ly for impairment.<br />
The recoverable amount of an asset is the higher of its fair value less cost to sell and its value in use. The fair value less cost to sell is<br />
determined by ascertaining the current market value of an asset and deducting any costs related to the realisation of the asset.<br />
In assessing value in use, the expected future cash flows from the asset are discounted to their present value using a pre-tax discount<br />
rate that reflects current market assessments of the time value of money and the risks specific to the asset. For an asset whose cash<br />
flows are largely dependent on those of other assets, the recoverable amount is determined for the cash-generating unit to which the<br />
asset belongs.<br />
A previously recognised impairment loss will be reversed if the recoverable amount increases as a result of a change in the estimates<br />
used previously to determine the recoverable amount, but not to an amount higher than the carrying amount that would have been<br />
determined, net of depreciation or amortisation, had no impairment loss been recognised in prior periods.<br />
69
70<br />
NEDNAMIBIA HOLDINGS LIMItED ANNUAL REPORt 2010<br />
NOtES tO tHE CONSOLIDAtED<br />
ANNUAL FINANCIAL STATEMENTS<br />
FOR THE YEAR ENDED 31 DEcEmbER 2010 (cONTINUED)<br />
3. Significant accounting policies (continued)<br />
3.6 Leases<br />
The <strong>Group</strong> as lessee<br />
Leases where the lessor retains the risk and rewards of ownership of the underlying asset are classified as operating leases. Payments<br />
made under operating leases (net of any incentives received from the lessor) are recognised in the statement of comprehensive income<br />
on a straight-line basis over the term of the lease.<br />
The <strong>Group</strong> as lessor<br />
Rental income (net of any incentives given to lessees) from operating leases is recognised on a straight-line basis over the term of the<br />
relevant lease.<br />
Assets leased out under operating leases are included under property and equipment in the statement of <strong>financial</strong> position. Initial<br />
direct costs incurred in negotiating and arranging are added to the carrying amount of the leased asset and recognised as an expense<br />
over the lease term on the same basis as the rental income. Leased assets are depreciated over their expected useful lives on a basis<br />
consistent with similar assets.<br />
3.7 Taxation<br />
Income taxation on the profit or loss for the year comprises current and deferred taxation. Income taxation is recognised in profit or<br />
loss except to the extent that it relates to items recognised directly in equity, in which case it is recognised in equity.<br />
3.7.1 Deferred taxation<br />
Deferred taxation is provided based on temporary differences. Temporary differences are differences between the carrying amounts<br />
of assets and liabilities for <strong>financial</strong> reporting purposes and their tax base. The amount of deferred taxation provided is based on<br />
the expected manner of realisation or settlement of the carrying amount of assets and liabilities using taxation rates enacted or<br />
substantively enacted at the reporting date that are expected to be applied to temporary differences when they reverse.<br />
Deferred taxation is charged to profit or loss except to the extent that it relates to a transaction that is recognised directly in other<br />
comprehensive income. The effect on deferred taxation of any changes in taxation rates is recognised in profit or loss, except to the<br />
extent that it relates to items previously charged or credited directly to other comprehensive income.<br />
Deferred tax liabilities are generally recognised for all taxable temporary differences, and deferred tax assets are generally recognised<br />
for all deductible temporary differences to the extent that it is probable that taxable profits will be available against which those<br />
deductible temporary differences can be utilised. Deferred taxation is not recognised where the initial recognition of assets or liabilities<br />
in a transaction that is not a business combination affects neither accounting nor taxable profit.<br />
A deferred taxation asset is recognised to the extent that it is probable that future taxable income will be available against which the<br />
unutilised tax losses and deductible temporary differences can be used. Deferred taxation assets are reviewed at each reporting date<br />
and are reduced to the extent that it is no longer probable that the related taxation benefits will be realised.<br />
3.7.2 Direct and indirect taxation<br />
Direct taxation is the expected taxation payable on the taxable income for the year, as adjusted for items which are not taxable or<br />
disallowed, using taxation rates enacted or substantively enacted in Namibia at the reporting date, and any adjustment to taxation<br />
payable in respect of previous years.<br />
Indirect taxation includes value added taxation paid to central government and has been expensed in the statement of comprehensive<br />
income, to the extent that it has not been claimed under the value added taxation apportionment ratio.<br />
3.8 Foreign currency transactions<br />
Transactions in foreign currencies are converted into the functional currency at the spot rate of exchange ruling at the date of the<br />
transaction.<br />
monetary assets and liabilities in foreign currencies are translated into the functional currency of the <strong>Group</strong> at spot rates of exchange<br />
ruling at the reporting date.
3. Significant accounting policies (continued)<br />
3.8 Foreign currency transactions (continued)<br />
Non-monetary assets and liabilities denominated in foreign currencies that are stated at fair value are translated into the functional<br />
currency of the <strong>Group</strong> at foreign exchange rates ruling at the date fair value is determined. Non-monetary assets and liabilities<br />
denominated in foreign currencies, which are stated at cost, are converted into the functional currency of the <strong>Group</strong> at the rate of<br />
exchange ruling at the date of the initial recognition and are not subsequently retranslated.<br />
Exchange gains and losses on the translation and settlement during the year of foreign currency monetary assets and liabilities are<br />
recognised in the statement of comprehensive income.<br />
Exchange differences for non-monetary items, for example equity instruments, are recognised in equity when the change in the fair<br />
value of the non-monetary item is recognised in other comprehensive income, and in profit or loss if the change in fair value of the<br />
non-monetary item is recognised in profit or loss.<br />
Non-monetary assets and liabilities denominated in foreign currencies that are stated at cost are recorded in the functional currency<br />
at the spot rate of exchange at the date of the initial recognition and are not subsequently retranslated.<br />
3.9 Properties in possession<br />
Unsold properties in possession are stated at the lower of the net outstanding amount at date of purchase and net realisable value.<br />
3.10 Employee benefits<br />
Short-term employee benefits<br />
Short-term employee benefit obligations are measured on an undiscounted basis and are expensed as the related service is provided.<br />
Defined contribution plan<br />
A defined contribution plan has been established for eligible employees of the <strong>Group</strong>, with assets held in separate trustee-administered<br />
funds.<br />
contributions in respect of defined contribution pension schemes are recognised as an expense in profit or loss as incurred.<br />
Post-retirement medical benefits<br />
The <strong>Group</strong> provides post-retirement medical benefits to eligible employees. Non-pension post-retirement benefits are accounted for<br />
according to their nature, either as defined contribution or defined benefit plans. The expected costs of post-retirement benefits that<br />
are defined benefit plans are accounted for in accordance with IAS 19: Employee benefits.<br />
The projected unit credit method is used to determine the defined benefit obligations based on actuarial assessments, which incorporate<br />
not only the post-retirement benefit obligations known on the reporting date, but also information relevant to their expected future<br />
development. The expected costs of post-retirement benefits are accrued over the period of employment and are determined by<br />
independent qualified actuaries. Actuarial gains and losses and service costs are immediately realised in profit and loss when incurred<br />
or received.<br />
3.11 Provisions<br />
Provisions are recognised when the <strong>Group</strong> has a present legal or constructive obligation as a result of past events, for which it is<br />
probable that an outflow of economic benefits will occur and where a reliable estimate can be made of the amount of the obligation.<br />
The amount recognised as a provision is the reasonable estimate of the expenditure required to settle the obligation at the reporting date.<br />
Where the effect of discounting is material, provisions are discounted. The discount rate reflects current market assessments of the time<br />
value of money and, where appropriate, the risks specific to the liability. Gains from the expected disposal of assets are not taken into<br />
account in measuring provisions. Provisions are reviewed at each reporting date and adjusted to reflect the current reasonable estimate. If<br />
it is no longer probable that an outflow of resources will be required to settle the obligation, the provision is reversed.<br />
71
72<br />
NEDNAMIBIA HOLDINGS LIMItED ANNUAL REPORt 2010<br />
NOtES tO tHE CONSOLIDAtED<br />
ANNUAL FINANCIAL STATEMENTS<br />
FOR THE YEAR ENDED 31 DEcEmbER 2010 (cONTINUED)<br />
3. Significant accounting policies (continued)<br />
3.12 Contingent liabilities<br />
The <strong>Group</strong> discloses a contingent liability where:<br />
– it is a possible obligation arising from past events, the existence of which will be confirmed only by the occurrence or non-occurrence<br />
of one or more uncertain future events not wholly within the control of the enterprise; or<br />
– it is not probable that an outflow of resources will be required to settle an obligation; or<br />
– the amount of the obligation cannot be measured with sufficient reliability.<br />
3.13 Borrowing costs<br />
borrowing costs directly attributable to the acquisition, construction and production of qualifying assets are capitalised as part of the<br />
costs of these assets. Qualifying assets are assets that necessarily take a substantial period of time to prepare for their intended use or<br />
sale. capitalisation of borrowing costs continues up to the date when the assets are substantially ready for their use or sale.<br />
All other borrowing costs are expensed in the period in which they are incurred.<br />
Interest expense is recognised in profit or loss using the effective interest method taking into account the expected timing and amount<br />
of cash flows. Interest expense includes the amortisation of any discount or premium or other differences between the initial carrying<br />
amount of an interest-bearing instrument and its amount at maturity calculated on an effective interest rate basis.<br />
3.14 Computer software and development cost<br />
Expenditure on research activities undertaken with the prospect of gaining new technical knowledge are recognised in the statement<br />
of comprehensive income as an expense incurred.<br />
Expenditure on computer software and other development activities, whereby set procedures and processes are applied to a project for<br />
the production of new or substantially improved products and processes, is capitalised if the computer software and other development<br />
products or processes are technically and commercially feasible and the <strong>Group</strong> has sufficient resources to complete development.<br />
The expenditure capitalised includes cost of materials, and directly attributable staff and other costs. computer development<br />
expenditure is amortised only once the relevant software has been commissioned. capitalised software is stated at cost, less<br />
accumulated amortisation and impairment losses. computer development expenditure, which has not yet been commissioned, is<br />
stated at cost less impairment losses.<br />
Amortisation on computer software and development costs is charged to the statement of comprehensive income on a straight-line<br />
basis over the estimated useful lives of these assets, not exceeding five years.<br />
Subsequent expenditure relating to computer software is capitalised only when it is probable that future economic benefits from the<br />
use of assets will increase beyond its original assessed standard of performance. All other subsequent expenditure is recognised as an<br />
expense in the period in which it is incurred. Surpluses or deficits on the disposal of computer software are recognised in the statement<br />
of comprehensive income. The surplus or deficit is the difference between the net disposal proceeds and the carrying amount of the<br />
asset.<br />
3.15 revenue recognition<br />
Revenue relates to banking activities and comprises net income from funds, dividends from investments, fees and commissions from<br />
grouping and related transactions and net income from exchange dealings.<br />
Revenue is shown net of value added tax.<br />
Interest income<br />
Interest income is recognised in profit or loss using the effective interest method taking into account the expected timing and amount<br />
of cash flows. The effective interest method is a method of calculating the amortised cost of a <strong>financial</strong> asset and of allocating the<br />
interest income over the relevant period. Interest income includes the amortisation of any discount or premium or other differences<br />
between the initial carrying amount of an interest-bearing instrument and its amount at maturity calculated on an effective interest<br />
rate basis.
3. Significant accounting policies (continued)<br />
3.15 revenue recognition (continued)<br />
Non-interest revenue<br />
Dividend income<br />
Dividend income from investments is recognised when the shareholder’s rights to receive payment have been established on the exdividend<br />
date for equity instruments and is included in dividend income.<br />
Fees and commissions<br />
Fees and commissions are generally recognised on an accrual basis when the service has been provided, such as loan syndication fees.<br />
Income earned from the provision of services is recognised as the service is rendered by reference to the stage of completion of the<br />
service.<br />
Loan origination fees for loans that are probable of being drawn down, are deferred (together with related direct costs) and recognised<br />
as an adjustment to the effective interest rate on the advance.<br />
commission and fees arising from negotiating, or participating in the negotiation of a transaction for a third party, such as the<br />
acquisition of loans, shares or other securities or the purchase or sale of businesses, are recognised on completion of the underlying<br />
transaction, unless it forms an integral part of the effective interest rate of the underlying <strong>financial</strong> instruments.<br />
Foreign exchange gains and losses<br />
Foreign exchange gains and losses on monetary items arising from foreign currency transactions that have not been settled at the<br />
reporting date are recognised in income in the year in which the exchange rate movement occurred. The premium or discount on<br />
forward exchange contracts is amortised to income over the term of the forward exchange contract.<br />
Rental income<br />
The <strong>Group</strong>’s policy for recognition of revenue from operating leases is described in 3.6 above.<br />
Other<br />
Revenue other than interest, fees and commission, which includes exchange and securities trading income, dividends from investments<br />
and net gains on the sale of investment banking assets, is recognised in profit or loss when the amount of revenue from the transaction<br />
or service can be measured reliably, it is probable that the economic benefits of the transaction or service will flow to the <strong>Group</strong> and<br />
the costs associated with the transaction or service can be measured reliably.<br />
Fair value gains or losses on <strong>financial</strong> instruments at fair value through profit or loss, including derivatives, are included in non-interest<br />
revenue. These fair value gains or losses are determined after deducting the interest component, which is recognised separately in<br />
interest income and expense.<br />
Gains or losses on derecognition of any <strong>financial</strong> assets or <strong>financial</strong> liabilities are included in non-interest revenue.<br />
3.16 Share-based payments<br />
Equity-settled share-based payment transactions<br />
The services received in an equity-settled share-based payment transaction with employees are measured at the fair value of the<br />
equity instruments granted. The fair value of those equity instruments is measured at grant date.<br />
If the equity instruments granted vest immediately and the employee is not required to complete a specified period of service before<br />
becoming unconditionally entitled to those instruments, the services received are recognised in full on grant date in profit or loss for<br />
the period, with a corresponding increase in other comprehensive income.<br />
Where the equity instruments do not vest until the employee has completed a specified period of service, it is assumed that the<br />
services rendered by the employee, as consideration for those equity instruments, will be received in the future during the vesting<br />
period. These services are accounted for in profit or loss as they are rendered during the vesting period, with a corresponding increase<br />
in other comprehensive income. Share-based payment expenses are adjusted for non-market-related performance conditions.<br />
73
74<br />
NEDNAMIBIA HOLDINGS LIMItED ANNUAL REPORt 2010<br />
NOtES tO tHE CONSOLIDAtED<br />
ANNUAL FINANCIAL STATEMENTS<br />
FOR THE YEAR ENDED 31 DEcEmbER 2010 (cONTINUED)<br />
3. Significant accounting policies (continued)<br />
3.16 Share-based payments (continued)<br />
Equity-settled share-based payment transactions (continued)<br />
Where the equity instruments are no longer outstanding, the accumulated share-based payment reserve in respect of those equity<br />
instruments is transferred to retained earnings.<br />
Cash-settled share-based payment transactions with employees<br />
The services received in cash-settled share-based payment transactions with employees and the liability to pay for those services, are<br />
recognised at fair value as the employee renders services. Until the liability is settled, the fair value of the liability is re-measured at<br />
each reporting date and at the date of settlement, with any changes in fair value recognised in profit or loss for the year. Where the<br />
equity instruments do not vest until the employee has completed a specified period of service, it is assumed that the services rendered<br />
by the employee, as consideration for those equity instruments, will be received in the future during the vesting period. These services<br />
are accounted for in profit or loss as they are rendered during the vesting period, with a corresponding increase in the liability. Sharebased<br />
payment expenses are adjusted for non-market-related performance conditions.<br />
Measurement of fair value of equity instruments granted<br />
The equity instruments granted by <strong>Nedbank</strong> <strong>Group</strong> <strong>Limited</strong> are measured at fair value at measurement date using standard option<br />
pricing valuation models. The valuation technique is consistent with generally accepted valuation methodologies for pricing <strong>financial</strong><br />
instruments, and incorporates all factors and assumptions that knowledgeable, willing market participants would consider in setting<br />
the price of the equity instruments. Vesting conditions, other than market conditions, are not taken into account in determining fair<br />
value. Vesting conditions are taken into account by adjusting the number of equity instruments included in the measurement of the<br />
transaction amount.<br />
Share-based payments with persons or entities other than employees<br />
The transactions in which equity instruments are issued to historically disadvantaged individuals and organisations in Namibia are<br />
accounted for as share-based payments. Where <strong>Nedbank</strong> <strong>Group</strong> <strong>Limited</strong> has issued such shares and expects to receive services in return<br />
for equity instruments, the share-based payments charge is spread over the relating vesting (i.e. service) period of these instruments.<br />
In instances where such goods and services could not be identified the cost has been expensed with immediate effect. The valuation<br />
techniques are consistent with those mentioned above.<br />
3.17 Cash and cash equivalents<br />
cash and cash equivalents comprise balances with less than 90 days maturity from the date of acquisition including: cash and balances<br />
with central banks, treasury bills and other eligible bills, amounts due from other banks and trading securities.<br />
3.18 Share capital<br />
Ordinary share capital, preference share capital or any <strong>financial</strong> instrument issued by the <strong>Group</strong> is classified as equity when:<br />
– payment of cash, in the form of a dividend or redemption, is at the discretion of the <strong>Group</strong>;<br />
– the instrument does not provide for the exchange of <strong>financial</strong> instruments under conditions that are potentially unfavourable to<br />
the <strong>Group</strong>;<br />
– settlement in the <strong>Group</strong>’s own equity instruments is for a fixed number of equity instruments at a fixed price; and<br />
– the instrument represents a residual interest in the assets of the <strong>Group</strong> after deducting all of its liabilities.<br />
The <strong>Group</strong>’s ordinary and preference share capital is classified as equity.<br />
Share capital issued by the <strong>Group</strong> is recorded at the proceeds received, less incremental directly attributable issue costs (net of any<br />
related income tax benefit).<br />
Dividends are recognised as distributions within equity in the period in which they are approved by the shareholders. Dividends for the<br />
year that are declared after the reporting date are disclosed in note 35.
3. Significant accounting policies (continued)<br />
3.19 Non-current assets held for sale<br />
Non-current assets and disposal groups are classified as held-for-sale if their carrying amount will be recovered principally through the<br />
sale transaction rather than through continuing use.<br />
This condition is regarded as met only when the sale is highly probable and the asset (or disposal group) is available for immediate sale<br />
in its present condition. management must be committed to the sale, which should be expected to qualify as a complete sale within<br />
one year from the date of classification. An active programme to find a buyer should be in place with appropriate level of management<br />
approving the sale.<br />
Immediately before classification as held-for-sale, all assets are remeasured in accordance with the <strong>Group</strong>’s accounting policies.<br />
Non-current assets (or disposal groups) held for sale are measured at the lower of carrying amount and fair value less incremental<br />
directly attributable cost to sell (excluding taxation and finance charges) and are not depreciated. Gains or losses recognised on initial<br />
classification as held-for-sale and subsequent remeasurements are recognised in profit or loss, regardless of whether the assets were<br />
previously measured at revalued amounts. The maximum gains that can be recognised are the cumulative impairment losses previously<br />
recognised in profit or loss. A disposal group continues to be consolidated while held for sale. Income and expenses continue to be<br />
recognised, however, assets are not depreciated or amortised. Non-current assets (or disposal groups) are reclassified from held-forsale<br />
to held-for-use if they no longer meet the held-for-sale criteria. On reclassification, the non-current asset (or disposal group)<br />
is remeasured at the lower of its recoverable amount and the carrying amount that would have been recognised had the asset (or<br />
disposal group) never been classified as held-for-sale.<br />
Any gains or losses are recognised in profit or loss, unless the asset was carried at a revalued amount prior to classification as held-forsale.<br />
Gains or losses on such assets are recognised as revaluation increases or decreases.<br />
3.20 Policyholders’ fund<br />
The policyholders’ fund represents net revenue from life business for the current year as a reserve against future claims.<br />
The policyholders’ fund provision has been computed using a gross premium valuation method. Provision has been made in accordance<br />
with the Financial Soundness Valuation basis as set out in the guidelines issued by the Actuarial Society of South Africa in Prudential<br />
Guidance Note (PGN) 104 (2001). Under this guideline, provisions are valued using realistic expectations of future experience.<br />
3.21 Policyholder insurance contracts<br />
Professional Guidance Notes (“PGNs”) issued by the Actuarial Society of South Africa (“ASSA”)<br />
NedNamibia Life Assurance company <strong>Limited</strong> is licensed as a long-term insurer in Namibia in accordance with the Long-Term<br />
Insurance Act of 1998 as amended (“LTIA”). The LTIA requires the determination of assets, liabilities and capital adequacy requirements<br />
for statutory purposes in accordance with PGNs issued by ASSA.<br />
In terms of IFRS 4: Insurance contracts, defined insurance liabilities are allowed to be measured under existing local practice. The <strong>Group</strong><br />
has adopted the PGNs to determine the liability in respect of insurance contracts issued in Namibia.<br />
The following PGNs are of relevance to the determination of policyholder liabilities:<br />
PGN 102: Life offices – HIV/AIDS<br />
PGN 103: Report by the Statutory Actuary in the <strong>annual</strong> <strong>financial</strong> <strong>statements</strong> of South African Longterm Insurers<br />
PGN 104: Life Offices – Valuation of Long-Term Insurers<br />
PGN 105: Recommended AIDS extra mortality bases<br />
PGN 106: Actuaries and Long-Term Insurance in South Africa<br />
PGN 110: Reserving for minimum investment return guarantees<br />
75
76<br />
NEDNAMIBIA HOLDINGS LIMItED ANNUAL REPORt 2010<br />
NOtES tO tHE CONSOLIDAtED<br />
ANNUAL FINANCIAL STATEMENTS<br />
FOR THE YEAR ENDED 31 DEcEmbER 2010 (cONTINUED)<br />
3. Significant accounting policies (continued)<br />
3.21 Policyholder insurance contracts (continued)<br />
Insurance contracts classification<br />
The <strong>Group</strong> issues contracts that transfer insurance risk or <strong>financial</strong> risk or, in some cases, both.<br />
An insurance contract is a contract under which the <strong>Group</strong> (“insurer”) accepts significant insurance risk from the policyholder by agreeing<br />
to compensate the policyholder if a specified uncertain future event (“the insured event”) adversely affects the policyholder. Such<br />
contracts may also transfer <strong>financial</strong> risk. The <strong>Group</strong> defines significant insurance risk as the possibility of having to pay benefits on the<br />
occurrence of an insured event that are significantly more than the benefits payable if the insured event did not occur.<br />
Insurance contracts measurement<br />
These contracts are valued in terms of the Financial Soundness Valuation (“FSV”) basis, on a gross premium valuation methodology,<br />
described in PGN 104 and the liability is reflected as Policyholder liabilities under insurance contracts.<br />
The liability is based on assumptions of the best estimate of future experience, plus compulsory margins for prudent liabilities as required<br />
in terms of PGN 104.<br />
The liability assumptions are reviewed <strong>annual</strong>ly. Any changes in assumptions and/or other changes to the liability calculation are reflected<br />
in the statement of comprehensive income as they occur.<br />
Outstanding claims provision<br />
Provision is made in the policyholder liabilities under insurance contracts for the estimated cost of claims outstanding at the end of the<br />
year.<br />
Liability adequacy test<br />
At each reporting date, liability adequacy tests are performed to ensure the adequacy of the insurance contract liabilities net of related<br />
intangible present value of acquired in-force business assets. The liability is calculated in terms of the FSV basis described in PGN 104. The<br />
FSV basis meets the minimum requirement of liability adequacy test.<br />
Acquisition costs<br />
Acquisition costs for insurance contracts represent commission that relate to the securing of new contracts.<br />
The FSV method for valuing insurance contracts makes explicit allowance for the deferral of acquisition costs and hence no explicit<br />
deferred acquisition cost asset is recognised in the statement of <strong>financial</strong> position for insurance contracts.
4. Cash and balances with central bank<br />
Financial assets classification: At fair value through profit and loss – held for trading<br />
2010 2009<br />
N$’000 N$’000<br />
bank notes and coins 79,044 77,702<br />
balances with central bank 56,634 52,139<br />
Included under cash and balances with central bank are mandatory reserve deposits with bank<br />
of Namibia of N$56 million (2009: N$52 million).<br />
5. Due from other banks<br />
Financial assets classification: Loans and receivables<br />
135,678 129,841<br />
Placements with other banks 605,101 440,238<br />
6. other short-term securities<br />
Financial assets classification: At fair value through profit and loss – held for trading<br />
6.1 Investment portfolio<br />
Negotiable certificates of deposit 342,068 157,223<br />
6.2 Expected maturity structure<br />
One year or less 174,834 61,701<br />
Five years or less but over one year 167,234 95,522<br />
6.3 Valuation<br />
The estimation of the fair value of the negotiable certificates of deposit has proven to be<br />
reasonably close to the carrying value of such instruments.<br />
7. Derivative <strong>financial</strong> instruments<br />
Financial assets classification: At fair value through profit and loss – held for trading<br />
342,068 157,223<br />
These transactions have been entered into in the normal course of business and no material losses are anticipated other than<br />
those for which provision has been made in the statement of comprehensive income. There are no commitments or contingent<br />
commitments under derivative instruments that are settled otherwise than with cash. The principal types of derivative contracts<br />
into which the <strong>Group</strong> enters are described below:<br />
Swaps<br />
These are over-the-counter (“OTc”) agreements between two parties to exchange periodic payments of interest, or payment for<br />
the change in value of a commodity, or related index, over a set period based on notional principal amounts. The <strong>Group</strong> enters<br />
into swap transactions in several markets. Interest rate swaps exchange fixed rates for floating rates of interest based on notional<br />
amounts. basis swaps exchange floating or fixed interest calculated using different bases. cross currency swaps are the exchange of<br />
interest based on notional values of different currencies.<br />
Forwards<br />
Forward contracts are OTc agreements and are principally dealt in by the <strong>Group</strong> in interest rates as forward rate agreements and in<br />
currency as forward foreign exchange contracts.<br />
77
78<br />
NEDNAMIBIA HOLDINGS LIMItED ANNUAL REPORt 2010<br />
NOtES tO tHE CONSOLIDAtED<br />
ANNUAL FINANCIAL STATEMENTS<br />
FOR THE YEAR ENDED 31 DEcEmbER 2010 (cONTINUED)<br />
7. Derivative <strong>financial</strong> instruments (continued)<br />
2010 2009<br />
N$’000 N$’000<br />
7.1 Total carrying amount of derivative <strong>financial</strong> instruments<br />
Gross carrying amount of assets 9,200 3,782<br />
Gross carrying amount of liabilities (8,864) (3,786)<br />
Net carrying amount 336 (4)<br />
A detailed breakdown of the carrying amount, notional principal and fair value of the various types of derivative <strong>financial</strong> instruments held by the<br />
<strong>Group</strong> is presented in the following tables.<br />
7.2 Notional principal of derivative <strong>financial</strong> instruments<br />
This represents the gross notional amounts of all outstanding contracts at year-end for the <strong>Group</strong>. This gross notional amount is the sum of the<br />
absolute amount of all purchases and sales of derivative instruments. The notional amounts do not represent amounts exchanged by the parties<br />
and therefore represent only the measure of involvement by the <strong>Group</strong> in derivative contracts and not its exposure to market or credit risks arising<br />
from such contracts. The amounts actually exchanged are calculated on the basis of the notional amounts and other terms of the derivative, which<br />
relate to interest rates, exchange rates, securities’ prices or <strong>financial</strong> and other indices.<br />
2010<br />
N$’000<br />
Notional<br />
Principal<br />
2010<br />
N$’000<br />
Positive<br />
Value<br />
2010<br />
N$’000<br />
Negative<br />
Value<br />
Exchange rate contracts<br />
Forwards 101,087 9,200 8,864<br />
Spot – – –<br />
101,087 9,200 8,864<br />
Interest rate contracts<br />
Interest rate swaps – – –<br />
101,087 9,200 8,864<br />
2009<br />
N$’000<br />
Notional<br />
Principal<br />
2009<br />
N$’000<br />
Positive<br />
Value<br />
2009<br />
N$’000<br />
Negative<br />
Value<br />
Exchange rate contracts<br />
Forwards 125,167 3,763 3,697<br />
Spot 322,722 19 4<br />
447,889 3,782 3,701<br />
Interest rate contracts<br />
Interest rate swaps 11,194 – 85<br />
459,083 3,782 3,786<br />
7.3 Carrying amount of derivative <strong>financial</strong> instruments<br />
The amounts disclosed represent the value of all derivative instruments held at 31 December 2010. The fair value of a derivative <strong>financial</strong><br />
instrument is the amount at which it could be exchanged in a current transaction between willing parties, other than a forced liquidation or sale.<br />
Fair values are obtained from quoted market prices, discounted cash flow models and market-accepted option-pricing models.
7. Derivative <strong>financial</strong> instruments (continued)<br />
N$’000<br />
Exchange<br />
rate<br />
contracts<br />
N$’000<br />
Interest<br />
rate<br />
contracts<br />
N$’000<br />
Total<br />
7.4 Analysis of derivative <strong>financial</strong> instruments<br />
Positive fair value of derivatives<br />
2010<br />
Maturity analysis<br />
Under one year 9,200 – 9,200<br />
One to five years – – –<br />
9,200 – 9,200<br />
2009<br />
Maturity analysis<br />
Under one year 2,559 – 2,559<br />
One to five years 1,223 – 1,223<br />
3,782 – 3,782<br />
Negative fair value of derivatives<br />
2010<br />
Maturity analysis<br />
Under one year 8,864 – 8,864<br />
One to five years – – –<br />
8,864 – 8,864<br />
2009<br />
Maturity analysis<br />
Under one year 2,620 – 2,620<br />
One to five years 1,081 85 1,166<br />
3,701 85 3,786<br />
Notional principal of derivatives<br />
2010<br />
Maturity analysis<br />
Under one year 101,087 – 101,087<br />
One to five years – – –<br />
101,087 – 101,087<br />
2009<br />
Maturity analysis<br />
Under one year 421,676 – 421,676<br />
One to five years 26,213 11,194 37,407<br />
447,889 11,194 459,083<br />
79
80<br />
NEDNAMIBIA HOLDINGS LIMItED ANNUAL REPORt 2010<br />
NOtES tO tHE CONSOLIDAtED<br />
ANNUAL FINANCIAL STATEMENTS<br />
FOR THE YEAR ENDED 31 DEcEmbER 2010 (cONTINUED)<br />
8. Government and public sector securities<br />
Financial assets classification: At fair value through profit and loss – held for trading<br />
8.1 Investment portfolio<br />
2010 2009<br />
N$’000 N$’000<br />
Treasury bills 447,923 419,793<br />
Government registered stock 35,339 19,744<br />
Other public sector securities 23,287 59,766<br />
8.2 Expected maturity structure<br />
506,549 499,303<br />
One year or less 447,923 434,919<br />
Five years or less but over one year 9,193 3,249<br />
Over five years 49,433 61,135<br />
8.3 Valuation<br />
506,549 499,303<br />
Unlisted<br />
– book value 506,950 504,012<br />
– market valuation 506,549 499,303<br />
Treasury bills with a maturity value of N$340 million (2009: N$345 million) have been encumbered to secure the current account with the bank<br />
of Namibia. No government registered stock or other public sector securities (2009: Nil) have been encumbered in 2010.<br />
banking institutions may overdraw their current account against certain pledged eligible securities to cover possible shortages. Overdrafts are<br />
limited to 90% of the maturity or redemption value of the securities pledged. Daily interest is charged at the prevailing repo rate on the amount<br />
received from the bank of Namibia (90% of the maturity value).<br />
9. Loans and advances to customers<br />
Financial assets classification: Loans and receivables<br />
9.1 Category analysis<br />
Home loans 2,211,822 1,911,264<br />
Other loans and overdrafts 1,784,066 1,855,346<br />
Preference share finance 41,750 41,750<br />
Leases and instalment debtors 978,128 999,371<br />
Less: Unearned finance charges on leases and instalment debtors (127,087) (208,169)<br />
micro-loans 351,591 322,594<br />
5,240,270 4,922,156<br />
Impairment of advances (note 30) (70,543) (75,797)<br />
5,169,727 4,846,359
9. Loans and advances to customers (continued)<br />
9.2 Sectoral analysis<br />
2010 2009<br />
N$’000 N$’000<br />
Individuals 3,354,827 2,745,561<br />
manufacturing 131,539 162,529<br />
Wholesale and trade 52,228 52,672<br />
Retailers, catering and accommodation 118,790 117,702<br />
Agriculture, hunting, forestry and fishing 349,130 421,180<br />
mining and quarrying 51,502 284,904<br />
Financial services, insurances and real estates 483,285 377,309<br />
Government and public sector 209,883 81,129<br />
building and property development 117,795 90,768<br />
Transport, storage and communication 97,781 106,323<br />
Other services 273,510 482,079<br />
9.3 Expected maturity structure<br />
5,240,270 4,922,156<br />
Less than three months but not repayable on demand or at short-term notice 759,679 468,471<br />
One year or less but over three months 499,240 425,212<br />
Five years or less but over one year 1,862,937 2,170,141<br />
Over five years 2,118,414 1,858,332<br />
9.4 Geographical analysis<br />
5,240,270 4,922,156<br />
Namibia 5,240,270 4,922,156<br />
9.5 Non-performing advances<br />
9.5.1 Category analysis (included under note 9.1)<br />
Home loans 43,531 42,166<br />
Other loans and overdrafts 26,570 36,865<br />
Net leases and instalment debtors 5,061 7,891<br />
micro-loans 18,241 19,581<br />
9.5.2 Sectoral analysis (included under note 9.2)<br />
93,403 106,503<br />
Individuals 71,118 81,093<br />
manufacturing 3,570 4,070<br />
Wholesale and trade 1,319 1,504<br />
Retailers, catering and accommodation 1,316 1,501<br />
Agriculture, hunting, forestry and fishing 2,247 2,562<br />
mining and quarrying 348 397<br />
Financial services, insurances and real estates 8,594 9,799<br />
Government and public sector – –<br />
building and property development 1,657 1,889<br />
Transport, storage and communication 2,250 2,566<br />
Other services 984 1,122<br />
93,403 106,503<br />
81
82<br />
NEDNAMIBIA HOLDINGS LIMItED ANNUAL REPORt 2010<br />
NOtES tO tHE CONSOLIDAtED<br />
ANNUAL FINANCIAL STATEMENTS<br />
FOR THE YEAR ENDED 31 DEcEmbER 2010 (cONTINUED)<br />
2010 2009<br />
N$’000 N$’000<br />
10. other assets<br />
Financial assets classification: Loans and receivables 122,146 116,122<br />
Remittances in transit 90,022 58,602<br />
Zero coupon bonds – 32,389<br />
Sundry debtors and other accounts 32,124 25,131<br />
Non-<strong>financial</strong> instruments 34,688 23,599<br />
Deferred staff compensation 5,413 8,387<br />
Prepayments 1,820 2,251<br />
Taxation 26,523 9,544<br />
Deferred taxation asset 932 3,417<br />
156,834 139,721<br />
11. Investment in subsidiaries, associates, joint venture and listed investments<br />
Investment in associates 3,192 2,431<br />
– carrying value at beginning of the year 2,431 5,168<br />
– Repayment of share premium – (3,000)<br />
– Share of associate’s profit 761 263<br />
Listed investments 27,945 27,164<br />
31,137 29,595<br />
Market valuation 31,137 29,595<br />
Nature of<br />
business<br />
Issued<br />
ordinary<br />
share capital<br />
2010<br />
‘000<br />
2009<br />
‘000<br />
Proportion<br />
held<br />
2010<br />
%<br />
2009<br />
%<br />
2010<br />
N$’000<br />
Shares<br />
at cost<br />
2009<br />
N$’000<br />
Aggregate<br />
profits<br />
after tax<br />
of subsidiary<br />
2010<br />
N$’000<br />
2009<br />
N$’000<br />
Subsidiary companies<br />
cbN Nominees (Proprietary) Dormant<br />
<strong>Limited</strong><br />
company – – 100 100 – – – –<br />
NedLoans (Proprietary) <strong>Limited</strong> Administration<br />
company – – 80 80 2,250 2,250 674 4,572<br />
Ten Kaiser Wilhelm Strasse Property<br />
(Proprietary) <strong>Limited</strong><br />
company 582 582 50 50 291 291 (193) 470<br />
Walvis bay Land Syndicate Property<br />
(Proprietary) <strong>Limited</strong><br />
company 3,000 3,000 50 50 1,500 1,500 909 676<br />
The directors value the investments in the subsidiary companies at cost.
11. Investment in subsidiaries, associates, joint venture and listed investments (continued)<br />
The <strong>Group</strong> has control over <strong>financial</strong> and operational decisions in both Ten Kaiser Wilhelm Strasse (Proprietary) <strong>Limited</strong> and Walvis bay Land<br />
Syndicate (Proprietary) <strong>Limited</strong> by means of majority representation on the board of directors of these companies.<br />
Issued ordinary<br />
share capital Proportion held Shares at cost<br />
Indebtedness<br />
by associate<br />
Nature of 2010 2009 2010 2009 2010 2009 2010 2009<br />
Associate<br />
business ‘000 ‘000 % % N$’000 N$’000 N$’000 N$’000<br />
Namclear (Proprietary) <strong>Limited</strong> clearing agent 16 16 25 25 1 162 1 162 – –<br />
Summarised <strong>financial</strong> information in respect of Namclear (Proprietary) <strong>Limited</strong>: 31 December 31 December<br />
2010 2009<br />
N$’000 N$’000<br />
Total assets 18,876 16,429<br />
Total liabilities 6,109 6,704<br />
Net assets 12,767 9,725<br />
bank’s share of associate’s net assets 3,192 2,431<br />
Total revenue 17,498 16,696<br />
Total profit for the year 3,185 4,068<br />
Share of associate’s profit for the year 796 1,017<br />
Less previous year’s losses not consolidated - (754)<br />
Share of associate’s profit 796 263<br />
Issued ordinary<br />
share capital<br />
Proportion<br />
held<br />
Shares at<br />
cost<br />
Indebtedness<br />
by joint venture<br />
Nature of 2010 2009 2010 2009 2010 2009 2010 2009<br />
Joint ventures business ‘000 ‘000 % % N$’000 N$’000 N$’000 N$’000<br />
NamPost Finance – – – 50 – – – 448<br />
Financial brokers services<br />
(Proprietary)<br />
<strong>Limited</strong><br />
broker<br />
Indebtedness does not include loans and advances paid in the normal course of business. These amounts were included in advances.<br />
The interest in NamPost Financial brokers (Proprietary) <strong>Limited</strong> was sold effective at 1 January 2010.<br />
Listed<br />
investments<br />
Nature of<br />
business<br />
Issued ordinary<br />
share capital<br />
2010<br />
‘000<br />
2009<br />
‘000<br />
2010<br />
%<br />
Proportion<br />
held Shares at cost Fair value of shares<br />
2009<br />
%<br />
2010<br />
N$’000<br />
2009<br />
N$’000<br />
2010<br />
N$’000<br />
2009<br />
N$’000<br />
<strong>Nedbank</strong> <strong>Group</strong> banking 172 172 0.02 0.02 20,966 20,966 27,945 27,164<br />
<strong>Limited</strong><br />
The shares in <strong>Nedbank</strong> <strong>Group</strong> <strong>Limited</strong> are held by the bEE trusts, which are consolidated on <strong>Group</strong> level.<br />
83
84<br />
NEDNAMIBIA HOLDINGS LIMItED ANNUAL REPORt 2010<br />
NOtES tO tHE CONSOLIDAtED<br />
ANNUAL FINANCIAL STATEMENTS<br />
FOR THE YEAR ENDED 31 DEcEmbER 2010 (cONTINUED)<br />
12. Property and equipment<br />
2010<br />
Freehold Freehold Leasehold<br />
Furniture,<br />
fittings and computer<br />
land buildings buildings equipment hardware Total<br />
N$’000 N$’000 N$’000 N$’000 N$’000 N$’000<br />
carrying amount at 1 January 2010 10,702 75,037 – 29,816 11,913 127,468<br />
– at cost/revaluation 10,702 79,047 1,500 62,729 36,892 190,870<br />
– accumulated depreciation – (4,010) (1,500) (32,913) (24,979) (63,402)<br />
Additions at cost – – – 12,704 3,213 15,917<br />
Revaluation 3,798 3,256 – – – 7,054<br />
cost<br />
Accumulated depreciation eliminated on<br />
revaluation<br />
3,798<br />
–<br />
(2,841)<br />
6,097<br />
–<br />
–<br />
–<br />
–<br />
–<br />
–<br />
957<br />
6,097<br />
2009<br />
Disposals at net book value – – – (275) (274) (549)<br />
Disposals at cost – – – (470) (285) (755)<br />
Accumulated depreciation of disposals – – – 195 11 206<br />
Depreciation for the year – (2,087) – (6,996) (4,417) (13,500)<br />
carrying amount at 31 December 2010 14,500 76,206 – 35,249 10,435 136,390<br />
– at cost/revaluation 14,500 76,206 1,500 74,963 39,820 206,989<br />
– accumulated depreciation – – (1,500) (39,714) (29,385) (70,599)<br />
carrying amount at 1 January 2009 10,702 76,735 – 33,167 14,460 135,064<br />
– at cost/revaluation 10,702 79,047 1,500 60,446 35,023 186,718<br />
– accumulated depreciation – (2,312) (1,500) (27,279) (20,563) (51,654)<br />
Additions at cost – – – 2,358 1,875 4,233<br />
Revaluation – – – – – –<br />
cost<br />
Accumulated depreciation eliminated on<br />
revaluation<br />
–<br />
–<br />
–<br />
–<br />
–<br />
–<br />
–<br />
–<br />
–<br />
–<br />
–<br />
–<br />
Disposals at net book value – – – (75) (6) (81)<br />
Disposals at cost – – – (75) (6) (81)<br />
Accumulated depreciation of disposals – – – – – –<br />
Depreciation for the year – (1,698) – (5,634) (4,416) (11,748)<br />
carrying amount at 31 December 2009 10,702 75,037 – 29,816 11,913 127,468<br />
– at cost/revaluation 10,702 79,047 1,500 62,729 36,892 190,870<br />
– accumulated depreciation – (4,010) (1,500) (32,913) (24,979) (63,402)<br />
Information regarding land and buildings required in terms of the companies Act is available for inspection by the shareholder or duly authorised<br />
agents at the <strong>Group</strong>’s registered office.<br />
Independent valuations of freehold land and buildings were performed by G Wampach, who is registered with the South African council for<br />
the Property Valuers Profession (SAcPVP) and a member of the South African Institute of Valuers. The effective date of the valuation is<br />
31 December 2010 . The revaluation of properties has been done, where appropriate for the specific property being valued, with reference<br />
to one of:<br />
– income capitalisation method using a capitalisation rate of 10.5%; and<br />
– the depreciated replacement cost method.<br />
The valuation conforms to International Valuation Standards.
13. Computer software and development cost<br />
2010<br />
Development computer<br />
cost software Total<br />
N$’000 N$’000 N$’000<br />
carrying amount at 1 January 2010 39,621 11,426 51,047<br />
– at cost 39,621 23,588 63,209<br />
– accumulated amortisation – (12,162) (12,162)<br />
Additions at cost – 653 653<br />
Development cost incurred 465 – 465<br />
Transfer of development costs (39,127) 39,127 –<br />
Write-offs during the current year (863) (396) (1,259)<br />
Write-offs at cost (863) (396) (1,259)<br />
Accumulated amortisation on write-offs – – –<br />
2009<br />
Amortisation for the year – (11,719) (11,719)<br />
carrying amount at 31 December 2010 96 39,091 39,187<br />
– at cost 96 62,972 63,068<br />
– accumulated amortisation – (23,881) (23,881)<br />
carrying amount at 1 January 2009 6,268 12,583 18,851<br />
– at cost 6,268 23,689 29,957<br />
– accumulated amortisation – (11,106) (11,106)<br />
Additions at cost – 746 746<br />
Development cost incurred 33,353 – 33,353<br />
Write-offs during the current year – (233) (233)<br />
Write-offs at cost – (847) (847)<br />
Accumulated amortisation on write-offs – 614 614<br />
Amortisation for the year – (1,670) (1,670)<br />
carrying amount at 31 December 2009 39,621 11,426 51,047<br />
– at cost 39,621 23,588 63,209<br />
– accumulated amortisation – (12,162) (12,162)<br />
85
86<br />
NEDNAMIBIA HOLDINGS LIMItED ANNUAL REPORt 2010<br />
NOtES tO tHE CONSOLIDAtED<br />
ANNUAL FINANCIAL STATEMENTS<br />
FOR THE YEAR ENDED 31 DEcEmbER 2010 (cONTINUED)<br />
14. Goodwill<br />
2010 2009<br />
N$’000 N$’000<br />
carrying amount at beginning of year 27,623 27,623<br />
– cost 27,623 27,623<br />
– Impairment losses – –<br />
Arising on acquisitions – –<br />
carrying amount at end of year 27,623 27,623<br />
– cost 27,623 27,623<br />
– Impairment losses – –<br />
15. Share capital and share premium<br />
Ordinary shares 17,595 17,595<br />
Share premium 99,536 99,536<br />
The total number of authorised shares at year-end was:<br />
80 000 000 (2009: 80 000 000) ordinary shares of 25 cents each<br />
The total number of issued shares at year-end was:<br />
70 381 644 (2009: 70 381 644) ordinary shares of 25 cents each<br />
All issued shares are fully paid.<br />
Subject to the restrictions of the companies Act, the unissued shares are under the control of the<br />
directors until the forthcoming <strong>annual</strong> general meeting.<br />
16. General risk reserve<br />
117,131 117,131<br />
balance at the beginning of the year 38,370 29,711<br />
movement during the year 4,878 8,659<br />
balance at the end of the year 43,248 38,370<br />
The general risk reserve is created to comply with the requirements of bID-2 of the bank of Namibia<br />
regarding the general risk provision.<br />
17. revaluation reserve<br />
balance at the beginning of the year 27,452 28,370<br />
Effect of rate adjustment 343 –<br />
Release of revaluation reserve (931) (918)<br />
Revaluation of land and buildings 6,353 –<br />
balance at the end of the year 33,217 27,452<br />
The revaluation reserve arises on the revaluation of land and buildings. Where revalued land or buildings<br />
are sold, the portion of the property’s revaluation reserve that relates to that asset, and is effectively<br />
realised, is transferred directly to other comprehensive income. As revalued buildings are depreciated,<br />
the depreciation related to the property’s revaluation reserve is also transferred directly to other<br />
comprehensive income.
18. Share-based payment reserve<br />
2010 2009<br />
N$’000 N$’000<br />
balance at the beginning of the year 19,835 18,488<br />
charge to statement of changes in equity 63 1,347<br />
Adjustment in respect of invested instruments exercised and forfeited movement through equity (1,015) –<br />
Balance at the end of the year 18,883 19,835<br />
The share-based payment reserve is a contribution from the parent and equals the amount at which the<br />
services from the employees are measured that arises from the grants of share options and restricted<br />
shares issued to employees under the bEE schemes detailed in note 42.<br />
19. Available-for-sale reserve<br />
balance at the beginning of the year 6,198 –<br />
movement during the year 1,246 6,198<br />
balance at the end of the year 7,444 6,198<br />
The available-for-sale reserve arises on revaluation of an available for sale investment which is listed<br />
shares in <strong>Nedbank</strong> <strong>Group</strong> <strong>Limited</strong> through the bEE scheme. Refer to note 11 and 41.<br />
20. Due to other banks<br />
Financial liabilities classification: Other liabilities<br />
Deposits and borrowings from other banks 23,257 104<br />
21. Due to customers<br />
Financial liabilities classification: Other liabilities<br />
21.1 Category analysis<br />
current accounts 1,072,196 921,582<br />
Savings accounts 237,640 219,773<br />
Other deposits and loan accounts 2,914,583 2,836,380<br />
Foreign currency liabilities 326,269 211,250<br />
4,550,688 4,188,985<br />
21.2 Sectoral analysis<br />
Government and quasi government 250,851 216,515<br />
Insurance and pension funds 1,233,883 1,136,566<br />
companies and close corporations 2,107,982 1,947,934<br />
Individuals and other 957,972 887,970<br />
21.3 Maturity structure<br />
4,550,688 4,188,985<br />
Repayable on demand 191,845 165,355<br />
Three months or less but not repayable on demand 650,595 520,038<br />
One year or less but over three months 1,813,486 3,503,592<br />
Five years or less but over one year 1,894,762 –<br />
21.4 Geographical analysis<br />
4,550,688 4,188,985<br />
Namibia 4,550,688 4,188,985<br />
87
88<br />
NEDNAMIBIA HOLDINGS LIMItED ANNUAL REPORt 2010<br />
NOtES tO tHE CONSOLIDAtED<br />
ANNUAL FINANCIAL STATEMENTS<br />
FOR THE YEAR ENDED 31 DEcEmbER 2010 (cONTINUED)<br />
22. Negotiable certificates of deposit<br />
Financial liabilities classification: Other liabilities<br />
2010 2009<br />
N$’000 N$’000<br />
Negotiable certificates of deposit 1,447,000 1,354,320<br />
23. other liabilities<br />
Financial liabilities classification: Other liabilities 121,008 77,693<br />
creditors and other accounts 102,018 28,693<br />
Taxation 830 704<br />
managerial fees – <strong>Nedbank</strong> <strong>Group</strong> <strong>Limited</strong> 18,160 48,296<br />
Non-<strong>financial</strong> instruments 17,685 10,683<br />
Deferred revenue 929 513<br />
bonus provision 10,803 4,445<br />
– opening balance 4,445 7,016<br />
– utilised (7,112) (5,609)<br />
– unutilised amounts reversed - (991)<br />
– charge to statement of comprehensive income 13,470 4,029<br />
Leave pay accrual 5,953 5,725<br />
– opening balance 5,725 5,917<br />
– utilised 1,478 (2,083)<br />
– prior year underprovision / (unutilised amounts reversed) 50 (172)<br />
– charge to statement of comprehensive income (1,300) 2,063<br />
24. Deferred tax<br />
The movement on the deferred taxation account is as follows:<br />
138,693 88,376<br />
balance at beginning of the year 103,774 109,553<br />
movements during the year 13,348 (5,779)<br />
– Temporary difference 15,219 (5,285)<br />
– change in tax rate (2,869) –<br />
– Revaluation of property – movement through equity 1,675 –<br />
– Revaluation of property – movement through other comprehensive income (677) (494)<br />
balance at end of the year 117,122 103,774
24. Deferred tax (continued)<br />
The balance comprises:<br />
2010 2009<br />
N$’000 N$’000<br />
capital allowances 83,005 34,642<br />
credit impairments (4,932) (4,846)<br />
Debentures 12,795 13,282<br />
Prepaid expenses 2,537 11,413<br />
Suspensive sales 75,030 51,964<br />
Others (51,313) (2,681)<br />
25. Policyholder liabilities under insurance contracts<br />
117,122 103,774<br />
balance at beginning of the year 20,427 133<br />
Amounts recognised in statement of comprehensive income 9,769 20,294<br />
balance at the end of the year 30,196 20,427<br />
Refer to page 48 for assumptions used by actuary<br />
26. Provision for post-retirement medical benefits<br />
The bank subsidises 50% of the medical aid contribution of all employees who joined <strong>Nedbank</strong> Namibia<br />
between 1 April 2000 and 31 January 2003. The subsidy does not apply to any employees who joined the<br />
bank on or after 1 February 2003. Provisions are made for these costs. The charge for the year is included<br />
in the staff costs expense in the statement of comprehensive income.<br />
Valuation method and assumptions:<br />
The actuarial valuation method used to value the liabilities is the Projected Unit credit method prescribed<br />
by IAS 19: Employee benefits. Future benefits valued are projected using specific actuarial assumptions<br />
and the liability for in-service members is accrued over expected working lifetime. The actuarial valuation<br />
is obtained once every two years on a cyclical basis. The most recent valuation was obtained for the year<br />
ended 31 December 2009 performed by Arthur Els & Associates consulting Actuaries on 31 December<br />
2009.<br />
The most significant assumptions used are:<br />
Valuation interest rate: 9.4% per annum<br />
medical aid contribution inflation: 7.65% per annum<br />
Reconciliation of net liability in the statement of <strong>financial</strong> position:<br />
balance at beginning of the year 7,223 5,237<br />
movements during the year 317 1,986<br />
Interest cost 663 403<br />
current service cost 101 107<br />
benefits paid (447) (384)<br />
Actuarial loss – 1,860<br />
balance at end of the year 7,540 7,223<br />
89
90<br />
NEDNAMIBIA HOLDINGS LIMItED ANNUAL REPORt 2010<br />
NOtES tO tHE CONSOLIDAtED<br />
ANNUAL FINANCIAL STATEMENTS<br />
FOR THE YEAR ENDED 31 DEcEmbER 2010 (cONTINUED)<br />
27. Long-term subordinated debt instruments<br />
Financial liabilities classification: Other liabilities<br />
2010 2009<br />
N$’000 N$’000<br />
Unsecured, subordinated debentures, at issue price as adjusted for amortised discount and the<br />
portion of the coupon payments in excess of the effective interest expense. 2,364 2,049<br />
The debentures were issued at a discount on 15 September 1995 and are redeemable at their nominal<br />
value of N$40 million on 15 September 2030. Interest was payable on these debentures on a six-monthly<br />
basis at the rate of 17% per annum on nominal value until 15 September 2000.<br />
Prior to 2001, these coupon payments are partially charged against income and partially against the<br />
capital value of the debentures. For the years 2001 to 2030 the effective interest expense is capitalised.<br />
The coupon holders are entitled, in the event of interest default, to put the coupon covering such interest<br />
payments to <strong>Nedbank</strong> <strong>Group</strong> <strong>Limited</strong>.<br />
In the unlikely event of redemption prior to 15 September 2030, a contingent liability exists of<br />
N$29.2 million (2009: N$28.7 million).<br />
28. Net interest income<br />
Interest and similar income<br />
Financial assets classification: Loans and receivables 563,034 572,420<br />
Due from other banks 18,631 31,948<br />
Home loans 197,804 193,022<br />
Other loans and overdrafts 175,828 183,641<br />
Preference share finance 4,640 2,274<br />
Lease and instalment debtors 80,851 86,666<br />
micro-loans 79,904 67,345<br />
Other assets 5,376 7,524<br />
Financial assets classification: Fair value through profit or loss – held for trading 53,067 54,152<br />
Government and public sector securities 33,060 38,624<br />
Short-term funds and securities 20,007 15,528<br />
Total interest and similar income 616,101 626,572<br />
Interest expense and similar charges<br />
Financial liabilities classification: Other liabilities 261,612 313,150<br />
Deposit and loan accounts 151,620 170,281<br />
current and savings accounts 13,506 17,486<br />
Negotiable certificates of deposit 92,374 109,401<br />
Other liabilities 3,796 15,708<br />
Long-term debt instruments 316 274<br />
Total interest expense and similar charges 261,612 313,150<br />
Net interest income 354,489 313,422<br />
29. Non-interest income<br />
commission and fees 149,446 135,662<br />
Dividends 872 5,280<br />
Exchange earnings 34,035 36,906<br />
– Exchange commission 9,111 7,657<br />
– Foreign exchange profit 24,924 29,249<br />
Profit/(Loss) on sale of property and equipment 72 (171)<br />
Sundry trading gains 5,241 4,050<br />
changes in fair value of: 246 1,612<br />
– Financial assets and liabilities designated as fair value through profit or loss – held for trading 246 619<br />
– Listed investment – 993<br />
Other income 12,261 3,227<br />
202,173 186,566
30. Impairment of advances<br />
2010<br />
30.1 Movements<br />
Other Leases and<br />
Home loans and instalment micro-<br />
loans overdrafts debtors<br />
loans Total<br />
N$’000 N$’000 N$’000 N$’000 N$’000<br />
balance at beginning of the year 15,373 34,808 9,737 15,879 75,797<br />
– specific impairment 7,274 27,290 4,682 14,107 53,353<br />
– portfolio impairment 8,099 7,518 5,055 1,772 22,444<br />
Debts recovered 175 2,337 2,286 2,823 7,621<br />
Debts written off (3,040) (9,946) (14,066) (5,392) (32,444)<br />
Statement of the comprehensive income<br />
charge 7,482 (224) 9,602 2,708 19,568<br />
– specific impairment 7,544 4,276 11,806 (953) 22,673<br />
– portfolio impairment (62) (4,500) (2,204) 3,661 (3,105)<br />
balance at end of the year (note 9) 19,991 26,975 7,559 16,018 70,543<br />
– specific impairment 11,953 23,957 4,708 10,585 51,203<br />
– portfolio impairment 8,038 3,018 2,851 5,433 19,340<br />
2009<br />
balance at beginning of the year 12,243 30,878 8,107 13,863 65,091<br />
– specific impairment 8,321 14,452 4,265 11,019 38,057<br />
– portfolio impairment 3,922 16,426 3,842 2,844 27,034<br />
Debts recovered 313 4,163 4,073 5,029 13,578<br />
Debts written off (2,128) (4,229) (3,266) (13,215) (22,838)<br />
Statement of the comprehensive income<br />
charge 4,945 3,996 823 10,202 19,966<br />
– specific impairment 768 12,904 (390) 11,274 24,556<br />
– portfolio impairment 4,177 (8,908) 1,213 (1,072) (4,590)<br />
balance at end of the year (note 9) 15,373 34,808 9,737 15,879 75,797<br />
– specific impairment 7,274 27,290 4,682 14,107 53,353<br />
– portfolio impairment 8,099 7,518 5,055 1,772 22,444<br />
Included under the statement of other<br />
comprehensive income charge for specific<br />
impairment is interest amounting to<br />
N$8.3 million (2009: N$12.1 million) and<br />
under the specific impairment balance is<br />
interest in suspense amounting to<br />
N$23.9 million (2009: N$23.1 million).<br />
91
92<br />
NEDNAMIBIA HOLDINGS LIMItED ANNUAL REPORt 2010<br />
NOtES tO tHE CONSOLIDAtED<br />
ANNUAL FINANCIAL STATEMENTS<br />
FOR THE YEAR ENDED 31 DEcEmbER 2010 (cONTINUED)<br />
30. Impairment of advances (continued)<br />
30.2 Sectoral analysis<br />
Specific impairments Portfolio impairments<br />
2010 2009 2010 2009<br />
N$’000 N$’000 N$’000 N$’000<br />
Individuals 38,103 44,310 16,725 6,686<br />
manufacturing 1,553 475 322 902<br />
Wholesale and trade 1,694 1,065 237 219<br />
Retailers, catering and accommodation 1,038 310 192 2,535<br />
Agriculture, forestry and fishing 1,553 72 301 1,692<br />
mining and quarrying 49 126 11 1,015<br />
Financial services, insurance and real estate 3,647 4,668 633 6,057<br />
Government and public sector – – – 964<br />
building and property development 1,597 193 355 701<br />
Transport, storage and communication 624 1,597 292 980<br />
Other services 1,345 537 272 693<br />
31. operating expenditure<br />
Expenses include the following items which are separately disclosable:<br />
51,203 53,353 19,340 22,444<br />
2010 2009<br />
N$’000 N$’000<br />
Auditors’ remuneration 5,169 4,056<br />
– Audit fees – current year 3,142 2,064<br />
– Audit fees – prior year 1,451 1,377<br />
– Other services 576 615<br />
Post-retirement medical aid benefit 764 2,370<br />
– Interest cost 663 403<br />
– current service cost 101 107<br />
– Actuarial loss – 1,860<br />
Depreciation 13,500 11,748<br />
Amortisation of computer software 11,719 1,670<br />
Staff costs 148,355 135,605<br />
Operating lease charges 3,959 11,134<br />
– Fixed property 1,257 8,323<br />
– Other 2,702 2,811<br />
Remuneration other than to employees for :<br />
– managerial services 36,794 30,824<br />
Value-added tax charge in respect of current expenditure net of input credits 11,007 8,979<br />
Directors’ fees paid by the bank 3,112 2,852<br />
– For services as directors 1,009 984<br />
– managerial services 2,103 1,868
31. operating expenditure (continued)<br />
2010 2009<br />
N$’000 N$’000<br />
Key management 10,092 10,516<br />
– basic salary and other benefits 9,334 9,726<br />
– Employer pension contribution 675 703<br />
– Employer medical aid contribution 83 87<br />
Other expenses 86,818 70,431<br />
32. Transfer to policyholder liabilities under insurance contracts<br />
331,289 290,185<br />
Transfer to policyholder liabilities under insurance contracts 9,769 20,294<br />
33. BEE transaction expenses<br />
bEE share-based payment expenses 2,064 877<br />
Other costs* – 5,364<br />
* Other costs include PAYE, interest and penalties paid on behalf of employees who received shares in<br />
terms of the bank’s various share-based payment schemes. Refer to note 41.<br />
34. Taxation<br />
34.1 Charge for the year<br />
2,064 6,241<br />
Normal taxation – prior year underprovision 1,859 1,389<br />
Normal taxation – prior year credit due to rate change (1,453) –<br />
Normal taxation – current year 38,758 50,959<br />
Deferred taxation – current 15,219 (5,285)<br />
Deferred taxation – prior year credit due to rate change (2,991) –<br />
34.2 reconciliation of rate of taxation<br />
51,392 47,063<br />
% %<br />
Namibian normal rate of taxation 34,0 35,0<br />
Reduction in rate for the year: (7,9) (7,9)<br />
– Non-taxable income (5,5) (5,4)<br />
– change in tax rate (0,9) –<br />
– Other permanent differences (1,5) (2,5)<br />
– Non-deductible expenses 0,3 1,7<br />
Effective rate of taxation 26,4 28,8<br />
35. Dividends<br />
N$’000 N$’000<br />
No dividend was declared for 2010 (2009: Nil) – –<br />
93
94<br />
NEDNAMIBIA HOLDINGS LIMItED ANNUAL REPORt 2010<br />
NOtES tO tHE CONSOLIDAtED<br />
ANNUAL FINANCIAL STATEMENTS<br />
FOR THE YEAR ENDED 31 DEcEmbER 2010 (cONTINUED)<br />
36. Earnings per share<br />
2010 2009<br />
Cents per<br />
share<br />
Cents per<br />
share<br />
basic earnings per share 200,96 163,42<br />
Diluted earnings per share 200,96 163,42<br />
Basic earnings per share N$’000 N$’000<br />
Earnings used in the calculation of basic earnings per share 141,439 115,015<br />
‘000 ‘000<br />
Weighted average number of ordinary shares for the purpose of basic earnings per share 70,579 70,382<br />
Diluted earnings per share<br />
The earnings and the weighted average number of ordinary shares used in the calculation of all diluted earnings per share measures are the<br />
same as those for the equivalent basic earnings per shares measures, as outlined above.<br />
37. Cash flow information<br />
37.1 reconciliation of profit before taxation to cash generated by operating activities<br />
N$’000 N$’000<br />
Profit before taxation 194,733 163,565<br />
Adjustments for non-cash items : 70,087 36,934<br />
– Accrued interest 4,966 (8,883)<br />
– Negotiable certificates of deposit 3,498 (724)<br />
– Income from associates (761) (263)<br />
– (Profit)/Loss on disposal of property and equipment (72) 171<br />
– Fair value adjustment to <strong>financial</strong> instruments (246) 1,612<br />
– Impairment of advances 19,568 19,966<br />
– Non-cash movement in provisions 13,787 5,024<br />
– Non-cash movement in leave pay accrual (1,250) 1,891<br />
– Fair value movement in derivatives 340 (923)<br />
– Non-cash movement in deferred staff compensation 2,974 4,768<br />
– Share-based payment reserve movement 2,064 877<br />
– Depreciation 13,500 11,748<br />
– computer software amortisation 11,719 1,670<br />
other adjustments (38,849) (52,075)<br />
– movement in long-term subordinated debt instruments 315 273<br />
– current income tax charge (39,164) (52,348)<br />
Movement in operating assets 152,936 113,719<br />
– Deposit, current and other accounts 454,383 845,821<br />
– Advances and other accounts (301,447) (732,102)<br />
Cash generated by operating activities 378,907 262,143<br />
37.2 Cash received from customers<br />
Interest received 580,837 578,304<br />
commission and fees received 158,557 143,319<br />
Other income received 41,872 32,687<br />
781,266 754,310
37. Cash flow information (continued)<br />
37.3 Cash paid to customers<br />
2010 2009<br />
N$’000 N$’000<br />
Interest paid on deposits (221,382) (273,765)<br />
37.4 Taxation paid<br />
Amounts prepaid–beginning of year 9,544 17,888<br />
charge to statement of comprehensive income (39,164) (52,348)<br />
Amounts prepaid – end of year (25,693) (9,544)<br />
37.5 Cash movement in operating liabilities<br />
(55,313) (44,004)<br />
current accounts 150,559 2,050<br />
Savings deposits 17,779 30,849<br />
Other deposits and loan accounts 59,581 378,639<br />
Foreign currency accounts 115,019 53,424<br />
Negotiable certificates of deposit 71,530 341,748<br />
37.6 Purchase of non-dealing securities<br />
414,468 806,710<br />
Other short-term securities (214,366) (109,515)<br />
Government and public sector securities 21,313 8,936<br />
37.7 Cash and short-term funds<br />
(193,053) (100,579)<br />
For the purpose of the statement of cash flows, cash and short-term funds comprise the following<br />
balances with less than 90 days maturity:<br />
bank notes and coins (note 4) 79,044 77,702<br />
balances with central bank (note 4) 56,634 52,139<br />
Due from other banks (note 5) 605,101 440,238<br />
38. Commitments<br />
38.1 Capital expenditure<br />
740,779 570,079<br />
contracted<br />
– Property and equipment – –<br />
Not yet contracted<br />
– Property and equipment 6,037 34,100<br />
Funds to meet capital expenditure will be provided from internal resources.<br />
38.2 Bond commitments<br />
6,037 34,100<br />
bonds granted, not yet paid out 71,221 49,546<br />
38.3 Undrawn facilities<br />
Original term of maturity of one year or less 808,713 701,371<br />
95
96<br />
NEDNAMIBIA HOLDINGS LIMItED ANNUAL REPORt 2010<br />
NOtES tO tHE CONSOLIDAtED<br />
ANNUAL FINANCIAL STATEMENTS<br />
FOR THE YEAR ENDED 31 DEcEmbER 2010 (cONTINUED)<br />
2010 2009<br />
N$’000 N$’000<br />
38. Commitments (continued)<br />
38.4 operating leases<br />
The <strong>Group</strong> has entered into leases over fixed property and other equipment for various periods. The charges will increase in future in line with<br />
negotiated escalations and expansions.<br />
The future minimum lease payments in respect of operating leases are as follows:<br />
Premises<br />
2010 – 13,063<br />
2011 12,017 9,998<br />
2012 6,269 3,144<br />
2013 3,148 –<br />
Thereafter 4,193 –<br />
25,627 26,205<br />
39. Pension fund<br />
All eligible employees are members of the <strong>Nedbank</strong> Namibia Pension Fund, a defined contribution plan,<br />
which has been registered in Namibia in accordance with the requirements of the Pension Fund Act.<br />
The fund is governed by the Pension Fund Act, 1956, which requires an actuarial valuation every three<br />
years. The findings of independent consulting actuaries, based on their appraisal of the fund during<br />
January 2008, confirmed that the fund was <strong>financial</strong>ly sound.<br />
The total value of contributions to the pension fund during the year amounted to:<br />
Number of members 538 521<br />
Employer contributions 10,531 9,665<br />
Employee contributions<br />
40. Contingent liabilities<br />
7,056 6,480<br />
confirmed letters of credit 12,252 3,827<br />
Liabilities under guarantees 396,152 320,681<br />
Legal actions against the <strong>Group</strong> 398 1,680<br />
41. Share-based payments<br />
408,802 326,188<br />
Shares and share options are granted to employees as part of their remuneration package for services rendered, and in terms of the bEE scheme<br />
to clients and partners as an incentive to retain business and develop growth within the <strong>Group</strong>. The following are share and share options<br />
schemes that have been in place during the year. The traditional employee schemes are cash-settled and the bEE schemes will be treated as<br />
equity-settled.<br />
As the <strong>Group</strong> cannot estimate reliably the fair value of services received nor the value of additional business received, the <strong>Group</strong> rebuts the<br />
presumption that such services and business can be measured reliably and, as such, measures their fair value by reference to the fair value of the<br />
options or shares granted. The fair value of such options and shares is measured at the grant date utilising the black-Scholes valuation model.
41. Share-based payments (continued)<br />
41.1 Description of arrangements<br />
41.1.1 Black Economic Empowerment schemes – Business partners and affinity groups<br />
ScHEmE TRUST DEScRIPTION VESTING REQUIREmENTS mAXImUm TERm<br />
black business Partner<br />
Scheme (bbP)<br />
Affinity <strong>Group</strong> Scheme<br />
(AG)<br />
benefit scheme in respect<br />
of higher education<br />
(Education Scheme)<br />
NedNamibia Discretionary<br />
Scheme<br />
central consortium<br />
SPV Three Investments<br />
(Proprietary) <strong>Limited</strong>,<br />
coastal consortium<br />
SPV Three Investments<br />
(Proprietary) <strong>Limited</strong> and<br />
Northern Empowerment<br />
SPV Three Investments<br />
(Proprietary) <strong>Limited</strong><br />
Southern consortium<br />
SPV Three Investments<br />
(Proprietary) <strong>Limited</strong><br />
and Eastern consortium<br />
SPV Three Investments<br />
(Proprietary) <strong>Limited</strong><br />
The Old mutual and<br />
<strong>Nedbank</strong> Namibia<br />
Education Trust<br />
NedNamibia Holdings<br />
Discretionary Trust<br />
Each SPV was issued<br />
an equal number of<br />
restricted shares at<br />
N$2.53 per share, with<br />
notional funding over a<br />
period of 10 years. The<br />
beneficial ownership of<br />
the shares resides with the<br />
participants, including the<br />
voting and dividend rights.<br />
Each SPV was issued an<br />
equal number of restricted<br />
shares at N$1 per share,<br />
with notional funding over<br />
a period of 10 years. The<br />
beneficial ownership of<br />
the shares resides with the<br />
participants, including the<br />
voting and dividend rights.<br />
Each SPV was issued an<br />
equal number of restricted<br />
shares at N$1 per share,<br />
with notional funding over<br />
a period of 10 years. The<br />
beneficial ownership of<br />
the shares resides with the<br />
participants, including the<br />
voting and dividend rights.<br />
No dealing in the shares<br />
during the 10-year<br />
notional funding period.<br />
No dealing in the shares<br />
during the 10-year<br />
notional funding period.<br />
No dealing in the shares<br />
during the 10-year<br />
notional funding period.<br />
The Trust shall hold the<br />
scheme shares linked to<br />
the respective beneficiary<br />
Participation Allocation for<br />
the benefit of the<br />
10 years<br />
10 years<br />
10 years<br />
10 years<br />
97
98<br />
NEDNAMIBIA HOLDINGS LIMItED ANNUAL REPORt 2010<br />
NOtES tO tHE CONSOLIDAtED<br />
ANNUAL FINANCIAL STATEMENTS<br />
FOR THE YEAR ENDED 31 DEcEmbER 2010 (cONTINUED)<br />
41. Share-based payments (continued)<br />
41.1 Description of arrangements (continued)<br />
41.1.1 Black Economic Empowerment schemes – Business partners and affinity groups (continued)<br />
ScHEmE TRUST DEScRIPTION VESTING REQUIREmENTS mAXImUm TERm<br />
black management<br />
Scheme (black<br />
management)<br />
broad-based Employee<br />
Scheme (broad-based)<br />
NedNamibia Holdings<br />
Long-term Incentive<br />
Scheme (LTIP)<br />
Ofifiya black management<br />
Trust<br />
Ofifiya broad-based<br />
Employee Trust<br />
NedNamibia Holdings<br />
Long-term Incentive<br />
Scheme Trust<br />
Restricted shares and<br />
share options were<br />
granted to certain black<br />
employees on middle<br />
and senior management<br />
level. The beneficial<br />
ownership of the<br />
shares resides with the<br />
participants, including<br />
the voting and dividend<br />
rights.<br />
Restricted shares<br />
granted to all qualifying<br />
employees who do not<br />
participate in any other<br />
share incentive scheme<br />
operating in the group. The<br />
beneficial ownership of<br />
the shares resides with the<br />
participants, including the<br />
voting and dividend rights.<br />
Restricted shares and<br />
options awarded to all<br />
eligible employees to<br />
promote the continued<br />
growth of NedNamibia<br />
Holdings <strong>Limited</strong> and<br />
to attract and retain<br />
suitably skilled and<br />
competent personnel. The<br />
beneficial ownership of<br />
the shares resides with the<br />
participants, including the<br />
voting and dividend rights.<br />
Participants must remain<br />
in service for four, five and<br />
six years, after each of<br />
which 1/3 of the shares<br />
becomes unrestricted and<br />
1/3 of the options vests.<br />
No dealing in the shares<br />
during the restricted<br />
period of 5 years.<br />
Participants must remain<br />
in service of NedNamibia<br />
Holdings <strong>Limited</strong> or any<br />
one of its subsidiaries<br />
to qualify as an eligible<br />
employee.<br />
7 years<br />
5 years<br />
3 years
41. Share-based payments (continued)<br />
41.2 Effect on profit and <strong>financial</strong> position<br />
Black Economic Empowerment Schemes<br />
2010 2009 2010 2009<br />
N$'000 N$'000 N$'000 N$'000<br />
Share-based payments<br />
expense<br />
Share-based payments<br />
reserve<br />
black business Partners (bbP) – – 8 997 8 997<br />
Affinity <strong>Group</strong>s (AG) – – 3 299 3 299<br />
Education – – 4 398 4 398<br />
Discretionary – – – –<br />
LTIP (74) 470 396 470<br />
black management 136 877 1 792 2 671<br />
broad-based – – – –<br />
41.3 Black Economic Empowerment schemes<br />
Black Business Partner Scheme<br />
Number<br />
of<br />
instruments<br />
62 1 347 18 882 19 835<br />
2010 2009<br />
Weighted<br />
average<br />
exercise<br />
price (N$)<br />
Number<br />
of<br />
instruments<br />
99<br />
Weighted<br />
average<br />
exercise<br />
price<br />
(N$)<br />
Outstanding at beginning of the year 199 929 278,98 199 929 278,98<br />
Granted – – – –<br />
Forfeited – – – –<br />
Exercised – – – –<br />
Expired – – – –<br />
Outstanding at end of year 199 929 278,98 199 929 278,98<br />
Exercisable at end of year – – – –<br />
Weighted average share price for options exercised (N$) – –<br />
Affinity <strong>Group</strong> Scheme<br />
Outstanding at beginning of the year 74 048 282,47 74 048 282,47<br />
Granted – – – –<br />
Forfeited – – – –<br />
Exercised – – – –<br />
Expired – – – –<br />
Outstanding at end of year 74 048 282,47 74 048 282,47<br />
Exercisable at end of year – – – –<br />
Weighted average share price for options exercised (N$) – –<br />
Education Scheme<br />
Outstanding at beginning of the year 98 730 282,47 98 730 282,47<br />
Granted – – – –<br />
Forfeited – – – –<br />
Exercised – – – –<br />
Expired – – – –<br />
Outstanding at end of year 98 730 282,47 98 730 282,47<br />
Exercisable at end of year – – – –<br />
Weighted average share price for options exercised (N$) – –
100 NEDNAMIBIA HOLDINGS LIMItED ANNUAL REPORt 2010<br />
NOtES tO tHE CONSOLIDAtED<br />
ANNUAL FINANCIAL STATEMENTS<br />
FOR THE YEAR ENDED 31 DEcEmbER 2010 (cONTINUED)<br />
41. Share-based payments (continued)<br />
41.3 Black Economic Empowerment schemes (continued)<br />
Discretionary Scheme<br />
Number<br />
of<br />
instruments<br />
2010 2009<br />
Weighted<br />
average<br />
exercise<br />
price (N$)<br />
Number<br />
of<br />
instruments<br />
Weighted<br />
average<br />
exercise<br />
price<br />
(N$)<br />
Outstanding at beginning of the year – 282,58 – 282,58<br />
Granted – – – –<br />
Forfeited – – – –<br />
Exercised – – – –<br />
Expired – – – –<br />
Outstanding at end of the year – 282,58 – 282,58<br />
Exercisable at end of the year – – – –<br />
Weighted average share price for options exercised (N$) – –<br />
LTIP Scheme<br />
Outstanding at beginning of the year 67,562 46,42 23,350 134,00<br />
Other movement – – 47,512 –<br />
Forfeited (1,980) – (3,300) –<br />
Exercised – – – –<br />
Expired – – – –<br />
Outstanding at end of the year 65,582 47,82 67,562 46,42<br />
Exercisable at end of the year 23,350 134,30 – –<br />
Weighted average share price for options exercised (N$) – –
41. Share-based payments (continued)<br />
41.3 Black Economic Empowerment schemes (continued)<br />
Black Management Scheme<br />
Number<br />
of<br />
instruments<br />
2010 2009<br />
Weighted<br />
average<br />
exercise<br />
price (N$)<br />
Number<br />
of<br />
instruments<br />
101<br />
Weighted<br />
average<br />
exercise<br />
price<br />
(N$)<br />
Outstanding at beginning of the year 75,400 77,92 75,400 77,92<br />
Other movements 18,417 120,62 – –<br />
Forfeited (37,308) 101,29 – –<br />
Exercised (5,554) 101,29 – –<br />
Expired – – – –<br />
Outstanding at end of the year 50,955 108,00 75,400 77,92<br />
Exercisable at end of the year 7,656 101,29 – –<br />
Weighted average share price for options exercised (N$) 129,16 –<br />
Broad-based Scheme<br />
Outstanding at beginning of the year 39,816 – 39,816 –<br />
Granted – – – –<br />
Forfeited – – – –<br />
Exercised – – – –<br />
Expired – – – –<br />
Outstanding at end of the year 39,816 – 39,816 –<br />
Exercisable at end of the year – – – –<br />
Weighted average share price for options exercised (N$) – –
102 NEDNAMIBIA HOLDINGS LIMItED ANNUAL REPORt 2010<br />
NOtES tO tHE CONSOLIDAtED<br />
ANNUAL FINANCIAL STATEMENTS<br />
FOR THE YEAR ENDED 31 DEcEmbER 2010 (cONTINUED)<br />
41. Share-based payments (continued)<br />
41.4 Instruments outstanding at the end of the year by exercise price<br />
Black Business Partner Scheme<br />
278.98 199,929 5,93 199,929 6,93<br />
Affinity <strong>Group</strong> Scheme<br />
282.47 74,048 5,93 74,048 6,93<br />
Education Scheme<br />
282.47 98,730 5,93 98,730 6,93<br />
Discretionary Scheme<br />
282.58 – 10,00 – 10,00<br />
LTIP Scheme<br />
0.00 42,232 1,20 44,212 2,20<br />
134.30 23,350 1,60 23,250 2,60<br />
Black Management Scheme<br />
41.5 Instruments granted during the year<br />
LTIP Scheme<br />
2010 2009<br />
Number of instruments granted – 47,512<br />
Weighted average fair value per instrument granted (N$) – 70<br />
Weighted average share price (N$) – 70<br />
Weighted average exercise price (N$) – –<br />
Weighted average expected volatility (%) – 52<br />
Weighted average life (years) – 3<br />
Weighted average expected dividends (%) – –<br />
Weighted average risk-free interest rate (%) – 8<br />
Number of participants – 23<br />
Weighted average vesting period (years) – 3<br />
Possibility of not vesting (%) – 45<br />
Expectation of meeting performance criteria (%) – 55<br />
No instruments were granted in 2010.<br />
65,582 1,30 67,462 2,30<br />
0.00 10,143 1,80 17,396 2,00<br />
101.29 26,644 3,00 58,004 4,00<br />
120.62 14,168 4,20<br />
Broad-based Scheme<br />
50,955 3,10 75,400 3,54<br />
0.00 39,816 – 39,816 –
42. related party disclosure<br />
42.1 Parent company<br />
NedNamibia Holdings <strong>Limited</strong>’s majority shareholder is <strong>Nedbank</strong> <strong>Group</strong> <strong>Limited</strong> (100%) (2009: 100%), which is in incorporated in South Africa.<br />
The ultimate holding company is Old mutual plc. The subsidiaries and associates of these companies are also seen as related companies.<br />
42.2 Identity of related parties with whom transactions have occurred<br />
Subsidiaries and the associate of the <strong>Group</strong> are identified in note 11. All of these entities are related parties. Transactions with directors<br />
and director-controlled entities are related party transactions.<br />
42.3 related party balances<br />
Loans from related parties<br />
2010 2009<br />
N$'000 N$'000<br />
<strong>Nedbank</strong> <strong>Group</strong> <strong>Limited</strong> (holding company) 429 821<br />
<strong>Nedbank</strong> <strong>Group</strong> <strong>Limited</strong> (holding company) (provision for management fees) 18,160 45,508<br />
<strong>Nedbank</strong> <strong>Group</strong> <strong>Limited</strong> (Derivative instruments included under note 7) 7,793 2,597<br />
Old mutual Namibia <strong>Limited</strong> (fellow subsidiary) 369,597 241,853<br />
<strong>Nedbank</strong> London (fellow subsidiary) 46 46<br />
<strong>Nedbank</strong> London (fellow subsidiary) (Derivative instruments included under note 7) – 62<br />
Nedcapital Investment Holdings (Namibia) (Proprietary) <strong>Limited</strong> (fellow subsidiary) 6,618 12<br />
Woodlands Investments company (Proprietary) <strong>Limited</strong> (fellow subsidiary) 540 9,064<br />
<strong>Nedbank</strong> Namibia Pension Fund (pension fund) 7,272 2,492<br />
balances with directors 660 388<br />
balances with key management 124 91<br />
Loans from related parties<br />
<strong>Nedbank</strong> <strong>Group</strong> <strong>Limited</strong> (holding company) (Zero-coupon bonds) - 34,161<br />
<strong>Nedbank</strong> <strong>Group</strong> <strong>Limited</strong> (holding company) (Internal settlement account) 93,203 24,852<br />
<strong>Nedbank</strong> <strong>Group</strong> <strong>Limited</strong> (holding company) (Negotiable certificates of deposit) 67,951 31,600<br />
<strong>Nedbank</strong> <strong>Group</strong> <strong>Limited</strong> (Derivative instruments included under note 7) 503 623<br />
<strong>Nedbank</strong> London (fellow subsidiary) (Derivative instruments included under note 7) 28 62<br />
balances with directors 3,612 11,626<br />
balances with key management 8,391 8,321<br />
43.4 related party transactions<br />
<strong>Nedbank</strong> <strong>Group</strong> <strong>Limited</strong> (holding company)<br />
Interest income other income Interest expense<br />
Expenses<br />
and dividends<br />
paid<br />
2010 2009 2010 2009 2010 2009 2010 2009<br />
N$’000 N$’000 N$’000 N$’000 N$’000 N$’000 N$’000 N$’000<br />
Interest income on internal settlement account 2,177 13,025 – – – – – –<br />
Interest income on zero coupon bonds 2,071 7,524 – – – – – –<br />
Interest income on negotiable certificates of deposit 365 3,186 – – – – – –<br />
Interest paid on current account – – – – 47 640 – –<br />
management fees – – – – – – 36,794 30,824<br />
old Mutual <strong>Limited</strong> (fellow subsidiary)<br />
Interest expense on current account – – – – 4,152 18,781 – –<br />
103
104 NEDNAMIBIA HOLDINGS LIMItED ANNUAL REPORt 2010<br />
NOtES tO tHE CONSOLIDAtED<br />
ANNUAL FINANCIAL STATEMENTS<br />
FOR THE YEAR ENDED 31 DEcEmbER 2010 (cONTINUED)<br />
42. related party disclosure (continued)<br />
42.4 related party transactions (continued)<br />
NedCapital Investment Holdings (Namibia)<br />
(Proprietary) <strong>Limited</strong> (fellow subsidiary)<br />
Interest income other income Interest expense<br />
Expenses<br />
and dividends<br />
paid<br />
2010 2009 2010 2009 2010 2009 2010 2009<br />
N$’000 N$’000 N$’000 N$’000 N$’000 N$’000 N$’000 N$’000<br />
Interest expense on current account – – – – 114 691 – –<br />
Woodlands Investments Company (Proprietary)<br />
<strong>Limited</strong> (fellow subsidiary)<br />
Interest expense on current account – – – – – 497 – –<br />
<strong>Nedbank</strong> Namibia Pension Fund (pension fund)<br />
Pension contributions – – – – – – 9,721 9,665<br />
Transactions with directors<br />
Services as directors – – – – – – 907 886<br />
Other services – – – – – – 2,103 1,868<br />
Staff costs – – – – – – 10,092 10,516<br />
Rent (Tusk Investments (Proprietary) <strong>Limited</strong>)<br />
43. Capital risk management<br />
– – – – – – 714 661<br />
The capital adequacy is managed in terms of the banking Institutions Act, 1998 (the “Act”). The aim of capital risk management is to<br />
ensure that the <strong>Group</strong>’s major subsidiary, <strong>Nedbank</strong> Namibia <strong>Limited</strong> (the “bank”), maintains a level of capital which<br />
(i) is adequate to protect its depositors and creditors;<br />
(ii) is commensurate with the risk activities and profile of the bank; and<br />
(iii) promotes public confidence in the bank and the banking system.<br />
capital is managed under the following definitions:<br />
Tier 1 (core) capital:<br />
Tier 1 capital includes permanent shareholders’ equity (issued and fully paid-up ordinary shares and perpetual non-cumulative preference<br />
shares) plus disclosed reserves (additional paid-in share premium plus retained earnings/undistributed profits) plus minority interests in<br />
consolidated subsidiaries, less intangible assets (goodwill, equity funded through capitalisation of revaluation reserves).<br />
Tier 2 (supplementary) capital:<br />
Tier 2 capital includes asset revaluation reserves; general loan loss provisions; subordinated debt; and hybrid (debt-equity) capital instruments.<br />
Total Qualifying Capital:<br />
Total qualifying capital means the sum of Tier 1 capital and Tier 2 capital after the deduction of investments in and loans to<br />
unconsolidated <strong>financial</strong> subsidiaries; investments in the capital of other <strong>financial</strong> institutions; encumbered assets (assets acquired using<br />
capital funds but subsequently pledged to secure loans or that are no longer available to cover losses from operations); and reciprocal<br />
holdings of capital instruments of banks.
43. Capital risk management (continued)<br />
Capital measures<br />
The ratios used for measuring capital adequacy are:<br />
– Leverage (equity) capital ratio (i.e. Tier 1 capital divided by gross assets; for purposes herein, “gross assets” means total assets plus general<br />
and specific provisions);<br />
– Tier 1 risk-based capital ratio (i.e. Tier 1 capital divided by total risk-weighted assets); and<br />
– Total risk-based capital ratio (i.e. total qualifying capital divided by total risk-weighted assets).<br />
Total risk-weighted capital:<br />
Total risk-weighted capital is the total assets reported in <strong>financial</strong> returns required to be submitted to the bank of Namibia, less intangible<br />
assets and the excess of assets classified as loss but not fully provisioned for, after applying the different risk weights to the prescribed<br />
category of assets as set forth in bID-5 of the Act.<br />
Minimum requirements<br />
The following minimum ratios shall apply (unless higher ratios are set by the bank) for an individual bank based on criteria set forth below:<br />
(a) Leverage capital: the minimum leverage ratio shall be 6.0%. In accordance with the Act, if a bank is pursuing or experiencing significant<br />
growth, has inadequate risk management systems, an inordinate level of risk, or less than satisfactory asset quality, management,<br />
earnings or liquidity, a higher minimum may be required.<br />
(b) Tier 1 Risk-based capital: the minimum Tier 1 ratio shall be 7.0%. In accordance with the Act, if a bank is pursuing or experiencing<br />
significant growth, has inadequate risk management systems, an inordinate level of risk, or less than satisfactory asset quality,<br />
management, earnings or liquidity, a higher minimum may be required.<br />
(c) Total Risk-Weighted capital: the minimum total ratio shall be 10.0%. In accordance with the Act, if a bank is pursuing or experiencing<br />
significant growth, has inadequate risk management systems, an inordinate level of risk, or less than satisfactory asset quality,<br />
management, earnings or liquidity, a higher minimum may be required.<br />
The bank follows the minimum ratios as prescribed by the Act.<br />
Leverage capital 7,48 7,39<br />
Tier 1 risk-based capital 10,20 9,22<br />
Total risk-weighted capital 13,32 11,73<br />
2010<br />
%<br />
105<br />
2009<br />
%
106 NEDNAMIBIA HOLDINGS LIMItED ANNUAL REPORt 2010<br />
NOtES tO tHE CONSOLIDAtED<br />
ANNUAL FINANCIAL STATEMENTS<br />
FOR THE YEAR ENDED 31 DEcEmbER 2010 (cONTINUED)<br />
Notes<br />
At fair value<br />
through<br />
profit and<br />
loss – held<br />
for trading<br />
Loans<br />
and<br />
receivables<br />
Available<br />
for<br />
sale<br />
Financial<br />
liabilities<br />
at<br />
amortised<br />
cost<br />
Non<strong>financial</strong><br />
assets and<br />
liabilities Total<br />
44. Statement of <strong>financial</strong> position – categories of <strong>financial</strong> instruments<br />
2010<br />
ASSETS<br />
cash and balances with central bank 4 135,678 – – – – 135,678<br />
Due from other banks 5 – 605,101 – – – 605,101<br />
Other short-term securities 6 342,068 – – – – 342,068<br />
Derivative <strong>financial</strong> instruments 7 9,200 – – – – 9,200<br />
Government and public sector<br />
securities 8 506,549 – – – – 506,549<br />
Loans and advances to customers 9 – 5,169,727 – – – 5,169,727<br />
Other assets 10 – 122,146 – – 34,688 156,834<br />
Investment in subsidiaries,<br />
associates, joint venture and<br />
listed investments 11 – – – – 31,137 31,137<br />
Property and equipment 12 – – – – 136,390 136,390<br />
computer software and<br />
development cost 13 – – – – 39,187 39,187<br />
Goodwill 14 – – – – 27,623 27,623<br />
Total assets 993,495 5,896,974 – – 269,025 7,159,494<br />
LIABILITIES<br />
Derivative <strong>financial</strong> instruments 7 8,864 – – – – 8,864<br />
Due to other banks 20 – – – 23,257 – 23,257<br />
Due to customers 21 – – – 4,550,688 - 4,550,688<br />
Negotiable certificates of<br />
deposits 22 – – – 1,447,000 - 1,447,000<br />
Other liabilities 23 – – – 121,008 17,685 138,693<br />
Deferred taxation liabilities 24 – – – – 117,122 117,122<br />
Policyholder liabilities under<br />
insurance contracts 25 – – – – 30,196 30,196<br />
Provision for post-retirement<br />
medical benefits 26 – – – – 7,540 7,540<br />
Long-term subordinated debt<br />
instruments 27 – – – 2,364 – 2,364<br />
Total liabilities 8,864 – – 6,144,317 172,543 6,325,724
Notes<br />
At fair value<br />
through<br />
profit and<br />
loss – held<br />
for trading<br />
Loans<br />
and<br />
receivables<br />
Available<br />
for<br />
sale<br />
Financial<br />
liabilities<br />
at<br />
amortised<br />
cost<br />
107<br />
Non<strong>financial</strong><br />
assets and<br />
liabilities Total<br />
44. Statement of <strong>financial</strong> position – categories of <strong>financial</strong> instruments (continued)<br />
2009<br />
ASSETS<br />
cash and balances with central<br />
bank 4 129,841 – – – 129,841<br />
Due from other banks 5 – 440,238 – – – 440,238<br />
Other short-term securities 6 157,223 – – – – 157,223<br />
Derivative <strong>financial</strong> instruments 7 3,782 – – – – 3,782<br />
Government and public sector<br />
securities 8 499,303 – – – – 499,303<br />
Loans and advances to customers 9 – 4,846,359 – – – 4,846,359<br />
Other assets 10 116,122 – – 23,599 139,721<br />
Investment in subsidiaries,<br />
associates, joint venture and<br />
listed investments 11 – – – – 29,595 29,595<br />
Property and equipment 12 – – – – 127,468 127,468<br />
computer software and<br />
development cost 13 – – – – 51,047 51,047<br />
Goodwill 15 – – – – 27,623 27,623<br />
Total assets 790,149 5,402,719 – – 259,332 6,452,200<br />
LIABILITIES<br />
Derivative <strong>financial</strong> instruments 7 3,786 – – – – 3,786<br />
Due to other banks 21 – – – 104 – 104<br />
Due to customers 22 – – – 4,188,985 – 4,188,985<br />
Negotiable certificates of deposits 23 – – – 1,354,320 – 1,354,320<br />
Other liabilities 24 – – – 77,693 10,683 88,376<br />
Deferred taxation liabilities 25 – – – – 103,774 103,774<br />
Policyholder liabilities under<br />
insurance contracts 26 – – – – 20,427 20,427<br />
Provision for post-retirement<br />
medical benefits 27 – – – – 7,223 7,223<br />
Long-term subordinated debt<br />
instruments 28 – – – 2,049 – 2,049<br />
Total liabilities 3,786 – – 5,623,151 142,107 5,769,044
108 NEDNAMIBIA HOLDINGS LIMItED ANNUAL REPORt 2010<br />
NOtES tO tHE CONSOLIDAtED<br />
ANNUAL FINANCIAL STATEMENTS<br />
FOR THE YEAR ENDED 31 DEcEmbER 2010 (cONTINUED)<br />
44. Statement of <strong>financial</strong> position – categories of <strong>financial</strong> instruments (continued)<br />
44.1 Statement of <strong>financial</strong> position – fair value hierachy of <strong>financial</strong> instruments<br />
Notes Level 1 Level 2<br />
Loans<br />
and<br />
receivables<br />
Financial<br />
liabilities<br />
at<br />
amortised<br />
cost<br />
Non<strong>financial</strong><br />
assets<br />
and<br />
liabilities Total<br />
2010<br />
ASSETS<br />
cash and balances with central bank 4 135,678 – – – – 135,678<br />
Due from other banks 5 – 605,101 – – 605,101<br />
Other short-term securities 6 342,068 – – – – 342,068<br />
Derivative <strong>financial</strong> instruments 7 9,200 – – – – 9,200<br />
Government and public sector securities 8 506,549 – – – – 506,549<br />
Loans and advances to customers 9 – – 5,169,727 – – 5,169,727<br />
Other assets 10 – – 122,146 – 34,688 156,834<br />
Investment in subsidiaries, associates, joint venture<br />
and listed investments 11 – – – – 31,137 31,137<br />
Property and equipment 12 – – – – 136,390 136,390<br />
computer software and development cost 13 – – – – 39,187 39,187<br />
Goodwill 14 – – – – 27,623 27,623<br />
Total assets 993,495 – 5,896,974 – 269,025 7,159,494<br />
LIABILITIES<br />
Derivative <strong>financial</strong> instruments 7 8,864 – – – – 8,864<br />
Due to other banks 20 – – – 23,257 – 23,257<br />
Due to customers 21 – – – 4,550,688 – 4,550,688<br />
Negotiable certificates of deposits 22 – – – 1,447,000 – 1,447,000<br />
Other liabilities 23 – – – 121,008 17,685 138,693<br />
Deferred taxation liabilities 24 – – – – 117,122 117,122<br />
Policyholder liabilities under insurance contracts 25 – – – – 30,196 30,196<br />
Provision for post-retirement medical benefits 26 – – – – 7,540 7,540<br />
Long-term subordinated debt instruments 27 – – – 2,364 – 2,364<br />
Total liabilities 8,864 – – 6,144,317 172,543 6,325,724
44. Statement of <strong>financial</strong> position – categories of <strong>financial</strong> instruments (continued)<br />
44.1 Statement of <strong>financial</strong> position – fair value hierachy of <strong>financial</strong> instruments (continued)<br />
Notes Level 1 Level 2<br />
Loans<br />
and<br />
receivables<br />
Financial<br />
liabilities<br />
at<br />
amortised<br />
cost<br />
The table above provides an analysis of <strong>financial</strong> instruments that are measured subsequent to initial recognition at fair value, grouped into levels<br />
1 to 3 based on the degree to which the fair value is observable.<br />
– Level 1 fair value measurements are those derived from quoted prices (unadjusted) in active markets for identical assets and liabilities;<br />
– Level 2 fair value measurements are those derived from inputs other than quoted prices included within level 1 that are observable for the asset<br />
and liablity, either directly or indirectly; and<br />
– Level 3 fair value measurements are those derived from valuation techniques that include inputs for asset or liability that are not based on<br />
observable market data.<br />
109<br />
Non<strong>financial</strong><br />
assets<br />
and<br />
liabilities Total<br />
2009<br />
ASSETS<br />
cash and balances with central bank 4 129,841 – – – 129,841<br />
Due from other banks 5 – 440,238 – – 440,238<br />
Other short-term securities 6 157,223 – – – – 157,223<br />
Derivative <strong>financial</strong> instruments 7 3,782 – – – – 3,782<br />
Government and public sector securities 8 499,303 – – – – 499,303<br />
Loans and advances to customers 9 – – 4,846,359 – – 4,846,359<br />
Other assets 10 – 116,122 – 23,599 139,721<br />
Investment in subsidiaries, associates, joint<br />
venture and listed investments<br />
11 – – – – 29,595 29,595<br />
Property and equipment 12 – – – – 127,468 127,468<br />
computer software and development cost 13 – – – – 51,047 51,047<br />
Goodwill 15 – – – – 27,623 27,623<br />
Total assets 790,149 – 5,402,719 – 259,332 6,452,200<br />
LIABILITIES<br />
Derivative <strong>financial</strong> instruments 7 3,786 – – – – 3,786<br />
Due to other banks 21 – – – 104 – 104<br />
Due to customers 22 – – – 4,188,985 – 4,188,985<br />
Negotiable certificates of deposits 23 – – – 1,354,320 – 1,354,320<br />
Other liabilities 24 – – – 77,693 10,683 88,376<br />
Deferred taxation liabilities 25 – – – – 103,774 103,774<br />
Policyholder liabilities under insurance contracts 26 – – – – 20,427 20,427<br />
Provision for post-retirement medical benefits 27 – – – – 7,223 7,223<br />
Long-term subordinated debt instruments 28 – – – 2,049 – 2,049<br />
Total liabilities 3,786 – – 5,623,151 142,107 5,769,044
110 NEDNAMIBIA HOLDINGS LIMItED ANNUAL REPORt 2010<br />
NOtES tO tHE CONSOLIDAtED<br />
ANNUAL FINANCIAL STATEMENTS<br />
FOR THE YEAR ENDED 31 DEcEmbER 2010 (cONTINUED)<br />
45. Liquidity risk<br />
Liquidity risk is the risk that an entity will encounter difficulty in meeting obligations associated with <strong>financial</strong> liabilities.<br />
45.1 Liquidity risk management<br />
by monitoring the maturity profile of the current statement of <strong>financial</strong> position as well as its expected future structure, ALcO proactively<br />
manages this risk and is able to address any potential mismatches in accordance with best banking practice. Refer to the section under the<br />
heading “Liquidity risk” in the corporate Governance report to the <strong>annual</strong> <strong>financial</strong> <strong>statements</strong> for more detail on liquidity risk management.<br />
Up<br />
Equity/<br />
to 3 3 – 6 6 – 12 1 – 5 Over 5 Non-<br />
months months months years years determined Total<br />
N$’000 N$’000 N$’000 N$’000 N$’000 N$’000 N$’000<br />
45.2 Expected liquidity risk<br />
2010<br />
ASSETS<br />
cash and balances with central bank 135,678 – – – – – 135,678<br />
Due from other banks 605,101 – – – – – 605,101<br />
Other short-term securities 21,599 153,235 – 167,234 – – 342,068<br />
Derivative <strong>financial</strong> instruments 8,438 610 152 – – – 9,200<br />
Government and public sector securities 375,202 44,591 29,147 9,193 48,416 – 506,549<br />
Loans and advances to customers 778,154 169,349 329,891 1,844,462 2,118,414 (70,543) 5,169,727<br />
Other assets 122,146 – – – – 34,688 156,834<br />
Investment in subsidiaries, associates, joint venture and<br />
listed investments – – – – – 31,137 31,137<br />
Property and equipment – – – – – 136,390 136,390<br />
computer software and development cost – – – – – 39,187 39,187<br />
Goodwill – – – – – 27,623 27,623<br />
Total assets 2,046,318 367,785 359,190 2,020,889 2,166,830 198,482 7,159,494<br />
EQUITY AND LIABILITIES<br />
Capital and reserves<br />
Share capital – – – – – 17,595 17,595<br />
Share premium – – – – – 99,536 99,536<br />
General risk reserve – – – – – 43,248 43,248<br />
Revaluation reserve – – – – – 33,217 33,217<br />
Share-based payment reserve – – – – – 18,883 18,883<br />
Available-for-sale reserve – – – – – 7,444 7,444<br />
Retained income – – – – – 607,578 607,578<br />
Shareholder's interest – – – – – 827,501 827,501<br />
Non-controlling interest – – – – – 6,269 6,269<br />
Total shareholder's equity and non-controlling interest – – – – – 833,770 833,770<br />
LIABILITIES<br />
Derivative <strong>financial</strong> instruments 8,115 604 145 – – – 8,864<br />
Due to other banks 23,257 – – – – – 23,257<br />
Due to customers 842,440 127,401 1,686,085 1,894,762 – – 4,550,688<br />
Negotiable certificates of deposits 779,749 303,630 363,621 – – – 1,447,000<br />
Other liabilities 121,008 – – – – 17,685 138,693<br />
Deferred taxation liabilities – – – – – 117,122 117,122<br />
Policyholder liabilities under insurance contracts – – – – – 30,196 30,196<br />
Provision for post-retirement medical benefits – – – – 7,540 – 7,540<br />
Long-term subordinated debt instruments – – – – 2,364 – 2,364<br />
Total liabilities 1,774,569 431,635 2,049,851 1,894,762 9,904 165,003 6,325,724<br />
Total equity and liabilities 1,774,569 431,635 2,049,851 1,894,762 9,904 998,773 7,159,494<br />
Net liquidity gap 271,749 (63,850) (1,690,661) 126,127 2,156,926 (800,291) –<br />
Cumulative net liquidity gap 271,749 207,899 (1,482,762) (1,356,635) 800,291 – –
111<br />
Up<br />
Equity /<br />
to 3 3 – 6 6 – 12 1 – 5 Over 5 Non-<br />
months months months years years determined Total<br />
N$’000 N$’000 N$’000 N$’000 N$’000 N$’000 N$’000<br />
45. Liquidity risk (continued)<br />
45.2 Expected liquidity risk (continued)<br />
2009<br />
ASSETS<br />
cash and balances with central bank 129,841 – – – – – 129,841<br />
Due from other banks 440,238 – – – – – 440,238<br />
Other short-term securities 31,600 30,101 – 95,522 – – 157,223<br />
Derivative <strong>financial</strong> instruments 2,559 – – 1,223 – – 3,782<br />
Government and public sector securities 361,121 46,177 27,621 3,249 61,135 – 499,303<br />
Loans and advances to customers 468,471 137,335 287,877 2,170,141 1,858,332 (75,797) 4,846,359<br />
Other assets 83,733 – 32,389 – – 23,599 139,721<br />
Investment in subsidiaries, associates, joint venture and<br />
listed investments – – – – – 29,595 29,595<br />
Property and equipment – – – – – 127,468 127,468<br />
computer software and development cost – – – – – 51,047 51,047<br />
Goodwill – – – – – 27,623 27,623<br />
Total assets 1,517,563 213,613 347,887 2,270,135 1,919,467 183,535 6,452,200<br />
EQUITY AND LIABILITIES<br />
Capital and reserves<br />
Share capital – – – – – 17,595 17,595<br />
Share premium – – – – – 99,536 99,536<br />
General risk reserve – – – – – 38,370 38,370<br />
Revaluation reserve – – – – – 27,452 27,452<br />
Share-based payment reserve – – – – – 19,835 19,835<br />
Available-for-sale reserve – – – – – 6,198 6,198<br />
Retained income – – – – – 468,394 468,394<br />
Shareholder's interest – – – – – 677,380 677,380<br />
Non-controlling interest – – – – – 5,776 5,776<br />
Total shareholder's equity and non-controlling interest – – – – – 683,156 683,156<br />
LIABILITIES<br />
Derivative <strong>financial</strong> instruments 2,620 – – 1,166 – – 3,786<br />
Due to other banks 104 – – – – – 104<br />
Due to customers 685,393 1,979,453 1,524,139 – – – 4,188,985<br />
Negotiable certificates of deposits 382,147 323,935 567,802 80,436 – – 1,354,320<br />
Other liabilities 77,693 – – – – 10,683 88,376<br />
Deferred taxation liabilities – – – – – 103,774 103,774<br />
Policyholder liabilities under insurance contracts – – – – – 20,427 20,427<br />
Provision for post-retirement medical benefits – – – – 7,223 – 7,223<br />
Long-term subordinated debt instruments – – – – 2,049 – 2,049<br />
Total liabilities 1,147,957 2,303,388 2,091,941 81,602 9,272 134,884 5,769,044<br />
Total equity and liabilities 1,147,957 2,303,388 2,091,941 81,602 9,272 818,040 6,452,200<br />
Net liquidity gap 369,606 (2,089,775) (1,744,054) 2,188,533 1,910,195 (634,505) –<br />
Cumulative net liquidity gap 369,606 (1,720,169) (3,464,223) (1,275,690) 634,505 – –
112 NEDNAMIBIA HOLDINGS LIMItED ANNUAL REPORt 2010<br />
NOtES tO tHE CONSOLIDAtED<br />
ANNUAL FINANCIAL STATEMENTS<br />
FOR THE YEAR ENDED 31 DEcEmbER 2010 (cONTINUED)<br />
On Up to 3 – 6 6 – 12 1 – 5 Over 5<br />
Equity /<br />
Non-<br />
demand 3 months months months years years determined Total<br />
N$’000 N$’000 N$’000 N$’000 N$’000 N$’000 N$’000 N$’000<br />
45. Liquidity risk (continued)<br />
45.3 Contractual liquidity risk analysis for <strong>financial</strong> liabilities<br />
2010<br />
LIABILITIES<br />
Derivative <strong>financial</strong> instruments – 8,115 604 145 – – – 8,864<br />
Due to other banks – – – – 27,784 – – 27,784<br />
Due to customers 3,733,531 554,025 95,573 113,953 – – – 4,497,082<br />
Negotiable certificates of deposits – 182,418 441,301 628,532 266,838 – – 1,519,089<br />
Other liabilities 116,410 – – – – – 17,685 134,095<br />
Deferred taxation liabilities – – – – – – 117,122 117,122<br />
Policyholder liabilities under insurance contracts – – – – – – 30,196 30,196<br />
Provision for post-retirement medical benefits – – – – – – 7,540 7,540<br />
Long-term subordinated debt instruments – – – – – 40,000 – 40,000<br />
Total liabilities 3,849,941 744,558 537,478 742,630 294,622 40,000 172,543 6,381,772<br />
2009<br />
LIABILITIES<br />
Derivative <strong>financial</strong> instruments – 2,620 – – 1,166 – – 3,786<br />
Due to other banks – 106 – – – – – 106<br />
Due to customers 3,332,612 452,607 311,699 106,561 – – – 4,203,479<br />
Negotiable certificates of deposits 65,177 319,663 334,126 598,169 89,390 – – 1,406,525<br />
Other liabilities 77,693 – – – – – 10,683 88,376<br />
Deferred taxation liabilities – – – – – – 103,774 103,774<br />
Policyholder liabilities under insurance contracts – – – – – – 20,427 20,427<br />
Provision for post-retirement medical benefits – – – – – – 7,223 7,223<br />
Long-term subordinated debt instruments – – – – – 40,000 – 40,000<br />
Total liabilities 3,475,482 774,996 645,825 704,730 90,556 40,000 142,107 5,873,696<br />
The maturity analysis detailed under the contractual liquidity risk analysis for <strong>financial</strong> liabilities include future interest.<br />
46. Market risk<br />
market risk is the risk that the fair value or future cash flows of a <strong>financial</strong> instrument will fluctuate because of changes in the market<br />
prices. market risk comprises three types of risk: currency risk, interest rate risk and other price risk.<br />
The <strong>Group</strong> is exposed to both currency and interest rate risk. Refer to note 47 and note 48 for disclosure regarding these risks.<br />
47. Currency risk<br />
currency risk is the risk that the fair value or future cash flows of a <strong>financial</strong> instrument will fluctuate because of changes in the foreign exchange<br />
rates.<br />
47.1 Currency risk management<br />
Foreign exchange dealers monitor exchange rate movements on an ongoing basis and operate within pre-approved limits, based on their<br />
knowledge, expertise and experience. The risk of money market/capital market instruments being repriced due to interest rate movements are<br />
also monitored by dealers to remain within approved limits. Refer to the section under the heading “currency risk” in the corporate Governance<br />
report to the <strong>annual</strong> <strong>financial</strong> <strong>statements</strong> for more detail on currency risk manangement.
47. Currency risk (continued)<br />
47.2 Currency risk profile<br />
2010<br />
ASSETS<br />
N$ EUR US$ GbP Other Total<br />
N$’000 N$’000 N$’000 N$’000 N$’000 N$’000<br />
cash and balances with central bank 99,741 2,212 33,331 149 245 135,678<br />
Due from other banks 353,485 22,696 228,699 221 – 605,101<br />
Other short-term securities 342,068 – – – – 342,068<br />
Derivative <strong>financial</strong> instruments 9,186 – 14 – – 9,200<br />
Government and public sector securities 506,549 – – – – 506,549<br />
Loans and advances to customers 5,129,694 1,264 38,767 – 2 5,169,727<br />
Other assets 156,834 – – – – 156,834<br />
Investment in subsidiaries, associates, joint<br />
venture and listed investments 31,137 – – – – 31,137<br />
Property and equipment 136,390 – – – – 136,390<br />
computer software and development cost 39,187 – – – – 39,187<br />
Goodwill 27,623 – – – – 27,623<br />
Total assets 6,831,894 26,172 300,811 370 247 7,159,494<br />
EQUITY AND LIABILITIES<br />
Capital and reserves<br />
Share capital 17,595 – – – – 17,595<br />
Share premium 99,536 – – – – 99,536<br />
General risk reserve 43,248 – – – – 43,248<br />
Revaluation reserve 33,217 – – – – 33,217<br />
Share-based payment reserve 18,883 – – – – 18,883<br />
Available-for-sale reserve 7,444 – – – – 7,444<br />
Retained income 607,578 – – – – 607,578<br />
Shareholder’s interest 827,501 – – – – 827,501<br />
Non-controlling interest<br />
Total shareholder’s equity and non-<br />
6,269 6,269<br />
controlling interest 833,770 – – – – 833,770<br />
LIABILITIES<br />
Derivative <strong>financial</strong> instruments 7,798 714 352 – – 8,864<br />
Due to other banks 23,257 – – – – 23,257<br />
Due to customers 4,224,627 25,833 300,180 48 – 4,550,688<br />
Negotiable certificates of deposits 1,447,000 – – – – 1,447,000<br />
Other liabilities 138,693 – – – – 138,693<br />
Deferred taxation liabilities 117,122 – – – – 117,122<br />
Policyholder liabilities under insurance<br />
contracts 30,196 – – – – 30,196<br />
Provision for post-retirement medical<br />
benefits 7,540 – – – – 7,540<br />
Long-term subordinated debt instruments 2,364 – – – – 2,364<br />
Total liabilities 5,998,597 26,547 300,532 48 – 6,325,724<br />
Total equity and liabilities 6,832,367 26,547 300,532 48 – 7,159,494<br />
Net balance sheet position (473) (375) 279 322 247 –<br />
off balance sheet net notional position – – – – – –<br />
rates of exchange – 8,86 6,63 10,29 0,33 –<br />
113
114 NEDNAMIBIA HOLDINGS LIMItED ANNUAL REPORt 2010<br />
NOtES tO tHE CONSOLIDAtED<br />
ANNUAL FINANCIAL STATEMENTS<br />
FOR THE YEAR ENDED 31 DEcEmbER 2010 (cONTINUED)<br />
47. Currency risk (continued)<br />
47.2 Currency risk profile (continued)<br />
2009<br />
ASSETS<br />
N$ EUR US$ GbP Other Total<br />
N$’000 N$’000 N$’000 N$’000 N$’000 N$’000<br />
cash and balances with central bank 89,450 5,762 34,123 506 – 129,841<br />
Due from other banks 203,364 49,160 120,863 262 66,589 440,238<br />
Other short-term securities 157,223 – – – – 157,223<br />
Derivative <strong>financial</strong> instruments 3,782 – – – – 3,782<br />
Government and public sector securities 499,303 – – – – 499,303<br />
Loans and advances to customers 4,844,297 593 1,469 – – 4,846,359<br />
Other assets 139,721 – – – – 139,721<br />
Investment in subsidiaries, associates, joint<br />
venture and listed investments 29,595 – – – – 29,595<br />
Property and equipment 127,468 – – – – 127,468<br />
computer software and development cost 51,047 – – – – 51,047<br />
Goodwill 27,623 – – – – 27,623<br />
Total assets 6 172 873 55 515 156 455 768 66 589 6 452 200<br />
EQUITY AND LIABILITIES<br />
Capital and reserves<br />
Share capital 17,595 – – – – 17,595<br />
Share premium 99,536 – – – – 99,536<br />
General risk reserve 38,370 – – – – 38,370<br />
Revaluation reserve 27,452 – – – – 27,452<br />
Share-based payment reserve 19,835 – – – – 19,835<br />
Available-for-sale reserve 6,198 – – – – 6,198<br />
Retained income 468,394 – – – – 468,394<br />
Shareholder's interest 677,380 – – – – 677,380<br />
Non-controlling interest 5,776 5,776<br />
Total shareholder's equity and noncontrolling<br />
interest 683,156 – – – – 683,156<br />
LIABILITIES<br />
Derivative <strong>financial</strong> instruments 3,786 – – – – 3,786<br />
Due to other banks 104 – – – – 104<br />
Due to customers 3,977,637 55,005 155,896 447 – 4,188,985<br />
Negotiable certificates of deposits 1,354,320 – – – – 1,354,320<br />
Other liabilities 88,376 – – – – 88,376<br />
Deferred taxation liabilities 103,774 – – – – 103,774<br />
Policyholder liabilities under insurance<br />
contracts 20,427 20,427<br />
Provision for post-retirement medical<br />
benefits 7,223 – – – – 7,223<br />
Long-term subordinated debt instruments 2,049 – – – – 2,049<br />
Total liabilities 5,557,696 55,005 155,896 447 – 5,769,044<br />
Total equity and liabilities 6,240,852 55,005 155,896 447 – 6,452,200<br />
Net balance sheet position (67,979) 510 559 321 66,589 –<br />
off-balance sheet net notional position – – – – – –<br />
rates of exchange – 10,63 7,38 11,89 – –
47. Currency risk (continued)<br />
47.3 Currency risk sensitivity analysis<br />
2010<br />
ASSETS<br />
Possible<br />
effect on the<br />
statement of<br />
comprehensive<br />
income*<br />
N$’000<br />
EUR<br />
N$<br />
Reasonable possible change (increase/decrease)<br />
US$<br />
N$<br />
GbP<br />
N$<br />
Other<br />
N$<br />
115<br />
balance<br />
as at<br />
reporting<br />
date<br />
N$’000<br />
cash and balances with central bank 7,237 1,13 1,21 1,17 1,17 135,678<br />
Due from other banks 50,214 1,13 1,21 1,17 – 605,101<br />
Other short-term securities – – – – – 342,068<br />
Derivative <strong>financial</strong> instruments 3 – 1,21 – – 9,200<br />
Government and public sector securities – – – – – 506,549<br />
Loans and advances to customers 8,172 1,13 1,21 – 1,17 5,169,727<br />
Other assets – – – – – 156,834<br />
Investment in subsidiaries, associates, joint<br />
venture and listed investments – – – – – 31,137<br />
Property and equipment – – – – – 136,390<br />
computer software and development cost – – – – – 39,187<br />
Goodwill – – – – – 27,623<br />
Total assets 65,626 7,159,494<br />
LIABILITIES<br />
Derivative <strong>financial</strong> instruments 165 1,13 1,21 – – 8,864<br />
Due to other banks – – – – – 23,257<br />
Due to customers 65,928 1,13 1,21 – – 4,550,688<br />
Negotiable certificates of deposits – – – – – 1,447,000<br />
Other liabilities – – – – – 138,693<br />
Deferred taxation liabilities – – – – – 117,122<br />
Policyholder liabilities under insurance<br />
contracts – – – – – 30,196<br />
Provision for post-retirement medical<br />
benefits – – – – – 7,540<br />
Long-term subordinated debt instruments – – – – – 2,364<br />
Total liabilities 66,093 6,325,724
116 NEDNAMIBIA HOLDINGS LIMItED ANNUAL REPORt 2010<br />
NOtES tO tHE CONSOLIDAtED<br />
ANNUAL FINANCIAL STATEMENTS<br />
FOR THE YEAR ENDED 31 DEcEmbER 2010 (cONTINUED)<br />
47. Currency risk (continued)<br />
47.3 Currency risk sensitivity analysis (continued)<br />
2009<br />
ASSETS<br />
Reasonable possible change (increase/decrease)<br />
Possible<br />
effect on the<br />
statement of<br />
comprehensive<br />
income* EUR US$ GbP Other<br />
balance<br />
as at<br />
reporting<br />
date<br />
N$’000 N$ N$ N$ N$ N$’000<br />
cash and balances with central bank 6,143 1,14 1,15 1,18 – 129,841<br />
Due from other banks 25,358 1,14 1,15 1,18 – 440,238<br />
Other short-term securities – – – – – 157,223<br />
Derivative <strong>financial</strong> instruments – – – – – 3,782<br />
Government and public sector securities – – – – – 499,303<br />
Loans and advances to customers 307 1,14 1,15 1,18 – 4,846,359<br />
Other assets – – – – – 139,721<br />
Investment in subsidiaries, associates, joint<br />
venture and listed investments – – – – – 29,595<br />
Property and equipment – – – – – 127,468<br />
computer software and development cost – – – – – 51,047<br />
Goodwill – – – – – 27,623<br />
Total assets 31,808 6,452,200<br />
LIABILITIES<br />
Derivative <strong>financial</strong> instruments – – – – – 3,786<br />
Due to other banks – – – – – 104<br />
Due to customers 28,532 1,14 1,15 1,18 – 4,188,985<br />
Negotiable certificates of deposits – – – – – 1,354,320<br />
Other liabilities – – – – – 88,376<br />
Deferred taxation liabilities – – – – – 103,774<br />
Policyholder liabilities under insurance<br />
contracts – – – – – 20,427<br />
Provision for post-retirement medical<br />
benefits – – – – – 7,223<br />
Long-term subordinated debt instruments – – – – – 2,049<br />
Total liabilities 28,532 5,769,044<br />
* The possible effect on the statement of comprehensive income has been determined by applying the possible change in currency to the<br />
outstanding balance reported at year-end. The possible change in currency can be either positive or negative and the figures reflected above are<br />
in absolute format. The possible change is based on forward rates for a 12-month period instrument by applying expectations determined by<br />
<strong>Nedbank</strong> <strong>Group</strong> <strong>Limited</strong>.<br />
48. Interest rate risk<br />
Interest rate risk is the risk that the fair value or future cash flows of a <strong>financial</strong> instrument will fluctuate because of changes in market interest rate.<br />
48.1 Interest rate risk management<br />
Interest rate risk is assessed through the use of traditional gap analysis techniques. Gap analysis measures the volumes of assets and<br />
liabilities subject to repricing within a given period. For this purpose assets and liabilities are classified according to their contractual repricing<br />
characteristics. Through the use of balance sheet stress testing and net interest income scenarios the impact of interest rate movements and risk<br />
concentrations can be identified and measured. Strategies are then developed for mitigating such risks. Refer to the section under the heading<br />
“Interest rate risk” in the corporate Governance report to the <strong>annual</strong> <strong>financial</strong> <strong>statements</strong> for more detail on interest rate risk management.
48. Interest rate risk (continued)<br />
48.2 Interest rate risk analysis<br />
2010<br />
ASSETS<br />
Up to 3 3 – 6 6 – 12 1 – 5 Over 5<br />
Noninterest<br />
months months months years years sensitive Total<br />
N$’000 N$’000 N$’000 N$’000 N$’000 N$’000 N$’000<br />
cash and balances with<br />
central bank – – – – – 135,678 135,678<br />
Due from other banks 605,101 – – – – – 605,101<br />
Other short-term securities 242,761 99,307 – – – – 342,068<br />
Derivative <strong>financial</strong><br />
instruments – – – – – 9,200 9,200<br />
Government and public<br />
sector securities 360,091 36,140 30,440 9,193 70,685 – 506,549<br />
Loans and advances to<br />
customers 5,198,743 450 899 10,472 29,706 (70,543) 5,169,727<br />
Other assets – – – – – 156,834 156,834<br />
Investment in subsidiaries,<br />
associates, joint venture and<br />
listed investments – – – – – 31,137 31,137<br />
Property and equipment – – – – – 136,390 136,390<br />
computer software and<br />
development cost – – – – – 39,187 39,187<br />
Goodwill – – – – – 27,623 27,623<br />
Total assets 6,406,696 135,897 31,339 19,665 100,391 465,506 7,159,494<br />
EQUITY AND LIABILITIES<br />
Capital and reserves<br />
Share capital – – – – – 17,595 17,595<br />
Share premium – – – – – 99,536 99,536<br />
General risk reserve – – – – – 43,248 43,248<br />
Revaluation reserve – – – – – 33,217 33,217<br />
Share-based payment reserve – – – – – 18,883 18,883<br />
Available-for-sale reserve – – – – – 7,444 7,444<br />
Retained income – – – – – 607,578 607,578<br />
Shareholder's interest – – – – – 827,501 827,501<br />
Non-controlling interest – – – – – 6,269 6,269<br />
Total shareholder's equity<br />
and non-controlling<br />
interest – – – – – 833,770 833,770<br />
117
118 NEDNAMIBIA HOLDINGS LIMItED ANNUAL REPORt 2010<br />
NOtES tO tHE CONSOLIDAtED<br />
ANNUAL FINANCIAL STATEMENTS<br />
FOR THE YEAR ENDED 31 DEcEmbER 2010 (cONTINUED)<br />
48. Interest rate risk (continued)<br />
48.2 Interest rate risk analysis (continued)<br />
LIABILITIES<br />
Up to 3 3 – 6 6 – 12 1 – 5 Over 5<br />
Noninterest<br />
months months months years years sensitive Total<br />
N$’000 N$’000 N$’000 N$’000 N$’000 N$’000 N$’000<br />
Derivative <strong>financial</strong><br />
instruments – – – – – 8,864 8,864<br />
Due to other banks 23,257 – – – – – 23,257<br />
Due to customers 4,020,043 94,046 104,502 5,828 – 326,269 4,550,688<br />
Negotiable certificates of<br />
deposits 800,062 283,317 363,621 – – – 1,447,000<br />
Other liabilities – – – – – 138,693 138,693<br />
Deferred taxation liabilities – – – – – 117,122 117,122<br />
Policyholder liabilities under<br />
insurance contracts – – – – – 30,196 30,196<br />
Provision for post-retirement<br />
medical benefits – – – 7,540 – – 7,540<br />
Long-term subordinated<br />
debt instruments – – – – 2,364 – 2,364<br />
Total liabilities 4,843,362 377,363 468,123 13,368 2,364 621,144 6,325,724<br />
Total equity and liabilities 4,843,362 377,363 468,123 13,368 2,364 1,454,914 7,159,494<br />
on-balance sheet interest<br />
sensitivity gap 1,563,334 (241,466) (436,784) 6,297 98,027 (989,408) –<br />
Cumulative on-balance<br />
sheet interest<br />
sensitivity gap 1,563,334 1,321,868 885,084 891,381 989,405 – –<br />
2009<br />
ASSETS<br />
cash and balances with<br />
central bank – – – – – 129,841 129,841<br />
Due from other banks 440,238 – – – – – 440,238<br />
Other short-term securities 157,223 – – – – – 157,223<br />
Derivative <strong>financial</strong><br />
instruments – – – – – 3,782 3,782<br />
Government and public<br />
sector securities 361,121 46,177 27,621 3,249 61,135 – 499,303<br />
Loans and advances to<br />
customers 4,773,527 1,417 – – – 71,415 4,846,359<br />
Other assets – – 32,389 – – 107,332 139,721<br />
Investment in subsidiaries,<br />
associates, joint venture and<br />
listed investments – – – – – 29,595 29,595<br />
Property and equipment – – – – – 127,468 127,468<br />
computer software and<br />
development cost – – – – – 51,047 51,047<br />
Goodwill – – – – – 27,623 27,623<br />
Total assets 5,732,109 47,594 60,010 3,249 61,135 548,103 6,452,200
48. Interest rate risk (continued)<br />
48.2 Interest rate risk analysis (continued)<br />
EQUITY AND LIABILITIES<br />
Capital and reserves<br />
119<br />
Up to 3 3 – 6 6 – 12 1 – 5 Over 5<br />
Noninterest<br />
months months months years years sensitive Total<br />
N$’000 N$’000 N$’000 N$’000 N$’000 N$’000 N$’000<br />
Share capital – – – – – 17,595 17,595<br />
Share premium – – – – – 99,536 99,536<br />
General risk reserve – – – – – 38,370 38,370<br />
Revaluation reserve – – – – – 27,452 27,452<br />
Share-based payment<br />
reserve – – – – – 19,835 19,835<br />
Available-for-sale reserve – – – – – 6,198 6,198<br />
Retained income – – – – – 468,394 468,394<br />
Shareholder's interest – – – – – 677,380 677,380<br />
Non-controlling interest – – – – – 5,776 5,776<br />
Total shareholder's equity<br />
and non-controlling<br />
interest – – – – – 683,156 683,156<br />
LIABILITIES<br />
Derivative <strong>financial</strong><br />
instruments – – – 85 – 3,701 3,786<br />
Due to other banks 104 – – – – – 104<br />
Due to customers 3,576,221 199,719 87,065 15,769 – 310,211 4,188,985<br />
Negotiable certificates of<br />
deposits 801,443 273,843 279,034 – – – 1,354,320<br />
Other liabilities – – – – – 88,376 88,376<br />
Deferred taxation liabilities – – – – – 103,774 103,774<br />
Policyholder liabilities under<br />
insurance contracts – – – – – 20,427 20,427<br />
Provision for post-retirement<br />
medical benefits – – – 7,223 – – 7,223<br />
Long-term subordinated<br />
debt instruments – – – – 2,049 – 2,049<br />
Total liabilities 4,377,768 473,562 366,099 23,077 2,049 526,489 5,769,044<br />
Total equity and liabilities 4,377,768 473,562 366,099 23,077 2,049 1,209,645 6,452,200<br />
on-balance sheet interest<br />
sensitivity gap 1,354,341 (425,968) (306,089) (19,828) 59,086 (661,542) –<br />
Cumulative on-balance<br />
sheet interest<br />
sensitivity gap 1,354,341 928,373 622,284 602,456 661,542 – –
120 NEDNAMIBIA HOLDINGS LIMItED ANNUAL REPORt 2010<br />
NOtES tO tHE CONSOLIDAtED<br />
ANNUAL FINANCIAL STATEMENTS<br />
FOR THE YEAR ENDED 31 DEcEmbER 2010 (cONTINUED)<br />
48. Interest rate risk (continued)<br />
48.3 Interest rate risk sensitivity<br />
2010<br />
ASSETS<br />
Possible<br />
effect<br />
on the<br />
statement<br />
balance<br />
of compre- Reasonable<br />
Non-<br />
as at<br />
hensive possible Rate interest Fixed Variable reporting<br />
income* change sensitive sensitive rate rate date<br />
N$’000 % N$’000 N$’000 N$’000 N$’000 N$’000<br />
cash and balances with central<br />
bank – – – 135,678 – – 135,678<br />
Due from other banks 6,051 1,0 605,101 – – 605,101 605,101<br />
Other short-term securities 3,421 1,0 342,068 – – 342,068 342,068<br />
Derivative <strong>financial</strong> instruments – – – 9,200 – – 9,200<br />
Government and public sector<br />
securities 5,065 1,0 506,549 – 506,549 – 506,549<br />
Loans and advances to<br />
customers 52,403 1,0 5,240,270 (70,543) – 5,240,270 5,169,727<br />
Other assets – – – 156,834 – – 156,834<br />
Investment in subsidiaries,<br />
associates, joint venture and<br />
listed investments – – – 31,137 – – 31,137<br />
Property and equipment – – – 136,390 – – 136,390<br />
computer software and<br />
development cost – – – 39,187 – – 39,187<br />
Goodwill – – – 27,623 – – 27,623<br />
Total assets 66,940 6,693,988 465,506 506,549 6,187,439 7,159,494<br />
LIABILITIES<br />
Derivative <strong>financial</strong> instruments – – – 8,864 – – 8,864<br />
Due to other banks 233 1,0 23,257 – 23,257 – 23,257<br />
Due to customers 42,244 1,0 4,224,419 326,269 740,537 3,483,882 4,550,688<br />
Negotiable certificates of<br />
deposits 14,470 1,0 1,447,000 – 662,070 784,930 1,447,000<br />
Other liabilities – – – 138,693 – – 138,693<br />
Deferred taxation liabilities – – – 117,122 – – 117,122<br />
Policyholder liabilities under<br />
insurance contracts – – – 30,196 – – 30,196<br />
Provision for post-retirement<br />
medical benefits 75 1,0 7,540 – – 7,540 7,540<br />
Long-term subordinated debt<br />
instruments – – 2,364 – 2,364 – 2,364<br />
Total liabilities 57,022 5,704,580 621,144 1,428,228 4,276,352 6,325,724
48. Interest rate risk (continued)<br />
48.3 Interest rate risk sensitivity (continued)<br />
2009<br />
ASSETS<br />
Possible<br />
effect<br />
on the<br />
statement<br />
balance<br />
of compre- Reasonable<br />
Non-<br />
as at<br />
hensive possible Rate interest Fixed Variable reporting<br />
income* change sensitive sensitive rate rate date<br />
N$’000 % N$’000 N$’000 N$’000 N$’000 N$’000<br />
cash and balances with central bank – – – 129,841 – – 129,841<br />
Due from other banks 2,201 0,5 440,238 – – 440,238 440,238<br />
Other short-term securities 1,572 1,0 157,223 – – 157,223 157,223<br />
Derivative <strong>financial</strong> instruments – – – 3,782 – – 3,782<br />
Government and public sector<br />
securities 4,993 1,0 499,303 – 499,303 – 499,303<br />
Loans and advances to<br />
customers 23,875 0,5 4,774,944 71,415 – 4,774,944 4,846,359<br />
Other assets – – 32,389 107,332 32,389 – 139,721<br />
Investment in subsidiaries,<br />
associates, joint venture and<br />
listed investments – – – 29,595 – – 29,595<br />
Property and equipment – – – 127,468 – – 127,468<br />
computer software and<br />
development cost – – – 51,047 – – 51,047<br />
Goodwill – – – 27,623 – – 27,623<br />
Total assets 32,641 5,904,097 548,103 531,692 5,372,405 6,452,200<br />
LIABILITIES<br />
Derivative <strong>financial</strong> instruments – 1 85 3,701 – 85 3,786<br />
Due to other banks – – 104 – 104 – 104<br />
Due to customers 19,394 0,5 3,878,774 310,211 2,090,874 1,787,900 4,188,985<br />
Negotiable certificates of<br />
deposits 13,543 1,0 1,354,320 – – 1,354,320 1,354,320<br />
Other liabilities – – – 88,376 – – 88,376<br />
Deferred taxation liabilities – – – 103,774 – – 103,774<br />
Policyholder liabilities under<br />
insurance contracts – – – 20,427 – – 20,427<br />
Provision for post-retirement<br />
medical benefits 36 0,5 7,223 – – 7,223 7,223<br />
Long-term subordinated debt<br />
instruments – – 2,049 – 2,049 – 2,049<br />
Total liabilities 32,973 5,242,555 526,489 2,093,027 3,149,528 5,769,044<br />
* The possible effect on the statement of comprehensive income has been determined by applying the possible change in interest rate to the<br />
outstanding balance reported at year-end. The possible change in interest rate can be either positive or negative and the figures reflected above<br />
are in absolute format. A linear risk relationship has been assumed to interest rate moves. Assumptions used in quantifying interest rate risk are in<br />
line with those used by <strong>Nedbank</strong> <strong>Group</strong> <strong>Limited</strong>. The possible change in interest rate is determined by means of applying a prime/call interest rate<br />
differential similar to those used in determining forward interest rates of a 12-month instrument.<br />
49. Credit risk<br />
credit risk refers to the risk that a counterparty will default on its contractual obligations resulting in <strong>financial</strong> loss to the <strong>Group</strong>.<br />
49.1 Credit risk management<br />
The credit Department assesses all exposures and monitors the implementation of the <strong>Group</strong>’s credit policy to ensure that the extension, control and<br />
maintenance of credit, as well as the process of providing for and writing off of bad debts, are executed in a proper way and within laid-down policy.<br />
The credit committee approves all third-party risks, including sovereign and counterparty risks, within a prescribed limit, as delegated by the<br />
board of Directors. All credit exposures in excess of the authorised limits of the credit committee are referred to the <strong>Nedbank</strong> Africa credit<br />
committee for approval.<br />
Refer to the section under the heading “credit risk” in the corporate Governance report to the <strong>annual</strong> <strong>financial</strong> <strong>statements</strong> for more detail on<br />
credit risk manangement.<br />
121
122 NEDNAMIBIA HOLDINGS LIMItED ANNUAL REPORt 2010<br />
NOtES tO tHE CONSOLIDAtED<br />
ANNUAL FINANCIAL STATEMENTS<br />
FOR THE YEAR ENDED 31 DEcEmbER 2010 (cONTINUED)<br />
49. Credit risk (continued)<br />
49.2 Credit risk analysis<br />
Classification: Neither past due nor impaired<br />
NGR 0 NGR 1 NGR 5 – 7 NGR 10<br />
NGR 11<br />
– 13 NGR 14 NGR 15<br />
N$’000 N$’000 N$’000 N$’000 N$’000 N$’000 N$’000<br />
2010<br />
cash and balances with<br />
central bank 135,678 – – – – – –<br />
Due from other banks – – 605,101 – – – –<br />
Other short-term securities<br />
Derivative <strong>financial</strong><br />
– – 342,068 – – – –<br />
instruments<br />
Government and public sector<br />
– – 9,200 – – – –<br />
securities<br />
Loans and advances to<br />
– – – 506,549 – – –<br />
customers – – 232,451 1,016 223,618 29,920 71,579<br />
– Home loans – – – – 2,420 1,666 2,958<br />
– Other loans and overdrafts<br />
– Net leases and instalment<br />
– – 232,451 – 158,186 9,078 59,408<br />
debtors – – – 1,016 63,012 19,176 9,213<br />
– Preference shares – – – – – – –<br />
– micro-loans – – – – – – –<br />
Other assets<br />
Investment in subsidiaries,<br />
associates, joint venture and<br />
– 122,146 – – – – –<br />
listed investments – – – – – – –<br />
Property and equipment – – – – – – –<br />
computer software and<br />
development cost<br />
– – – – – – –<br />
Goodwill – – – – – – –<br />
2009<br />
135,678 122,146 1,188,820 507,565 223,618 29,920 71,579<br />
cash and balances with<br />
central bank 129,841 – – – – – –<br />
Due from other banks – – 440,238 – – – –<br />
Other short-term securities – – 157,223 – – – –<br />
Derivative <strong>financial</strong><br />
instruments<br />
– – 3,782 – – – –<br />
Government and public sector<br />
– – – 499,303 – – –<br />
securities<br />
Loans and advances to<br />
customers 154 5,415 61,561 – 135,524 13,685 99,447<br />
– Home loans – 1,227 – – 2,591 1,927 5,261<br />
– Other loans and overdrafts – 4,188 61,561 – 49,227 9,532 54,993<br />
– Net leases and instalment<br />
debtors 154 – – – 83,706 2,226 39,193<br />
– Preference shares – – – – – – –<br />
– micro-loans – – – – – – –<br />
Other assets – 83,733 – – – – –<br />
Investment in subsidiaries,<br />
associates, joint venture and<br />
listed investments – – – – – – –<br />
Property and equipment – – – – – – –<br />
computer software and<br />
development cost – – – – – – –<br />
Goodwill – – – – – – –<br />
129,995 89,148 662,804 499,303 135,524 13,685 99,447
NGR 21<br />
Non-IFRS7<br />
NGR 16 NGR 17 NGR 18 NGR 19 NGR 20 - 22 NGR 24 NGR 25 Instruments Total<br />
N$’000 N$’000 N$’000 N$’000 N$’000 N$’000 N$’000 N$’000 N$’000 N$’000<br />
– – – – – – – – – 135,678<br />
– – – – – – – – – 605,101<br />
– – – – – – – – – 342,068<br />
– – – – – – – – – 9,200<br />
– – – – – – – – – 506,549<br />
41,056 172,268 105,277 25,921 105,782 52,198 3,802,382 20,630 – 4,884,098<br />
3,125 1,432 4,618 1,396 14,234 3,883 1,962,105 939 – 1,998,776<br />
30,299 138,972 52,766 20,572 84,896 39,638 881,374 18,874 – 1,726,514<br />
7,632 31,864 6,143 3,953 6,652 8,677 641,325 817 – 799,480<br />
– – 41,750 – – – – – – 41,750<br />
– – – – – – 317,578 – – 317,578<br />
– – – – – – – – 34,688 156,834<br />
– – – – – – – – 31,137 31,137<br />
– – – – – – – – 136,390 136,390<br />
– – – – – – – – 39,187 39,187<br />
– – – – – – – – 27,623 27,623<br />
41,056 172,268 105,277 25,921 105,782 52,198 3,802,382 20,630 269,025 6,873,865<br />
– – – – – – – – – 129,841<br />
– – – – – – – – – 440,238<br />
– – – – – – – – – 157,223<br />
– – – – – – – – – 3,782<br />
– – – – – – – – – 499,303<br />
37,864 41,836 81,519 7,179 16,523 12,777 3,788,367 9,647 – 4,311,498<br />
5,087 1,999 1,472 1,425 – 651 1,666,008 958 – 1,688,606<br />
30,210 34,628 32,085 3,215 15,137 8,054 1,343,326 8,689 – 1,654,845<br />
2,567 5,209 6,212 2,539 1,386 4,072 568,213 – – 715,477<br />
– – 41,750 – – – – – – 41,750<br />
– – – – – – 210,820 – – 210,820<br />
– – 32,389 – – – – – 23,599 139,721<br />
– – – – – – – – 29,595 29,595<br />
– – – – – – – – 127,468 127,468<br />
– – – – – – – – 51,047 51,047<br />
– – – – – – – – 27,623 27,623<br />
37,864 41,836 113,908 7,179 16,523 12,777 3,788,367 9,647 259,332 5,917,339<br />
123
124 NEDNAMIBIA HOLDINGS LIMItED ANNUAL REPORt 2010<br />
NOtES tO tHE CONSOLIDAtED<br />
ANNUAL FINANCIAL STATEMENTS<br />
FOR THE YEAR ENDED 31 DEcEmbER 2010 (cONTINUED)<br />
49. Credit risk (continued)<br />
49.2 Credit risk analysis (continued)<br />
2010 2009<br />
N$’000 N$’000<br />
Classification: renegotiated<br />
cash and balances with central bank<br />
Due from other banks<br />
Other short-term securities<br />
Derivative <strong>financial</strong> instruments<br />
Government and public sector securities<br />
Loans and advances to customers<br />
– Home loans<br />
– Other loans and overdrafts<br />
– Net leases and instalment debtors<br />
– Preference shares<br />
– micro-loans<br />
Other assets<br />
Investment in subsidiaries, associates, joint venture and listed investments<br />
Property and equipment<br />
computer software and development cost<br />
Goodwill<br />
–<br />
–<br />
–<br />
–<br />
–<br />
71<br />
71<br />
–<br />
–<br />
–<br />
–<br />
–<br />
–<br />
–<br />
–<br />
–<br />
–<br />
–<br />
–<br />
–<br />
–<br />
9,067<br />
5,071<br />
3,909<br />
–<br />
–<br />
87<br />
–<br />
–<br />
–<br />
–<br />
–<br />
Classification: Past due 71 9,067<br />
cash and balances with central bank<br />
Due from other banks<br />
Other short-term securities<br />
Derivative <strong>financial</strong> instruments<br />
Government and public sector securities<br />
Loans and advances to customers<br />
– Home loans<br />
– Other loans and overdrafts<br />
– Net leases and instalment debtors<br />
– Preference shares<br />
– micro-loans<br />
Other assets<br />
Investment in subsidiaries, associates, joint venture and listed investments<br />
Property and equipment<br />
computer software and development cost<br />
Goodwill<br />
–<br />
–<br />
–<br />
–<br />
–<br />
33,171<br />
29,752<br />
395<br />
2,995<br />
–<br />
29<br />
–<br />
–<br />
–<br />
–<br />
–<br />
–<br />
–<br />
–<br />
–<br />
–<br />
55,864<br />
27,749<br />
22,009<br />
3,401<br />
–<br />
2,705<br />
–<br />
–<br />
–<br />
–<br />
–<br />
Classification: Impaired 33,171 55,864<br />
cash and balances with central bank<br />
Due from other banks<br />
Other short-term securities<br />
Derivative <strong>financial</strong> instruments<br />
Government and public sector securities<br />
Loans and advances to customers<br />
– Home loans<br />
– Other loans and overdrafts<br />
– Net leases and instalment debtors<br />
– Preference shares<br />
– micro-loans<br />
Impairment of advances (note 30)<br />
– Home loans<br />
– Other loans and overdrafts<br />
– Net leases and instalment debtors<br />
– Preference shares<br />
– micro-loans<br />
Other assets<br />
Investment in subsidiaries, associates, joint venture and listed investments<br />
Property and equipment<br />
computer software and development cost<br />
Goodwill<br />
–<br />
–<br />
–<br />
–<br />
–<br />
323,001<br />
183,294<br />
57,157<br />
48,566<br />
–<br />
33,984<br />
(70,543)<br />
(19,991)<br />
(26,975)<br />
(7,559)<br />
–<br />
(16,018)<br />
–<br />
–<br />
–<br />
–<br />
–<br />
–<br />
–<br />
–<br />
–<br />
–<br />
554,794<br />
194,909<br />
178,492<br />
72,324<br />
–<br />
109,069<br />
(75,797)<br />
(15,373)<br />
(34,808)<br />
(9,737)<br />
–<br />
(15,879)<br />
–<br />
–<br />
–<br />
–<br />
–<br />
252,458 478,997
49. Credit risk (continued)<br />
49.3 Credit risk: Maximum exposure<br />
125<br />
2010 2009<br />
N$’000 N$’000<br />
cash and balances with central bank 135,678 129,802<br />
Due from other banks 605,101 457,918<br />
Other short-term securities 342,068 157,223<br />
Derivative <strong>financial</strong> instruments 9,200 3,782<br />
Government and public sector securities 506,549 492,397<br />
Loans and advances to customers 5,169,727 4,854,749<br />
Other assets 156,834 139,721<br />
Investment in subsidiaries and associates – –<br />
Investment in listed investments – –<br />
Property and equipment – –<br />
computer software and development cost – –<br />
Goodwill – –<br />
49.4 Credit risk: Collateral held in respect of 49.3<br />
6,925,157 6,235,592<br />
collateral is only held in respect of loans and advances. below follows a description of the type of collateral held per class of loans and advances to<br />
customers:<br />
Home loans: Secured by commercial property mortgage, residential property mortgage, suretyship, guarantees. cession of life cover and fire cover<br />
is not considered security but is recommended as additional safety measure in the event of death or fire.<br />
other loans and overdrafts: cession of life cover, secured by non-movable property, suretyship, guarantees, unsecured.<br />
Preference share finance: Put option for sale of preference shares, guarantees from foreign banks.<br />
Leases and instalment debtors: Secured by movable property under debt granted.<br />
Micro-loans: Unsecured<br />
cash and balances with central bank – –<br />
Due from other banks – –<br />
Other short-term securities – –<br />
Derivative <strong>financial</strong> instruments – –<br />
Government and public sector securities – –<br />
Loans and advances to customers 5,175,140 4,844,503<br />
– Home loans 2,197,244 1,895,891<br />
– Other loans and overdrafts 1,757,091 1,820,538<br />
– Net leases and instalment debtors 843,482 783,311<br />
– Preference shares 41,750 41,750<br />
– micro-loans 335,573 303,013<br />
Other assets – –<br />
Investment in subsidiaries and associates – –<br />
Investment in listed investments – –<br />
Property and equipment – –<br />
computer software and development cost – –<br />
49.5 Credit risk: Fair value of collateral<br />
The <strong>Group</strong> determines the fair value only on the following instances:<br />
- on the date the loan or advance is initiated; and/or<br />
- when the loan or advance is being renegotiated; or<br />
- when a loan or advance has been transferred to the legal department of the <strong>Group</strong> for collection.<br />
5,175,140 4,844,503<br />
At reporting date the fair value of the collateral held has not been provided due to the impracticality thereof. The system currently maintaining the<br />
collateral does not have the fair value readily available. The fair value of the collateral is determined by means of a manual process and the volume<br />
of collateral held makes it impractical for the <strong>Group</strong>.
126 NEDNAMIBIA HOLDINGS LIMItED ANNUAL REPORt 2010<br />
StAtEMENt OF<br />
FINANCIAL PoSITIoN<br />
AS AT 31 DEcEmbER 2010<br />
2010 2009<br />
Notes N$’000 N$’000<br />
ASSETS<br />
4 469 1,525<br />
Due from other banks 5 1,326 896<br />
Other assets<br />
Investment in subsidiaries<br />
6 133,642 133,642<br />
Total assets<br />
135,437 136,063<br />
EQUITY AND LIABILITIES<br />
Capital and reserves<br />
Share capital 7 17,595 17,595<br />
Share premium 7 99,536 99,536<br />
Retained income 18,305 18,926<br />
Shareholder’s interest 135,436 136,057<br />
Liabilities<br />
Other liabilities<br />
Total liabilities<br />
Total equity and liabilities<br />
8 1 6<br />
1 6<br />
135,437 136,063<br />
StAtEMENt OF<br />
CoMPrEHENSIVE INCoME<br />
FOR THE YEAR ENDED 31 DEcEmbER 2010<br />
2010 2009<br />
Notes N$’000 N$’000<br />
Interest and similar income<br />
Interest expense and similar charges<br />
26<br />
–<br />
98<br />
15<br />
Net interest income 9 26 83<br />
Non-interest income 10 – 2,033<br />
Net income 26 2,116<br />
Operating expenditure 11 643 188<br />
(Loss)/profit before taxation (617) 1,928<br />
Taxation 12 4 27<br />
Total (loss)/profit after taxation (621) 1,901<br />
other comprehensive income – –<br />
Total comprehensive (loss)/income (621) 1,901<br />
Total (loss)/profit after taxation attributable to:<br />
Owners of the parent (621) 1,901<br />
Total (loss)/profit after taxation<br />
Total comprehensive (loss)/income attributable to:<br />
(621) 1,901<br />
Owners of the parent (621) 1,901<br />
Total comprehensive (loss)/income (621) 1,901
StAtEMENt OF<br />
CHANGES IN EQUITY<br />
FOR THE YEAR ENDED 31 DEcEmbER 2010<br />
Share<br />
Share Retained<br />
Total<br />
shareholder's<br />
capital premium income interest<br />
N$’000 N$’000 N$’000 N$’000<br />
balance at 1 January 2009 17,595 99,536 17,025 134,156<br />
Net profit for the year attributable to the equity holders of the<br />
parent – – 1,901 1,901<br />
balance at 31 December 2009 17,595 99,536 18,926 136,057<br />
Net loss for the year attributable to the equity holders of<br />
the parent – – (621) (621)<br />
Balance at 31 December 2010 17,595 99,536 18,305 135,436<br />
StAtEMENt OF<br />
CASH FLoWS<br />
FOR THE YEAR ENDED 31 DEcEmbER 2010<br />
2010 2009<br />
Notes N$’000 N$’000<br />
Cash generated by operating activities 13.1 – –<br />
cash received from customers 13.2 26 98<br />
cash paid to customers 13.3 – (15)<br />
cash paid to employees and suppliers (643) (188)<br />
Dividends received – 2,033<br />
cash movements in advances and other accounts 622 (1,779)<br />
cash movements in operating liabilities 13.4 (5) (149)<br />
Cash and short-term funds generated – –<br />
Cash and short-term funds at beginning of the year – –<br />
Cash and short-term funds at end of the year – –<br />
127
128 NEDNAMIBIA HOLDINGS LIMItED ANNUAL REPORt 2010<br />
NOtES tO tHE COMPANY<br />
ANNUAL FINANCIAL STATEMENTS<br />
FOR THE YEAR ENDED 31 DEcEmbER 2010<br />
1. Basis of preparation<br />
Refer to the notes to the consolidated <strong>annual</strong> <strong>financial</strong> <strong>statements</strong>.<br />
2. Adoption of new and revised standards<br />
Refer to the notes to the consolidated <strong>annual</strong> <strong>financial</strong> <strong>statements</strong>.<br />
3. Siginificant accounting policies<br />
Refer to the notes to the consolidated <strong>annual</strong> <strong>financial</strong> <strong>statements</strong>.<br />
4. Due from other banks<br />
Financial assets classification: Loans and receivables<br />
2010 2009<br />
N$’000 N$’000<br />
Placements with other banks 469 1,525<br />
5. other assets<br />
Financial assets classification: Loans and receivables<br />
Debtors 4 –<br />
Other investments 1,322 –<br />
Shareholder's loan – 896<br />
1,326 896<br />
6. Investment in subsidiaries<br />
Investment in subsidiaries 133,642 133,642<br />
– carrying value at beginning of the year 133,642 133,642<br />
– Transfer from non-current assets held for sale – –<br />
Market valuation 133,642 133,642
6. Investment in subsidiaries (continued)<br />
Subsidiary companies<br />
NedProperties<br />
(Proprietary) <strong>Limited</strong><br />
NedNamibia Life<br />
Assurance company<br />
<strong>Limited</strong><br />
<strong>Nedbank</strong> Namibia<br />
<strong>Limited</strong><br />
Nedcapital Namibia<br />
(Proprietary) <strong>Limited</strong><br />
NIb mining Finance<br />
(Proprietary) <strong>Limited</strong><br />
Nedplan Insurance<br />
brokers Namibia<br />
(Proprietary) <strong>Limited</strong><br />
Joint ventures<br />
NamPost Financial<br />
brokers (Proprietary)<br />
<strong>Limited</strong><br />
Nature of<br />
business<br />
Issued ordinary share<br />
capital Proportion held Shares at cost<br />
2010<br />
’000<br />
2009<br />
’000<br />
2010<br />
%<br />
2009<br />
%<br />
2010<br />
N$’000<br />
2009<br />
N$’000<br />
Aggregate profits/<br />
(losses) after tax<br />
of subsidiary/joint<br />
venture<br />
2010<br />
N$’000<br />
2009<br />
N$’000<br />
Property<br />
company – – 100 100 4,000 4,000 455 567<br />
Insurance<br />
company<br />
4,000 4,000 100 100 4,000 4,000 12,447 5,812<br />
banking<br />
company 67,759 67,759 100 100 125,634 125,634 121,947 101,434<br />
Financing<br />
company 8 8 100 100 8 8 3,984 2,986<br />
Financing<br />
company – – 100 100 – – (24) 73<br />
Insurance<br />
broker<br />
– – 100 100 – – 791 408<br />
Finance<br />
services<br />
broker – – – – – – – (728)<br />
The joint venture was sold on 1 January 2010 to Namibia Post <strong>Limited</strong>.<br />
Indebtedness does not include loans and advances paid in the normal course of business. These amounts were included in advances.<br />
129
130 NEDNAMIBIA HOLDINGS LIMItED ANNUAL REPORt 2010<br />
NOtES tO tHE COMPANY<br />
ANNUAL FINANCIAL STATEMENTS<br />
FOR THE YEAR ENDED 31 DEcEmbER 2010 (cONTINUED)<br />
7. Share capital and share premium<br />
2010 2009<br />
N$’000 N$’000<br />
Ordinary shares 17,595 17,595<br />
Share premium 99,536 99,536<br />
The total number of authorised shares at year-end was:<br />
80 000 000 (2009: 80 000 000) ordinary shares of 25 cents each<br />
The total number of issued shares at year-end was:<br />
70 381 644 (2009: 70 381 644) ordinary shares of 25 cents each<br />
All issued shares are fully paid.<br />
Subject to the restrictions of the companies Act, the unissued shares are under the<br />
control of the directors until the forthcoming <strong>annual</strong> general meeting.<br />
8. other liabilities<br />
Financial liabilities classification: Other liabilities<br />
117,131 117,131<br />
creditors and other accounts<br />
9. Net interest income<br />
Interest and similar income<br />
Financial assets classification: Loans and receivables<br />
1 6<br />
Due from other banks 21 98<br />
Other assets 5 –<br />
Interest expense and similar charges<br />
Financial liabilities classification: Other liabilities<br />
26 98<br />
current and savings accounts<br />
10. Non-interest income<br />
– 15<br />
Dividend received<br />
11. operating expenditure<br />
Expenses include the following items which are separately disclosable:<br />
– 2,033<br />
Loss on sale of investment 448 –<br />
Auditors' remuneration – prior year 46 42<br />
Directors' fees paid by the bank 102 98<br />
Other expenses 47 48<br />
643 188
12. Taxation<br />
12.1 Charge for the year<br />
131<br />
2010 2009<br />
N$’000 N$’000<br />
Normal taxation – current year 4 27<br />
12.2 reconciliation of rate of taxation<br />
Namibian normal rate of taxation 34.0 35.0<br />
Reduction in rate for the year: (34.6) (33.6)<br />
– Non-taxable income (34.6) (33.6)<br />
Effective rate of taxation (0.6) 1.4<br />
13. Cash flow information<br />
13.1 reconciliation of profit before taxation to cash generated by operating activities<br />
Net income before taxation (617) 1,928<br />
Movement in operating assets 617 (1,928)<br />
– Deposit, current and other accounts (5) (149)<br />
– Advances and other accounts 622 (1,779)<br />
Cash generated by activities – –<br />
13.2 Cash received from customers<br />
Interest received 26 98<br />
13.3 Cash paid to customers<br />
Interest paid on deposits – (15)<br />
13.4 Cash movement in operating liabilities<br />
current accounts (5) (149)<br />
Other deposits and loan accounts – –<br />
(5) (149)
132 NEDNAMIBIA HOLDINGS LIMItED ANNUAL REPORt 2010<br />
NOtES tO tHE COMPANY<br />
ANNUAL FINANCIAL STATEMENTS<br />
FOR THE YEAR ENDED 31 DEcEmbER 2010 (cONTINUED)<br />
14. related party transactions<br />
2010 2009<br />
N$’000 N$’000<br />
14.1 related party balances<br />
Loans from related parties<br />
<strong>Nedbank</strong> Namibia <strong>Limited</strong> (subisidiary) (bank account) – –<br />
Loans from related parties<br />
<strong>Nedbank</strong> Namibia <strong>Limited</strong> (subisidiary) (bank account) 469 1,525<br />
<strong>Nedbank</strong> Namibia <strong>Limited</strong> (subisidiary) (sundry debtor) 1,326 896<br />
14.2 related party transactions<br />
<strong>Nedbank</strong> Namibia <strong>Limited</strong> (subisidiary) (interest income) 26 98<br />
<strong>Nedbank</strong> Namibia <strong>Limited</strong> (subisidiary) (interest expense) – 15<br />
15. Liquidity, credit and market risk information<br />
The assets and liabilities of the company consist mainly of non-<strong>financial</strong> assets and liabilities which are not subject to liquidity, credit and market<br />
risk for IFRS 7 purposes. Accounts receivable and creditors and accruals are repayable on demand or short notice.
CONtACt DETAILS<br />
NEDBANK NAMIBIA LIMITED<br />
HEAD OFFICE<br />
12 – 20 Dr Frans Indongo Street<br />
P.O. box 1, Windhoek, Namibia<br />
Tel: (061) 2959111<br />
Fax: (061) 2952120<br />
E-mail: serviceplus@nedbank.com<br />
WINDHOEK MAIN BRANCH<br />
12 – 20 Dr Frans Indongo Street<br />
PO box 1, Windhoek, Namibia<br />
Tel: (061) 2959111<br />
Fax: (061) 2952120<br />
WINDHOEK WERNHIL<br />
Shop 36, Wernhil Park, mandume Ndemufayo<br />
Avenue<br />
P.O. box, 1 Windhoek, Namibia<br />
Tel: (061) 295 2582<br />
Fax: (061) 2952585<br />
WINDHOEK SOUtH<br />
16 Thorpe Street, Garthanri Park, Southern Industrial<br />
PO box 1, Windhoek, Namibia<br />
Tel: (061) 2952422/24/25<br />
Fax: (061) 295 2227<br />
WINDHOEK HIDAS<br />
Ground Floor Hidas centre,<br />
Nelson mandela Avenue , Klein Windhoek<br />
P.O. box 1, Windhoek, Namibia<br />
Tel: (061) 295 2710<br />
Fax: (061) 2952707<br />
WINDHOEK INDEPENDENCE AVENUE<br />
carl List House, 27 Independence Avenue<br />
P.O. box 1, Windhoek, Namibia<br />
Tel: (061) 295 2164<br />
Fax: (061) 2952261<br />
WINDHOEK KAtUtURA<br />
Independence centre, Independence Avenue<br />
P.O. box 1, Windhoek, Namibia<br />
Tel: (061) 2952777<br />
Fax: (061) 2952757<br />
MAERUA MALL<br />
Shop 38/39, maerua mall,<br />
Robert mugabe Avenue<br />
PO box 1, Windhoek, Namibia<br />
Tel: (061) 295 2680<br />
Fax: (061) 295 2681<br />
NEDBANK BUSINESS CENtRE<br />
55 Rehobother Road , Ausspanplatz<br />
P.O. box 1, Windhoek , Namibia<br />
Tel: (061) 295 2237<br />
Fax: (061) 295 2046<br />
ASSEt FINANCE CENtRE<br />
<strong>Nedbank</strong> business centre,<br />
55 Rehobother Road , Ausspanplatz<br />
PO box 1, Windhoek, Namibia<br />
Tel: (061) 295 2865/2237<br />
Fax: (061) 295 2846<br />
LÜDERItZ<br />
240 bismarck Street<br />
Private bag 2031, Lüderitz<br />
Tel: (063) 20 2577/20 2923<br />
Fax: (063) 20 2566<br />
SWAKOPMUND<br />
10 Sam Nujoma Avenue<br />
PO box 1471 , Swakopmund<br />
Tel: (064) 414311<br />
Fax: (064) 41 4300<br />
WALVIS BAY<br />
c/o Sam Nujoma Avenue & 11 th Road<br />
PO box 590, Walvis bay<br />
Tel: (064) 21 6111<br />
Fax: (064) 21 6100<br />
KUISEBMOND WALVIS BAY<br />
Shop 3, The King’s mall.<br />
c/o 21st Avenue & Nathaniel maxuilili Street<br />
P.O. box 590, Walvis bay<br />
Tel: (064) 21 6180<br />
Fax: (064) 21 6181<br />
KEEtMANSHOOP<br />
c/o 5th Avenue & mittel Street<br />
P.O. box 166, Keetmanshoop<br />
Tel: (063) 223354/5<br />
Fax: (063) 22 3814<br />
OSHAKAtI<br />
Game centre, Okatana Road<br />
P.O. box 1604, Oshakati<br />
Tel: (065) 220062/220073<br />
Fax: (065) 22 0089<br />
ONDANGWA<br />
main Road , Erf 1231<br />
P.O. box 2374, Ondangwa<br />
Tel: (065) 24 1796/24 1798<br />
Fax: (065) 24 3706<br />
OSHIKANGO<br />
main Road, Erf 104<br />
P.O. box 2374, Ondangwa<br />
Tel: (065) 26 5091<br />
Fax: (065) 26 5094<br />
EENHANA<br />
c/o Sam Nujoma Drive &<br />
Dimo Hamaambo Street<br />
Private bag 88012, Eenhana<br />
Tel: (065) 26 3016<br />
Fax: (065) 26 3139<br />
KAtIMA<br />
Shop 6b & 7, main Road<br />
Zambezi Shopping centre<br />
P.O. box 2500, Ngwezi<br />
Tel: (066) 252507/252 123<br />
Fax: (066) 252 598<br />
GROOtFONtEIN<br />
c/o Hage Geingob Avenue &<br />
Okavango Road<br />
PO. box 146, Grootfontein<br />
Tel: (067) 240 730/240 731<br />
Fax: (067) 240 732<br />
OUtAPI<br />
main Road, Uutapi Tsandi centre<br />
P.O. box 1604, Oshakati<br />
Tel: (065) 306 570<br />
Fax: (065) 306 571<br />
RUNDU<br />
c/o maria mwengere &<br />
Eugene Kakuru Streets<br />
PO box 800, Rundu<br />
Tel: (066) 269 600<br />
Fax: (066) 269 601<br />
NEDCAPItAL NAMIBIA<br />
(PROPRIEtARY) LIMItED<br />
55 Rehobother Road<br />
Snyman circle, Ausspanplatz<br />
P.O. box 25576, Windhoek<br />
Tel: (061) 227 950/249 816<br />
Fax: (061) 259 701<br />
NEDLOANS (PROPRIEtARY) LIMItED<br />
1st Floor, Zanlumor building<br />
Post Street mall<br />
P.O. box 3140, Windhoek<br />
Tel: (061) 299 4200/299 4201<br />
Fax: (061) 2994205<br />
133