The triple transformation - McKinsey & Company
The triple transformation - McKinsey & Company
The triple transformation - McKinsey & Company

Create successful ePaper yourself
Turn your PDF publications into a flip-book with our unique Google optimized e-Paper software.
<strong>The</strong> <strong>triple</strong> <strong>transformation</strong><br />
Achieving a sustainable business model<br />
ment along the cost vector, with costtoincome<br />
ratios increasing 4 percentage points, while<br />
costtoasset ratios remained unchanged. This<br />
led to an ROE of 0 per cent – or 5 percent if the<br />
peripheral countries – Greece, Italy, Ireland,<br />
Portugal, and Spain – are excluded.<br />
Emerging Asia 5 : continued growth –<br />
though slower and more volatile. Emerging<br />
Asia banks managed to keep their sound<br />
capital and stability ratios intact and will continue<br />
to drive over 39 per cent of global banking<br />
revenue growth.<br />
However, while banks increased Tier 1 ratios<br />
by 0.2 percentage points to 10 per cent (slightly<br />
below the global average), there was a decline<br />
in revenue growth over the past year, largely<br />
5 Excluding Japan and Australia<br />
Exhibit 6<br />
driven by a drop in China, where growth was<br />
10 percent, compared with 41 percent in<br />
2010. In other Asian markets, revenue growth<br />
was stable at 8 percent.<br />
Emerging Asia banks cut costtoincome<br />
ratios to 42 percent in 2011 from 44 percent<br />
the previous year but did not cut costtoasset<br />
ratios.<br />
On average, Emerging Asia banks earned an<br />
ROE of 17 percent in 2011, compared with<br />
15 percent in 2010. Still, increasing risk costs<br />
(+10 percent from 2010 to 2011), highlighted the<br />
fact that they are not isolated from the global<br />
macroeconomic environment. Further, capital<br />
requirements in some markets are even tougher<br />
than required under the Basel III framework.<br />
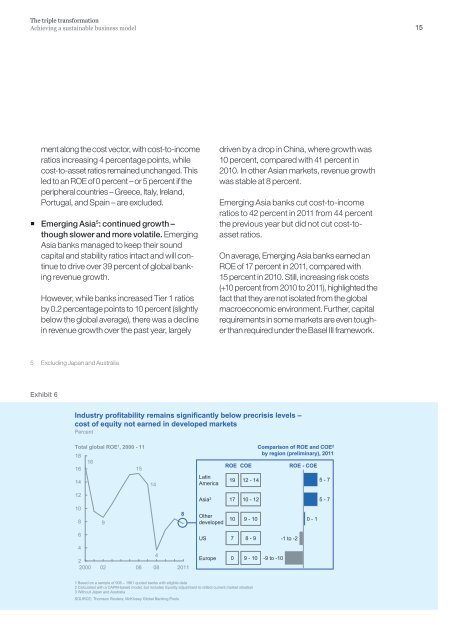
Industry profitability remains significantly below precrisis levels –<br />
cost of equity not earned in developed markets<br />
Percent<br />
Total global ROE1 , 2000 - 11 Comparison of ROE and COE2 18<br />
by region (preliminary), 2011<br />
16<br />
16<br />
15<br />
ROE COE<br />
ROE - COE<br />
14<br />
12<br />
10<br />
8<br />
6<br />
4<br />
2<br />
2000<br />
9<br />
02<br />
06<br />
14<br />
4<br />
08<br />
2011<br />
Asia 3<br />
Other<br />
developed<br />
1 Based on a sample of 906 – 1961 quoted banks with eligible data<br />
2 Calculated with a CAPM-based model, but includes liquidity adjustment to reflect current market situation<br />
3 Without Japan and Australia<br />
SOURCE: Thomson Reuters; <strong>McKinsey</strong> Global Banking Pools<br />
8<br />
Latin<br />
America<br />
US<br />
Europe<br />
19 12 - 14<br />
17 10 - 12<br />
10 9 - 10<br />
7 8 - 9<br />
0 9 - 10<br />
-9 to -10<br />
-1 to -2<br />
0 - 1<br />
5 - 7<br />
5 - 7<br />
15