The Future Of Airline Distribution - IATA
The Future Of Airline Distribution - IATA
The Future Of Airline Distribution - IATA

Create successful ePaper yourself
Turn your PDF publications into a flip-book with our unique Google optimized e-Paper software.
<strong>The</strong> <strong>Future</strong> of <strong>Airline</strong> <strong>Distribution</strong> - A Look Ahead To 2017<br />
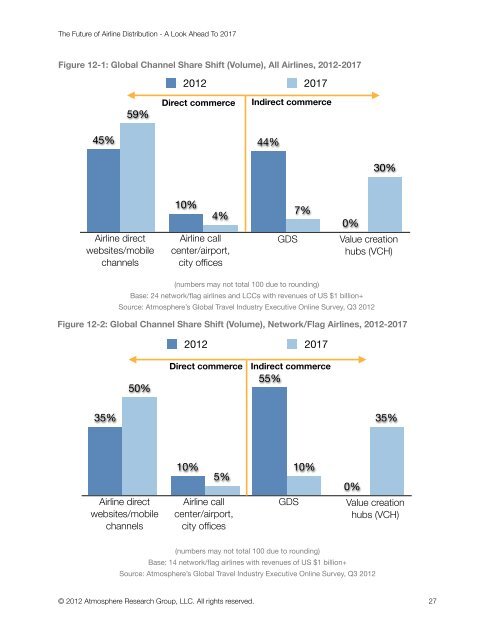
Figure 12-1: Global Channel Share Shift (Volume), All <strong>Airline</strong>s, 2012-2017<br />
45%<br />
59%<br />
<strong>Airline</strong> direct<br />
websites/mobile<br />
channels<br />
2012 2017<br />
10%<br />
4%<br />
<strong>Airline</strong> call<br />
center/airport,<br />
city offices<br />
44%<br />
30%<br />
© 2012 Atmosphere Research Group, LLC. All rights reserved. 27<br />
7%<br />
(numbers may not total 100 due to rounding)<br />
0%<br />
GDS Value creation<br />
hubs (VCH)<br />
Base: 24 network/flag airlines and LCCs with revenues of US $1 billion+<br />
Source: Atmosphere’s Global Travel Industry Executive Online Survey, Q3 2012<br />
Figure 12-2: Global Channel Share Shift (Volume), Network/Flag <strong>Airline</strong>s, 2012-2017<br />
35%<br />
50%<br />
<strong>Airline</strong> direct<br />
websites/mobile<br />
channels<br />
Direct commerce Indirect commerce<br />
2012 2017<br />
Direct commerce<br />
10%<br />
5%<br />
<strong>Airline</strong> call<br />
center/airport,<br />
city offices<br />
Indirect commerce<br />
55%<br />
10%<br />
(numbers may not total 100 due to rounding)<br />
0%<br />
35%<br />
GDS Value creation<br />
hubs (VCH)<br />
Base: 14 network/flag airlines with revenues of US $1 billion+<br />
Source: Atmosphere’s Global Travel Industry Executive Online Survey, Q3 2012