Mainfreight Annual Report 2022
Mainfreight Annual Report 2022
Mainfreight Annual Report 2022
- No tags were found...

Create successful ePaper yourself
Turn your PDF publications into a flip-book with our unique Google optimized e-Paper software.
54 55<br />
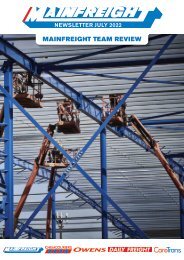
PEOPLE AND COMMUNITIES Environmental, Social and Governance<br />
For the 2021 year, we have seen reductions across all five<br />
of our tracked emissions intensity measures. With the<br />
significant business and volume growth across our global<br />
business over this period, we have recorded a gross<br />
increase in carbon dioxide equivalents of 211,053 tonnes<br />
representing a 14.37% increase in gross greenhouse gas<br />
emissions.<br />
This increase is reflective of the ongoing reverberations<br />
across global supply chain. In particular, a shift in<br />
customer preference to airfreight due to congestion,<br />
price increases and poor reliability in ocean-based<br />
alternatives, and the return of belly freight capacity in<br />
passenger aviation.<br />
Emissions for customer airfreight alone rose 237,098<br />
tonnes in 2021, almost 30,000 tonnes more than the<br />
increase in our global inventory year on year.<br />
This represents a mixed result; an increase is<br />
disappointing, however excluding the impacts of<br />
airfreight, <strong>Mainfreight</strong> would have seen a second year<br />
of reductions in gross emissions. This comes despite<br />
significant business growth and market share gains over<br />
these last two years.<br />
Unfortunately we do not foresee a normalisation of<br />
global supply chain in <strong>2022</strong>, although the dynamics may<br />
shift somewhat. We continue to target reductions in<br />
emissions intensity year-on-year while aiming to reduce<br />
gross emissions wherever possible.<br />
We do expect and strive to continuously reduce the<br />
emissions intensity of our operations globally.<br />
With this disclosure to ISO 14064-1:2018, <strong>Mainfreight</strong><br />
intends to demonstrate best practice in emissions<br />
reporting and reinforce its commitment to better<br />
understanding and, ultimately, improving our operational<br />
carbon emissions performance. Our inventories are<br />
independently verified by Toitū Envirocare and follow the<br />
six categories structure of the new standard rather than<br />
the closely aligned Scopes 1-3.<br />
A significant feature of this carbon disclosure is the<br />
inclusion of emissions on the basis of operational control<br />
(not financial control). It is our belief that if we can<br />
exercise reasonable influence over an emissions source<br />
then we must include it. As a result, we incorporate<br />
emissions from vehicles operated by owner drivers and<br />
agents, rail providers, shipping lines and airlines that<br />
support our service offering to customers. For full details<br />
and wider explanation of our emissions inventories,<br />
please refer to our Greenhouse Gas Inventory <strong>Report</strong>s:<br />
available at https://www.mainfreight.com/global/en-nz/<br />
investor/reports-library<br />
Other Environmental Initiatives<br />
We began recycling office and depot waste in<br />
New Zealand 34 years ago, and we continue to invest and<br />
explore new opportunities and innovations that support<br />
more sustainable business across our global business.<br />
Some of our existing initiatives include:<br />
> Major solar installations on sites across New Zealand,<br />
Australia and Europe total some 2,855 kW generation<br />
from a total of 9,830 panels (enough to power over<br />
700 households).<br />
> Rain and greywater recycling for truck wash, ablutions<br />
and irrigation as a standard feature in our branch<br />
designs.<br />
> Moving capacity from road to rail and coastal shipping.<br />
> GPS and route planning software to bring efficiencies to<br />
freight deliveries and pick ups.<br />
> Continuing programme of modernising owner driver<br />
fleets, so that more environmentally efficient vehicles<br />
replace older and less efficient vehicles.<br />
> Utilising EV and hybrid vehicles for our sales team;<br />
currently over 315 vehicles in Australasia and Europe (last<br />
year 243 vehicles). New Zealand and Australia now both<br />
above 40% hybrid and electric.<br />
> Conversion of gas and diesel powered forklifts to electric<br />
and supplementing with manual pallet trucks.<br />
> Branch vegetable gardens and ‘hungry bins’ for food<br />
scrap composting.<br />
> Waste exchange arrangement for shrink-wrap, pallet<br />
waste repurposing, and polystyrene recycling.<br />
> Progressing trials and explorations of electric truck<br />
opportunities.<br />
> We continue to develop our GHG emissions reporting<br />
tools for customers. Along with <strong>Mainfreight</strong>’s own peerreviewed<br />
emission factors, customers can get an accurate<br />
inventory of their supply chain emissions from local<br />
deliveries through to international shipments.<br />
INTENSITY FACTORS<br />
CO2-e per <strong>Mainfreight</strong> Team Member # 161.97<br />
tonnes<br />
CO2-e per million dollars in Revenue # 329.43<br />
tonnes<br />
2021 2020<br />
164.69<br />
tonnes<br />
436.89<br />
tonnes<br />
CO2-e per tonne Domestic Freight* 49.65 kg 58.46 kg<br />
CO2-e per tonne of Air Freight* 1.20 tonnes 1.21 tonnes<br />
CO2-e per TEU of Seafreight* 0.09 tonnes 0.12 tonnes<br />
#<br />
Total CO2-e<br />
* Category 1 & 3 CO2-e<br />
Airfreight and Seafreight intensity measures have been updated to use<br />
T-KM/TEU-KM rather than weight alone<br />
MAINFREIGHT EMISSIONS (TONNES CO2-E)<br />
CATEGORY CATEGORY DESCRIPTION 2021 2020<br />
Category 1 Direct GHG emissions and<br />
removals in tonnes CO2-e<br />
278,964 263,759<br />
(Road freight: Owner Driver<br />
vehicles & owned/leased<br />
vehicles)*<br />
Category 2 Indirect GHG emissions from<br />
imported energy<br />
14,865 15,414<br />
(Electricity, LPG, etc)<br />
Category 3 Indirect GHG Emissions from<br />
Transportation<br />
1,309,744 1,115,134<br />
(Third party road, rail, air, sea<br />
transport)*<br />
Indirect GHG emissions<br />
Category 4 associated with the use of<br />
76,389 74,678<br />
products by the organisation<br />
Category 5<br />
Indirect GHG emissions<br />
associated with the use<br />
of products from the<br />
- -<br />
organisation<br />
Category 6<br />
Other indirect GHG<br />
emissions sources<br />
137 61<br />
TOTAL 1,680,099 1,469,046<br />
2021 2020 CHANGE<br />
Road 464,327 460,063 0.93%<br />
Rail 9,603 7,038 36.45%<br />
Air 943,337 706,239 33.57%<br />
Sea 226,769 261,739 -13.36%<br />
TOTAL CUSTOMER<br />
FREIGHT EMISSIONS<br />
(Total of Road,<br />
Rail, Air, Sea)<br />
Direct <strong>Mainfreight</strong><br />
Emissions<br />
EMISSIONS SOURCES<br />
1,644,036 1,435,079 14.56%<br />
36,063 33,967 6.17%<br />
TOTAL EMISSIONS 1,680,099 1,469,046 14.37%<br />
* 2020 figures have been updated and republished to account for a change in road freight calculations that affected categories 1 and 3.<br />
For more details please see section 4.2.1 of our 2021 GHG <strong>Report</strong>.<br />
KIKI COGH, BORN, THE NETHERLANDS