Mainfreight Annual Report 2022
Mainfreight Annual Report 2022
Mainfreight Annual Report 2022
- No tags were found...

Create successful ePaper yourself
Turn your PDF publications into a flip-book with our unique Google optimized e-Paper software.
90 91<br />
Notes to the FINANCIAL STATEMENTS<br />
Notes to the FINANCIAL STATEMENTS<br />
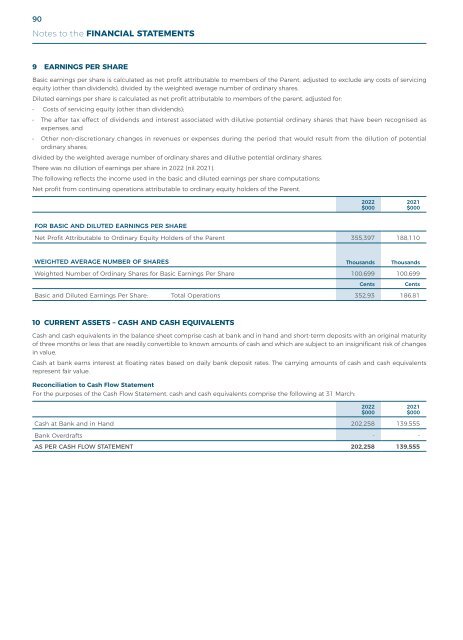
9 EARNINGS PER SHARE<br />
Basic earnings per share is calculated as net profit attributable to members of the Parent, adjusted to exclude any costs of servicing<br />
equity (other than dividends), divided by the weighted average number of ordinary shares.<br />
Diluted earnings per share is calculated as net profit attributable to members of the parent, adjusted for:<br />
• Costs of servicing equity (other than dividends);<br />
• The after tax effect of dividends and interest associated with dilutive potential ordinary shares that have been recognised as<br />
expenses; and<br />
• Other non-discretionary changes in revenues or expenses during the period that would result from the dilution of potential<br />
ordinary shares;<br />
divided by the weighted average number of ordinary shares and dilutive potential ordinary shares.<br />
There was no dilution of earnings per share in <strong>2022</strong> (nil 2021).<br />
The following reflects the income used in the basic and diluted earnings per share computations:<br />
Net profit from continuing operations attributable to ordinary equity holders of the Parent.<br />
11 CURRENT ASSETS – TRADE DEBTORS<br />
Trade debtors are non-interest bearing and are generally on 7–30 day terms. They are recognised initially at fair value and subsequently<br />
measured at amortised cost using the effective interest method, less an allowance for impairment. Trade debtors includes amounts<br />
for services performed but unbilled at balance date.<br />
Collectability of trade debtors is reviewed on an ongoing basis. Debts that are known to be uncollectible are written off when identified.<br />
The Group applies a simplified approach in calculating expected credit losses. Therefore, the Group does not track changes in credit<br />
risk, but instead recognises a loss allowance based on lifetime expected credit losses at each reporting date. This is based on historical<br />
credit loss experience, adjusted for forward-looking factors specific to the debtors and the economic environment. Trade debtors are<br />
written off as bad debts when all avenues of collection have been exhausted. Due to the short-term nature of these debtors, their<br />
carrying value is assumed to approximate fair value.<br />
Trade Debtors 810,333 493,862<br />
Allowance for Impairment Loss (4,765) (4,616)<br />
<strong>2022</strong><br />
$000<br />
2021<br />
$000<br />
<strong>2022</strong><br />
$000<br />
2021<br />
$000<br />
Movements in the allowance for impairment were as follows:<br />
805,568 489,246<br />
FOR BASIC AND DILUTED EARNINGS PER SHARE<br />
Net Profit Attributable to Ordinary Equity Holders of the Parent 355,397 188,110<br />
Balance at 1 April 4,616 4,798<br />
Charge for the Year 4,333 2,527<br />
Amounts Written Off (4,184) (2,709)<br />
WEIGHTED AVERAGE NUMBER OF SHARES Thousands Thousands<br />
BALANCE AT 31 MARCH 4,765 4,616<br />
Weighted Number of Ordinary Shares for Basic Earnings Per Share 100,699 100,699<br />
Cents<br />
Cents<br />
Basic and Diluted Earnings Per Share: Total Operations 352.93 186.81<br />
At 31 March, the ageing analysis of trade receivables is as follows:<br />
$000 Total<br />
0-30<br />
Days<br />
31-60<br />
Days<br />
61-90<br />
Days<br />
PDNI*<br />
61-90<br />
Days<br />
CI#<br />
+91<br />
Days<br />
PDNI*<br />
+91<br />
Days<br />
CI#<br />
10 CURRENT ASSETS – CASH AND CASH EQUIVALENTS<br />
Cash and cash equivalents in the balance sheet comprise cash at bank and in hand and short-term deposits with an original maturity<br />
of three months or less that are readily convertible to known amounts of cash and which are subject to an insignificant risk of changes<br />
in value.<br />
Cash at bank earns interest at floating rates based on daily bank deposit rates. The carrying amounts of cash and cash equivalents<br />
represent fair value.<br />
Reconciliation to Cash Flow Statement<br />
For the purposes of the Cash Flow Statement, cash and cash equivalents comprise the following at 31 March:<br />
<strong>2022</strong> 810,333 670,982 109,050 17,673 786 7,863 3,979<br />
2021 493,862 381,061 91,325 13,199 605 3,661 4,011<br />
* Past due not impaired (PDNI)<br />
# Considered Impaired (CI)<br />
Credit risk management policy is disclosed in note 3.<br />
The maximum exposure to credit risk is the fair value of receivables. Collateral is not held as security, nor is it the Group’s policy to<br />
transfer or factor receivables.<br />
<strong>2022</strong><br />
$000<br />
2021<br />
$000<br />
12 CURRENT ASSETS – OTHER RECEIVABLES<br />
Cash at Bank and in Hand 202,258 139,555<br />
Bank Overdrafts - -<br />
AS PER CASH FLOW STATEMENT 202,258 139,555<br />
Sundry Prepayments and Other Receivables 48,563 89,531<br />
CARRYING AMOUNT OF OTHER RECEIVABLES 48,563 89,531<br />
<strong>2022</strong><br />
$000<br />
2021<br />
$000