Sponseller, R.A., E.F. Benfield, and H.M. Valett. 2001
Sponseller, R.A., E.F. Benfield, and H.M. Valett. 2001
Sponseller, R.A., E.F. Benfield, and H.M. Valett. 2001

Create successful ePaper yourself
Turn your PDF publications into a flip-book with our unique Google optimized e-Paper software.
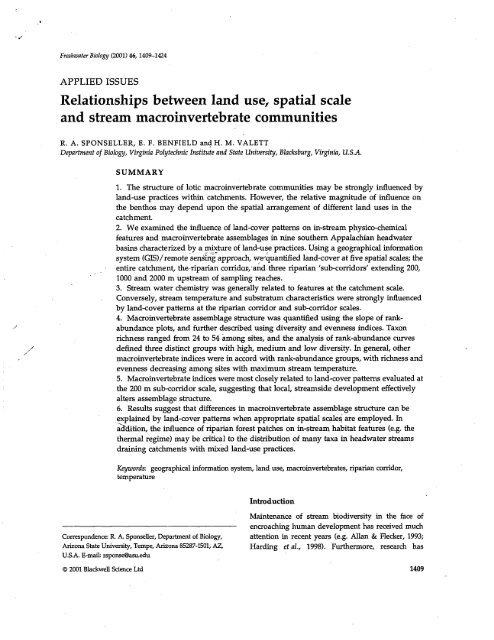
Freshwater Biology (<strong>2001</strong>) 46,1409-1424<br />
APPLIED ISSUES<br />
Relationships between l<strong>and</strong> use, spatial scale<br />
<strong>and</strong> stream macroinvertebrate communities<br />
R. A. SPONSELLER, E. F. BENFIELD <strong>and</strong>H. M. VALETT<br />
Department of Biology, Virginia Polytechnic Institute <strong>and</strong> State University, Blacksburg, Virginia, U.S.A.<br />
SUMMARY<br />
1. The structure of lotic macroinvertebrate communities may be strongly influenced by<br />
l<strong>and</strong>-use practices within catchments. However, the relative magnitude of influence on<br />
the benthos may depend upon the spatial arrangement of different l<strong>and</strong> uses in the<br />
catchment.<br />
2. We examined the influence of l<strong>and</strong>-cover patterns on in-stream physico-chemical<br />
features <strong>and</strong> macroinvertebrate assemblages in nine southern Appalachian headwater<br />
basins characterized by a mixture of l<strong>and</strong>-use practices. Using a geographical information<br />
system (GIS)/remote sensing approach, we'quantified l<strong>and</strong>-cover at five spatial scales; the<br />
entire catchment, the-Tiparian corridojv<strong>and</strong> three riparian 'sub-corridors' extending 200,<br />
1000 <strong>and</strong> 2000 m upstream of sampling reaches.<br />
3. Stream water chemistry was generally related to features at the catchment scale.<br />
Conversely, stream temperature <strong>and</strong> substratum characteristics were strongly influenced<br />
by l<strong>and</strong>-cover patterns at the riparian corridor <strong>and</strong> sub-corridor scales.<br />
4. Macroinvertebrate assemblage structure was quantified using the slope of rankabundance<br />
plots, <strong>and</strong> further described using diversity <strong>and</strong> evenness indices. Taxon<br />
richness ranged from 24 to 54 among sites, <strong>and</strong> the analysis of rank-abundance curves<br />
defined three distinct groups with high, medium <strong>and</strong> low diversity. In general, other<br />
macroinvertebrate indices were in accord with rank-abundance groups, with richness <strong>and</strong><br />
evenness decreasing among sites with maximum stream temperature.<br />
5. Macroinvertebrate indices were most closely related to l<strong>and</strong>-cover patterns evaluated at<br />
the 200 m sub-corridor scale, suggesting that local, streamside development effectively<br />
alters assemblage structure.<br />
6. Results suggest that differences in macroinvertebrate assemblage structure can be<br />
explained by l<strong>and</strong>-cover patterns when appropriate spatial scales, are employed. In<br />
actdition, the influence of riparian forest patches on in-stream habitat features (e.g. the<br />
thermal regime) may be critical to the distribution of many taxa in headwater streams<br />
draining catchments with mixed l<strong>and</strong>-use practices.<br />
Keywords: geographical information system, l<strong>and</strong> use, macroinvertebrates, riparian corridor,<br />
temperature<br />
Introduction<br />
Maintenance of stream biodiversity in the face of<br />
•• encroaching human development has received much<br />
Correspondence: R. A. <strong>Sponseller</strong>, Department of Biology, attention in recent years (e.g. Allan & Flecker, 1993;<br />
Arizona State University, Tempe, Arizona 85287-1501, AZ, Harding et al., 1998). Furthermore, research has<br />
U.S.A. E-mail: rsponse@asu.edu<br />
© <strong>2001</strong> BlackweU Science Ltd 1409
1410 R.A. <strong>Sponseller</strong> et al.<br />
demonstrated that the conversion of forests to pastures<br />
<strong>and</strong>/or residential areas may influence<br />
in-stream habitat <strong>and</strong> macroinvertebrate communities<br />
in several ways. Loss of terrestrial vegetation (Swank,<br />
Swift & Douglas, 1988) <strong>and</strong> an increased area of<br />
impervious surfaces (Changnon & Demissie, 1996)<br />
can influence evapotranspiration <strong>and</strong> infiltration <strong>and</strong><br />
alter natural flow regimes (Poff et al., 1997). Many<br />
l<strong>and</strong>-use practices increase sediment inputs to<br />
streams, altering substratum characteristics <strong>and</strong> channel<br />
morphology, often reducing macroinvertebrate<br />
diversity (Lenat & Crawford, 1994; Waters, 1995;<br />
Quinn et al., 1997). Removal of streamside vegetation<br />
<strong>and</strong> subsequent increased solar radiation reaching the<br />
stream channel can increase temperature (Burton &<br />
Likens, 1973; Rutherford et al., 1997; Quinn et al,<br />
1997) <strong>and</strong> alter thermal regimes that are critical to<br />
the life history <strong>and</strong> ecology of macroinvertebrates<br />
(Vannote & Sweeney, 1980; Ward & Stanford, 1982;<br />
Quinn et al., 1994). In association with.altered catchment-<br />
hydrology <strong>and</strong> l<strong>and</strong> use, inputs of inorganic<br />
-nutrients from terrestrial sources (e.g. Omernik, 1977;<br />
Hunsaker & Levine, 1995; Johnson et al., 1997) may<br />
interact with increased light availability <strong>and</strong> stream<br />
temperature to enhance in-stream primary production<br />
(Webster et al., 1983), resulting in changes in the<br />
trophic structure of benthic communities (e.g. Gurtz<br />
& Wallace, 1984).<br />
The relative magnitude of l<strong>and</strong>-use effects may<br />
depend upon the spatial distribution of l<strong>and</strong> use in<br />
catchments (Allan & Johnson, 1997). Catchment<br />
hydrology, as well as the availability of inorganic<br />
nutrients in streams, is often related to processes that<br />
occur across the terrestrial l<strong>and</strong>scape (Omernik, 1977;<br />
Swank, Swift & Douglas, 1988; Hunsaker & Levine,<br />
1995). Conversely, the availability of light <strong>and</strong> organic<br />
carbon in streams is often related to processes restricted<br />
to the scale of streamside vegetation (Gregory<br />
et al., 1991). Several studies have shown that in-stream<br />
physico-chemical <strong>and</strong> biotic features may be constrained<br />
by catchment properties operating at different<br />
spatial scales. For example, Richards, Johnson &<br />
Host (1996) identified catchment-scale characteristics,<br />
particularly basin geology <strong>and</strong> the distribution of<br />
arable agriculture, as features mediating channel<br />
morphology <strong>and</strong> stream hydrology. At the same time,<br />
l<strong>and</strong>-cover in the riparian corridor had a strong<br />
influence on bank erosion <strong>and</strong> in-stream sedimentrelated<br />
variables. Further, they found that basin-wide<br />
features were the best predictors for macroinvertebrate<br />
assemblage structure. Conversely, Richards et al.<br />
(1997) showed that despite a close relationship<br />
between catchment-scale properties <strong>and</strong> channel<br />
structure <strong>and</strong> hydrology, macroinvertebrate species<br />
traits were correlated with local (reach-scale) features.<br />
In addition, spatial scales of catchment control may<br />
vary temporally. For example, Johnson et al. (1997)<br />
found that the strength of relationship between<br />
stream-water chemistry <strong>and</strong> catchment scale versus<br />
riparian scale l<strong>and</strong>-cover patterns varied among season<br />
<strong>and</strong> with dissolved chemical constituents in<br />
Michigan streams.<br />
The southern Appalachian region of the United<br />
States has been subject to a variety of l<strong>and</strong>-use<br />
changes during the last century (<strong>Benfield</strong>, 1995).<br />
Between 1880 <strong>and</strong> 1920, almost all of the timber in<br />
the states of Virginia, West Virginia, North Carolina<br />
<strong>and</strong> Tennessee was harvested (Yarnell, 1998). This<br />
•was followed by agricultural activity, which<br />
increased in importance through to the 1960s. Since<br />
1970 human population in the southern Appalachians<br />
has increased by nearly 30% <strong>and</strong> agricultural<br />
activity has declined by 31%, leading to a largescale<br />
conversion of agricultural l<strong>and</strong> to either<br />
forests or residential areas (SAMAB, 1996). This<br />
history has resulted in a mosaic of different l<strong>and</strong>use<br />
patches across the l<strong>and</strong>scape. Current l<strong>and</strong>cover<br />
patterns in many Southern Appalachian<br />
catchments are characterized by high gradient<br />
headwater areas that are difficult to develop <strong>and</strong><br />
are often forested, <strong>and</strong> low gradient areas subject to<br />
active agriculture or conversion to urban l<strong>and</strong><br />
(Wear & Bolstad, 1998).<br />
In this study, we investigated the effects of l<strong>and</strong>-use<br />
on benthic macroinvertebrate assemblages in southern<br />
Appalachian headwater streams. Specifically, we<br />
address how differences in l<strong>and</strong> use among catchments<br />
influences in-stream physico-chemical features<br />
<strong>and</strong> macroinvertebrate assemblage structure. In addition,<br />
we sought to determine how changes in<br />
in-stream features (both biotic <strong>and</strong> abiotic) relate to<br />
the spatial arrangement of l<strong>and</strong> use within catchments.<br />
To do this, we quantified the relationship<br />
between l<strong>and</strong>-cover <strong>and</strong> in-stream variables at multiple<br />
spatial scales. This approach allowed us to<br />
evaluate the ecological implications of l<strong>and</strong>-use practices<br />
that occur streamside versus those that occur<br />
across the catchment.<br />
© <strong>2001</strong> Bkckwell Science Ltd, Freshwater Biology, 46,1409-1424
Methods<br />
Site description<br />
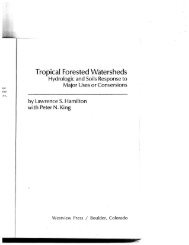
The study was conducted in the Upper Roanoke River<br />
Basin (URRB) in south-western Virginia (Fig. 1) at the<br />
interface of the Appalachian Valley <strong>and</strong> Ridge <strong>and</strong><br />
Blue Ridge physiographic provinces. The URRB is<br />
topographically <strong>and</strong> geologically diverse, <strong>and</strong>.is characterized<br />
by Precambrian <strong>and</strong> Cambrian metamorphics<br />
<strong>and</strong> elastics at higher altitude <strong>and</strong> Cambrian <strong>and</strong><br />
Ordovician carbonates lower in the valley (Waller,<br />
1976). Nine catchments with second or third order<br />
streams were selected for study. Catchments ranged in<br />
altitude from 325 to 575 m above sea level, <strong>and</strong> varied<br />
from 278 to 1014 hectares. Six of nine catchments were<br />
characterized by some degree of human activity (e.g.<br />
agricultural or urban development); the remaining<br />
three had no such development. One 50-m stream<br />
North Fork<br />
Influences of l<strong>and</strong> use on stream macroinvertebrates 1411<br />
reach was selected within each catchment as our study<br />
site. Benthic habitat at all streams consisted of particles<br />
ranging from silt to cobbles, although the relative<br />
proportion of these size classes varied among sites.<br />
L<strong>and</strong> use quantification<br />
A geographical information system (GIS) (Arcview 3.1;<br />
ESRI, Redl<strong>and</strong>, CA, U.S.A.) was used to quantify l<strong>and</strong><br />
cover within each basin. Digital l<strong>and</strong>-cover information<br />
for the Roanoke Valley was obtained from a<br />
preliminary l<strong>and</strong>-cover map of Virginia, produced<br />
through the Virginia Gap Analysis Project (VAGAP)<br />
for 1992 (Morton, 1998). This statewide data set was<br />
generated from 14 L<strong>and</strong>sat thematic mapper scenes,<br />
<strong>and</strong> classified using both unsupervised <strong>and</strong> enhanced<br />
supervised methods (Morton, 1998). Pixels provided<br />
30 x 30 m resolution <strong>and</strong> included information from<br />
North<br />
10 km<br />
Fig. 1 Upper Roanoke River Basin (URRB), showing North <strong>and</strong> South Fork sub-basins, <strong>and</strong> selected study sites. Site names correspond<br />
as follows: (1) Powers Branch, (2) Sugar Run, (3) Purgatory Tributary, (4) Martins Creek, (5) Little Back Creek, (6) Greenbriar Branch,<br />
(7) Mudlick Creek, (8) Earnhardt Creek, (9) Franklin Creek.<br />
© <strong>2001</strong> BlackweU Science Ltd, Freshwater Biology, 46,1409-1424
1412 R.A. <strong>Sponseller</strong> et al.<br />
seven l<strong>and</strong>-use categories: deciduous forest, coniferous<br />
forest, mixed forest, shrub/scrubl<strong>and</strong>, herbaceous<br />
(mostly agriculture), open water <strong>and</strong> disturbed (areas<br />
lacking vegetation). We further categorized the data<br />
into forest <strong>and</strong> non-forest. The forest category included<br />
all forest types, but was dominated by the<br />
deciduous class. The non-forest category included<br />
both agricultural <strong>and</strong> urban/suburban areas.<br />
Morton (1998) used aerial videography to acquire<br />
reference data <strong>and</strong> assess the accuracy of the statewide<br />
l<strong>and</strong>-cover data set, which was found to be 81%.<br />
This level of accuracy may not hold for riparian<br />
corridors, which are more difficult to classify, particularly<br />
in mountainous areas. Our accuracy assessment<br />
of riparian corridors, from 25 locations across five<br />
study catchments with the greatest l<strong>and</strong>-cover heterogeneity,<br />
found approximately 75% of the streamside<br />
pixels were correctly classified. However, of the pixels<br />
classified as non-forest, 50% had' thin' ;strips (e.g.<br />
< 1 m) of riparian vegetation but otherwise lacked<br />
forested 'area. Incorrect classifications encountered in<br />
-the assessment generally occurred when pixels classified<br />
as forest had small residences but were otherwise<br />
well forested.<br />
Sampling reach<br />
Riparian subcorridor<br />
polygons<br />
Catchments were delineated using a watershed<br />
delineator (ESRI & Texas Natural Resource Conservation<br />
Commission, 1997) which uses neighbourhood<br />
functions with data from US Geologic Survey (USGS)<br />
digital elevation maps to quantify the surface area<br />
contributing to drainage through a given point. The<br />
outputs were converted to catchment polygons, which<br />
included the entire drainage area upstream of the<br />
sampling reach. L<strong>and</strong>-cover derived from all pixels<br />
within catchment polygons were used to characterize<br />
catchment scale l<strong>and</strong>-use patterns. Within each catchment<br />
polygon, a 60-m riparian corridor polygon was<br />
created with 30 m of width extending laterally,<br />
beginning at the sampling reach <strong>and</strong> continuing for<br />
the entire length of the stream. The influence of<br />
riparian l<strong>and</strong>-cover at specific distances upstream of<br />
the study reach was assessed by dividing riparian<br />
corridors longitudinally into sub-corridor polygons.<br />
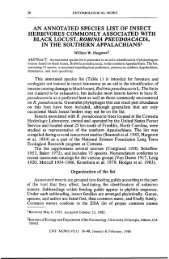
We used five spatial scales for analysis: (1) the<br />
•catchment scale, including all of the area within its<br />
watershed, (2) riparian corridor scale, extending over<br />
the entire length of the stream, (3) 2000 m riparian<br />
sub-corridors, (4) 1000 m riparian sub-corridors <strong>and</strong><br />
(5) 200 m riparian sub-corridors (Fig. 2). Associated<br />
Catchment polygon<br />
Riparian corridor<br />
polygon<br />
Fig. 2 Examples of GIS polygons used to analyse l<strong>and</strong>-cover patterns at five spatial scales, including the entire catchment, riparian<br />
corridor <strong>and</strong> three riparian sub-corridors extending 200,1000 <strong>and</strong> 2000 m upstream from the sampling reach.<br />
© <strong>2001</strong> Blackwell Science Ltd, Freshwater Biology, 46,1409-1424
catchment, riparian corridor <strong>and</strong> sub-corridor polygons<br />
were overlaid onto the digital l<strong>and</strong>-cover data<br />
for each study basin. Percentages for l<strong>and</strong>-cover<br />
categories were quantified within all spatial polygons.<br />
Regression analysis was used to relate physicochemical<br />
<strong>and</strong> biological variables to l<strong>and</strong> cover at the<br />
catchment, riparian corridor <strong>and</strong> sub-corridor scale.<br />
Percent non-forest values were transformed .(arcsine<br />
square root) for statistical analyses.<br />
Physical <strong>and</strong> chemical characterizations<br />
Physical <strong>and</strong> chemical measurements were made for<br />
each stream from January to December 1999. Triplicate<br />
water samples were collected monthly from each site,<br />
passed through glass fibre filters (Whatman GFF,<br />
Gelman Type AE, Maidstone, U.K.), <strong>and</strong> kept frozen<br />
until analysed. Samples were analysed for ammonium-nitrogen<br />
(NH4-N) using the phenaj;e' ,'frtethod<br />
(Soloranzo, 1969) <strong>and</strong> nitrate-nitrogen, (NO3-N) by<br />
colormetric 'techniques following reduction by Cd<br />
(Wood, Armstrong & Richards, 1967) on a Technicon<br />
Auto-analyser (Bran & Luebbe, Buffalo Grove, IL,<br />
U.S.A.). Total inorganic nitrogen (TIN) was calculated<br />
as the sum of NH4-N <strong>and</strong> NO3-N. Ortho-phosphate<br />
(PO4-P) was analysed as soluble reactive phosphorus<br />
(SRP) using the molybdate colorimetric method<br />
(Murphy & Riley, 1962; Wetzel & Likens, 1991). Specific<br />
conductance was measured seasonally using a YSI<br />
Model 30/50- (YSI, Yellow Springs, OH, U.S.A.) conductivity<br />
meter. Alkalinity was determined once<br />
at each site by st<strong>and</strong>ard methods (APHA, 1998).<br />
Temperature was recorded monthly until continuous<br />
temperature data recorders (HOBO, Polasset, MA,<br />
U.S.A.) were installed in March 1999, after which it was<br />
recorded hourly through November 1999. Temperature<br />
variables used in analyses included the overall<br />
mean temperature (T, °C), <strong>and</strong> maximum summer<br />
temperature (Tmax, °C). Discharge was measured at<br />
least monthly at each site using velocity determined<br />
with an electronic flowmeter (FLOW-MATE, Marsh-<br />
McBirney, Frederick, MD, U.S.A.) <strong>and</strong> cross-sectional<br />
area (Gore, 1996). Mean substratum particle size (MPS)<br />
was determined using st<strong>and</strong>ard granulometry techniques<br />
(sensu Wolman, 1954) on 100 r<strong>and</strong>omly selected<br />
rocks at each site with a USGS gravelometer. We also<br />
quantified the percentage of all particles measured at<br />
each site small enough to be categorized as coarse<br />
gravel, s<strong>and</strong> <strong>and</strong> silt (% < 16 mm).<br />
© <strong>2001</strong> BlackweU Science Ltd, Freshwater Biology, 46,1409-1424<br />
Influences of l<strong>and</strong> use on stream macroinvertebrates 1413<br />
Benthic algal biomass<br />
Epilithic biomass (g m" 2 ) <strong>and</strong> chlorophyll a (mg m" 2 )<br />
were determined monthly at each site from the<br />
surfaces of five rocks collected along each 50 m reach.<br />
Upon collection, rocks were packed in ice, <strong>and</strong><br />
returned to the laboratory for processing. Upper<br />
surfaces were scrubbed <strong>and</strong> the resultant slurry subsampled<br />
<strong>and</strong> collected on preweighed glass fibre filters<br />
(Whatman GFF, Gelman Type AE). Filters were incubated<br />
in a 90% buffered acetone solution for 24 h (sensu<br />
Steinman & Lamberti, 1996). Photosynthetic pigments<br />
(chlorophyll a <strong>and</strong> phaeophytin) were measured using<br />
spectrophotometry (at 664, 665 <strong>and</strong> 750 nm) on a<br />
Shimadzu UV-1601 spectrophotometer. An additional<br />
subsample was taken to determine epilithic ash-free<br />
dry mass (AFDM) by gravimetric techniques (drying at<br />
50 °C for 48 h, followed by ashing at 550 °C for 1 h).<br />
Photo'synthetic pigment concentration (mg m" 2 ) <strong>and</strong><br />
^AFDM (g m~ 2 ) were normalized to surface area determined<br />
by covering scraped surfaces with aluminium<br />
foil of known mass per unit area.<br />
Invertebrate assemblages<br />
Benthic invertebrates were collected from all sites in<br />
April 1999. Five Hess samples (surface area,<br />
0.08 m 2 sample" 1 ; mesh size, 250 mm) were taken<br />
along each 50 m reach. Samples were preserved in<br />
80% ethanol, <strong>and</strong> individuals identified to genus<br />
following Merritt & Cummins (1996), Stewart & Stark<br />
(1993) <strong>and</strong> Wiggins (1996). Chironomid larvae from<br />
all samples within a site were combined, quantitatively<br />
subsampled, mounted <strong>and</strong> identified following<br />
Epler (1995) <strong>and</strong> Merritt & Cummins (1996).<br />
To address changes in benthic community structure<br />
among sites, we quantified traditional measures of<br />
richness <strong>and</strong> evenness, <strong>and</strong> a compositional index<br />
commonly used to indicate environmental stress.<br />
Indices used to assess diversity included taxon number<br />
(S), <strong>and</strong> the Shannon-Weiner Diversity Index:<br />
where<br />
Pi represents the proportion of individuals found<br />
in the ith taxon, with values summed across all taxa<br />
(S). We also used the associated evenness measure
1414 R.A. <strong>Sponseller</strong> et al.<br />
calculated from H'. This index assumes that maximum<br />
diversity occurs when all taxa are equally<br />
abundant (i.e. H' = H'max = hi S). Therefore, the ratio<br />
of H'/H'max represents a measure of evenness where<br />
an assemblage with an equal abundance of taxa<br />
would have a value of 1 (Pielou, 1969). As an<br />
additional measure of evenness we quantified the<br />
percentage of the total numbers accounted for by the<br />
five most dominant taxa at each site (% 5 Dominant)<br />
(Barbour et al., 1999). Finally, to assess compositional<br />
differences among sites, we quantified the taxonomic<br />
richness of commonly intolerant taxa (Ephemeroptera<br />
+ Plecoptera + Trichoptera, EFT), widely used as an<br />
indicator of disturbance to stream communities (Lenat<br />
& Crawford, 1994; Wallace et al., 1996).<br />
Rank-abundance curves (sensu; Hawkins, Murphy<br />
& Anderson, 1982; Marsh-Mathews & Mathews, 2000)<br />
were generated for invertebrate assemblages at each<br />
site. Curves consisted of lognormal;:'proportional<br />
abundance (pi) for each taxon plptted against the<br />
corresponding taxonomic abundance ranking. The<br />
-slope of this line (Alog p;/n, where n = number of<br />
taxa) was used as an integrative measure of taxon<br />
richness <strong>and</strong> evenness. Diversity is maximized when<br />
the slope of the curve approaches zero. Slopes become<br />
increasingly negative when the proportional abundance<br />
(pi) of the more dominant taxa increases<br />
(i.e. evenness decreases), or when taxon richness<br />
decreases. We used the absolute value of the slope<br />
for all analyses; therefore, larger values represent<br />
steeper rank-abundance curves, <strong>and</strong> thus, less diverse<br />
assemblages.<br />
Data analysis<br />
Bivariate regression analysis was used to relate l<strong>and</strong><br />
cover variables (e.g. % non-forest) at each spatial scale<br />
to the in-stream physico-chemical variables <strong>and</strong><br />
macroinvertebrate indices measured at all sites. In<br />
Site number<br />
Scale<br />
Catchment<br />
Entire riparian<br />
corridor<br />
Sub-corridors (m)<br />
200<br />
1000<br />
2000<br />
1<br />
7.5<br />
1.2<br />
0.0<br />
0.0<br />
0.0<br />
2<br />
11.7<br />
1.9<br />
0.0<br />
0.0<br />
0.8<br />
3<br />
13.9<br />
1.3<br />
0.0<br />
3.1<br />
1.5<br />
4<br />
20.3<br />
56.3<br />
75.0<br />
92.2<br />
77.6<br />
5<br />
8.4<br />
10.8<br />
23.1<br />
7.3<br />
3.7<br />
6<br />
34.2<br />
19.2<br />
14.3<br />
4.3<br />
22.8<br />
addition, macroinvertebrate indices were used as<br />
dependent variables in stepwise multiple regression<br />
analyses with in-stream physico-chemical parameters.<br />
Variables that failed to meet a 0.05 probability value<br />
were removed from multiple regression models.<br />
Regression analysis was used to test rank-abundance<br />
curves for linearity <strong>and</strong> the slope of the lognormal<br />
plots was compared among sites using methods<br />
described in Zar (1996) with a Bonferroni correction<br />
for multiple comparisons. All regression analyses<br />
were performed on SAS 7.0 (SAS Inc., Gary, NC,<br />
U.S.A.).<br />
Results<br />
The magnitude <strong>and</strong> spatial arrangement of nonforested<br />
l<strong>and</strong> varied considerably among drainage<br />
basins at the catchment, riparian corridor <strong>and</strong> subcpTridor<br />
scales (Table 1). In addition, the proportion<br />
•of non-forested area within any given riparian corridor<br />
often varied greatly when compared with that of<br />
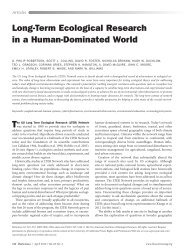
the associated catchment. For example, in four basins<br />
(Table 1, sites 1, 2, 3 <strong>and</strong> 6), the percentage non-forest<br />
in the entire riparian corridor was approximately 25%<br />
of that observed at the scale of the entire catchment;<br />
indeed sites 2 <strong>and</strong> 3 were nearly an order of<br />
magnitude lower. At the same time, the percentage<br />
non-forest within the riparian corridor increased 2.8<br />
(site 4), 1.3 (site 5), 1.4 (site 8) fold at three other sites.<br />
Within riparian corridors, the distribution of nonforested<br />
area varied in proximity to the study reach<br />
(Table 1). In basins with low non-forest cover at both<br />
the catchment <strong>and</strong> total riparian corridor scales, nonforest<br />
cover in sub-corridors was also low. For<br />
example, at sites 1-3, six of nine riparian sub-corridors<br />
were entirely forested <strong>and</strong> a maximum of only 3%<br />
was non-forest (Table 1). For basins less forested at<br />
broader spatial scales, the percentage non-forest in<br />
sub-corridors often increased substantially. For the<br />
7<br />
41.4<br />
34.7<br />
85.7<br />
80.8<br />
49.3<br />
8<br />
19.3<br />
26.4<br />
92.9<br />
55.9<br />
51.1<br />
9<br />
19.7<br />
19.9<br />
84.6<br />
77.0<br />
54.6<br />
Table 1 L<strong>and</strong>-cover patterns for the nine<br />
study basins. Values are percent nonforested<br />
l<strong>and</strong> within each scale category.<br />
Sub-corridor values are the percent of<br />
non-forested l<strong>and</strong> within a polygon of<br />
60 m width <strong>and</strong> progressively greater<br />
distances upstream from the sampling<br />
reach<br />
© <strong>2001</strong> Blackwell Science Ltd, Freshwater Biology, 46,1409-1424
four basins with the least forest cover at the catchment<br />
scale,% non-forest in the sub-corridors averaged 58%<br />
<strong>and</strong> was as great as 93%. Finally, longitudinal<br />
changes in forest cover within riparian corridors<br />
varied greatly among basins. For instance, at site 9.<br />
20% of l<strong>and</strong> cover was non-forest at both the catchment<br />
<strong>and</strong> entire riparian corridor scales. However, if<br />
only the first kilometre of the riparian corridor was<br />
considered, 80% of the l<strong>and</strong>scape was non-forest.<br />
Conversely, site 6 was classified as 34% non-forest<br />
at the catchment scale, but only 19 <strong>and</strong> 4% was<br />
non-forest at the entire riparian corridor <strong>and</strong> 1000 m<br />
sub-corridor scales, respectively.<br />
Physical responses<br />
Variation in several in-stream physical properties was<br />
related to catchment features <strong>and</strong>/or l<strong>and</strong>-cover<br />
patterns at multiple spatial scales (Table;2). For<br />
example, stream discharge ranged from 15.3 L s" 1<br />
(site 3) to-55.4 L s" 1 (site 5), varied temporally to a<br />
similar extent among streams with annual CVs<br />
ranging from 46 to 83% <strong>and</strong> was closely related to<br />
basin area (r 2 = 0.85, n = 9, P - 0.004). Mean stream<br />
temperature varied by only 4.3 °C among sites, but<br />
maximum temperature varied by 6.7 °C, with the<br />
greatest mean temperature <strong>and</strong> highest maximum<br />
temperature both at site 7. Mean stream temperature<br />
decreased with increasing altitude (r 2 = 0.78, n = 9,<br />
P = 0.002), <strong>and</strong> multiple regression indicated that the<br />
combination of altitude <strong>and</strong> the percentage non-forest<br />
at the entire riparian corridor scale explained 93% of<br />
the variation in temperature (n = 9, P = 0.02). Maximum<br />
stream temperature increased with the percentage<br />
of non-forested l<strong>and</strong> at the entire riparian<br />
corridor scale (^^.79, n = 9, P = 0.001) <strong>and</strong> at the<br />
sub-corridor scales of 2000 <strong>and</strong> 1000 m (r 2 = 0.71,<br />
n = 9, P = 0.005; r 2 = 0.71, n = 9, P = 0.005, respectively).<br />
However, the strongest relationship between<br />
maximum stream temperature <strong>and</strong> the percentage<br />
non-forest was found at the 200 m riparian subcorridor<br />
scale (r 2 = 0.81, n = 9, P = 0.001). The mean<br />
size of coarse substratum ranged from 44.8 mm<br />
at site 8 to 72.4 mm at site 2, <strong>and</strong> decreased with<br />
the percentage of non-forested l<strong>and</strong> at the catchment<br />
(r 2 = 0.56, K = 9, P = 0.02), riparian corridor<br />
(r 2 = 0.74, n = 9,P= 0.003) <strong>and</strong> 2000,1000 <strong>and</strong> 200 m<br />
<strong>and</strong> sub-corridor (r 2 = 0.80, n - 9, P = 0.001; r 2 =<br />
0.61, n = 9, P = 0.013; ^ = 0.74, n = 9, P = 0.003,<br />
© <strong>2001</strong> Blackwell Science Ltd, Freshwater Biology, 46,1409-1424<br />
Influences of l<strong>and</strong> use on stream macroinvertebrates 1415<br />
S ON<br />
CO<br />
-H-H -H<br />
vo O<br />
-H -H<br />
Os O t*s<br />
^* o co<br />
-H-H -H<br />
O<br />
CM O<br />
•H -H<br />
oq<br />
co<br />
•H<br />
CM O O O rH IS<br />
•H-H-H-H-H-H<br />
CM O O O<br />
CM O O O r-t CO<br />
•H-H-H-H-H-H<br />
T-H O O O T-H<br />
t-< O O O I-H CO<br />
•H-H-H-H-H-H<br />
ON O O O i— CO<br />
•H-H-H-H-H-H<br />
ON O in I-H O O O rH. CO<br />
•H-H -H -H-H-H-H-H-H<br />
p i—i co ON oo o vo o in oo oo ON<br />
O *** r-t O Ift I-H<br />
o o o<br />
vq o<br />
co d<br />
-H -H<br />
^< (9 p<br />
co d in<br />
•H-H -H<br />
CO CM CO rn<br />
-s<br />
3<br />
-H-H •«<br />
'•O ON ts •* CO O<br />
VO<br />
ON p<br />
•H -H<br />
I-H O O O<br />
*O Cx O O rH<br />
-H -H -H -H -H -H -H<br />
=9<br />
•H<br />
t-< d d d<br />
CM<br />
O<br />
o=<br />
"5<br />
K o o O I-H<br />
•H -H -H -H -H<br />
O I-H<br />
g S •* o<br />
*>.<br />
•H<br />
O O<br />
-H -H •H -H<br />
00 CM ON ON<br />
-H-H<br />
p in<br />
•H -H
1416 R.A. <strong>Sponseller</strong> et al.<br />
respectively) scales. The percentage of particles<br />
< 16 mm ranged from 17.1 at site 3 to 44.4 at site 8,<br />
<strong>and</strong> was only weakly related to the percentage nonforest<br />
within 200 m sub-corridor polygons (r 2 = 0.52,<br />
n = 9, P = 0.03).<br />
Chemical responses<br />
Chemical variables were also related to catchment<br />
features or l<strong>and</strong>-cover patterns at the catchment<br />
scale. Alkalinity ranged from 16 mg IT 1 at site 1 to<br />
98 mg LT 1 at site 9 <strong>and</strong> decreased with catchment<br />
altitude (r 2 = 0.63, n = 9, P = 0.01). In addition,<br />
specific conductance (us cm" 1 ) varied among sites<br />
from 47.3 at site 1 to 261.8 at site 9, <strong>and</strong> was strongly<br />
related to alkalinity (r 2 = 0.95, n = 9, P = 0.0001) <strong>and</strong><br />
altitude (r 2 = 0.67, n = 9, P = 0.007). Total inorganic<br />
N varied among sites (CV = 80%), with minimum<br />
values of 0.105 mg IT 1 (site 5) <strong>and</strong> ma)drrnlm values<br />
of 0.932 mg LT 1 (site 6), <strong>and</strong> increased with the<br />
percentage of non-forested l<strong>and</strong> at the catchment<br />
-scale (r 2 = 0.59, n=9,P = 0.02). Soluble reactive<br />
phosphorus did not differ greatly among sites<br />
(CV = 38%) <strong>and</strong> did not correspond to any physical<br />
features of the catchment, or indeed l<strong>and</strong>-cover at<br />
any spatial scale.<br />
Biological responses<br />
Based on field observation, algal assemblages were<br />
generally dominated by diatoms, although filamentous<br />
algae (e.g. Cladophora sp.) were found in abundance<br />
in streams draining catchments with extensive<br />
agricultural or urban development (e.g. sites 8 <strong>and</strong> 9).<br />
Mean annual epilithic chlorophyll a concentration<br />
ranged from a"rnjnimum of just 7.0 mg m~ 2 at site 3 to<br />
121.1 mg m~ 2 at site 8. Chlorophyll a values were<br />
lowest for sites 1-3, where averages ranged from 7.02<br />
to 27.9 mg m~ 2 ; concentrations were higher at the<br />
remaining sites with averages ranging from<br />
54.8 mg m~ 2 (site 6) to 121.1 mg m~ 2 (site 8) (Table 2).<br />
Bivariate regression analysis did show a relationship<br />
between chlorophyll a concentration <strong>and</strong> mean stream<br />
temperature (r 2 = 0.66, n = 9, P = 0.008). However,<br />
multiple regression analysis incorporated only maximum<br />
temperature into the model, explaining 73% of<br />
the variability in chlorophyll a, (n = 9, P = 0.003).<br />
Epilithic biomass ranged from 5.3 g m~ 2 at site 3<br />
to 33.8 g rrf 2 at site 9, <strong>and</strong> was closely related to<br />
epilithic chlorophyll a concentration (r 2 = 0.80, n = 9,<br />
P = 0.001).<br />
Macroinvertebrate density varied among sites from<br />
6974 m" 2 at site 3 to 15 730 m~ 2 at site 9 (Table 3).<br />
Multiple regression analysis with density as the<br />
dependent variable incorporated only epilithic biomass<br />
into the model, accounting for 87% of the<br />
variability among sites (n = 9, P- 0.0003). A total of<br />
77 macroinvertebrate taxa were identified from the<br />
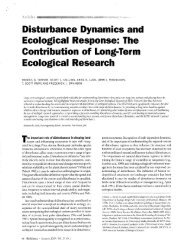
nine sites. Taxon richness ranged from 24 at site 8 to<br />
54 at site 3 with five EFT taxa at site 8 <strong>and</strong> 22 EFT taxa<br />
at sites 2 <strong>and</strong> 3 (Table 3). Results of the comparison of<br />
rank-abundance slopes indicated significant among<br />
site differences (P < 0.001, after Bonferroni correction),<br />
with three general groups emerging that represent<br />
high, medium <strong>and</strong> low diversity (Fig. 3). All<br />
rank-abundance curves fit linear models (r 2 > 0.9,<br />
P > 0.001) <strong>and</strong> slope values ranged from -0.0470 at<br />
bbth sites 1 <strong>and</strong> 2 to -0.1100 at site 7. Stepwise<br />
'multiple regression analyses between macroinvertebrate<br />
indices <strong>and</strong> in-stream physico-chemical variables<br />
generally incorporated a single independent<br />
variable into the models (Table 4). For example,<br />
the slope of rank-abundance curves increased with<br />
epilithic chlorophyll a concentration (r 2 = 0.64,<br />
n = 9, P = 0.009). Total taxon richness (S) <strong>and</strong> EFT<br />
richness decreased with maximum stream temperature<br />
(^ = 0.54, n=9, P = 0.02, 7^ = 0.75, n = 9,<br />
P = 0.003). Similarly, diversity (HO <strong>and</strong> evenness<br />
(H'/H'max) also decreased with maximum stream<br />
temperature (r 2 = 0.72, n = 9,P = 0.004; r 2 = 0.83,<br />
« = 9, P = 0.002, respectively). The percent 5 dominant<br />
taxa ranged from 55% at site 3 to 93% at site 8,<br />
<strong>and</strong> increased with increasing maximum stream<br />
temperature (r 2 = 0.75, « = 9, P = 0.003).<br />
The structure of macroinvertebrate assemblages<br />
corresponded to the variance in l<strong>and</strong>-cover patterns<br />
among catchments (Table 5). Macroinvertebrate density<br />
was most closely related to the percentage of<br />
non-forest l<strong>and</strong> at the 2000 m sub-corridor scale.<br />
Rank-abundance slopes increased with the percentage<br />
of non-forested l<strong>and</strong> at the entire riparian corridor,<br />
<strong>and</strong> at 2000 <strong>and</strong> 1000 m sub-corridor scales, but<br />
were most strongly associated with l<strong>and</strong>-cover patterns<br />
at the 200 m sub-corridor scale. In general, other<br />
measures of diversity, evenness <strong>and</strong> composition<br />
most closely corresponded to the percentage nonforest<br />
at the 200 m sub-corridor scale. Shannon's<br />
evenness decreased with the percentage non-forest,<br />
© <strong>2001</strong> Blackwell Science Ltd, Freshwater Biology, 46,1409-1424
aence Ltd, Freshwater Biology, 4<br />
\<br />
Table 3 Benthic macroinvertebrate indices for each study site. Density data are mean ± SE for five Hess samples from each 50 m study reach. Sites are presented in groups<br />
with other sites having statistically similar rank-abundance slopes<br />
Rank abundance<br />
diversity group<br />
Site number<br />
Density<br />
Taxonrichness (S)<br />
EFT taxa<br />
H'<br />
W'/H'max<br />
%5 Dominant<br />
W <br />
o '<br />
CO<br />
o '<br />
o<br />
1*<br />
o<br />
IO<br />
L*<br />
Jco<br />
IcD<br />
9<br />
15730 ± 1334<br />
40<br />
16<br />
1.98<br />
0.54<br />
83.3<br />
fe<br />
Low<br />
8<br />
13907 ± 671<br />
30<br />
11<br />
1.78<br />
0.52<br />
89.5<br />
7<br />
8923 ± 2664<br />
24<br />
5<br />
1.20<br />
0.38<br />
92.9<br />
Proportional abundance (P,)<br />
p p -» _* _k<br />
2 - ° S
1418 R.A. <strong>Sponseller</strong> et al.<br />
Table 5 Regression coefficients (r 2 ) for significant bivariate regressions (n = 9, P < 0.05) between macroinvertebrate indices <strong>and</strong><br />
the percentage non-forest at five spatial scales. R-A slope = absolute value of rank-abundance slopes, ns = Not significant<br />
Catchment<br />
Riparian corridor<br />
Sub-corridors (m)<br />
2000<br />
1000<br />
200<br />
Density<br />
ns<br />
ns<br />
0.57<br />
ns<br />
0.54<br />
R-A slope<br />
ns<br />
0.44<br />
0.51<br />
0.61<br />
0.82<br />
Taxon richness<br />
ns<br />
ns<br />
ns<br />
0.42<br />
0.64<br />
only at the 200 m sub-corridor scale. Taxon richness,<br />
diversity, the percent five dominant taxa <strong>and</strong> EPT taxa<br />
richness were most strongly related to l<strong>and</strong> cover<br />
within 200 m sub-corridors, but were also significantly<br />
related to l<strong>and</strong>-cover patterns in other subcorridors.<br />
In addition, EPT taxa richness was related<br />
to the percentage non-forest at catchment scale<br />
<strong>and</strong> was the only macroinvertebrate' irtdex that<br />
corresponded to l<strong>and</strong>-cover patterns at all spatial .<br />
scales evaluated.<br />
Discussion<br />
The observed variability in many of the chemical<br />
constituents studied in the URRB streams can be<br />
attributed to physical features (e.g. altitude) or l<strong>and</strong>cover<br />
patterns at the catchment scale. The relationships<br />
between alkalinity, specific conductance <strong>and</strong><br />
altitude probably reflect shifts in catchment geology<br />
(Waller, 1976). In this part of the URRB, catchments at<br />
high altitude are dominated by clastic materials (both<br />
granitic <strong>and</strong> sedimentary) <strong>and</strong> have relatively low<br />
alkalinity <strong>and</strong> specific conductance when compared<br />
with low altitude streams that are influenced more by<br />
soluble parenHithology. The three catchments nearest<br />
the town of Salem, Virginia (sites 7, 8 <strong>and</strong> 9) include<br />
both clastic <strong>and</strong> carbonate materials, <strong>and</strong> subsequently<br />
had the highest alkalinity <strong>and</strong> specific conductance<br />
concentrations among sites. Variation in<br />
stream-water TIN was only related to the percentage<br />
non-forest at the catchment scale. This is consistent<br />
with many studies that have shown l<strong>and</strong>-cover at the<br />
catchment scale to be a good predictor of in-stream<br />
nutrient concentration, particularly nitrate (Omernik,<br />
1977; Close & Davies-Colley, 1990; Hunsaker &<br />
Levine, 1995; Johnson et al, 1997).<br />
In-stream physical variables were also closely<br />
related to l<strong>and</strong>-cover patterns, particularly at the<br />
H'<br />
ns<br />
ns<br />
ns<br />
0.43<br />
0.64<br />
H'/Hmax<br />
ns<br />
ns<br />
ns<br />
ns<br />
0.60<br />
%5 Dominant<br />
ns<br />
ns<br />
0.44<br />
0.50<br />
0.76<br />
EPTtaxa<br />
0.46<br />
0.52<br />
0.45<br />
0.52<br />
0.68<br />
riparian corridor <strong>and</strong> sub-corridor scales. Mean<br />
stream temperature, although related to altitude,<br />
was also influenced by l<strong>and</strong>-cover patterns within<br />
riparian corridors. Moreover, maximum temperature<br />
was strongly related to the percentage non-forest at<br />
the scale of the 200 m riparian sub-corridor. High<br />
mean <strong>and</strong> maximum stream temperature may result<br />
from solar radiation reaching the stream channel<br />
'(Burton & Likens, 1973; Beschta & Taylor, 1988;<br />
Rutherford et al., 1997), <strong>and</strong>/or from run-off heated<br />
by impervious surfaces in residential areas (Galli,<br />
1991). The local influence of l<strong>and</strong>-cover on stream<br />
thermal regimes (i.e. at the 200 m sub-corridor scale)<br />
supports the idea that temperature can change quickly<br />
(with respect to longitudinal distance) when streamside<br />
vegetation is removed in headwater catchments.<br />
Burton & Likens (1973) found summer stream-water<br />
temperature fluctuations of 4-5 °C, alternating<br />
between 50 m reaches where riparian vegetation had<br />
been experimentally removed or left intact in Hubbard<br />
Brook streams. Similarly, Storey & Cowley (1997)<br />
showed that high temperature in pasture streams of<br />
New Zeal<strong>and</strong> return to 'forested control' levels after<br />
running through approximately 300 m of remnant<br />
riparian forests.<br />
Substratum characteristics were also influenced by<br />
catchment l<strong>and</strong> use. Mean substratum particle size<br />
was inversely related to the percentage non-forest at<br />
all spatial scales, but the strongest relationships were<br />
observed at the 2000 m sub-corridor scale. The<br />
percentage of particles
particularly when these occur adjacent to the channel<br />
(Lenat et al., 1981; Waters, 1995; Richards et al., 1996).<br />
Several- studies have also reported that intact<br />
streamside vegetation inhibits the delivery of sediments<br />
to streams. Peterjohn & Correll (1984) found<br />
that 19 m of riparian forests removed up to 90% of the<br />
particulate materials moving overl<strong>and</strong> from agricultural<br />
areas. Similarly, Robinson, Ghaffarzadeh &<br />
Cruse (1996) showed that the initial 3 m of riparian<br />
forests removed more than 70% of sediment run-off to<br />
Iowa streams.<br />
Among site variability in chlorophyll a <strong>and</strong> epilithic<br />
st<strong>and</strong>ing crop was also related to in-stream physicochemical<br />
changes induced by l<strong>and</strong>-cover patterns<br />
within riparian corridors. Chlorophyll a was closely<br />
related to thermal regimes in URRB streams, probably<br />
reflecting the influence of both stream temperature<br />
<strong>and</strong> light availability on benthic algae. Several studies<br />
have demonstrated a positive relationship-between<br />
stream temperature arid algal growth (Bothwell, 1988;<br />
Duncan &-Biinn, 1989; Suzuki & Takahashi, 1995) <strong>and</strong><br />
others have attributed greater algal biomass in forested<br />
regions to local increases in light availability<br />
(Lowe, Golladay & Webster, 1986; Hill & Harvey,<br />
1990; Quinn et al, 1997). Interestingly, while many<br />
studies have linked algal abundance <strong>and</strong> nutrient<br />
availability (Fairchild, Lowe & Richardson, 1985;<br />
Grimm & Fisher, 1986; Biggs, 1995), variability in<br />
algal biomass in this study was not related to<br />
in-stream concentrations of TIN or SRP. However,<br />
neither TIN nor SRP were low enough at our study<br />
sites to be considered limiting (Grimm & Fisher, 1986;<br />
Lohman, Jones & Baysinger-Daniel, 1991). The interplay<br />
between thermal regime <strong>and</strong> nutrient availability<br />
was demonstrated by Bothwell (1988); in the absence<br />
of nutrient limitation, stream temperature explained<br />
90% of the annual variability in benthic algal growth.<br />
Changes in algal cover among sites had a strong<br />
influence on the benthos, as macroinvertebrate density<br />
was highest at sites with the highest algal biomass<br />
<strong>and</strong> biofUm st<strong>and</strong>ing stocks. This relationship is most<br />
likely driven by differences in chironomid abundance,<br />
which ranged in two orders of magnitude among<br />
sites. Many studies have indicated that invertebrate<br />
density <strong>and</strong> production may increase with greater<br />
algal biomass (e.g. Dudley, Cooper & Hemphill, 1986;<br />
Behmer & Hawkins, 1986; Richards & Minshall, 1988;<br />
Death & Winterbourn, 1995). Furthermore, studies in<br />
impacted stream ecosystems (mostly agricultural)<br />
© <strong>2001</strong> Blackwell Science Ltd, Freshwater biology, 46,1409-1424<br />
Influences of l<strong>and</strong> use on stream macroinvertebrates 1419<br />
have documented high macroinvertebrate density,<br />
often associated with numerical dominance by environmentally<br />
tolerant taxa (Lenat & Crawford, 1994;<br />
Harding & Winterbourn, 1995; Quinn et al, 1997).<br />
High density at some sites in the URRB may also be<br />
related to the presence of filamentous algae. Dudley,<br />
. Hemphill & Cooper (1986) suggested that the abundance<br />
of Cladophora sp. might influence invertebrate<br />
density directly as a food source or by accumulating<br />
other food resources (e.g. detritus, smaller epiphytes),<br />
or indirectly by increasing habitat availability. In our<br />
study, highest algal st<strong>and</strong>ing crops, <strong>and</strong> macroinvertebrate<br />
density were measured at sites 8 <strong>and</strong> 9, where<br />
the epilithon was commonly dominated by filamentous<br />
green algae.<br />
The use of rank-abundance curves allowed us<br />
statistically to assess differences in macroinvertebrate<br />
assemblage structure among sites. We identified<br />
three groups of streams that differed in the<br />
number <strong>and</strong> relative proportion of benthic taxa. Sites<br />
""with low diversity <strong>and</strong> high dominance had the<br />
steepest rank-abundance slopes (sites 7 <strong>and</strong> 8) <strong>and</strong><br />
were characterized by large numbers of only a few<br />
chironomid taxa, particularly members of the Orthocladius/Cricocladius<br />
group. The group with intermediate<br />
rank-abundance slopes (sites 4, 5 <strong>and</strong> 9) had<br />
either slightly higher overall diversity, in conjunction<br />
with high dominance by Orthocladius/'Cricocladius<br />
chironomids (site 9), or had relatively diverse<br />
chironomid assemblages (sites 4 <strong>and</strong> 5). The group<br />
with rank-abundance slopes approaching zero had<br />
the most diverse macroinvertebrate assemblages,<br />
including a greater abundance of more sensitive<br />
taxa (e.g. EPT taxa), <strong>and</strong> frequently more than 10<br />
chironomid taxa. As was the case with macroinvertebrate<br />
density, rank-abundance slopes increased<br />
among sites with algal biomass, probably reflecting<br />
the numerical dominance of Orthodadius/Cricocladius<br />
chironomids at sites with the highest algal cover<br />
(e.g. sites 7 <strong>and</strong> 8).<br />
Other macroinvertebrate indices corresponded well<br />
to the three groups that emerged from the comparison<br />
of rank-abundance slopes, suggesting these curves<br />
adequately described assemblage structure in URRB<br />
streams. In addition, results from multiple regression<br />
analyses indicated that variation in index values<br />
among sites was most closely related to the thermal<br />
regimes, with diversity, evenness <strong>and</strong> EPT taxa<br />
richness being lowest at sites with the highest
1420 R.A. <strong>Sponseller</strong> et al.<br />
maximum stream temperature. Results from these<br />
analyses should be interpreted with some caution,<br />
however (see MacNally, 2000). Although each multiple<br />
regression incorporated only maximum stream<br />
temperature into the model, it is probable that other<br />
instream features (e.g. substratum size, flow regime,<br />
etc.) interact with the thermal regime to generate the<br />
habitat template (sensu Southwood, 1977; Poff &<br />
Ward, 1990) upon which macroinvertebrate assemblages<br />
are structured.<br />
The influence of temperature on the life history <strong>and</strong><br />
ecology of aquatic insects is well documented (Vannote<br />
& Sweeney, 1980; Ward & Stanford, 1982;<br />
Sweeney & Vannote, 1986; Quinn et al., 1994). Ward<br />
& Stanford (1982) suggested that large diel fluctuations<br />
in stream temperature might lead to increased<br />
macroinvertebrate diversity by generating acceptable<br />
thermal conditions, <strong>and</strong> the potential for niche segregation<br />
among a wide range of benthic-taxa. In the<br />
current study, this relationship between thermal<br />
regime <strong>and</strong> diversity may not hold if maximum<br />
-stream temperatures become too high, especially for<br />
thermally sensitive taxa such as many stoneflies<br />
(Vannote & Sweeny, 1980; Sweeney, Vannote &<br />
Dodds, 1986; Quinn et al, 1994). Sweeney (1993)<br />
suggested that changes in temperature of 3-5 °C in<br />
Piedmont streams lacking riparian cover is sufficient<br />
to deleteriously alter larval recruitment <strong>and</strong> growth<br />
for many mayfly taxa. In addition to this, reduced<br />
macroinvertebrate diversity has been attributed to<br />
high maximum temperatures in both large regulated<br />
rivers (Fraley, 1979) <strong>and</strong> New Zeal<strong>and</strong> pasture<br />
streams (Quinn & Hickey, 1990; Quinn et al, 1997;<br />
Storey & Cowley, 1997). In the URRB, both mean <strong>and</strong><br />
maximum temperature in streams draining forested<br />
catchments (sites 1-3) were ~3-6 °C lower than<br />
streams draining catchments with current l<strong>and</strong> use<br />
activities (sites 4-9). Moreover, sites 1-3 also had the<br />
most diverse <strong>and</strong> even macroinvertebrate assemblages<br />
among streams in this study.<br />
Macroinvertebrate diversity decreased among<br />
catchments with the percentage of non-forested l<strong>and</strong>,<br />
although only when appropriate spatial scales were<br />
used in analyses. Several studies comparing macroinvertebrate<br />
assemblages among basins characterized<br />
by different l<strong>and</strong>-use practices (e.g. native forest<br />
versus pasture) or parent geology have documented<br />
predictive ability at the catchment-scale (Lenat &<br />
Crawford, 1994; Harding & Winterbourn, 1995;<br />
Richards et al, 1996; Quinn et al, 1997). However, in<br />
our study, the relationship between l<strong>and</strong>-cover <strong>and</strong><br />
macro-invertebrate assemblage structure was strongest<br />
at the 200 m sub-corridor scale. This suggests that<br />
changes induced by local, near-stream development<br />
are sufficient to alter community structure, regardless<br />
of l<strong>and</strong>-cover patterns found further upstream. For<br />
example, the catchment of site 5 was over 90%<br />
forested when classified at the catchment scale, yet<br />
the first 200 m of riparian corridor upstream of the<br />
study reach was classified as ~25% non-forested as a<br />
result of recent (~5-15 year) residential development.<br />
Assemblage structure at site 5 had low taxon richness<br />
(40 taxa), <strong>and</strong> EFT taxa richness (15 taxa), suggesting<br />
that local l<strong>and</strong>-cover patterns had a strong influence<br />
on habitat quality. Similarly, studies investigating the<br />
importance of road construction (Lenat et al, 1981)<br />
<strong>and</strong> run-off from agricultural areas (Lemly, 1982) have<br />
documented the influence of local, streamside development<br />
on macroinvertebrate assemblages, including<br />
shifts in numeric dominance to intolerant taxa like<br />
chironomids. <strong>Sponseller</strong> & <strong>Benfield</strong> (<strong>2001</strong>) found that<br />
riparian l<strong>and</strong>-cover within 1 km of the study sites was<br />
the strongest l<strong>and</strong>scape predictor for leaf breakdown<br />
rate in URRB streams. Current results suggest that<br />
community structure may be more sensitive to local<br />
l<strong>and</strong>-use disturbances than ecosystem processes that<br />
incorporate both biotic <strong>and</strong> abiotic components, which<br />
appear to be organized at broader spatial scales. This<br />
supports the idea that functional <strong>and</strong> taxonomic<br />
responses to disturbance do not necessarily correspond<br />
to one another (e.g. Wallace, Vogel & Cuffney,<br />
1986).<br />
The spatial relationship between l<strong>and</strong>-cover <strong>and</strong><br />
macroinvertebrate indices also suggests that local,<br />
upstream patches of riparian forest may have an<br />
ameliorative effect on macroinvertebrate assemblages.<br />
For example, the stream at site 6 drains a catchment<br />
subject to a mixture of l<strong>and</strong>-use practices (both<br />
agriculture <strong>and</strong> residential), yet several hundred<br />
metres of riparian corridor remain forested upstream<br />
of the sampling site. The macroinvertebrate assemblage<br />
at site 6.was fairly diverse (51 taxa), <strong>and</strong> analysis<br />
of rank-abundance curves grouped this stream with<br />
those completely lacking urban or agricultural development.<br />
Storey & Cowley (1997) compared macroinvertebrate<br />
assemblages in upstream pasture reaches<br />
with downstream sites, after streams ran through<br />
approximately 600 m of native riparian forest. They<br />
© <strong>2001</strong> Blackwell Science Ltd, freshwater Biology, 46,1409-1424
1422 R.A. <strong>Sponseller</strong> et al.<br />
Close M.E. & Davies-Colley R.J. (1990) Baseflow chemistry<br />
in New Zeal<strong>and</strong> rivers 2. Influence of environmental<br />
factors. New Zeal<strong>and</strong> Journal of Marine <strong>and</strong><br />
Freshwater Research, 24,343-356.<br />
Death R.G. & Winterbourn M.J. (1995) Diversity patterns<br />
in stream benthic invertebrate communities: the influence<br />
of habitat stability. Ecology, 76,1446-1460. .<br />
Dudley T.L., Cooper S.D. & Hemphill N. (1986) Effects of<br />
macroalgae on a stream invertebrate community.<br />
Journal of the North American Benthological Society, 5,<br />
93-106.<br />
Duncan S.W. & Blinn D.W. (1989) Importance of physical<br />
variables on the seasonal dynamics of epilithic algae in<br />
a highly shaded canyon stream. Journal ofPhycology, 25,<br />
455-461.<br />
Epler J.H. (1995) Identification Manual for the Larval<br />
Chironomidae (Diptera) of Florida. Revised edition. Florida<br />
Department of Environmental Protection, Tallahassee,<br />
FL.<br />
Fairchild G.W., Lowe R.L. & Richardson W.B. (1985)<br />
Algal periphyton growth on nutrientTdiffusing substrates:<br />
an in situ bioassay. Ecology,.€6, 465-472. ___,,<br />
Fraley J.J. (1979) Effects of elevated stream temperatures<br />
- below a shallow reservoir on a cold water macroinvertebrate<br />
fauna. In: The Ecology of Regulated Streams<br />
(Eds J.V. Ward & J.A. Stanford), pp. 257-272. Plenum<br />
Press, New York.<br />
Galli J. (1991) Thermal Impacts Associated with Urbanization<br />
<strong>and</strong> Stormwater Management, Best Management Practices.<br />
Metropolitan Washington Council of Governments. Maryl<strong>and</strong><br />
Department of Environment, Washington, DC,<br />
188 pp.<br />
Gore J.A. (1996) Discharge measurements <strong>and</strong> streamflow<br />
analysis. In: Methods in Stream Ecology (Eds<br />
F.R. Hauer & G.A. Lamberti), pp. 53-74. Academic<br />
Press, San Diego, CA.<br />
Gregory S.V., Swanson F.J., Mckee W.A. & Cummins<br />
K.W. (1991) An ecosystem perspective of riparian<br />
zones. Bioscience, 41, 540-551.<br />
Grimm N.B. & Fisher S.G. (1986) Nitrogen limitation in a<br />
Sonoran Desert stream. Journal of the North American<br />
Benthological Society, 5, 2-15.<br />
Gurtz E.G. & Wallace J.B. (1984) Substrate-mediated<br />
response of stream invertebrates to disturbance. Ecology,<br />
65,1556-1569.<br />
Harding J.S., <strong>Benfield</strong> E.F., Bolstad P.V., Helfman G.S. &<br />
Jones E.B.D. (1998) Stream biodiversity: the ghost of<br />
l<strong>and</strong> use past. Proceedings of the National Academy of<br />
Science, 95,14843-14847.<br />
Harding J.S. & Winterbourn M.J. (1995) Effects of<br />
contrasting l<strong>and</strong> use on physico-chemical conditions<br />
<strong>and</strong> benthic assemblages of streams in a Canterbury<br />
(South Isl<strong>and</strong>, New Zeal<strong>and</strong>) river system. New<br />
Zeal<strong>and</strong> Journal of Marine <strong>and</strong> Freshwater Research, 29,<br />
479-192.<br />
Hawkins C.P., Murphy M.L. & Anderson N.H. (1982)<br />
The effects of canopy, substrate composition, <strong>and</strong><br />
gradient on the structure of macroinvertebrate communities<br />
in Cascade Range streams of Oregon. Ecology,<br />
63,1840-1856.<br />
Hill W.R. & Harvey B.C. (1990) Periphyton responses to<br />
higher trophic levels <strong>and</strong> light in a shaded stream.<br />
Canadian Journal of Fisheries <strong>and</strong> Aquatic Science, 47,<br />
2307-2314.<br />
Hunsaker C.T. & Levine D.A. (1995) Hierarchical approaches<br />
to the study of water quality in rivers. Bioscience,<br />
45,193-203.<br />
Johnson L.B., Richards C, Host G. & Arthur J.W. (1997)<br />
L<strong>and</strong>scape influences on water chemistry in Midwest<br />
stream ecosystems. Freshwater Biology, 37,193-208.<br />
Lemly D. (1982) Modification of benthic insect communities<br />
in polluted streams: combined effects of sedimentation<br />
<strong>and</strong> nutrient enrichment. Hydrobiologia, 87,<br />
/229-24S.<br />
Lenat D.R. & Crawford J.K. (1994) Effects of l<strong>and</strong> use on<br />
water quality <strong>and</strong> aquatic biota of three North Carolina<br />
Piedmont streams. Hydrobiologia, 294,185-199.<br />
Lenat D.R., Penrose D.L. & Eagleson K.W. (1981) Variable<br />
effects of sediment addition on stream benthos.<br />
Hydrobiologia, 79,187-199.<br />
Lohman K., Jones R.K. & Baysinger-Daniel C. (1991)<br />
Experimental evidence for nitrogen limitation in a<br />
northern Ozark stream. Journal of the North American<br />
Benthological Society, 10,14-23.<br />
Lowe R.L., Golloday S.W. & Webster J.R. (1986) Periphyton<br />
response to nutrient manipulation in streams<br />
draining clearcut <strong>and</strong> forested watersheds. Journal of<br />
the North American Benthological Society, 5,221-229.<br />
MacNally R. (2000) Regression <strong>and</strong> model building in<br />
conservation biology, biogeography <strong>and</strong> ecology: The<br />
distinction between - <strong>and</strong> reconciliation of - 'predictive'<br />
<strong>and</strong> 'explanatory' models. Biodiversity <strong>and</strong> Conservation,<br />
9, 655-671.<br />
Marsh-Mathews E. & Mathews W.J. (2000) Spatial variation<br />
in relative abundance of a widespread, numerically<br />
dominant fish species <strong>and</strong> its effect on fish<br />
assemblage structure. Oecologia, 125,283-292.<br />
Merritt R.W. & Cummins K.W. (1996) An Introduction to<br />
the Aquatic Insects of North America, 3rd edn. Kendall/<br />
Hunt Publishing Co., Dubuque, Iowa.<br />
Morton D.D. (1998) L<strong>and</strong> Cover of Virginia from L<strong>and</strong>sat<br />
Thematic Mapper Images. Master's Thesis. Virginia<br />
Polytechnic Institute <strong>and</strong> State University, Blacksburg,<br />
VA.<br />
Murphy J. & Riley J.P. (1962) Determination of phosphate<br />
in natural waters. Analytica Chimica Acta, 27,31-36.<br />
© <strong>2001</strong> Blackwell Science Ltd, Freshwater Biology, 46,1409-1424
Omernik J.M. (1977) Nonpoint source - stream nutrient<br />
level relationships: a nationwide study. US EPA - 600/<br />
3-77-105; Corvallis, Oregon.<br />
Peterjohn W.T. & Correll D.L. (1984) Nutrient dynamics<br />
in an agricultural watershed: observations on the role<br />
of a riparian forest. Ecology, 65,1466-1475.<br />
Pielou B.C. (1969) An Introduction to Mathematical Ecology.-<br />
Wiley, New York.<br />
Poff N.L., Allan J.D., Bain M.B., Karr J.R., Prestegaard<br />
K.L., Richter B.R., Sparks R.E. & Stromberg J.C. (1997)<br />
The natural flow regime. Bioscience, 47, 769-784.<br />
Poff N.L. & Ward J.V. (1990) Physical habitat template of<br />
lotic systems: recovery in the context of historical<br />
pattern of spatiotemporal heterogeneity. Environmental<br />
Management, 14, 629-645.<br />
Quinn J.M., Cooper A.B., Davies-Colley R.J., Rutherford<br />
J.C. & Williamson R.B. (1997) L<strong>and</strong> use effects on<br />
habitat, water quality, periphyton, <strong>and</strong> benthic invertebrates<br />
in Waikato, New Zeal<strong>and</strong> hill country streams.<br />
New Zeal<strong>and</strong> Journal of Marine <strong>and</strong> Freshwater Research,<br />
31,569-577. ' /•'*"<br />
Quinn J.M. & Rickey C.W. (1990) Characterization <strong>and</strong><br />
classification of benthic invertebrate communities in 88<br />
New Zeal<strong>and</strong> rivers in relation to environmental<br />
factors. New Zeal<strong>and</strong> Journal of Marine <strong>and</strong> Freshwater<br />
Research, 24,387-409.<br />
Quinn J.M., Steele G.L., Hickey C.W. & Vickers M.L.<br />
(1994) Upper thermal tolerances of twelve common<br />
New Zeal<strong>and</strong> stream invertebrate species. New Zeal<strong>and</strong><br />
Journal of Marine <strong>and</strong> Freshwater Research, 28,391-397.<br />
Richards C, Haro R.J., Johnson L.B. & Host G.E. (1997)<br />
Catchment <strong>and</strong> reach-scale properties as indicators of<br />
macroinvertebrate species traits. Freshwater Biology, 37,<br />
219-230.<br />
Richards C., Johnson L.B. & Host G.E. (1996) L<strong>and</strong>scapescale<br />
influences on stream habitats <strong>and</strong> biota. Canadian<br />
Journal of Fisheries <strong>and</strong> Aquatic Sciences, 53, 295-311.<br />
Richards C. & Minshall G.W. (1988) The influence of<br />
periphyton abundance on Baetis bicaudatus distribution<br />
<strong>and</strong> colonization in a small stream. Journal of the North<br />
American Benthobgical Society, 7, 77-86.<br />
Robinson C.A., Ghaffarzadeh M. & Cruse R.M. (1996)<br />
Vegetative filter strip effects on sediment concentration<br />
in cropl<strong>and</strong> runoff. Journal of Soil <strong>and</strong> Water Conservation,<br />
50, 227-230.<br />
Rutherford J.C., Blackett 5., Blackett C., Saito L. & Davies-<br />
Colley R.J. (1997) Predicting the effects of shade on<br />
water temperature in small streams. New Zeal<strong>and</strong><br />
Journal of Marine <strong>and</strong> Freshwater Research, 31,707-721.<br />
SAS Institute (1998) Version 7. Gary, NC.<br />
Soloranzo L. (1969) Determination of ammonium in<br />
natural waters by the phenolhypochlorite method.<br />
Limnology <strong>and</strong> Oceanography, 14,799-801.<br />
© <strong>2001</strong> BlackweU Science Ltd, Freshwater Biology, 46,1409-1424<br />
Influences of l<strong>and</strong> use on stream macroinvertebrates 1423<br />
Southern Appalachian Man <strong>and</strong> the Biosphere (SAMAB)<br />
(1996) The Southern Appalachian assessment Summary<br />
Report: Report 1 of 5. US Department of Agriculture,<br />
Forest Service, Southern Region, Atlanta.<br />
Southwood T.R.E. (1977) Habitat, the templet for ecological<br />
strategies? Journal of Animal Ecology, 46,337-365.<br />
<strong>Sponseller</strong> R.A. & <strong>Benfield</strong> E.F. (<strong>2001</strong>) Influences on l<strong>and</strong><br />
use on leaf breakdown in southern Appalachian<br />
headwater streams: a multiple scale analysis. Journal<br />
of the North American Benthological Society, 20,44-59.<br />
Steinman A.D. & Lamberti G.A. (1996) Biomass <strong>and</strong><br />
pigments of benthic algae. In: Methods in Stream Ecology<br />
(Eds F.R. Hauer & G.A. Lamberti), pp. 295-314.<br />
Academic Press, San Diego, CA.<br />
Stewart K.W. & Stark B.P. (1993) Nymphs of North<br />
American Stonefly Genera (Plecoptera). University of<br />
North Texas Press, Denton, Texas.<br />
Storey R.G. & Cowley D.R. (1997) Recovery of three New<br />
Zeal<strong>and</strong> rural streams as they pass through native<br />
forest remnants. Hydrobiologia, 353, 63-76.<br />
Suzuki Y. & Takahashi M. (1995) Growth resonses of<br />
, • several diatoms species from various environments to<br />
temperature. Journal ofPhycobgy, 31, 880-888.<br />
Swank W.T., Swift L.W. & Douglass J.E. (1988) Streamflow<br />
changes associated with forest cutting, species<br />
conversions, <strong>and</strong> natural disturbances. In: Ecological<br />
Studies 66. Forest Hydrology <strong>and</strong> Ecology at Coweeta (Eds<br />
W.T. Swank & D.A. Crossely), pp. 297-312. Springer-<br />
Verlag, New York, NY.<br />
Sweeney B.W. (1993) Effects of streamside vegetation on<br />
macroinvertebrate communities of White Clay Creek<br />
in eastern North America. Proceedings of the Academy of<br />
Natural Sciences of Philadelphia, 144,291-340.<br />
Sweeney B.W. & Vannote R.L. (1986) Growth <strong>and</strong><br />
production of a stream stonefly: influences of diet<br />
<strong>and</strong> temperature. Ecology, 67,1396-1410.<br />
Sweeney B.W., Vannote R.L. & Dodds P.J. (1986) The<br />
relative importance of temperature <strong>and</strong> diet to larval<br />
development <strong>and</strong> adult size of the winter stonefly,<br />
Soyedma carolinensis (Plecoptera: Nemouridae). Freshwater<br />
Biology, 16, 39-48.<br />
Vannote R.L. & Sweeney B.W. (1980) Geographic analysis<br />
of thermal equilibria: a conceptual model for<br />
evaluating the effect of natural <strong>and</strong> modified thermal<br />
regimes on aquatic insect communities. American<br />
Naturalist, 115, 667-695.<br />
Wallace J.B., Grubaugh J.W. & Whiles M.R. (1996) Biotic<br />
indices <strong>and</strong> stream ecosystem processes: results from an<br />
experimental study. Ecological Applications, 6,140-151.<br />
Wallace J.B., Vogel D.S. & Cuffney T.F. (1986) Recovery<br />
of a headwater stream from an insecticide-induced<br />
community disturbance. Journal of the North American<br />
Benthological Society, 5,115-126.
1424 R.A. <strong>Sponseller</strong> et al.<br />
Waller J.O. (1976) Geohydrology of the Upper Roanoke River<br />
Basin, Virginia. Virginia State Water Control Board -<br />
Planning Bulletin 302. Bureau of Water Control Management,<br />
Richmond, Virginia, 148 p.<br />
Ward J.V. & Stanford J.A. (1982) Thermal response in the<br />
evolutionary ecology of aquatic insects. AnnwlReview<br />
of Entomology, 27,97-117.<br />
Waters T.F. (1995) Sediment in Streams: Sources, Biological<br />
Effects <strong>and</strong> Control. American Fisheries Society Monograph<br />
7. American Fisheries Society, Bethesda, Maryl<strong>and</strong>.<br />
Wear D.N. & Bolstad P. (1998) L<strong>and</strong>-use changes in<br />
southern appalachian l<strong>and</strong>scapes: spatial analysis <strong>and</strong><br />
forecast evaluation. Ecosystems, \, 575-594.<br />
Webster J.R., Gurtz M.E., Hains J.J., Meyer J.L., Swank<br />
W.T., Waide J.B. & Wallace J.B. (1983) Stability of<br />
stream ecosystems. In: Stream Ecology (Eds J.B. Barnes<br />
& G.W. Minshall), pp. 355-394. Plenum Press, New<br />
York.<br />
Wetzel R.G. & Likens G.E. (1991) Limnokgical Analyses,<br />
2nd edn. Springer-Verlag, New York, NY:<br />
Wiggins G.B. (1996) larvae of the North American Caddisfly<br />
Genera (Trichoptera). University of Toronto Press Inc,<br />
Toronto, Canada.<br />
Wolman M.G. (1954) A new method of sampling coarse<br />
riverbed. Transactions of the American Geophysical Union,<br />
35, 951-956.<br />
Wood E.D., Armstrong F.A.J. & Richards F.A. (1967)<br />
Determination of nitrate in seawater by cadmiumcopper<br />
reduction to nitrate. Journal of the Marine Biology<br />
Association of the United Kingdom, 47, 23-31.<br />
Yarnell S.L. (1998) The Southern Appalachians: a History of<br />
the L<strong>and</strong>scape. General Technical Report SRS-18. U.S.<br />
Department of Agriculture, Forest Service, Southern<br />
Research Station, Asheville, NC, 45 pp.<br />
Zar J.H. (1996) Biostatistical Analysis, 3rd edn. Prentice<br />
Hall Inc., Upper Saddle River, NJ.<br />
(Manuscript accepted 5 January <strong>2001</strong>)<br />
© <strong>2001</strong> Blackwell Science Ltd, Freshwater Biology, 46,1409-1424