biology join - Coweeta LTER - University of Georgia
biology join - Coweeta LTER - University of Georgia
biology join - Coweeta LTER - University of Georgia

You also want an ePaper? Increase the reach of your titles
YUMPU automatically turns print PDFs into web optimized ePapers that Google loves.
Articles<br />
Long-Term Ecological Research<br />
in a Human-Dominated World<br />
G. PhiliP RobeRtson, scott l. collins, DaviD R. FosteR, nicholas bRokaw, huGh w. Ducklow,<br />
teD l. GRaGson, coRinna GRies, stePhen k. hamilton, a. DaviD mcGuiRe, John c. mooRe,<br />
emily h. stanley, RobeRt b. waiDe, anD maRk w. williams<br />
The US Long Term Ecological Research (<strong>LTER</strong>) Network enters its fourth decade with a distinguished record <strong>of</strong> achievement in ecological science.<br />
The value <strong>of</strong> long-term observations and experiments has never been more important for testing ecological theory and for addressing<br />
today’s most difficult environmental challenges. The network’s potential for tackling emergent continent-scale questions such as cryosphere loss<br />
and landscape change is becoming increasingly apparent on the basis <strong>of</strong> a capacity to combine long-term observations and experimental results<br />
with new observatory-based measurements, to study socioecological systems, to advance the use <strong>of</strong> environmental cyberinfrastructure, to promote<br />
environmental science literacy, and to engage with decisionmakers in framing major directions for research. The long-term context <strong>of</strong> network<br />
science, from understanding the past to forecasting the future, provides a valuable perspective for helping to solve many <strong>of</strong> the crucial environmental<br />
problems facing society today.<br />
Keywords: coupled natural–human systems, cyberinfrastructure, environmental observatories, environmental education, socioecological systems<br />
The US Long Term Ecological Research (<strong>LTER</strong>) Network<br />
was started in 1980 to provide sites for ecologists to<br />
address questions that require long periods <strong>of</strong> study in<br />
order to be resolved. Hypothesis-driven research conducted<br />
over an extended period is a hallmark <strong>of</strong> the <strong>LTER</strong> Network<br />
today and the foundation <strong>of</strong> its scientific contributions<br />
(see Callahan 1984, Franklin et al. 1990, Hobbie et al. 2003).<br />
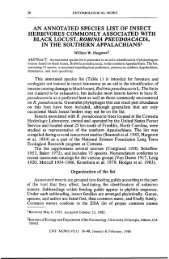
At 26 sites (figure 1), ecologists conduct synthetic and crosssite<br />
research that builds on site-based data, experiments, and<br />
models across diverse regions.<br />
Historically, studies at <strong>LTER</strong> Network sites have addressed<br />
long-term questions not easily addressed in short-term<br />
funding cycles: How do populations change in response to<br />
long-term environmental forcings such as landscape and<br />
climate change? How do these changes affect biodiversity<br />
and trophic interactions and, in turn, primary productivity,<br />
element cycles, and other ecosystem processes? What are<br />
the lags in ecosystem responses to and the legacies <strong>of</strong> past<br />
human and natural disturbances? What precipitates ecological<br />
tipping points, and are such changes predictable?<br />
These questions are broadly applicable to all ecosystems,<br />
and as the value <strong>of</strong> addressing them became clear during<br />
the first 20 years <strong>of</strong> the program, the <strong>LTER</strong> Network grew to<br />
include additional biomes and ecosystem types, to encompass<br />
broader regional scales <strong>of</strong> inquiry, and to incorporate<br />
human-dominated systems in its research. Today’s network<br />
<strong>of</strong> forest, grassland, desert, freshwater, coastal, and other<br />
ecosystems spans a broad geographic range <strong>of</strong> both climate<br />
and human impact. Climates within the network range from<br />
polar to tropical and from maritime to continental, with<br />
correspondingly diverse biotic assemblages. Human influences<br />
among sites range from no intentional disturbance to<br />
intensive management for agricultural, rangeland, forestry,<br />
and urban outcomes.<br />
Creation <strong>of</strong> the network thus substantially altered the<br />
range <strong>of</strong> research sites used by US ecologists. Although<br />
sites in national parks, national forests, agricultural experiment<br />
stations, and biological field stations have historically<br />
provided a rich context for asking long-term ecological<br />
questions, most questions have been addressed in an ad hoc<br />
manner. The <strong>LTER</strong> Network provides an explicit opportunity<br />
to document ecological changes and to simultaneously<br />
address long-term questions across a broad array <strong>of</strong> ecosystems.<br />
Documenting these changes provides an important<br />
opportunity to ask mechanistic questions about the causes<br />
and consequences <strong>of</strong> change, an additional hallmark <strong>of</strong><br />
<strong>LTER</strong>: place-based long-term experimentation (Knapp et al.<br />
2012 [in this issue]).<br />
The ability to link results at one site to findings at another<br />
allows the exploration <strong>of</strong> questions at broader geographic<br />
BioScience 62: 342–353. ISSN 0006-3568, electronic ISSN 1525-3244. © 2012 by American Institute <strong>of</strong> Biological Sciences. All rights reserved. Request<br />
permission to photocopy or reproduce article content at the <strong>University</strong> <strong>of</strong> California Press’s Rights and Permissions Web site at www.ucpressjournals.com/<br />
reprintinfo.asp. doi:10.1525/bio.2012.62.4.6<br />
342 BioScience • April 2012 / Vol. 62 No. 4 www.biosciencemag.org
SBC<br />
CCE<br />
BNZ<br />
0 10 km<br />
ARC<br />
MCR<br />
AND<br />
CAP<br />
NWT<br />
JRN<br />
SEV<br />
SGS<br />
CDR<br />
KNZ<br />
NTL<br />
KBS<br />
CWT<br />
BES<br />
FCE<br />
scales in order to explore both regional patterns and controls,<br />
as well as to explore the degree <strong>of</strong> connectivity among<br />
disparate parts <strong>of</strong> regional and continental landscapes (sensu<br />
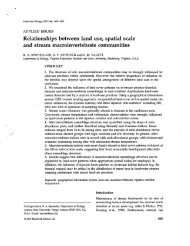
Peters et al. 2008). By the end <strong>of</strong> the network’s third decade,<br />
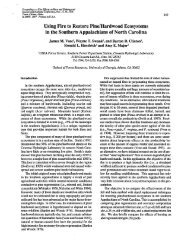
the number <strong>of</strong> cross-site studies had ballooned (figure 2;<br />
Johnson et al. 2010). The following five examples demonstrate<br />
this development:<br />
(1) In the Long-Term Intersite Decomposition Experiment,<br />
the decomposition rates <strong>of</strong> leaf litter and roots were<br />
measured in a 10-year reciprocal-transplant experiment<br />
among 21 long-term sites in seven biomes. The results<br />
showed that relatively simple models can predict decomposition<br />
rates on the basis <strong>of</strong> litter quality and regional<br />
climate (Gholz et al. 2000) but that the rate <strong>of</strong> nitrogen<br />
release from leaf litter is largely independent <strong>of</strong> climate<br />
(Parton et al. 2007). Nitrogen release instead depends on<br />
the initial tissue nitrogen concentrations and mass, except<br />
in arid environments in which exposure to large amounts<br />
<strong>of</strong> ultraviolet radiation overrides the influence <strong>of</strong> nitrogen<br />
content.<br />
(2) In the Lotic Intersite Nitrogen Experiment (LINX), a set<br />
<strong>of</strong> comparative studies <strong>of</strong> nitrogen dynamics were conducted<br />
HBR<br />
PIE<br />
HFR<br />
GCE<br />
Articles<br />
in 70 headwater streams from<br />
across North America on the basis<br />
<strong>of</strong> collaborations that grew out<br />
<strong>of</strong> the <strong>LTER</strong> Network and later<br />
included other sites. Using coordinated<br />
whole-stream nitrogen-15<br />
isotope-addition experiments,<br />
LINX studies demonstrated the<br />
importance <strong>of</strong> headwater streams<br />
for maintaining downstream<br />
water quality (Peterson et al.<br />
2001, Helton et al. 2011), quantified<br />
their sensitivity to excess<br />
nitrate loading (Mulholland et al.<br />
2008), and clarified their role as<br />
sources <strong>of</strong> the potent greenhouse<br />
gas nitrous oxide (Beaulieu et al.<br />
2011). LINX research has now<br />
expanded to include nitrogen<br />
cycling in large rivers and wetlands<br />
in addition to streams.<br />
(3) In a study <strong>of</strong> very longterm<br />
records <strong>of</strong> lake ice initiated<br />
at <strong>LTER</strong> Network sites and then<br />
expanded to other Northern<br />
Hemisphere locations, Magnuson<br />
and colleagues (2000) exposed a<br />
trend <strong>of</strong> shorter and more variable<br />
durations <strong>of</strong> ice cover over<br />
the past century. These trends<br />
<strong>of</strong> reduced ice cover <strong>of</strong>fered an<br />
integrated, long-term indication<br />
<strong>of</strong> a warming climate over broad<br />
geographic regions.<br />
(4) A working group convened at the National Center<br />
for Ecological Analysis and Synthesis to examine the relationship<br />
between plant productivity and diversity at <strong>LTER</strong><br />
Network and other sites (Waide et al. 1999) led to a<br />
meta-analysis <strong>of</strong> over 170 studies <strong>of</strong> species richness and<br />
productivity (Mittelbach et al. 2001), which changed the<br />
prevailing view that species richness peaks at intermediate<br />
productivities. Building on this result, a more recent multisite<br />
international experiment that included <strong>LTER</strong> Network<br />
sites showed that species richness per se cannot be used to<br />
predict productivity, except in reconstructed communities<br />
(Adler et al. 2011).<br />
(5) An analysis <strong>of</strong> more than 900 species responses from<br />
34 nitrogen-fertilization experiments across long-term sites<br />
(Cleland et al. 2008) showed that trait-neutral and traitbased<br />
mechanisms operated simultaneously to influence<br />
diversity loss as net primary production increased with<br />
fertilization (Suding et al. 2005). Although soil-buffering<br />
capacity modulated some responses (Clark et al. 2007),<br />
low abundance was consistently an important driver <strong>of</strong><br />
species loss across ecosystems, and both trait-based and<br />
species-specific responses were also evident (Pennings et al.<br />
www.biosciencemag.org April 2012 / Vol. 62 No. 4 • BioScience 343<br />
VCR<br />
PAL<br />
0 2000 km<br />
MCM<br />
Figure 1. Map <strong>of</strong> the 26 Long Term Ecological Research Network sites on an ecoregion<br />
map from Olson and colleagues (2001). Descriptions <strong>of</strong> the sites can be found at<br />
www.lternet.edu. Abbreviation: km, kilometers. For the site-name abbreviations,<br />
see Knapp and colleagues’ (2012) table 1 (in this issue, on p. 379).<br />
LUQ
Articles<br />
1992<br />
BNZ<br />
AND<br />
HBR<br />
2003<br />
AND<br />
PAL<br />
SGS<br />
FCE<br />
HFR<br />
ARC<br />
VCR LUO<br />
VCR<br />
CWT<br />
NTL<br />
KNZ<br />
HFR<br />
LUQ<br />
CDR<br />
JRN<br />
HBR<br />
PAL<br />
CWT<br />
ARC<br />
SEV<br />
JRN<br />
NTL<br />
NWT<br />
MCM<br />
SEV<br />
NWT<br />
KBS<br />
KNZ<br />
KBS<br />
SGS<br />
GCE<br />
BNZ<br />
PIE<br />
CAP<br />
BES<br />
Figure 2. Evolution <strong>of</strong> cross-site research in the Long Term<br />
Ecological Research Network in the decade prior to 2003,<br />
quantified by <strong>join</strong>t intersite publications (lines between<br />
sites), recalculated from the data in Johnson and colleagues<br />
(2010). For the site-name abbreviations, see Knapp and<br />
colleagues’ (2012) table 1 (in this issue, on p. 379).<br />
2005, Cleland et al. 2011). The results from these syntheses<br />
demonstrated that rarity, species identity, functional traits,<br />
and physical environment all contributed to changes in<br />
plant-community composition in response to soil nitrogen<br />
availability.<br />
Clearly, cross-site syntheses add substantial value to<br />
highly mechanistic site-based analyses and provide the<br />
opportunity to develop and test ecological theories that can<br />
lead to broader ecological knowledge.<br />
The new emergence <strong>of</strong> environmental observatories—<br />
including the National Ecological Observatory Network<br />
(NEON; Keller et al. 2008); the Oceans Observatory<br />
Initiative (Isern and Clark 2003); the Global Lake Ecological<br />
Observatory Network (Kratz et al. 2006); and others,<br />
including open-source networks such as NutNet (Adler<br />
et al. 2011)—underscores a growing scientific appreciation<br />
for the power <strong>of</strong> cross-site observations (Carpenter 2008,<br />
Robertson 2008). The <strong>LTER</strong> Network was not designed<br />
to be a single integrated observatory in which each<br />
site employs standardized instrumentation and capacity,<br />
as does NEON, nor are network sites optimally located to<br />
capture environmental trends at continental scales. Rather,<br />
the <strong>LTER</strong> Network was designed to provide key places for<br />
long-term, biome-specific observations and experimentation,<br />
where investigations can reveal the underlying causes<br />
and future consequences <strong>of</strong> patterns detected by distributed<br />
observatories that include <strong>LTER</strong> Network sites. And<br />
by increasingly engaging with diverse stakeholders—land<br />
managers, policymakers, and decisionmakers at all levels—<br />
<strong>LTER</strong> Network scientists can ensure that their inquiries<br />
are relevant to addressing societal concerns (Driscoll et al.<br />
2012 [in this issue]).<br />
<strong>LTER</strong> Network sites also play a unique role in science<br />
education at all levels. The sites are closely associated with<br />
institutions <strong>of</strong> higher learning, and graduate, undergraduate,<br />
and postdoctoral scholarship at these sites serves to<br />
advance ecology, as well as to introduce undergraduates<br />
to field research and graduate and postdoctoral scientists<br />
to the value <strong>of</strong> distributed research networks (e.g., Kane<br />
et al. 2008). Researchers at the sites are also actively engaged<br />
with local communities and with state and national agencies<br />
and boards, through which they can advance a range<br />
<strong>of</strong> informal education approaches, including pr<strong>of</strong>essional<br />
advancement and environmental training for community<br />
leaders. The resulting synergies have included contributions<br />
to kindergarten through twelfth grade (K–12) science education<br />
through pr<strong>of</strong>essional-development activities for science<br />
teachers (e.g., McKnight 2010), broadening and strengthening<br />
<strong>of</strong> local and state science curricula, and pedagogical contributions<br />
to the development <strong>of</strong> an environmental literacy<br />
movement, as is described below. These diverse educational<br />
efforts are increasingly providing new avenues for improving<br />
the quality and relevance <strong>of</strong> <strong>LTER</strong> science (Driscoll et al.<br />
2012).<br />
As the <strong>LTER</strong> Network enters its fourth decade, it is poised<br />
to contribute substantively to helping society respond to<br />
the ever-growing challenges <strong>of</strong> environmental sustainability,<br />
including climate-change mitigation and adaptation. How<br />
will the network help meet these challenges? In this article,<br />
we describe the vision <strong>of</strong> that future that emerged through<br />
a multiyear process <strong>of</strong> engagement across and beyond the<br />
entire <strong>LTER</strong> community, its National Science Foundation<br />
(NSF) associates, and colleagues from many other programs,<br />
observatories, and agencies.<br />
We first lay out the place <strong>of</strong> <strong>LTER</strong> in a world increasingly<br />
subject to human influence. We describe a common<br />
framework for addressing important questions and examples<br />
<strong>of</strong> three overarching research themes that can best be<br />
addressed with a network <strong>of</strong> sites: landscape vulnerability<br />
and resilience to global change, cryosphere loss, and coastalzone<br />
climate change. We then describe <strong>LTER</strong> contributions<br />
toward building environmental science literacy among K–12<br />
students, undergraduates, and those who work with broader<br />
audiences, as well as the cyberinfrastructure demands <strong>of</strong><br />
long-term ecological science and the network’s approach to<br />
meeting these needs.<br />
344 BioScience • April 2012 / Vol. 62 No. 4 www.biosciencemag.org
<strong>LTER</strong> in a human-dominated world<br />
Thirty years <strong>of</strong> <strong>LTER</strong> Network research have yielded valuable<br />
knowledge about ecosystem change in response to<br />
both natural and human influences. Changes ranging from<br />
climate alteration to species introductions and to land- and<br />
water-use decisions have far-reaching impacts on ecosystem<br />
function, community structure, and population and evolutionary<br />
dynamics, which in turn strongly affect the critical<br />
ecosystem services on which we all depend. Ecological<br />
research seeks to test theory and to provide the empirical<br />
knowledge needed to forecast change and to devise effective<br />
management and policy responses. And theory and<br />
knowledge increasingly cross the boundary between natural<br />
and human systems, effectively linking science with policy<br />
(Liu et al. 2008, Driscoll et al. 2012).<br />
A framework for exploring coupled natural–human systems over<br />
the long term. Several recent studies have shown how couplings<br />
between human and natural systems exhibit nonlinear<br />
dynamics across space, time, and organizational scales<br />
and have revealed complexities that cannot be disentangled<br />
by ecological or social research alone. The importance <strong>of</strong><br />
understanding these dynamics cannot be underestimated:<br />
Without understanding the couplings between natural and<br />
human systems, workable policy solutions to some <strong>of</strong> the<br />
most recalcitrant environmental problems <strong>of</strong> today, which<br />
range from degraded water quality to biodiversity loss to<br />
climate-change vulnerability, will remain difficult to design<br />
and even more difficult to achieve.<br />
At individual <strong>LTER</strong> sites, research on the couplings<br />
between natural and human systems has a rich history,<br />
ranging from inherently coupled working lands (row crop<br />
systems, timber plantations, grazing lands, coastal fisheries)<br />
to urban and exurban areas and sites in which direct<br />
human impact ceased decades ago but in which its legacies<br />
continue to condition ecosystem patterns and processes.<br />
In fact, no <strong>LTER</strong> Network site is uncoupled from human<br />
influence: The network’s most remote Arctic and Antarctic<br />
sites are also affected by human decisions and behaviors,<br />
although humans are far away and their effects mostly<br />
unintentional. As a whole, the <strong>LTER</strong> Network provides a<br />
broad range <strong>of</strong> sites with differing intensities <strong>of</strong> human<br />
influence, degrees <strong>of</strong> intent, and levels <strong>of</strong> connectedness<br />
(Peters et al. 2008).<br />
The integration <strong>of</strong> social and ecological research within<br />
the context <strong>of</strong> <strong>LTER</strong> Network sites and scientists (Redman<br />
et al. 2004), coupled with a rich ecological information base<br />
for the sites, is a promising new research frontier for <strong>LTER</strong>.<br />
The network has responded to this challenge by adopting as<br />
an organizing framework a common model that provides<br />
a standardized terminology and generalized structure to<br />
facilitate investigations <strong>of</strong> a wide variety <strong>of</strong> questions. The<br />
press–pulse dynamics (PPD) model (Collins et al. 2011)<br />
provides a comparative framework to integrate the biophysical<br />
and social sciences through an understanding <strong>of</strong> how<br />
human decisionmaking and behaviors interact with natural<br />
Articles<br />
processes to affect the structure, function, and dynamics <strong>of</strong><br />
ecosystems and the services they provide to people.<br />
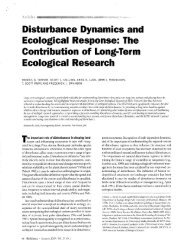
The PPD model (see Collins et al. 2011, but cf. figure 3)<br />
is iterative, with linkages and feedbacks between biophysical<br />
and social domains (in figure 3, environmental and human<br />
systems, respectively). Model linkages are mediated by the<br />
biophysical system’s delivery <strong>of</strong> ecosystem services and by<br />
the perception <strong>of</strong> these services by the social system. Model<br />
feedbacks are mediated by how services change human<br />
outcomes, perceptions, and behaviors that in turn affect the<br />
biophysical systems and their capacity to deliver subsequent<br />
services. Behavioral changes in the PPD model range from<br />
shifts in consumer preferences to environmental and energy<br />
policies and reproduction and migration rates. Such changes<br />
deliver to the biophysical system short-term pulses, such as<br />
nutrient inputs, fires, and management interventions, as well<br />
as long-term presses, such as atmospheric carbon dioxide<br />
loading, climate change, nitrogen deposition, and sea-level<br />
rise. In time, presses, pulses, and pulse–press interactions<br />
affect community structure and ecosystem function (Smith<br />
et al. 2009), eventually changing the delivery <strong>of</strong> ecosystem<br />
services such as the provision <strong>of</strong> food and fiber, pest and disease<br />
suppression, soil fertility, greenhouse gas stabilization,<br />
and clean water.<br />
There are many potential socioecological questions that<br />
could be asked across a network <strong>of</strong> long-term sites. Building<br />
on a long history <strong>of</strong> prior research, <strong>LTER</strong> Network sites and<br />
scientists have identified several environmental challenges<br />
that represent critical issues for science and society that<br />
the network seems particularly well positioned to address<br />
today, including (a) landscape vulnerability and resilience<br />
to climate and land-use change, (b) the consequences <strong>of</strong><br />
cryosphere loss and changes in associated services that<br />
range from urban water supply to rural livelihoods, and<br />
(c) coastal-zone climate change as it interacts with rising<br />
sea levels and coastal population change. For each <strong>of</strong> these<br />
Exogenous<br />
forces<br />
Coupled human-ecosystem interactions<br />
Human<br />
systems<br />
Ecosystem<br />
services<br />
Actions/Policy<br />
Ecosystem boundary<br />
Environmental<br />
systems<br />
Exogenous<br />
forces<br />
Figure 3. A press–pulse dynamics (PPD) framework,<br />
simplified for use by K–12 learners. The complete PPD<br />
model with more comprehensive linkages and feedbacks is<br />
available in Collins and colleagues (2011).<br />
www.biosciencemag.org April 2012 / Vol. 62 No. 4 • BioScience 345
Articles<br />
challenges, a comprehensive socioecological framework is<br />
required for them to be addressed effectively; each is best<br />
addressed with long-term observations and experiments in<br />
multiple locations; and for each, a subset <strong>of</strong> network sites<br />
in partnership with other networks and observatories could<br />
provide a core set <strong>of</strong> locations at which questions could be<br />
effectively addressed.<br />
Future scenarios: Examining landscape vulnerability and resilience<br />
to global change. Science to help us understand, anticipate,<br />
and adapt to global change, including land-use and climate<br />
change, is becoming an ever more pressing need. How will<br />
global change alter the future <strong>of</strong> regional socioecological<br />
systems, and how and why do regional systems differ in<br />
vulnerability, resilience, and adaptability to change? These<br />
questions cannot be addressed by discipline-bound thinking<br />
but, rather, require new approaches that also incorporate<br />
broad-scale comparative investigations <strong>of</strong> diverse systems.<br />
One such approach is that <strong>of</strong> scenario studies (e.g., Baker<br />
et al. 2004, Thompson et al. 2012 [in this issue]), which provide<br />
a framework for addressing socioecological questions<br />
by crafting and evaluating suites <strong>of</strong> plausible scenarios that<br />
follow from current and historical trajectories. By examining<br />
multiple visions <strong>of</strong> the future that reflect a range <strong>of</strong> assumptions<br />
about land and water use, the burden <strong>of</strong> prediction is<br />
lifted, and comparisons among contrasting scenarios can be<br />
used to understand the dynamics <strong>of</strong> complex systems. New<br />
insights come from the examination <strong>of</strong> the perceived bounds<br />
<strong>of</strong> plausibility and from the discovery <strong>of</strong> commonalities<br />
across scenarios. Indeed, intrinsic vulnerabilities and robust<br />
management strategies are <strong>of</strong>ten identified when patterns<br />
recur across disparate scenarios.<br />
Depictions <strong>of</strong> future scenarios are <strong>of</strong>ten articulated by<br />
regional stakeholders, including residents, policymakers,<br />
and social and ecological scientists, in order to illustrate<br />
major strategic choices (Hoag et al. 2005). These qualitative<br />
scenarios can be an end in themselves, or they may<br />
lead to quantitative simulations <strong>of</strong> future landscape change.<br />
This is frequently an iterative process whereby the narratives<br />
inform and are in turn informed by integrated spatial<br />
models <strong>of</strong> socioecological change that might include, for<br />
example, agent-based models that link land-use change,<br />
econometric, and ecosystem process models (Evans and<br />
Kelly 2004). At its best, fundamental site-based science<br />
underpins the development <strong>of</strong> the scenario-to-simulation<br />
framework, the creation <strong>of</strong> which is itself a form <strong>of</strong> scientific<br />
synthesis. This approach for coupling qualitative and<br />
quantitative scenarios has informed prescient planning and<br />
policy decisions and has generated a rich set <strong>of</strong> fundamental<br />
research questions.<br />
For example, researchers at the Harvard Forest <strong>LTER</strong> site<br />
have begun a statewide scenario-studies project to examine<br />
the future <strong>of</strong> Massachusetts’s forests. Their work began with a<br />
landscape-simulation study to examine the relative influence<br />
<strong>of</strong> 50 more years <strong>of</strong> the current trends in forest conversion,<br />
timber harvest, and climate change in terms <strong>of</strong> their effects<br />
on forest carbon storage and tree species composition<br />
(Thompson et al. 2011). This work was rooted in 20 years<br />
<strong>of</strong> ecological research at Harvard Forest. Researchers then<br />
convened a group <strong>of</strong> around 12 stakeholders, including<br />
natural-resource managers and decisionmakers from state<br />
government, representatives from conservation nongovernmental<br />
organizations, and academics from multiple<br />
disciplines. They asked this group to chart three alternative<br />
futures <strong>of</strong> their choosing to compare with the current<br />
trends that had already been modeled. Through spirited<br />
discussion, the group settled on (a) a “free-market future,”<br />
characterized by a rollback in environmental regulations and<br />
incentives for new business; (b) a “resource-limited future,”<br />
characterized by high energy prices, a resurgence <strong>of</strong> agriculture,<br />
and a strong demand for woody-biomass energy; and<br />
(c) a “green-investment future,” characterized by government<br />
incentives for conservation, green energy, and land-use<br />
planning. Through an iterative process with stakeholders,<br />
the researchers were able to describe the types, distribution,<br />
and intensity <strong>of</strong> land uses under each <strong>of</strong> the scenarios. Each<br />
<strong>of</strong> the scenarios is now being integrated into a simulation<br />
framework, which will superimpose the land-use scenarios<br />
onto a common template <strong>of</strong> climate-change and ecological<br />
dynamics. The goal is to examine the aggregate and interactive<br />
effects <strong>of</strong> land use within each scenario, as well as to<br />
make comparisons across the scenarios. Clearly, none <strong>of</strong><br />
the scenarios will manifest exactly as they were described;<br />
nonetheless, by examining multiple potential pathways, the<br />
effort should reveal characteristics <strong>of</strong> the Massachusetts<br />
landscape that are particularly vulnerable or resilient to the<br />
interactive effects <strong>of</strong> land-use and climate change.<br />
Cryosphere loss. The Earth’s cryosphere, which includes sea,<br />
lake, and river ice; glaciers; seasonal snow; and ice-rich permafrost,<br />
harbors over 80% <strong>of</strong> the freshwater on the planet.<br />
The cryosphere cools the planet through its albedo; regulates<br />
the global sea level; stores substantial stocks <strong>of</strong> carbon;<br />
insulates soil from subfreezing air temperatures; and serves<br />
as a seasonally refreshed water supply for human consumption,<br />
irrigation, nutrient transport, and waste disposal. The<br />
prospect <strong>of</strong> accelerated cryosphere loss under a warming climate<br />
portends great ecological change and poses enormous<br />
threats to these ecosystem services, with attendant social and<br />
economic costs. A 1-meter sea-level rise, now thought to be<br />
unavoidable with a 600–1000 parts per million atmospheric<br />
carbon dioxide peak over the coming century (Solomon<br />
et al. 2009), alone represents an estimated economic impact<br />
<strong>of</strong> $1 trillion that will be borne disproportionately by North<br />
America (Anth<strong>of</strong>f et al. 2010).<br />
The extent and rates <strong>of</strong> cryosphere loss are increasingly<br />
well monitored, and our ability to project the future rates<br />
<strong>of</strong> cryosphere decline is improving. However, the ecological<br />
consequences—and especially the nature and extent <strong>of</strong> and<br />
economic impacts on human society and institutions—<br />
are still poorly understood. Cryosphere loss represents an<br />
inadvertent press event caused by human decisions—driven<br />
346 BioScience • April 2012 / Vol. 62 No. 4 www.biosciencemag.org
y policies and markets—to extract energy from fossil fuel<br />
and to clear forests and other carbon-storing ecosystems<br />
for economic development. Changes in wintertime temperatures<br />
and snowfall will dramatically affect community<br />
structure and ecosystem processes in high-latitude and<br />
alpine ecosystems, but the effects will be felt even in arid,<br />
low-latitude ecosystems that depend on mountain meltwater<br />
for seasonal water supplies—riverine, floodplain,<br />
agricultural, and urban ecosystems in particular. Many <strong>of</strong><br />
these effects will be social, since some <strong>of</strong> the most populous<br />
cities and productive farmland in North America depend<br />
on these water supplies.<br />
Examples <strong>of</strong> cryosphere loss and its effects abound across<br />
the <strong>LTER</strong> Network, from Arctic sites undergoing long-term<br />
permafrost melt to Antarctic and northern lake sites losing<br />
ice cover and terrestrial sites experiencing shorter periods <strong>of</strong><br />
snow cover and more-frequent freeze–thaw events. Alpine<br />
communities, such as that at the Niwot Ridge <strong>LTER</strong> site,<br />
illustrate the degree <strong>of</strong> subregional connectivity involved<br />
(figure 4): Hydrological connectivity is driven by the duration<br />
and timing <strong>of</strong> the seasonal snowpack and snowmelt,<br />
and under a warming climate, increasing windborne dust<br />
will accelerate snowpack and glacial melt, which will result<br />
in the snowline’s moving to a higher elevation, which will in<br />
turn decrease hydrologic connectivity. With elevated nitrogen<br />
inputs from windborne dust and Denver air pollution,<br />
plant species diversity will decrease as alpine areas shrink,<br />
shrubland will expand, and the landscape will become more<br />
homogeneous. Exacerbating these trends is the regional<br />
outbreak <strong>of</strong> mountain pine beetles that will remove a large<br />
portion <strong>of</strong> the subalpine forest.<br />
Cryosphere change and its consequences are played out<br />
as long-term trends that in many places will be difficult to<br />
discern from short-term variability in climate and other<br />
environmental factors and in social dynamics, such as population<br />
and economic change. Long-term sites provide the<br />
perspective necessary to detect trends that would otherwise<br />
not be visible against this variability. And networked sites<br />
provide the potential for comparative tests <strong>of</strong> hypotheses<br />
that link cryosphere loss, ecosystem services, and human<br />
decisions, using, for example, the PPD model (figure 3).<br />
Key research questions (Fountain et al. 2012 [in this<br />
issue]) include (a) how climate regulation is affected by<br />
feedbacks from thawing permafrost and sea ice, especially<br />
because <strong>of</strong> the release <strong>of</strong> vast stores <strong>of</strong> carbon and changes in<br />
albedo, and what the implications are for regional and global<br />
economies and policies, including sovereignty; (b) what the<br />
economic implications <strong>of</strong> snow and ice loss are, including<br />
the future <strong>of</strong> winter recreation and related cultural activities;<br />
(c) how changing snowpack—the amount and timing<br />
<strong>of</strong> water storage and delivery—in the western United States<br />
will influence the economies <strong>of</strong> this region, and whether<br />
the impacts will be disproportionately imposed on disadvantaged<br />
groups; and (d) what the cultural mechanisms<br />
are by which cryosphere loss influences public opinion and<br />
what policies and legal instruments are most effective for<br />
Articles<br />
Figure 4. Expected changes in hydrologic connectivity<br />
related to cryosphere loss at the Niwot Ridge Long Term<br />
Ecological Research Network site. As windborne dust<br />
deposition increases in a warming climate, snowpack<br />
and glacial melt will be accelerated, which will result<br />
in a higher snowline, a shrunken alpine area, and the<br />
expansion <strong>of</strong> shrubland, exacerbated by a climate-induced<br />
mountain pine beetle outbreak that is now decimating the<br />
subalpine forest. This figure was created by Eric Parish.<br />
environmental protection, impact mitigation, and adaptation<br />
in the face <strong>of</strong> climate change. The PPD model provides<br />
an effective means for linking cryosphere change with the<br />
ecosystem dynamics that lead to altered ecosystem services<br />
and then with subsequent human activities that may—<br />
through policies, behaviors, and markets—either slow or<br />
hasten cryosphere loss.<br />
Coastal-zone climate change. Because they are at the interface<br />
<strong>of</strong> continental and oceanic realms, coastal systems are<br />
expected to be especially affected by climate change and<br />
to experience effects from both land and sea. With more<br />
than 50% <strong>of</strong> the US population living in coastal counties,<br />
many changes will play out in human communities and<br />
economies. Coastal-zone research sites, including nine<br />
www.biosciencemag.org April 2012 / Vol. 62 No. 4 • BioScience 347
Articles<br />
<strong>LTER</strong> Network and many additional partner sites, differ<br />
in their biophysical vulnerability to the coastal impacts<br />
<strong>of</strong> climate change. Some ecosystems along the US eastern<br />
seaboard will be more affected by sea-level rise and<br />
storm-surge severities, and others will be more affected<br />
by ocean acidification (e.g., coral reef communities in the<br />
south Pacific), the loss <strong>of</strong> sea ice (Antarctica), or changes in<br />
water temperature and freshwater inflows. Human vulnerabilities<br />
will also differ among regions, which arises from<br />
differences in coastal population density and demographic<br />
composition and from the location and resilience <strong>of</strong> the<br />
regions’ built infrastructure, which ranges from cities to<br />
drilling platforms. All <strong>of</strong> these effects and vulnerabilities<br />
need to be considered in concert in order to provide a comprehensive<br />
understanding <strong>of</strong> coastal-zone climate change<br />
and the potentials for future adaptation.<br />
The need to understand and anticipate the effects <strong>of</strong><br />
climate change, assess the vulnerabilities <strong>of</strong> natural and<br />
human elements <strong>of</strong> coastal systems, and adapt to or mitigate<br />
the effects <strong>of</strong> changes is prompting new efforts for integration<br />
across academic disciplines and creation <strong>of</strong> partnerships<br />
among academic, public, and governmental constituents.<br />
As for cryosphere loss, long-term studies are needed in<br />
order to document patterns and consequences <strong>of</strong> coastalzone<br />
change. Unlike cryosphere loss, however, coastal-zone<br />
change is likely to be strongly episodic in response to storm<br />
events that are projected to be increasingly severe and whose<br />
inland consequences will, in any case, be magnified because<br />
<strong>of</strong> sea-level rise. Posing questions relevant to networked sites<br />
in the context <strong>of</strong> a common model allows for a fundamental<br />
understanding more difficult to gain from shorter-term or<br />
more geographically discrete research.<br />
Key questions include (a) how the presses and pulses<br />
associated with coastal climate change—altered water temperature,<br />
precipitation, run<strong>of</strong>f, sea level, solar radiation, wind<br />
and wave climates, pH, and salinity—affect the structure and<br />
function <strong>of</strong> coastal ecosystems and what attributes affect the<br />
vulnerability <strong>of</strong> those ecosystems; (b) how climate-induced<br />
changes in coastal systems affect critical ecosystem services<br />
such as carbon sequestration, wildlife habitat, food-web<br />
support, and storm protection; (c) what attributes <strong>of</strong> human<br />
systems such as built infrastructure; land use; governance<br />
structures; and population demographics, including wealth<br />
and ethnicity, interact to influence human vulnerabilities to<br />
coastal climate change and how these interact with changes<br />
in ecosystem services to prompt responses <strong>of</strong> adaptation and<br />
mitigation; and (d) how mitigation and adaptation strategies,<br />
such as coastal engineering and reductions in greenhouse<br />
gases, would feed back to affect climate drivers and the structure<br />
and function <strong>of</strong> coastal systems. Effectively addressing<br />
these questions requires an approach that acknowledges and<br />
deeply explores the linked socioecological processes that<br />
underlie the delivery <strong>of</strong> almost all <strong>of</strong> the ecosystem services<br />
provided by coastal-zone environments.<br />
Many <strong>LTER</strong> Network sites are located in coastal zones<br />
at different latitudes along the eastern and western US<br />
seaboards, as well as in the South Pacific and Antarctic<br />
Oceans, and provide a diversity <strong>of</strong> geomorphologies and<br />
degrees <strong>of</strong> human influence, ranging from urban to exurban,<br />
rural, and natural. They are therefore well positioned<br />
to address a subset <strong>of</strong> these key questions, most <strong>of</strong> which<br />
will require a combination <strong>of</strong> long-term baseline data<br />
and experiments designed to predict the consequences <strong>of</strong><br />
sea-level rise for the ecology <strong>of</strong> coastal communities.<br />
Toward an environmentally literate populace<br />
Society’s ability to understand and act on the coupled<br />
natural and human systems on which we depend, built<br />
on a foundation <strong>of</strong> complex scientific inquiry, is key to a<br />
sustainable future. And it is the public—decisionmakers at<br />
all levels, from landowners and local <strong>of</strong>ficials to national<br />
leaders—who must act. The importance <strong>of</strong> an environmentally<br />
literate public is hard to overstate: From the grocery<br />
store and car dealership to the voting booth and corporate<br />
boardroom, individuals make choices that have far-reaching,<br />
collective consequences. Education helps to ensure that<br />
those choices are based at least in part on evidence and reasoning<br />
underpinned by solid scientific research.<br />
The <strong>LTER</strong> approach to research, combined with an ability<br />
to implement long-term educational initiatives, has allowed<br />
for unique approaches to the training <strong>of</strong> future researchers<br />
and to the conveyance <strong>of</strong> ecological concepts and insights<br />
to a broad constituency. At individual network sites, educational<br />
activities range from K–12 students and teachers<br />
engaged in schoolyard ecology to undergraduates involved<br />
in field classes and research internships and to graduate<br />
students and postdoctoral scholars learning to frame questions<br />
and to conduct research in long-term and sometimes<br />
cross-site contexts. Public outreach in many forms reaches<br />
working pr<strong>of</strong>essionals, as well as the general public, <strong>of</strong>ten<br />
through the education <strong>of</strong> those best positioned to communicate<br />
with the general public. This outreach is increasingly<br />
placed in a socioecological context, which illustrates<br />
the natural–human system couplings that are central to<br />
addressing major environmental issues and that are <strong>of</strong>ten<br />
hidden to many.<br />
The vision for education in the <strong>LTER</strong> Network includes<br />
leveraging both long-term and cross-site perspectives to<br />
advance fundamental science learning by K–12, undergraduate,<br />
and graduate students and developing programs<br />
for key constituent and underrepresented groups. These<br />
groups include K–12 teachers, university students, education<br />
policymakers, and the pr<strong>of</strong>essional public, which includes<br />
policymakers, natural-resource managers, the working<br />
media, and others whose success depends on access to and<br />
imparting <strong>of</strong> sound ecological knowledge.<br />
A long-term framework for environmental science literacy. Environmental<br />
science literacy—the capacity to participate<br />
in and make decisions through evidence-based discussions<br />
<strong>of</strong> socioecological systems—is essential not only for<br />
many science careers but also for responsible citizenship.<br />
348 BioScience • April 2012 / Vol. 62 No. 4 www.biosciencemag.org
Environmental science literacy requires citizens to understand,<br />
evaluate, and respond to multiple sources <strong>of</strong> information.<br />
The development <strong>of</strong> an environmental science literacy<br />
framework is crucial for providing this capacity among K–12<br />
students, a key constituency that represents both future<br />
STEM (science, technology, engineering, and mathematics)<br />
pr<strong>of</strong>essionals and the 75% <strong>of</strong> the US population that will not<br />
earn a higher degree. It is also important for framing information<br />
provided to university students, STEM pr<strong>of</strong>essionals<br />
and the general public.<br />
The development <strong>of</strong> an environmental literacy framework<br />
requires that we understand stakeholders’ current<br />
state <strong>of</strong> knowledge in core areas and how math and science<br />
concepts are best used to provide a desired level <strong>of</strong> literacy.<br />
In this context, stakeholders range from K–12 students to<br />
the voting public. We know, in general, that for most stakeholders,<br />
the state <strong>of</strong> knowledge is low, which is reflected<br />
both in standardized K–12 test scores (Gonzales et al. 2008)<br />
and in college-level assessments <strong>of</strong> ecological concepts (e.g.,<br />
Hartley et al. 2011). We also know that there are troubling<br />
demographic disparities and, in particular, persistent gaps<br />
in science and mathematics achievement between white students<br />
and students <strong>of</strong> color (Vanneman et al. 2009). Building<br />
a capacity for principle-based environmental reasoning in<br />
all stakeholders and broadening the participation <strong>of</strong> underrepresented<br />
groups in environmental science careers should<br />
be important components <strong>of</strong> all science education efforts<br />
(George et al. 2001, ESA 2006).<br />
In K–12 education, the term learning progressions describes<br />
increasingly sophisticated ways <strong>of</strong> reasoning about an area<br />
<strong>of</strong> study, typically organized around a set <strong>of</strong> core topics<br />
that can be used to organize an integrated understanding<br />
<strong>of</strong> larger, complex issues (Duschl et al. 2007). A current<br />
effort within the network to build learning progressions<br />
into the K–12 science curriculum is being tested in 22<br />
school districts across the country with an <strong>LTER</strong> Network–<br />
associated NSF Math and Science Partnership (MSP) award.<br />
In districts around four network sites, MSP participants—<br />
scientists and science educators working with a diverse mix<br />
<strong>of</strong> K–12 science teachers and students—are developing<br />
learning progressions around key science strands. These<br />
strands include carbon, water, and biodiversity, plus a<br />
mathematical strand that addresses quantitative reasoning<br />
and the mathematics <strong>of</strong> modeling and a citizenship strand<br />
focused on the roles <strong>of</strong> culture and place. All <strong>of</strong> these strands<br />
are deeply embedded in state science and mathematics standards<br />
and are connected by the theme <strong>of</strong> education for citizenship:<br />
how students take on roles as consumers and voters<br />
using evidence-based reasoning about personal decisions<br />
that have environmental consequences. Multidisciplinary<br />
themes focused on the human impacts <strong>of</strong> land-use, ecosystem<br />
structure, and ecosystem services <strong>of</strong>fer rich experiences<br />
in STEM education that include atmospheric science, soil<br />
science, geology, agronomy, ecology, hydrology, computer<br />
science, and systems modeling. Placing these strands in<br />
a simplified PPD model (figure 3) provides an easily<br />
Articles<br />
understood context for showing coupled human–ecosystem<br />
interactions.<br />
Two observations have emerged thus far from our <strong>LTER</strong>based<br />
studies <strong>of</strong> learning progression. First, the PDD model<br />
embraced by the <strong>LTER</strong> Network (Collins et al. 2011) emphasizes<br />
that socioecological systems are organized as dynamic<br />
hierarchical systems. This basic tenet defines specific ways in<br />
which subjects or entities <strong>of</strong> interest are organized and interact<br />
with one another. Embedded in the concept is the notion<br />
<strong>of</strong> scale, wherein the boundaries between levels <strong>of</strong> interaction<br />
are defined by differences in the geographies and rates<br />
at which entities interact. Second, socioecological processes<br />
may include multiple principles that operate simultaneously<br />
in the social and ecological realms.<br />
Our research in student learning and understanding <strong>of</strong><br />
ecological systems indicates that students and teachers fail to<br />
adopt hierarchical reasoning when questioned about ecological<br />
systems and principles. The conservation <strong>of</strong> matter and<br />
energy is not understood. Processes operating at one scale<br />
are assumed to operate at the same scope and magnitude at<br />
other scales. The nature <strong>of</strong> the interconnectedness <strong>of</strong> systems<br />
is overstated (e.g., removal <strong>of</strong> one species leads to system<br />
collapse). Human social hierarchies and human agency are<br />
conflated with ecological hierarchies and processes and are<br />
applied to natural systems.<br />
<strong>LTER</strong> Network research on learning progressions provides<br />
insights into how to advance student understanding<br />
<strong>of</strong> socioecological systems and also provides the scaffolding<br />
<strong>of</strong> science and social-science principles that is needed for<br />
students’ environmental literacy—a key to understanding<br />
human agency and its application to the scale <strong>of</strong> action<br />
that the challenges demand and to engaging the broader<br />
public.<br />
Engaging the broader public. Extending this understanding to<br />
older stakeholders—both the voting public in general and<br />
working STEM pr<strong>of</strong>essionals, such as land managers, policy<br />
analysts, and public- and private-sector decisionmakers—<br />
presents a different set <strong>of</strong> challenges (Driscoll et al. 2012).<br />
Recent calls for a renewed effort by ecologists to engage in<br />
public outreach (e.g., Gr<strong>of</strong>fman et al. 2010) have noted that<br />
effective communication outside the classroom is influenced<br />
by learners’ interests, prior knowledge, social networks, and<br />
values and beliefs. This requires issues to be framed in ways<br />
that resonate with the public and messages to be delivered<br />
in ways that acknowledge the importance <strong>of</strong> emerging forms<br />
<strong>of</strong> media and informal learning environments (NRC 2009).<br />
Effective communication can also involve partnerships with<br />
boundary organizations that specialize in fostering the use<br />
<strong>of</strong> science knowledge in environmental policymaking and<br />
management (Osmond et al. 2010). These organizations<br />
range from university-based extension programs at landgrant<br />
universities to individual site-based efforts.<br />
One such site-based effort is the Science Links program<br />
at the Hubbard Brook <strong>LTER</strong> site. The program is explicitly<br />
aimed at communicating basic science findings at Hubbard<br />
www.biosciencemag.org April 2012 / Vol. 62 No. 4 • BioScience 349
Articles<br />
Brook to interested audiences that range from the general<br />
public to congressional staffers and is a particularly apt<br />
example <strong>of</strong> a way to leverage limited funding to broaden the<br />
impact <strong>of</strong> ecological findings. Outreach is initiated early in<br />
a project and is informed by a group <strong>of</strong> policy and natural<br />
resource management advisors who help to craft a message<br />
that is most relevant to the audience at hand. Such efforts<br />
can help to shorten an otherwise distressing lag between<br />
recognizing and addressing important environmental problems,<br />
such as those associated with acid rain (Likens 2010),<br />
as well as to help an increasingly dubious public to gain confidence<br />
in their ability to understand—and ultimately act<br />
on—complex environmental issues. More broadly, efforts to<br />
shape the public’s perception <strong>of</strong> natural areas and to increase<br />
awareness <strong>of</strong> the linkages between human and natural systems<br />
(e.g., Foster 1999) are equally vital, and both targeted<br />
and more-generalized efforts to build public environmental<br />
literacy are important priorities for <strong>LTER</strong>.<br />
Information for the future<br />
Cyberinfrastructure describes the network <strong>of</strong> computing<br />
environments that support advanced data acquisition, storage,<br />
management, integration, mining, visualization, and<br />
other information-processing services (Atkins et al. 2003).<br />
When used for scientific purposes, cyberinfrastructure is a<br />
technical solution to the problem <strong>of</strong> efficiently connecting<br />
data, computers, and people.<br />
The development <strong>of</strong> cyberinfrastructure is integral to the<br />
success <strong>of</strong> all environmental networks, including the <strong>LTER</strong><br />
Network: Data for modeling and forecasting are essential<br />
for identifying the effects <strong>of</strong> accelerated and abrupt changes,<br />
and the explosion <strong>of</strong> real-time data availability calls for<br />
near-real-time analysis and distribution if those data are to<br />
be their most useful (AC-ERE 2009). Equally compelling<br />
is the need for data repositories and archives that allow<br />
the detection and synthesis <strong>of</strong> long-term trends and the<br />
effective integration <strong>of</strong> data from different networks and<br />
researchers.<br />
That less than 1% <strong>of</strong> ecological data is accessible after<br />
the publication <strong>of</strong> derived results (Reichman et al. 2011)<br />
reveals the social and technological challenges <strong>of</strong> curating<br />
that environmental data. Data dispersion, heterogeneity, and<br />
provenance (Jones MB et al. 2006), coupled with cultural<br />
norms that provide few rewards, make ecological information<br />
systems difficult to design, implement, and incentivize.<br />
Nevertheless, fueled by the emergence <strong>of</strong> environmental<br />
observatories charged with collecting and making openly<br />
available data from a variety <strong>of</strong> sensors (e.g., NRC 2004)<br />
and by the success <strong>of</strong> efforts to assemble and synthesize<br />
networked data toward broader-scale tests <strong>of</strong> ecological<br />
theory (e.g., Mittelbach et al. 2001, Suding et al. 2005), new<br />
efforts to develop centralized ecological information systems<br />
are under way. The <strong>LTER</strong> Network, with its 30 years <strong>of</strong><br />
experience in environmental information management, has<br />
been a pioneer in these efforts—a microcosm <strong>of</strong> the hard<br />
challenges and substantive benefits <strong>of</strong> networked ecological<br />
data—and will be among those linked by centralized efforts<br />
such as DataONE (Michener et al. 2011).<br />
The distributed data repositories <strong>of</strong> the 26 network sites<br />
reflect the vast diversity <strong>of</strong> ecological data and the breadth<br />
<strong>of</strong> approaches to environmental data-management systems<br />
as developed by field stations, museums, academic institutions,<br />
state and local governments, and individual scientists.<br />
Core <strong>LTER</strong> Network data conform to consistent metadata<br />
standards (Michener 2006) and are held by individual sites<br />
within Web-accessible catalogs. These data repositories,<br />
plus a network-wide policy <strong>of</strong> open data access, make data<br />
available to those wishing to assemble cross-site syntheses.<br />
Although open access has been crucial to the success <strong>of</strong><br />
cross-site studies such as those noted earlier (e.g., Mittelbach<br />
et al. 2001, Parton et al. 2007), the structure <strong>of</strong> site data <strong>of</strong>ten<br />
differs from catalog to catalog, which makes the discovery<br />
and subsequent integration <strong>of</strong> semantically similar data a<br />
task that is, at best, inconvenient. What is needed is a central<br />
repository that maintains the veracity and provenance <strong>of</strong> site<br />
data but allows single-portal access.<br />
Early examples include the climate and hydrology portals<br />
for <strong>LTER</strong> data. Centralized access to data from 26 sites provides<br />
an ability to detect and synthesize patterns and trends<br />
without the pain <strong>of</strong> querying 26 separate data catalogs with<br />
different keyword vocabularies and reporting units. Lowered<br />
transaction costs makes synthesis practical—and, in some<br />
cases, possible—when it had not been so previously, providing<br />
in this case a capacity to integrate multiple climate- and<br />
hydrologic-system components across disparate ecosystems<br />
and biomes to provide novel insights (Jones JA et al. 2012<br />
[in this issue]). What we need next is an ability to perform<br />
these syntheses for all system components. The <strong>LTER</strong><br />
Network Information System (NIS) is being developed to<br />
address this need.<br />
The <strong>LTER</strong> NIS will provide access to data from the<br />
26 network sites through a single point <strong>of</strong> access and at the<br />
same time ensure the long-term preservation <strong>of</strong> site data<br />
through centralized stewardship. Site data will continue to<br />
be curated at individual sites but will also be exposed to<br />
harvest by the NIS on a frequent, periodic basis. Further<br />
data processing will then provide common formats that<br />
can be easily queried by cross-network portals, such as<br />
EcoTrends (Peters et al. 2011), that are designed to create<br />
derived long-term data products and by storage systems<br />
such as DataONE that will provide a centralized facility<br />
for storing data from multiple sources, including the NIS.<br />
Importantly, the system will be scalable: Adding data from<br />
additional sites, whether they are existing field stations, sensor<br />
networks, future <strong>LTER</strong> sites, or individual field projects,<br />
will be straightforward.<br />
The nature <strong>of</strong> <strong>LTER</strong> data—and by extension, ecological<br />
data in general—makes a single rigid method for storing<br />
and accessing them impractical. By design, many long-term<br />
data sets are collected using common protocols at regular<br />
intervals from specified locations. As priorities, resources,<br />
and technologies shift, however, intervals change, protocols<br />
350 BioScience • April 2012 / Vol. 62 No. 4 www.biosciencemag.org
are improved, and locations sometimes become inappropriate<br />
or insufficient. Robust sampling programs will have<br />
precautions and methods in place to protect the veracity<br />
<strong>of</strong> long-term observations, including a data-management<br />
system sufficiently nimble to allow these changes. An additional<br />
challenge in ecological science, however, is archiving<br />
and exposing experimental data—data that may be collected<br />
over a short term, with additional protocols and different<br />
experimental treatments in a sampling matrix that may not<br />
correspond much with that <strong>of</strong> the long-term collection.<br />
This adds an additional important burden on information<br />
systems that aspire to address ecological science needs but<br />
also provides an invaluable opportunity for future users to<br />
query the full suite <strong>of</strong> observations available for a particular<br />
site or region.<br />
Informal users also need to be accommodated. The best<br />
information system will make derived products available<br />
to a variety <strong>of</strong> potential users—not just scientists but also<br />
educators, students, decisionmakers, and the public. So<br />
long as data within the system are fully exposed to all portal<br />
developers, this accommodation will be straightforward, as<br />
might be the accommodation <strong>of</strong> data from nontraditional,<br />
more-uncertain sources, such as citizen science networks<br />
(Cohn 2008).<br />
Conclusions<br />
The US <strong>LTER</strong> Network enters its fourth decade with a<br />
sound record <strong>of</strong> scientific achievement in the ecological sciences.<br />
At each <strong>of</strong> the network’s 26 sites, we have learned an<br />
extraordinary amount about the organisms and processes<br />
important at the biome it represents, about the way the<br />
site’s ecosystems respond to disturbance, and about human<br />
influences and long-term environmental change. Cross-site<br />
observations and experiments are increasingly revealing<br />
how key processes, organisms, and ecological attributes<br />
are organized and behave across major environmental<br />
gradients. In total, research in the <strong>LTER</strong> portfolio is contributing<br />
substantially to our basic knowledge <strong>of</strong> ecological<br />
interactions and to our ability to forecast change and test<br />
ecological theory.<br />
Against this backdrop, the <strong>LTER</strong> Network is undertaking a<br />
new kind <strong>of</strong> transdisciplinary science—one that ranges from<br />
local to global in scope, that blends ecological and social<br />
science theories, methods, and interpretations in order to<br />
better understand and forecast environmental change in an<br />
era when no ecosystem on Earth is free from human influence.<br />
Furthermore, the network is increasingly focused on<br />
conveying those results to an engaged audience <strong>of</strong> decisionmakers<br />
that can apply it. The <strong>LTER</strong> Network’s PPD model<br />
provides a unifying framework for better understanding<br />
coupled natural–human systems across regions and temporal<br />
scales and a means for examining feedbacks and testing<br />
hypotheses about, first, how humans perceive the critical<br />
services provided by ecosystems; second, how these perceptions<br />
change behaviors and institutions; and third, how<br />
these changes in turn feed back to affect ecosystem structure<br />
Articles<br />
and function and the ability <strong>of</strong> these systems to indefinitely<br />
sustain their delivery <strong>of</strong> services.<br />
Environmental literacy is an important ongoing legacy<br />
<strong>of</strong> <strong>LTER</strong> Network science and will remain so. Learners<br />
at all levels have benefited from <strong>LTER</strong> Network involvement:<br />
graduate and undergraduate students, K–12 students<br />
and educators, working pr<strong>of</strong>essionals involved in land<br />
and resource management, policymakers, and the general<br />
public. Future efforts will be directed toward ensuring<br />
that these groups understand the linkages and feedbacks<br />
between social and ecological systems to better inform their<br />
ability to make evidence-based environmental decisions at<br />
all levels.<br />
Advances in cyberinfrastructure are required in order to<br />
manage and organize the rapidly growing volume <strong>of</strong> ecological<br />
information and in order to enable integration and synthesis<br />
<strong>of</strong> that information over time. The <strong>LTER</strong> Network has<br />
led the ecological community in developing protocols and<br />
practices for documenting, curating, and sharing data, and<br />
it is now building the NIS, which will collect and curate data<br />
from <strong>LTER</strong> Network and other sites for storage in formats<br />
that can be queried by applications built to provide users<br />
with derived long-term data. Data in the system will thus be<br />
available to scientists, educators, students, decisionmakers,<br />
and the public for research, decision support, teaching, and<br />
informal education opportunities.<br />
The <strong>LTER</strong> Network’s primary mission is to use long-term<br />
observations and experiments to generate and test ecological<br />
theory at local to regional scales. Progress in solving environmental<br />
problems that today seem intractable depends<br />
on fundamental, long-term, integrated research that will<br />
generate a synthetic understanding <strong>of</strong> highly dynamic socioecological<br />
systems. Likewise, the early discovery <strong>of</strong> tomorrow’s<br />
surprises depends on long-term research that provides a<br />
capacity to detect new trends. Extending these capacities to<br />
continental scales will provide the necessary experimental<br />
context within which to address the causes and consequences<br />
<strong>of</strong> change documented both by the <strong>LTER</strong> Network and by<br />
the emerging constellation <strong>of</strong> environmental observatories.<br />
Acknowledgments<br />
The <strong>LTER</strong> Network owes its success to the several thousand<br />
scientists who have used its sites and data to conduct<br />
groundbreaking ecological research and to the support and<br />
leadership provided by the National Science Foundation and<br />
state and federal agency partners. The network’s principal<br />
partners include the US Forest Service, the Agricultural<br />
Research Service <strong>of</strong> the US Department <strong>of</strong> Agriculture, the<br />
US Fish and Wildlife Service’s Bureau <strong>of</strong> Land Management,<br />
and the US Geological Survey. We thank three anonymous<br />
reviewers for insightful comments on an earlier version <strong>of</strong><br />
this article.<br />
References cited<br />
[AC-ERE] US National Science Foundation Advisory Committee for<br />
Environmental Research and Education. 2009. Transitions and Tipping<br />
www.biosciencemag.org April 2012 / Vol. 62 No. 4 • BioScience 351
Articles<br />
Points in Complex Environmental Systems. US National Science<br />
Foundation.<br />
Adler PB, et al. 2011. Productivity is a poor predictor <strong>of</strong> plant species<br />
richness. Science 333: 1750–1753.<br />
Anth<strong>of</strong>f D, Nicholls RJ, Tol RSJ. 2010. The economic impact <strong>of</strong> substantial<br />
sea-level rise. Mitigation and Adaptation Strategies for Global Change<br />
15: 321–335.<br />
Atkins DE, Droegemeier KK, Feldman SI, Garcia-Molina H, Klein<br />
ML, Messerschmitt DG, Messina P, Ostriker JP, Wright MH. 2003.<br />
Revolutionizing Science and Engineering through Cyberinfrastructure.<br />
National Science Foundation. Report no. cise051203.<br />
Baker JP, Hulse DW, Gregory SV, White D, Van Sickle J, Berger PA, Dole D,<br />
Schumaker NH. 2004. Alternative futures for the Willamette River<br />
basin, Oregon. Ecological Applications 14: 313–324.<br />
Beaulieu JJ, et al. 2011. Nitrous oxide emission from denitrification in<br />
stream and river networks. Proceedings <strong>of</strong> the National Academy <strong>of</strong><br />
Sciences 108: 214–219.<br />
Callahan JT. 1984. Long-term ecological research. BioScience 34:<br />
363–367.<br />
Carpenter SR. 2008. Emergence <strong>of</strong> ecological networks. Frontiers in Ecology<br />
and the Environment 6: 228.<br />
Clark CM, Cleland EE, Collins SL, Fargione JE, Gough L, Gross KL,<br />
Pennings SC, Suding KN, Grace JB. 2007. Environmental and plant<br />
community determinants <strong>of</strong> species loss following nitrogen enrichment.<br />
Ecology Letters 10: 596–607.<br />
Cleland EE, et al. 2008. Species responses to nitrogen fertilization in<br />
herbaceous plant communities, and associated species traits. Ecology<br />
89: 1175.<br />
Cleland EE, Clark CM, Collings SL, Fargione JE, Gough L, Gross KL,<br />
Pennings SC, Suding KN. 2011. Natural patterns <strong>of</strong> invasion in herbaceous<br />
plant communities are related to soil nitrogen and the functional<br />
similarity <strong>of</strong> native species. Journal <strong>of</strong> Ecology 99: 1327–1338.<br />
Cohn JP. 2008. Citizen science: Can volunteers do real research? BioScience<br />
58: 192–197.<br />
Collins SL, et al. 2011. An integrated conceptual framework for<br />
social–ecological research. Frontiers in Ecology and the Environment<br />
9: 351–357.<br />
Driscoll CT, Lambert KF, Chapin FS III, Nowak DJ, Spies TA, Swanson FJ,<br />
Kittredge DB Jr, Hart CM. 2012. Science and society: The role <strong>of</strong> longterm<br />
studies in environmental stewardship. BioScience 62: 354–366.<br />
Duschl RA, Schweingruber HA, Shouse AW, eds. 2007. Taking Science<br />
to School: Learning and Teaching Science in Grades K–8. National<br />
Academies Press.<br />
[ESA] Ecological Society <strong>of</strong> America. 2006. Women and Minorities in<br />
Ecology II (WAMIE II): Committee Report, March 2006. ESA.<br />
Evans TP, Kelley H. 2004. Multi-scale analysis <strong>of</strong> a household level<br />
agent-based model <strong>of</strong> landcover change. Journal <strong>of</strong> Environmental<br />
Management 72: 57–72.<br />
Foster DR. 1999. Thoreau’s Country: Journey through a Transformed<br />
Landscape. Harvard <strong>University</strong> Press.<br />
Fountain AG, Campbell JL, Schuur EAG, Stammerjohn SE, Williams MW,<br />
Ducklow HW. 2012. The disappearing cryosphere: Impacts and ecosystem<br />
responses to rapid cryosphere loss. BioScience 62: 405–415.<br />
Franklin JF, Bledsoe CS, Callahan JT. 1990. Contributions <strong>of</strong> the Long-Term<br />
Ecological Research Program. BioScience 40: 509–523.<br />
George YS, Neale DS, Van Horne V, Malcom SM. 2001. In Pursuit<br />
<strong>of</strong> a Diverse Science, Technology, Engineering, and Mathematics<br />
Workforce: Recommended Research Priorities to Enhance Participation<br />
by Underrepresented Minorities. American Association for the<br />
Advancement <strong>of</strong> Science.<br />
Gholz HL, Wedin DA, Smitherman SM, Harmon M, Parton WJ. 2000.<br />
Long-term dynamics <strong>of</strong> pine and hardwood litter in contrasting environments:<br />
Toward a global model <strong>of</strong> decomposition. Global Change<br />
Biology 6: 751–766.<br />
Gonzales P, Williams T, Jocelyn L, Roey S, Kastberg D, Brenwald S. 2008.<br />
Highlights from TIMSS 2007: Mathematics and Science Achievement<br />
<strong>of</strong> U.S. Fourth- and Eighth-Grade Students in an International Context.<br />
National Center for Education Statistics, US Department <strong>of</strong> Education.<br />
Report no. NCES 2009-001 Revised.<br />
Gr<strong>of</strong>fman PM, Stylinski C, Nisbet MC, Duarte CM, Jordan R, Burgin A,<br />
Previtali MA, Coloso J. 2010. Restarting the conversation: Challenges at<br />
the interface between ecology and society. Frontiers in Ecology and the<br />
Environment 8: 284–291.<br />
Hartley LM, Wilke BJ, Schramm JW, D’Avanzo C, Anderson CW. 2011.<br />
College students’ understanding <strong>of</strong> the carbon cycle: Contrasting<br />
principle-based and informal reasoning. BioScience 61: 65–75.<br />
Helton AM, et al. 2011. Thinking outside the channel: Modeling nitrogen<br />
cycling in networked river ecosystems. Frontiers in Ecology and the<br />
Environment 9: 229–238.<br />
Hoag DL, Keske-Handley C, Ascough II J, Koontz L. 2005. Decision making<br />
with environmental indices. Pages 159–182 in Burk AR, ed. New Trends<br />
in Ecology Research. Nova Science.<br />
Hobbie JE, Carpenter SR, Grimm NB, Gosz JR, Seastedt TR. 2003. The US<br />
Long Term Ecological Research Program. BioScience 53: 21–32.<br />
Isern AR, Clark HL. 2003. The ocean observatories initiative: A continued<br />
presence for interactive ocean research. Marine Technology Society<br />
Journal 37: 26–41.<br />
Johnson JC, Christian RR, Brunt JW, Hickman CR, Waide RB. 2010.<br />
Evolution <strong>of</strong> collaboration within the US Long Term Ecological<br />
Research Network. BioScience 60: 931–940.<br />
Jones JA, et al. 2012. Ecosystem processes and human influences regulate<br />
streamflow response to climate change at long-term ecological research<br />
sites. BioScience 62: 390–404.<br />
Jones MB, Schildhauer MP, Reichman OJ, Bowers S. 2006. The new bioinformatics:<br />
Integrating ecological data from the gene to the biosphere.<br />
Annual Review <strong>of</strong> Ecology, Evolution, and Systematics 37: 519–544.<br />
Kane ES, et al. 2008. Precipitation control over inorganic nitrogen import–<br />
export budgets across watersheds: A synthesis <strong>of</strong> long-term ecological<br />
research. Ecohydrology 1: 105–117.<br />
Keller M, Schimel DS, Hargrove WW, H<strong>of</strong>fman FM. 2008. A continental<br />
strategy for the National Ecological Observatory Network. Frontiers in<br />
Ecology and the Environment 6: 282–284.<br />
Knapp AK, et al. 2012. Past, present, and future roles <strong>of</strong> long-term<br />
experiments in the <strong>LTER</strong> network. BioScience 62: 377–389.<br />
Kratz TK, et al. 2006. Toward a global lake ecological observatory network.<br />
Publications <strong>of</strong> the Karelian Institute 145: 51–63.<br />
Likens GE. 2010. The role <strong>of</strong> science in decision making: Does evidencebased<br />
science drive environmental policy? Frontiers in Ecology and the<br />
Environment 8: e1–e9.<br />
Liu J, et al. 2008. Complexity <strong>of</strong> coupled human and natural systems.<br />
Science 317: 1513–1516.<br />
Magnuson JJ, et al. 2000. Historical trends in lake and river ice cover in the<br />
Northern Hemisphere. Science 289: 1743–1746.<br />
McKnight DM. 2010. Overcoming “ecophobia”: Fostering environmental<br />
empathy through narrative in children’s science literature. Frontiers in<br />
Ecology and the Environment 8: e10–e15.<br />
Michener WK. 2006. Meta-information concepts for ecological data<br />
management. Ecological Informatics 1: 3–7.<br />
Michener WK, et al. 2011. DataONE: Data Observation Network for<br />
Earth—Preserving data and enabling innovation in the biological and<br />
environmental sciences. D-Lib Magazine 2011, 17: 1–9. (17 January<br />
2012; www.dlib.org/dlib/january11/michener/01michener.html)<br />
Mittelbach GG, Steiner CF, Scheiner SM, Gross KL, Reynolds HL, Waide<br />
RB, Willig MR, Dodson SI, Gough L. 2001. What is the observed<br />
relationship between species richness and productivity? Ecology 82:<br />
2381–2396.<br />
Mulholland PJ, et al. 2008. Stream denitrification across biomes and its<br />
response to anthropogenic nitrate loading. Nature 452: 202–205.<br />
[NRC] National Research Council. 2004. NEON: Addressing the Nation’s<br />
Environmental Challenges. National Academies Press.<br />
———. 2009. Learning science in informal environments: People, places,<br />
and pursuits. National Academies Press.<br />
Olson DM, et al. 2001. Terrestrial ecoregions <strong>of</strong> the world: A new map <strong>of</strong> life<br />
on earth. BioScience 51: 933–938.<br />
352 BioScience • April 2012 / Vol. 62 No. 4 www.biosciencemag.org
Osmond DL, et al. 2010. The role <strong>of</strong> interface organizations in science<br />
communication and understanding. Frontiers in Ecology and the<br />
Environment 8: 306–313.<br />
Parton W, et al. 2007. Global-scale similarities in nitrogen release patterns<br />
during long-term decomposition. Science 315: 361–364.<br />
Pennings SC, Clark CM, Cleland EE, Collins SL, Gough L, Gross KL,<br />
Milchunas DG, Suding KM. 2005. Do individual plant species show<br />
predictable responses to nitrogen addition across multiple experiments?<br />
Oikos 110: 547–555.<br />
Peters DPC, Gr<strong>of</strong>fman PM, Nadelh<strong>of</strong>fer KJ, Grimm NB, C<strong>of</strong>fins SL,<br />
Michener WK, Huston MA. 2008. Living in an increasingly connected<br />
world: A framework for continental-scale environmental science.<br />
Frontiers in Ecology and the Environment 6: 229–237.<br />
Peters DPC, et al. 2011. Long-term Trends in Ecological Systems: A Basis<br />
for Understanding Responses to Global Change. US Department <strong>of</strong><br />
Agriculture, Agricultural Research Service.<br />
Peterson BJ, et al. 2001. Control <strong>of</strong> nitrogen export from watersheds by<br />
headwater streams. Science 292: 86–90.<br />
Redman CL, Grove JM, Kuby LH. 2004. Integrating social science into<br />
the Long Term Ecological Research (<strong>LTER</strong>) Network: Social dimensions<br />
<strong>of</strong> ecological change and ecological dimensions <strong>of</strong> social change.<br />
Ecosystems 7: 161–171.<br />
Reichman OJ, Jones MB, Schildhauer MP. 2011. Challenges and opportunities<br />
<strong>of</strong> open data in ecology. Science 331: 703–705.<br />
Robertson GP. 2008. Long-term ecological research: Re-inventing network<br />
science. Frontiers in Ecology and the Environment 6: 281.<br />
Smith MD, Knapp AK, Collins SL. 2009. A framework for assessing ecosystem<br />
dynamics in response to chronic resource alterations induced by<br />
global change. Ecology 90: 3279–3289.<br />
Solomon S, Plattner G-K, Knutti R, Friedlingstein P. 2009. Irreversible<br />
climate change due to carbon dioxide emissions. Proceedings <strong>of</strong> the<br />
National Academy <strong>of</strong> Sciences 106: 1704–1709.<br />
Suding KN, Collins SL, Gough L, Clark C, Cleland EE, Gross KL, Milchunas<br />
DG, Pennings S. 2005. Functional- and abundance-based mechanisms<br />
explain diversity loss due to N fertilization. Proceedings <strong>of</strong> the National<br />
Academy <strong>of</strong> Sciences 102: 4387–4392.<br />
Thompson JR, Foster DR, Scheller R, Kittredge D. 2011 The influence <strong>of</strong><br />
land use and climate change on forest biomass and composition in<br />
Massachusetts, USA. Ecological Applications 21: 2425–2444.<br />
Articles<br />
Thompson JR, Wiek A, Swanson FJ, Carpenter SR, Fresco N, Hollingsworth<br />
T, Spies TA, Foster DR. 2012. Scenario studies as a synthetic and integrative<br />
research activity for long-term ecological research. BioScience<br />
62: 367–376.<br />
Vanneman A, Hamilton L, Anderson JB. 2009. Achievement Gaps: How<br />
Black and White Students in Public Schools Perform in Mathematics<br />
and Reading on the National Assessment <strong>of</strong> Educational Progress.<br />
National Center for Education Statistics, US Department <strong>of</strong> Education.<br />
Report no. NCES 2009-455.<br />
Waide RB, Willig MR, Steiner CF, Mittelbach G, Gough L, Dodson GI, Juday<br />
GP, Parmenter R. 1999. The relationship between primary productivity<br />
and species richness. Annual Review <strong>of</strong> Ecology and Systematics 30:<br />
257–300.<br />
G. Philip Robertson (robertson@kbs.msu.edu) is a pr<strong>of</strong>essor with the W. K.<br />
Kellogg Biological Station and with the Department <strong>of</strong> Crop and Soil Sciences<br />
at Michigan State <strong>University</strong>, in Hickory Corners. Scott L. Collins is a pr<strong>of</strong>essor<br />
in the Department <strong>of</strong> Biology at the <strong>University</strong> <strong>of</strong> New Mexico, in<br />
Albuquerque. David R. Foster is a pr<strong>of</strong>essor in the Department <strong>of</strong> Organismic<br />
and Evolutionary Biology at Harvard <strong>University</strong> and director <strong>of</strong> the Harvard<br />
Forest in Petersham, Massachusetts. Nicholas Brokaw is a pr<strong>of</strong>essor with the<br />
Institute for Tropical Ecosystem Studies at the <strong>University</strong> <strong>of</strong> Puerto Rico, in San<br />
Juan. Hugh W. Ducklow is a senior scientist and director <strong>of</strong> The Ecosystems<br />
Center at the Marine Biological Laboratory in Woods Hole, Massachusetts.<br />
Ted L. Gragson is a pr<strong>of</strong>essor and chair <strong>of</strong> the Department <strong>of</strong> Anthropology<br />
at the <strong>University</strong> <strong>of</strong> <strong>Georgia</strong>, in Athens. Corinna Gries is a research scientist<br />
at the Center for Limnology at the <strong>University</strong> <strong>of</strong> Wisconsin, in Madison.<br />
Stephen K. Hamilton is a pr<strong>of</strong>essor in the Department <strong>of</strong> Zoology and the<br />
W. K. Kellogg Biological Station <strong>of</strong> Michigan State <strong>University</strong>, in Hickory<br />
Corners. A. David McGuire is a pr<strong>of</strong>essor in the Department <strong>of</strong> Biology<br />
and Wildlife at the <strong>University</strong> <strong>of</strong> Alaska, in Fairbanks, and is affiliated with<br />
the US Geological Survey. John C. Moore is a pr<strong>of</strong>essor and director <strong>of</strong> the<br />
Natural Resource Ecology Laboratory at Colorado State <strong>University</strong>, in Fort<br />
Collins. Emily H. Stanley is a pr<strong>of</strong>essor with the Center for Limnology at the<br />
<strong>University</strong> <strong>of</strong> Wisconsin, Madison. Robert B. Waide is pr<strong>of</strong>essor <strong>of</strong> <strong>biology</strong> at<br />
the <strong>University</strong> <strong>of</strong> New Mexico, in Albuquerque, and executive director <strong>of</strong> the<br />
Long Term Ecological Research Network. Mark W. Williams is a pr<strong>of</strong>essor in<br />
the Department <strong>of</strong> Geography at the <strong>University</strong> <strong>of</strong> Colorado, in Boulder.<br />
www.biosciencemag.org April 2012 / Vol. 62 No. 4 • BioScience 353
Articles<br />
Science and Society: The Role <strong>of</strong><br />
Long-Term Studies in Environmental<br />
Stewardship<br />
Charles T. DrisColl, KaThleen F. lamberT, F. sTuarT Chapin iii, DaviD J. nowaK, Thomas a. spies,<br />
FreDeriCK J. swanson, DaviD b. KiTTreDge Jr., anD Clarisse m. harT<br />
Long-term research should play a crucial role in addressing grand challenges in environmental stewardship. We examine the efforts <strong>of</strong> five Long<br />
Term Ecological Research Network sites to enhance policy, management, and conservation decisions for forest ecosystems. In these case studies,<br />
we explore the approaches used to inform policy on atmospheric deposition, public land management, land conservation, and urban forestry,<br />
including decisionmaker engagement and integration <strong>of</strong> local knowledge, application <strong>of</strong> models to analyze the potential consequences <strong>of</strong> policy<br />
and management decisions, and adaptive management to generate new knowledge and incorporate it into decisionmaking. Efforts to enhance<br />
the role <strong>of</strong> long-term research in informing major environmental challenges would benefit from the development <strong>of</strong> metrics to evaluate impact;<br />
stronger partnerships among research sites, pr<strong>of</strong>essional societies, decisionmakers, and journalists; and greater investment in efforts to develop,<br />
test, and expand practice-based experiments at the interface <strong>of</strong> science and society.<br />
Keywords: boundary spanning, environmental policy and management, Long Term Ecological Research Network, science communication<br />
The growing urgency and complexity <strong>of</strong> challenges to<br />
global sustainability demands new approaches for engaging<br />
the intellectual capital <strong>of</strong> expert communities worldwide.<br />
To meet this demand, the scientific and social-science communities<br />
must expand their capacity to work at the interfaces<br />
between ecological science and environmental policy,<br />
natural-resource management, and conservation. The need<br />
for stronger, more-reliable linkages between science and<br />
society is well documented in both popular media and the<br />
academic literature (e.g., Lubchenco 1998).<br />
The US National Science Foundation (NSF) recognized<br />
the importance <strong>of</strong> translating the benefits <strong>of</strong> research for<br />
society by establishing its “broader impacts” review criterion<br />
in 1997. In 2002, the NSF’s 20-year review <strong>of</strong> the Long Term<br />
Ecological Research (<strong>LTER</strong>) Network recommended that<br />
the <strong>LTER</strong> Network program assume a more powerful and<br />
pervasive role in informing environmental solutions at local,<br />
national, and international levels. In 2005, the Ecological<br />
Society <strong>of</strong> America (ESA) established the foundation for<br />
its Earth Stewardship initiative (Chapin et al. 2011) when it<br />
recommended that ecologists must play a greatly expanded<br />
role in communicating their research and influencing policies<br />
and decisions that affect the environment. It is critical<br />
for the <strong>LTER</strong> Network and for other ecosystem research<br />
programs to move beyond broad calls for action and to build<br />
deliberate and effective long-term relationships between<br />
ecological science and environmental decisionmaking. In<br />
this article, we illustrate, as do the other authors in this<br />
special section (e.g., Thompson et al. 2012 [in this issue]),<br />
the growing role that <strong>LTER</strong> is playing to enhance science<br />
engagement with local, regional, and national policy and<br />
management issues. To develop such programs, the scientific<br />
community needs to build experience and learn from<br />
practical examples <strong>of</strong> effective synthesis and integration <strong>of</strong><br />
<strong>LTER</strong> to meet the needs <strong>of</strong> society. In this article, we present<br />
and discuss five case studies <strong>of</strong> work at the interface <strong>of</strong> science,<br />
policy, and management from forested <strong>LTER</strong> Network<br />
sites across the United States. We distill a set <strong>of</strong> common<br />
strategies, lessons, and recommendations for improving and<br />
expanding interface efforts to improve the ability to meet the<br />
grand challenges in environmental science <strong>of</strong> our time.<br />
Effective science interface efforts<br />
Although the integration <strong>of</strong> science and society is <strong>of</strong>ten<br />
viewed as a relatively narrow issue <strong>of</strong> a need for more and<br />
better science communication, programs that build stronger<br />
interfaces between science and society require attention to<br />
the full range <strong>of</strong> boundary-spanning activities, such as public<br />
engagement, decision-relevant synthesis, distillation <strong>of</strong><br />
results, and science translation and dissemination, through<br />
BioScience 62: 354–366. ISSN 0006-3568, electronic ISSN 1525-3244. © 2012 by American Institute <strong>of</strong> Biological Sciences. All rights reserved. Request<br />
permission to photocopy or reproduce article content at the <strong>University</strong> <strong>of</strong> California Press’s Rights and Permissions Web site at www.ucpressjournals.com/<br />
reprintinfo.asp. doi:10.1525/bio.2012.62.4.7<br />
354 BioScience • April 2012 / Vol. 62 No. 4 www.biosciencemag.org
a variety <strong>of</strong> media to meet the needs <strong>of</strong> diverse audiences<br />
(Cash et al. 2003, Driscoll et al. 2011). Boundary spanning<br />
refers to “practices and processes that facilitate bringing<br />
science and society closer together in order to produce<br />
‘useful’ information—that is, information that is salient,<br />
credible, and legitimate” (McNie et al. 2008, p. 9). Building<br />
credibility, salience, and legitimacy with stakeholders helps<br />
to solidify long-term relationships and increases the influence<br />
<strong>of</strong> scientific research in the decisionmaking process<br />
over time (Cash et al. 2003).<br />
The role <strong>of</strong> the <strong>LTER</strong> Network<br />
After 30 years <strong>of</strong> coordinated research and education, the<br />
<strong>LTER</strong> Network is well positioned to facilitate the integration<br />
<strong>of</strong> science and society by using its highly credible, longterm<br />
science to support engagement with decisionmakers<br />
to frame relevant questions for research and synthesis that<br />
can inform environmental policy and conservation. The<br />
<strong>LTER</strong> Network consists <strong>of</strong> 26 research sites throughout the<br />
United States and a few outside the United States, some <strong>of</strong><br />
which have been operating for three decades or longer. The<br />
long-term ecosystem measurements and experiments that<br />
are a hallmark <strong>of</strong> the <strong>LTER</strong> Network address important<br />
environmental issues in coupled human–natural systems,<br />
including climate change, land use, pollution, and the loss<br />
<strong>of</strong> biodiversity (Knapp et al. 2012 [in this issue], Thompson<br />
et al. 2012 [in this issue]). Another distinguishing feature <strong>of</strong><br />
the <strong>LTER</strong> Network is its core <strong>of</strong> researchers at each site, who<br />
are attentive to the well-being and future <strong>of</strong> their respective<br />
bioregions.<br />
The <strong>LTER</strong> Network’s new Strategic Communication Plan<br />
(<strong>LTER</strong> Network 2010a) and Strategic and Implementation<br />
Plan (<strong>LTER</strong> Network 2010b) call for the network to reach<br />
out to decisionmakers at local, regional, national, and international<br />
levels. The communication plan specifically recommends<br />
engaging decisionmakers in the framing <strong>of</strong> cross-site<br />
synthesis and equipping these efforts with full-scale communication<br />
capacity, funding a supplement program for<br />
<strong>LTER</strong> Network sites to develop local and regional programs<br />
for public engagement and outreach, and partnering with<br />
existing <strong>LTER</strong> Network sites that have established science<br />
journalism programs to develop sustained outreach to the<br />
media.<br />
The value <strong>of</strong> long-term monitoring and research<br />
Environmental policy and management issues play out over<br />
decades or longer and benefit from the continuous advances<br />
in understanding that are derived from long-term research.<br />
Policy development is an iterative process that requires<br />
ongoing assessment, reevaluation, adaptive management,<br />
and consideration <strong>of</strong> future scenarios (Driscoll et al. 2010).<br />
For example, although the Clean Air Act was first passed<br />
by Congress in 1972, the development <strong>of</strong> amendments and<br />
rules to implement the act are ongoing and rely on quantitative<br />
information to evaluate the effectiveness <strong>of</strong> pollution-<br />
control measures and to guide program management (Lovett<br />
Articles<br />
et al. 2007). Long-term measurements that link decreases in<br />
emissions with changes in soil and water quality and the<br />
health <strong>of</strong> aquatic and terrestrial ecosystems are vital to<br />
assessing the extent to which air pollution regulations meet<br />
the intent <strong>of</strong> the act (Driscoll et al. 2001).<br />
Similarly, effective natural-resource management is adaptive<br />
and draws on lessons from past decisions and management<br />
experience distilled from the results <strong>of</strong> long-term<br />
measurements and experiments, regional surveys, and<br />
modeling (Spies et al. 2010). The practice <strong>of</strong> forestry in landscapes<br />
that support multiple uses must adapt to new knowledge<br />
regarding the nature and effects <strong>of</strong> climate change,<br />
forest management, land-use trends, intense storms, fire,<br />
and other disturbances. This understanding must include<br />
the impacts <strong>of</strong> these <strong>of</strong>ten interacting pulse and press stressors<br />
on management goals and ecosystem services, such<br />
as fiber production, biological diversity, carbon storage,<br />
trace-gas production and consumption, water quantity and<br />
quality, and recreation. Detailed, long-term measurements<br />
tied directly to management-relevant forest experiments<br />
have improved the scientific basis for forest management<br />
and policy. Important examples include the guiding principles<br />
for the conservation <strong>of</strong> old-growth forests (Franklin<br />
et al. 1981) and regional- and continental-scale carbon<br />
budgets important to climate-change mitigation (Lovett<br />
et al. 2007).<br />
The five case studies presented here represent examples <strong>of</strong><br />
outreach activities at selected forested <strong>LTER</strong> Network sites.<br />
We chose this suite <strong>of</strong> case studies because they have active<br />
programs for engaging decisionmakers, represent a range <strong>of</strong><br />
policy and management issues, and use different approaches<br />
to achieve their outreach goals for a common ecosystem type.<br />
Reviewing efforts across forest sites provides the opportunity<br />
to consider how audiences, management and policy<br />
issues, and communication approaches vary across diverse<br />
regional research sites and programs. Specifically, the case<br />
studies incorporate the impacts <strong>of</strong> atmospheric deposition<br />
on forested ecosystems (Hubbard Brook), land-use change<br />
and forest conservation in a predominantly private-lands<br />
landscape (Harvard Forest), endangered species and public<br />
lands management (Andrews), urban forestry in developed<br />
landscapes (Baltimore), and forest stewardship in<br />
the context <strong>of</strong> changing fire and climate regimes (Bonanza<br />
Creek). These case studies represent only some <strong>of</strong> the many<br />
science–policy integration efforts that exist across the <strong>LTER</strong><br />
Network (for other examples, see the Translating Science<br />
for Society brochure at http://intranet2.lternet.edu/sites/<br />
intranet2.l ternet.edu/files/documents/Network_Publications/<br />
Brochures/nsf0533.pdf ). In each <strong>of</strong> these cases, the ability<br />
to tap into core strengths <strong>of</strong> the <strong>LTER</strong> Network, such as<br />
long-term research that is relevant to policy and management<br />
issues, advanced information-management systems,<br />
and stores <strong>of</strong> long-term data, has proven essential to the<br />
synthesis and distillation <strong>of</strong> science for use in policy and<br />
management decisions related to coupled human–natural<br />
systems.<br />
www.biosciencemag.org April 2012 / Vol. 62 No. 4 • BioScience 355
Articles<br />
Case studies in linking <strong>LTER</strong> science with policy,<br />
conservation, and management<br />
Below, we describe several case studies that link <strong>LTER</strong> science<br />
with policy, conservation, and management.<br />
Air pollution effects on ecosystems: The Hubbard Brook Research<br />
Foundation Science Links Program. Air pollution can have<br />
marked effects on the structure and function <strong>of</strong> ecosystems<br />
through elevated atmospheric deposition <strong>of</strong> sulfur, oxidized<br />
and reduced nitrogen compounds and mercury, and<br />
high concentrations <strong>of</strong> tropospheric ozone. Recent efforts<br />
to channel this knowledge into decisionmaking through<br />
organized outreach and communication have increased<br />
the influence <strong>of</strong> long-term research on air-quality management<br />
in the United States (Driscoll et al. 2010). The <strong>LTER</strong><br />
Network, through its long-term measurements and experiments<br />
(Driscoll et al. 2001), has been particularly effective<br />
in addressing policy issues concerning air pollution and<br />
atmospheric deposition effects on ecosystems.<br />
The effects <strong>of</strong> air pollution on forest and aquatic ecosystems<br />
have been a research focus since the inception <strong>of</strong> the<br />
Hubbard Brook Ecosystem Study and the Hubbard Brook<br />
<strong>LTER</strong> site. The value <strong>of</strong> long-term measurements <strong>of</strong> the<br />
chemistry <strong>of</strong> precipitation and streamwater at the Hubbard<br />
Brook Experimental Forest in documenting trends in acidic<br />
deposition and in assessing the effectiveness <strong>of</strong> the federal<br />
Clean Air Act represents an important example <strong>of</strong> the connections<br />
between long-term research and air-quality policy<br />
(figure 1). The Hubbard Brook Research Foundation (HBRF)<br />
launched Science Links in 1998 to build on this legacy and to<br />
develop new initiatives linking ecosystem science with public<br />
policy (http://hubbardbrookfoundation.org/12-2).<br />
Science Links projects are state-<strong>of</strong>-the-science synthesis<br />
efforts <strong>of</strong> an environmental issue in the context <strong>of</strong> current<br />
policy discussions. The first three Science Links projects<br />
addressed air pollution impacts on ecosystems, including the<br />
effects <strong>of</strong> acid, nitrogen, and mercury deposition (Driscoll<br />
et al. 2001, 2011). Science Links projects involve teams <strong>of</strong><br />
around 12 scientific experts, selected on the basis <strong>of</strong> their<br />
experience and disciplinary coverage, and a team <strong>of</strong> policy<br />
advisers. The science teams define the scope <strong>of</strong> the project,<br />
analyze relevant databases and conduct model calculations.<br />
The policy advisers are engaged in dialogue from the outset<br />
to frame policy-relevant questions, discuss the alternatives<br />
analyzed, and provide input on Science Links products.<br />
A communication and outreach plan is integral to the<br />
success <strong>of</strong> Science Links projects. The written plan provides<br />
a roadmap to facilitate an exchange between scientists and<br />
policy stakeholders as well as direct outreach to journalists.<br />
The centerpiece <strong>of</strong> any Science Links project is the translation<br />
report aimed at congressional and government-agency<br />
staff involved in policy development. These reports are<br />
structured to facilitate communication <strong>of</strong> the major findings,<br />
with the conclusions presented first in clear, straightforward<br />
terms, followed by supporting information with<br />
layered details. A proactive media strategy has been critical<br />
to the impact <strong>of</strong> Science Links projects. Accurate and widespread<br />
media coverage has brought attention to Science<br />
Links results and verified the societal importance <strong>of</strong> the<br />
findings for policymakers. The initial public release <strong>of</strong> a<br />
Science Links report is followed by additional interviews,<br />
seminars, and briefings for up to a year. Science Links<br />
projects have also been coupled with the Hubbard Brook<br />
<strong>LTER</strong> site educational activities through the development<br />
<strong>of</strong> supplemental teacher guides.<br />
There are several dimensions to quantifying the impact<br />
<strong>of</strong> Science Links projects (Driscoll et al. 2011). The scientific<br />
impact can be measured by the number <strong>of</strong> citations<br />
in the scientific literature; the six Science Links journal<br />
articles have been cited more than 1300 times in the peerreviewed<br />
literature. The media impact can be measured by<br />
the extent and quality <strong>of</strong> media cover. Science Links initiatives<br />
have been covered in more than 475 media stories<br />
and have appeared in major news outlets, including an<br />
opinion–editorial piece in The New York Times. The impacts<br />
on policy are more difficult to quantify. Moreover, they are<br />
356 BioScience • April 2012 / Vol. 62 No. 4 www.biosciencemag.org<br />
a<br />
b<br />
Figure 1. Relationships between annual volume-weighted<br />
concentrations <strong>of</strong> sulfate (a) and nitrate (b) in precipitation<br />
at the Hubbard Brook Experimental Forest and emissions<br />
<strong>of</strong> sulfur dioxide and nitrogen oxides, respectively, in the<br />
emission source area <strong>of</strong> the northeastern United States.<br />
The emission source area used is specified in Driscoll and<br />
colleagues (2001). Abbreviations: NO x , nitrogen oxides;<br />
R 2 , regression coefficient; SO 2 , sulphur dioxide; Tg/year,<br />
teragrams per year; µeq/L, microequivalencies per liter.
<strong>of</strong>ten beyond the control <strong>of</strong> the scientists, regardless <strong>of</strong> the<br />
process used to link science to policy. Timing is everything<br />
in this dance between science and management. Forms <strong>of</strong><br />
evidence <strong>of</strong> policy uptake include reference to Science Links<br />
findings in proposed legislation (e.g., the Clean Power Act,<br />
the National Mercury Monitoring Act), legal briefs (e.g., the<br />
Northeast States New Source Review case against the US<br />
Environmental Protection Agency), and media accounts<br />
<strong>of</strong> major policy and court decisions (e.g., the Interstate<br />
Transfer Rule for nitrogen oxide emissions and the remand<br />
<strong>of</strong> the Clean Air Mercury Rule and its trading provisions).<br />
Beyond this evidence, policymakers and program managers<br />
routinely comment on the usefulness <strong>of</strong> Science Links in<br />
improving the scientific basis for decisionmaking because<br />
<strong>of</strong> its reliance on rigorous long-term research and effective<br />
translation.<br />
Uniting conservation science and policy: Examples from the<br />
Harvard Forest <strong>LTER</strong> site. The Harvard Forest has oriented its<br />
Articles<br />
long-term studies around forest management and conservation<br />
questions in New England since its inception in<br />
1907. When it was established by Harvard <strong>University</strong>, its<br />
objectives were to serve as a model forest to demonstrate<br />
the practice <strong>of</strong> forestry, an experiment station for research<br />
in forestry, and a field laboratory for students (Fisher 1921).<br />
Today, Harvard Forest scientists remain dedicated to the<br />
founding tenet <strong>of</strong> drawing on insights gained through the<br />
historical and retrospective study <strong>of</strong> forests, natural disturbance,<br />
and land use (Fisher 1933, Foster 2000), and the<br />
Harvard Forest serves as a central gathering spot for meetings<br />
and workshops among forest managers, conservationists,<br />
policymakers, and scientists in the Northeast.<br />
Long-term research at Harvard Forest has informed many<br />
important conservation efforts, as well as policy and management<br />
decisions in the region (figure 2; Foster et al.<br />
2010). For instance, a review <strong>of</strong> land-ownership history<br />
and conservation patterns led to the creation <strong>of</strong> the North<br />
Quabbin Partnership and to an increase <strong>of</strong> conservation<br />
Figure 2. Harvard Forest research and conservation linkages: primary research and synthesis examples related to the<br />
Wildlands and Woodlands Initiative.<br />
www.biosciencemag.org April 2012 / Vol. 62 No. 4 • BioScience 357
Articles<br />
land in the region from 36.8% in 1993 to 45.1% in 2010<br />
(Golodetz and Foster 1997). Research on the potential for<br />
local constraints on forestry to displace harvesting pressures<br />
to other, more sensitive parts <strong>of</strong> the world has broadened<br />
public acceptance <strong>of</strong> forestry in the region (Berlik et al. 2002).<br />
Surveys have documented how underrepresented old-growth<br />
forests are in southern New England, which has aided in the<br />
preservation <strong>of</strong> the few remaining sites (Orwig et al. 2001,<br />
D’Amato et al. 2006). Many <strong>of</strong> these linkages grew out <strong>of</strong><br />
strong informal ties between scientists and stakeholders built<br />
by serving on local, state, and regional committees.<br />
In 2005, the Harvard Forest launched its Wildlands and<br />
Woodlands (W&W) Initiative, which emphasizes decisionrelevant<br />
synthesis, communication, and stakeholder partnerships.<br />
The knowledge gained from dozens <strong>of</strong> studies at<br />
the Harvard Forest was synthesized into a series <strong>of</strong> W&W<br />
publications that were aimed at nonscientists and that called<br />
for stemming the loss <strong>of</strong> forest cover now occurring in all<br />
six New England states as large areas (e.g., in Maine) experience<br />
significant shifts in landownership. The publications<br />
call for balancing the preservation <strong>of</strong> wildlands with large<br />
areas <strong>of</strong> actively managed woodlands and for promoting<br />
civic engagement through landowner-conceived woodland<br />
councils (Foster et al. 2005, 2010).<br />
Since 2005, the W&W Initiative has produced two major<br />
reports, two update publications, and a Web site (www.<br />
wildlandsandwoodlands.org), with the purpose <strong>of</strong> raising<br />
awareness about the pace and consequences <strong>of</strong> land-cover<br />
change. Both W&W reports had extensive stakeholder input,<br />
and the second garnered comments from several hundred<br />
agency, nongovernmental-organization (NGO), landowner,<br />
and industry representatives. Harvard Forest has since<br />
teamed up with the nonpr<strong>of</strong>it organization Highstead to<br />
form a partnership with more than 60 participating groups<br />
to sustain stakeholder engagement and to help implement<br />
the vision <strong>of</strong> the W&W Initiative. The reports were accompanied<br />
by press releases; webinars; stakeholder briefings;<br />
and, in May 2010, a public event with Harvard <strong>University</strong>’s<br />
Kennedy School <strong>of</strong> Government.<br />
Assessing the societal impact <strong>of</strong> Harvard Forest research<br />
over the past 100 years is beyond the scope <strong>of</strong> this case<br />
study. However, we compiled information on the impact<br />
<strong>of</strong> W&W communication to shed light on the value <strong>of</strong> this<br />
coordinated outreach effort. In the two months following<br />
its release, the 2010 report generated 137 media and<br />
newsletter stories and 62 visits per day to the new W&W<br />
Web site, including visitors from 35 countries from five<br />
continents. By contrast, Harvard Forest garnered 21 non-<br />
W&W news stories between 2008 and 2010. W&W authors<br />
participated in 21 briefings, presentations, and workshops<br />
in the nine months since publication, which expanded the<br />
project’s influence and reach. These W&W synthesis and<br />
communication efforts have contributed to several notable<br />
policy and management advances, including the decision by<br />
the state <strong>of</strong> Massachusetts to establish permanent wildland<br />
reserves, the introduction <strong>of</strong> a conservation-finance bill in<br />
the Massachusetts General Assembly to accelerate the pace<br />
<strong>of</strong> conservation, and the launching <strong>of</strong> an innovative effort<br />
to aggregate multiple parcels into a single project with the<br />
goal <strong>of</strong> conserving approximately 10,000 acres <strong>of</strong> forest in<br />
western Massachusetts. The W&W efforts also fueled new<br />
research, including the establishment <strong>of</strong> new long-term<br />
study plots across sites with diverse histories, ownership, and<br />
management objectives; and a new cross-site <strong>LTER</strong> proposal<br />
on the Future Scenarios <strong>of</strong> Forest Change (see Thompson<br />
et al. 2012 [in this issue]).<br />
Sustained research–management partnerships at the Andrews<br />
Forest <strong>LTER</strong> site. The H. J. Andrews Experimental Forest and<br />
<strong>LTER</strong> site in the Oregon Cascade Range contains many <strong>of</strong><br />
the iconic and hotly debated elements <strong>of</strong> Pacific Northwest<br />
forests: old-growth trees; northern spotted owls; and cold,<br />
clear, fast streams. Societal conflicts over the future <strong>of</strong> the<br />
vast tracts <strong>of</strong> federal forestlands in the region have been<br />
pr<strong>of</strong>oundly affected by science findings from the Andrews<br />
Forest and, in turn, have strongly influenced the course <strong>of</strong><br />
science in the region and more broadly.<br />
The research history <strong>of</strong> the Andrews Forest, stretching<br />
back to its establishment in 1948, reflects a commitment<br />
to long-term ecological and watershed research by the US<br />
Forest Service and with NSF-funded programs under the<br />
International Biological Program in the 1970s, followed by<br />
<strong>LTER</strong> Network since 1980. These integrated science programs<br />
have produced high-quality studies and long-term<br />
records that underpin interpretations <strong>of</strong> ecosystem and<br />
environmental change and sustain an interdisciplinary cadre<br />
<strong>of</strong> scientists, all <strong>of</strong> whom are essential in investigating ecosystems<br />
that change abruptly and also gradually over time<br />
scales <strong>of</strong> decades and centuries. The context <strong>of</strong> extensive<br />
federal forestlands (e.g., US Forest Service, US Bureau <strong>of</strong><br />
Land Management) provides an audience <strong>of</strong> land managers<br />
who are required to guide management using current<br />
science. And, if they fail to do so, litigants and the courts<br />
remind them.<br />
A central feature <strong>of</strong> the Andrews Forest program is a<br />
research–management partnership that develops, tests, demonstrates,<br />
and critically evaluates alternative approaches to<br />
management so that when the policy window opens, new,<br />
scientifically and operationally credible approaches to management<br />
are ripe for broad adoption (http:// andrewsforest.<br />
oregonstate.edu/resmgt.cfm?topnav=35). This partnership<br />
involves the research community centered on the Andrews<br />
Forest <strong>LTER</strong> site and land managers <strong>of</strong> the Willamette<br />
National Forest. The partnership has made substantial<br />
impacts on forest management and policy on topics such<br />
as the characteristics <strong>of</strong> and conservation strategies for oldgrowth<br />
forest ecosystems (Franklin et al. 1981, Spies and<br />
Duncan 2009); the ecological roles and management implications<br />
<strong>of</strong> dead wood on land and in streams (Gregory et al.<br />
1991); the ecology and population dynamics <strong>of</strong> the northern<br />
spotted owl (Forsman et al. 1984); the effects <strong>of</strong> forest cutting<br />
and roads on streamflow, including floods (Jones 2000);<br />
358 BioScience • April 2012 / Vol. 62 No. 4 www.biosciencemag.org
Articles<br />
Figure 3. Andrews Experimental Forest research and links with management and policy for forestlands and watersheds.<br />
interactions <strong>of</strong> road and stream networks (Jones et al. 2000);<br />
and interactions <strong>of</strong> climate change with management and<br />
policy (Spies et al. 2010).<br />
With roots in the early 1950s and the assignment <strong>of</strong> the first<br />
scientist to the Andrews Forest, the research–management<br />
partnership has become a continuous, place-based learning<br />
program with balanced, reciprocal communication<br />
between the management and research communities and<br />
their respective cultures. To facilitate communication, the<br />
research–management interface is staffed with a research<br />
liaison position at the Willamette National Forest, which<br />
facilitates outreach to land managers and the public. The<br />
technical findings <strong>of</strong> research and management experience<br />
are communicated through diverse media, such as journal<br />
articles, including ones <strong>join</strong>tly composed by scientists and<br />
land managers (Cissel et al. 1999); publications prepared for<br />
land managers and the general public (e.g., in the Science<br />
Findings and Science Update series <strong>of</strong> the US Forest Service;<br />
www.fs.fed.us/pnw/publications/scifi.shtml, www.fs.fed.us/<br />
pnw/publications/sci-update.shtml); workshops; and field<br />
tours. In some cases, social scientists have examined the<br />
effectiveness <strong>of</strong> communications on challenging topics, such<br />
as the use <strong>of</strong> historic disturbance regimes to guide future<br />
land management (Shindler and Mallon 2009). The net<br />
effect <strong>of</strong> this communication program is a continuing public<br />
discussion <strong>of</strong> the future <strong>of</strong> forest and watershed management<br />
and policy in the region.<br />
The impacts <strong>of</strong> long-term research from the Andrews<br />
Forest and the research–management partnership are<br />
manifest in federal agencies’ management <strong>of</strong> forest stands<br />
and landscapes throughout the Pacific Northwest and more<br />
broadly (figure 3). In particular, the Northwest Forest<br />
Plan, which drew heavily from research from the Andrews<br />
Forest, ushered in a new era <strong>of</strong> ecosystem-based management<br />
on 10 million hectares <strong>of</strong> federal lands in northern<br />
California and western Oregon and Washington (FEMAT<br />
1993, USDA and USDI 1994). Andrews Forest–based science<br />
on old-growth forests, forest–stream interactions, aspects<br />
<strong>of</strong> biodiversity, and the roles <strong>of</strong> dead wood in forests and<br />
streams helped shape new federal land-management policies<br />
(FEMAT 1993). Several <strong>of</strong> the key publications have been<br />
cited in the scientific literature more than 1000 times each,<br />
which indicates the influence <strong>of</strong> the concepts in the environmental<br />
sciences. Since 1994, individual research themes have<br />
continued to influence management practices in the region<br />
( figure 3). Publications from the Andrews Forest–based work<br />
are widely cited in planning documents for timber sales and<br />
fuel-treatment projects on National Forests and US Bureau<br />
<strong>of</strong> Land Management districts across the Pacific Northwest.<br />
The impact <strong>of</strong> the research–management partnership has<br />
drawn social scientists to examine the dynamics, motivations,<br />
and public perception <strong>of</strong> these science–management–<br />
policy connections (Lach et al. 2003).<br />
Tools for assessing services and values to improve urban naturalresources<br />
stewardship: Baltimore Ecosystem Study long-term<br />
data. Information on natural resources in urban areas is<br />
<strong>of</strong>ten lacking and limits the ability <strong>of</strong> planners and managers<br />
www.biosciencemag.org April 2012 / Vol. 62 No. 4 • BioScience 359
Articles<br />
to properly steward or incorporate natural-resources services<br />
within urban ecosystems. Long-term research is currently<br />
being conducted in the Baltimore area to foster a better<br />
understand how urbanization affects natural system processes<br />
(e.g., Pickett and Cadenasso 2006). Baltimore, through<br />
its participation in the <strong>LTER</strong> Network, was one <strong>of</strong> the first<br />
cities to have its entire forest and tree structure assessed,<br />
along with the concomitant ecosystem services and values<br />
(e.g., pollution removal, carbon storage and sequestration,<br />
effects on building energy use; see, e.g., Nowak et al. 2008).<br />
It is also the first city (along with Syracuse, New York) to<br />
establish (in 1999) permanent vegetation-monitoring plots<br />
to assess long-term vegetation changes (Nowak et al. 2004).<br />
These data provide critical information for better understanding<br />
<strong>of</strong> urban vegetation systems, their environmental<br />
effects, and how these ecosystems are changing. These data<br />
have also helped in the development and testing <strong>of</strong> publicdomain<br />
s<strong>of</strong>tware tools designed to aid managers and the<br />
general public in assessing urban trees and their associated<br />
ecosystem services and values. Data collected in Baltimore<br />
and other cities in the mid to late 1990s led to the development<br />
<strong>of</strong> s<strong>of</strong>tware to assess urban forest structure and functions:<br />
the UFORE (urban forest effects) model (Nowak and<br />
Crane 2000). Through time, a diverse collaboration developed<br />
among numerous partners to expand the development<br />
<strong>of</strong> this and other urban forest computer programs into a<br />
suite <strong>of</strong> free s<strong>of</strong>tware tools known as i-Tree (www.itreetools.<br />
org), which was released in 2006.<br />
The information provided by i-Tree s<strong>of</strong>tware has been<br />
used to inform management and policies throughout<br />
the world in relation to urban forestry. The influence <strong>of</strong><br />
i-Tree results from the use <strong>of</strong> the model and local data<br />
by consultants, managers, and local citizens to guide<br />
management and policies decisions related to issues such<br />
as emerald ash borer protection (Siyver 2009), building<br />
financial support for urban forestry programs (Society<br />
<strong>of</strong> Municipal Arborists 2008), linking local tree data<br />
with the US Conference <strong>of</strong> Mayors Climate Protection<br />
Agreement (Hyde 2009), public outreach campaigns (e.g.,<br />
billboards) on the benefits <strong>of</strong> trees (Siyver 2009), developing<br />
urban forest strategic management plans (McNeil<br />
and Vava 2006), and helping secure financing for tree<br />
planting and management (e.g., Ibrahim 2009). Most <strong>of</strong><br />
the data collected and analyzed through i-Tree are used to<br />
encourage municipal, county, and state leaders to establish<br />
or improve urban forestry programs, to recognize<br />
the role that trees play among urban natural resources,<br />
and to focus funds to improve stewardship. New tools<br />
were released in early 2010 (version 4.0) that include new<br />
approaches to help integrate science into local policy decisions<br />
related to streamflow, tree pests, local tree cover and<br />
effects, and related ecosystem services.<br />
Information and results from i-Tree, its analyses, and<br />
impacts are generally communicated by the research partners<br />
and users to others through public presentations,<br />
reports and articles, webinars, the i-Tree Web site, and word<br />
<strong>of</strong> mouth. To assist in communicating project results, i-Tree<br />
automatically produces a standard report with graphics that<br />
users can export and customize for their own use (figure 4).<br />
Users can also report ideas, questions, or problems back to<br />
the i-Tree team, which are then used to update or develop<br />
future versions.<br />
To date, more than 8200 unique users in 99 countries have<br />
downloaded the s<strong>of</strong>tware. Use <strong>of</strong> i-Tree has grown at about<br />
30% per year since its release in August 2006. i-Tree Web site<br />
traffic has increased about tenfold since the release <strong>of</strong> version<br />
3.0 in June 2009 and continues to increase. Currently,<br />
about 20,000 unique users access the Web site every three<br />
months. Focused surveys <strong>of</strong> users have been conducted to<br />
help determine the types <strong>of</strong> impacts. Between 50 and 100<br />
journal articles and reports have been published in which<br />
i-Tree was used, and the numbers have increased annually.<br />
New programs in development are focused on temporal and<br />
spatial modeling <strong>of</strong> forest effects, and the Baltimore longterm<br />
permanent field-plot data are critical to the development<br />
<strong>of</strong> these new tools. International urban forest data<br />
standards are also in development to aid in sharing and in<br />
the use <strong>of</strong> the programs among nations.<br />
Climate-change impacts on wildfire: Bonanza Creek engagement<br />
with fire managers and indigenous communities. Alaska is<br />
warming twice as quickly as the global average, with little<br />
change in precipitation (Chapin et al. 2006a). The resulting<br />
drying <strong>of</strong> the boreal forest has increased the annual area<br />
burned, primarily through increased frequency <strong>of</strong> dry years<br />
and larger wildfires, which have important consequences for<br />
changes in forest cover and the closely coupled human and<br />
ecological communities (figures 5 and 6; K<strong>of</strong>inas et al. 2010).<br />
Bonanza Creek scientists collaborate with fire managers and<br />
indigenous communities to share knowledge for predicting<br />
and adapting to changing fire regimes.<br />
Working with fire managers, Bonanza Creek <strong>LTER</strong> ecologists<br />
have developed predictive models that provide a scientific<br />
foundation for fire-management decisions. Spatially<br />
explicit models <strong>of</strong> climate and wildfire suggest that, by 2050,<br />
a “typical” fire year in interior Alaska will be similar to the<br />
most extreme fire years in the historical record (www.snap.<br />
uaf.edu). These models were developed through extensive<br />
input from climatologists, ecologists, and fire managers<br />
(Duffy et al. 2005).<br />
At the community level, village tribal councils have invited<br />
Bonanza Creek ecologists to collaborate in developing new<br />
ecosystem-management strategies to respond to increasing<br />
wildfire risk. These strategies include the sustainable harvest<br />
<strong>of</strong> flammable black spruce stands near communities to heat<br />
public buildings, create new jobs, and generate secondary<br />
successional habitat that favors moose—an important food<br />
source (Chapin et al. 2008, K<strong>of</strong>inas et al. 2010). Bonanza<br />
Creek social scientists and ecologists have also participated<br />
in federally mandated community wildfire protection planning<br />
by conducting interviews and focus groups among<br />
local residents and resource managers. These interviews<br />
360 BioScience • April 2012 / Vol. 62 No. 4 www.biosciencemag.org
Figure 4. Example <strong>of</strong> the user interface for i-Tree. The page shows the i-Tree canopy survey page for urban forests.<br />
demonstrated that local residents trusted managers to plan<br />
community-level wildfire protection but felt disenfranchised<br />
in regional wildfire planning for the surrounding<br />
lands, because their knowledge and concerns about future<br />
subsistence opportunities and places <strong>of</strong> cultural value were<br />
overlooked (Ray 2010).<br />
Fire-modeling results are communicated to fire managers<br />
and the public through participation in annual wildfire<br />
strategic-planning workshops, agency meetings with the<br />
public, <strong>join</strong>t agency <strong>LTER</strong> planning <strong>of</strong> prescribed burns, and<br />
production <strong>of</strong> site-specific 2-kilometer-resolution climate<br />
projections and fire-risk projections on request (www.snap.<br />
uaf.edu).<br />
Community workshops coorganized by tribal councils<br />
and Bonanza Creek ecologists allow an exchange <strong>of</strong> local,<br />
traditional, and scientific knowledge about wildfire ecology.<br />
This dialogue has enriched understanding by the <strong>LTER</strong> scientists<br />
<strong>of</strong> the ecological and societal consequences <strong>of</strong> climate<br />
change. The trust that develops through community partnerships<br />
enables Bonanza Creek researchers to learn from<br />
Articles<br />
and contribute to societal responses to a rapidly changing<br />
socioecological environment.<br />
The Bonanza Creek <strong>LTER</strong> site is forging new ground in<br />
identifying climate-change impacts that require immediate<br />
management and community action. The associated metrics<br />
<strong>of</strong> impact are therefore recent and qualitative. Judging from<br />
the ESA’s Sustainability Science Award for Chapin and colleagues’<br />
(2006b) article, in which they described the socioecological<br />
framework for this research, the Bonanza Creek<br />
<strong>LTER</strong> site is contributing to fundamental science and to new<br />
approaches for integrating community knowledge and concerns<br />
in socioecological research (figure 6). Bonanza Creek<br />
collaborations contributed to Alaska fire managers’ capacity<br />
to adapt federal guidelines on the basis <strong>of</strong> fire issues <strong>of</strong> the<br />
lower 48 US states to conditions and issues that are relevant<br />
to Alaska. Managers use the fire-risk model and routinely<br />
invite Bonanza Creek ecologists to participate in the training<br />
<strong>of</strong> wildfire managers, which indicates that they value the<br />
practical relevance <strong>of</strong> <strong>LTER</strong>. Bonanza Creek ecologists and<br />
Alaskan indigenous leaders have formed the Working Group<br />
www.biosciencemag.org April 2012 / Vol. 62 No. 4 • BioScience 361
Articles<br />
Ecoregions<br />
Subarctic<br />
tundra<br />
Arctic tundra<br />
Boreal forest<br />
Coastal rainforest<br />
on Rural Alaska Self-Reliance, a collaboration to implement<br />
community visions <strong>of</strong> adaptation to global change. This collaboration<br />
suggests that indigenous leaders value and trust<br />
their interactions with Bonanza Creek scientists.<br />
Discussion <strong>of</strong> the case studies. Boundary-spanning efforts can<br />
facilitate the bridging <strong>of</strong> science and society by producing<br />
information that is salient, credible, and legitimate (Cash<br />
et al. 2003, McNie et al. 2008), which ultimately enriches<br />
scientific research through stakeholder engagement, the<br />
expansion <strong>of</strong> public awareness, and the improvement <strong>of</strong><br />
the scientific basis for decisionmaking. The five <strong>LTER</strong> case<br />
studies presented here <strong>of</strong>fer experiences and lessons to help<br />
answer the question <strong>of</strong> what characterizes successful collaborative<br />
outreach efforts. The case studies suggest that<br />
efforts to build a stronger interface between science and<br />
society are shaped in part by three overarching attributes<br />
that pertain to all ecosystems but vary in detail among<br />
ecosystems: (1) Landscape and social context refers to the<br />
pattern <strong>of</strong> land ownership (e.g., private versus public) and<br />
the role <strong>of</strong> the different types <strong>of</strong> knowledge (e.g., local versus<br />
expert) that influence the framing <strong>of</strong> environmental issues,<br />
the management objectives, and the science used in the<br />
decisionmaking process. (2) Issue definition involves<br />
Indigenous Languages and Peoples<br />
Central Yup'ik<br />
Deg Xinag<br />
Eyak–Tlingit<br />
Tlingit<br />
determining the relevance <strong>of</strong> particular long-term research to<br />
policy and management issues at local, regional, or national<br />
scales (e.g., local fire- or fuel-management issues, regional<br />
air-quality concerns, federal forestland policy) and the extent<br />
to which individual actions or government actions are central<br />
to resolving the issues <strong>of</strong> concern. (3) Communication<br />
pathways entail understanding which communication approaches<br />
are most appropriate for specific decisionmakers,<br />
and the choice <strong>of</strong> pathway is determined in part by the<br />
context and issues addressed (e.g., direct briefings between<br />
scientists and policymakers; outreach to the media; working<br />
groups with managers; discussions with local communities,<br />
including tribes).<br />
In addition to these three overarching attributes that<br />
distinguish individual efforts, a set <strong>of</strong> common elements <strong>of</strong><br />
successful science communication efforts emerges from the<br />
case studies:<br />
In all <strong>of</strong> the case studies, boundary-spanning efforts were<br />
built on credible, multidecade, interdisciplinary science, and<br />
peer-reviewed publications. These efforts combine retrospective<br />
analysis; long-term measurements and experiments;<br />
quantitative modeling; and, increasingly, scenarios planning.<br />
For example, the ability <strong>of</strong> the HBRF Science Links projects<br />
to assess the impacts <strong>of</strong> air-quality regulations and the extent<br />
362 BioScience • April 2012 / Vol. 62 No. 4 www.biosciencemag.org<br />
Ahtna<br />
Eyak<br />
Haida<br />
Tsimshian<br />
Eskimo–Aleut Athabascan<br />
Iñupiaq<br />
Gwich'in Holikachuk<br />
Unanga{ (Aleut)<br />
Sugpiaq (Alutiiq) Dena'ina Tanacross<br />
St. Lawrence Island Yupik<br />
Hän<br />
Upper Kuskokwim<br />
Upper Tanana<br />
Lower Tanana<br />
Denaakk'e<br />
(Koyukon)<br />
Map by C. West, M. Wilson and J. Kerr - ISER<br />
Figure 5. Cultural (linguistic) groups and ecoregions are closely coupled in the boreal forest region <strong>of</strong> Alaska (Chapin<br />
2009). The Bonanza Creek Long Term Ecological Research Network site uses understanding <strong>of</strong> socioecological responses<br />
to climate change as a platform for exploring and implementing adaptation options that rural Athabascan communities<br />
would find consistent with their history and current commitment to sustainable subsistence lifestyles. Source: Reprinted<br />
from F. Stuart Chapin III, “Managing ecosystems sustainably: The key role <strong>of</strong> resilience.” Pages 29–53 in Chapin FS III,<br />
K<strong>of</strong>inas GP, Folke C, eds. Principles <strong>of</strong> Ecosystem Stewardship: Resilience-Based Natural Resource Management in a<br />
Changing World (2009), with permission from Springer.
Community concern<br />
about global change<br />
Informal<br />
input<br />
Informal dialogue<br />
<strong>LTER</strong> or community<br />
request for collaboration<br />
Tribal council approval<br />
Focus groups, interviews<br />
and knowledge sharing<br />
based on shared concerns<br />
Revisions Initial results<br />
Community review<br />
<strong>LTER</strong> interest in<br />
Socioecological change<br />
Formal<br />
input<br />
Community actions Joint publications<br />
Figure 6. Processes <strong>of</strong> interaction between the Bonanza<br />
Creek Long Term Ecological Research (<strong>LTER</strong>) Network site’s<br />
scientists and indigenous communities in sharing ecological<br />
knowledge. Informal discussions between scientists and<br />
community members lead to a formal request to the village<br />
tribal council to explore specific questions (e.g., climatechange<br />
effects on fire regime). One or more rounds <strong>of</strong><br />
interaction involving interviews or focus groups, a review<br />
<strong>of</strong> the findings by the community, and a revision based<br />
on feedback. This leads to a formal report to the village<br />
council and <strong>join</strong>t publications by scientists and community<br />
members, as well as informal input to the village council,<br />
other community members, and <strong>LTER</strong> scientists.<br />
to which ecosystems have recovered was entirely dependent<br />
on the existence <strong>of</strong> long-term precipitation, soil and stream<br />
chemistry, and relevant biological measurements. These data<br />
enabled scientists to analyze changes in atmospheric deposition<br />
and associated chemical and biological responses, to<br />
establish impact thresholds, and to apply dynamic models<br />
to evaluate the extent to which future emissions reductions<br />
would achieve policy objectives.<br />
Among the most important activities is the collaboration<br />
<strong>of</strong> scientists and decisionmakers at the outset <strong>of</strong> and<br />
throughout a research effort. This interaction helps to define<br />
issues and questions salient to decisionmakers, to identify<br />
sources <strong>of</strong> knowledge beyond traditional scientific data sets,<br />
and to envision outputs that best meet user needs. This<br />
Articles<br />
process also enriches scientific research. For example, the<br />
Bonanza Creek research framework was expanded through<br />
interactions with community groups to larger temporal and<br />
spatial scales and integration <strong>of</strong> cultural dimensions. This<br />
led to the recognition <strong>of</strong> critical thresholds <strong>of</strong> the resistance<br />
<strong>of</strong> the boreal socioecological system to climatic and socioeconomic<br />
changes.<br />
Although scientists are accustomed to publishing focused<br />
research in peer-reviewed publications, these case studies<br />
point clearly to the need for policy- and managementrelevant<br />
synthesis and distillation to support the effective<br />
use <strong>of</strong> science in the policy and management processes. This<br />
problem-oriented synthesis is necessary but not sufficient<br />
for promoting knowledge sharing and should be accompanied<br />
by work to translate the key findings into compelling<br />
terms relevant to stakeholders. For example, by pulling<br />
together disparate findings from across dozens <strong>of</strong> articles<br />
produced over a decade or more, the Harvard Forest W&W<br />
publications have drawn public and stakeholder attention to<br />
that body <strong>of</strong> work and catalyzed conservation initiatives far<br />
beyond what any single study could accomplish.<br />
Successful outreach should not be an afterthought but<br />
a major and well-funded initiative with adequate staffing<br />
and supporting expertise ranging from traditional print<br />
publications to media, including Web-based, outreach.<br />
Innovative online tools that promote interaction and social<br />
networking and that are open source and easily accessible<br />
are increasingly important communication vehicles. For<br />
example, the i-Tree project built a program interface that<br />
is easy to use, open to all, supported, and free: The i-Tree<br />
partnership has built a platform to which others can contribute,<br />
and new peer-reviewed tools can be added and<br />
then supported through the existing i-Tree partnership and<br />
model structure.<br />
Partnerships are critical to sustaining reciprocal flow <strong>of</strong><br />
information among scientists, citizen leaders, managers, and<br />
policymakers; to applying scientific findings to policy and<br />
management through an adaptive process; and to fueling<br />
processes in which stakeholder experiences and knowledge<br />
inform research. For example, the research–management<br />
partnership developed by the Andrews <strong>LTER</strong> site and the<br />
US Forest Service provides a platform for sustained, placebased<br />
learning with substantial attention to communications<br />
with many audiences. Similarly, the Baltimore <strong>LTER</strong><br />
i-Tree project also functions as a partnership that meets<br />
regularly and has open discussions, working toward meeting<br />
the needs <strong>of</strong> the urban community. In both cases, the<br />
involvement <strong>of</strong> a public entity (the US Forest Service) has<br />
been instrumental in coordinating and managing the activities<br />
<strong>of</strong> the partnerships.<br />
In addition to these lessons, the case studies presented<br />
here demonstrate the need for stronger metrics to measure<br />
the impact <strong>of</strong> science communications and outreach to<br />
decisionmakers. In general, metrics for evaluating publicengagement<br />
outreach efforts can be divided into three<br />
categories: output, uptake, and impact. The five case studies<br />
www.biosciencemag.org April 2012 / Vol. 62 No. 4 • BioScience 363
Articles<br />
present outputs such as the number <strong>of</strong> publications and<br />
presentations given to nonscientific audiences. They also<br />
provide strong evidence <strong>of</strong> uptake such as media coverage,<br />
scientific citations, and Web site visitation. Quantifying the<br />
impact on policy, conservation, and stewardship decisions<br />
remains elusive.<br />
Developing and applying meaningful metrics <strong>of</strong> impact<br />
is a common challenge. Under the auspices <strong>of</strong> the White<br />
House Office <strong>of</strong> Science and Technology Policy, the National<br />
Institutes <strong>of</strong> Health and the NSF are developing metrics <strong>of</strong><br />
impacts for science, called STAR METRICS (Science and<br />
Technology for America’s Reinvestment: Measuring the<br />
Effects <strong>of</strong> Research on Innovation, Competitiveness, and<br />
Science; Lane and Bertuzzi 2011). Several metrics have been<br />
proposed to measure the usefulness <strong>of</strong> scientific knowledge,<br />
many <strong>of</strong> which are applied in these case studies (e.g.,<br />
download or hit rates, media coverage, citations in federal<br />
or state regulations). But in the area <strong>of</strong> broader impacts or<br />
social outcomes, such as those in health, safety, and the environment,<br />
recommendations are under development by an<br />
interagency working group. Impact metrics for science are<br />
an important gap in understanding that should be remedied<br />
by the STAR METRICS program and other science-policy<br />
research efforts.<br />
Conclusions<br />
If science is to aid in the advance toward a more resilient and<br />
sustainable society, we must experiment with more effective<br />
means <strong>of</strong> integrating ecological research and decisionmaking.<br />
As is evidenced by the five case studies presented<br />
here for forest ecosystems and by many other examples,<br />
the <strong>LTER</strong> Network has an important and unique role to<br />
play in addressing the grand challenges in environmental<br />
and sustainability science. The <strong>LTER</strong> Network and associated<br />
research, with its long-term interdisciplinary focus,<br />
its focus on place-based study, its geographic distribution,<br />
its sophisticated information-management systems, and its<br />
public-outreach capabilities, are well suited to boundaryspanning<br />
initiatives that address emerging environmental<br />
issues related to changes in biogeochemistry, biological<br />
diversity, climate change, ecohydrology, infectious disease,<br />
and land use. Policy-relevant synthesis and science communication<br />
should be a focus <strong>of</strong> the <strong>LTER</strong> Network, and these<br />
activities, in turn, would probably promote cross-site and<br />
network-wide coordination <strong>of</strong> matters important to both<br />
science and society. This work could be enhanced by partnerships<br />
with established scientific societies that are dedicated<br />
to similar work. For example, the ESA is advancing a<br />
partnership among academic societies, agencies, and NGOs<br />
“to foster Earth Stewardship by (a) clarifying the science<br />
needs for understanding and shaping trajectories <strong>of</strong> change<br />
at local-to-global scales; (b) communicating the basis for<br />
Earth Stewardship to a broad range <strong>of</strong> audiences, including<br />
natural and social scientists, students, the general public,<br />
policymakers, and other practitioners; and (c) formulating<br />
pragmatic strategies that foster a more sustainable trajectory<br />
<strong>of</strong> planetary change by enhancing ecosystem resilience and<br />
human well-being” (Chapin et al. 2011, p. 45).<br />
Harnessing the power <strong>of</strong> long-term ecological studies<br />
to address the grand challenges in environmental science<br />
will require learning from and building on existing efforts<br />
to better integrate scientific research with societal concerns.<br />
The NSF can facilitate this process by expanding the<br />
bounds <strong>of</strong> informal education to include the engagement <strong>of</strong><br />
decisionmakers and journalists in order to provide the<br />
requisite research and learning needed to develop, test, and<br />
expand these critical experiments at the interface <strong>of</strong> science<br />
and society.<br />
Acknowledgments<br />
The effort and contributions <strong>of</strong> KFL were generously supported<br />
by the Bullard Fellowship program <strong>of</strong> Harvard<br />
<strong>University</strong>’s Harvard Forest and by a grant from Highstead.<br />
This is a contribution <strong>of</strong> the Long Term Ecological Research<br />
Network, which is supported by the US National Science<br />
Foundation and by the US Forest Service. We appreciate<br />
the efforts <strong>of</strong> David R. Foster in shepherding this series <strong>of</strong><br />
articles.<br />
References cited<br />
Berlik MM, Kittredge DB, Foster DR. 2002. The illusion <strong>of</strong> preservation:<br />
A global environmental argument for the local production <strong>of</strong> natural<br />
resources. Journal <strong>of</strong> Biogeography 29: 1557–1568.<br />
Cash DW, Clark WC, Alcock F, Dickson NM, Eckley N, Guston DH,<br />
Jäger J, Mitchell RB. 2003. Knowledge systems for sustainable development.<br />
Proceedings <strong>of</strong> the National Academy <strong>of</strong> Sciences 100:<br />
8086–8091.<br />
Chapin FS III. 2009. Managing ecosystems sustainably: The key role <strong>of</strong><br />
resilience. Pages 29–53 in Chapin FS III, K<strong>of</strong>inas GP, Folke C, eds.<br />
Principles <strong>of</strong> Ecosystem Stewardship: Resilience-Based Natural Resource<br />
Management in a Changing World. Springer.<br />
Chapin FS III, Oswood MW, Van Cleve K, Viereck LA, Verbyla DL, eds.<br />
2006a. Alaska’s Changing Boreal Forest. Oxford <strong>University</strong> Press.<br />
Chapin FS III, Lovecraft AL, Zavaleta ES, Nelson J, Robards MD, K<strong>of</strong>inas<br />
GP, Trainor SF, Peterson GD, Huntington HP, Naylor RL. 2006b. Policy<br />
strategies to address sustainability <strong>of</strong> Alaskan boreal forests in response<br />
to a directionally changing climate. Proceedings <strong>of</strong> the National<br />
Academy <strong>of</strong> Sciences 103: 16637–16643.<br />
Chapin FS III, et al. 2008. Increasing wildfire in Alaska’s boreal forest:<br />
Pathways to potential solutions <strong>of</strong> a wicked problem. BioScience 58:<br />
531–540.<br />
Chapin FS III, Pickett STA, Power ME, Jackson RB, Carter DM, Duke C.<br />
2011. Earth stewardship: A strategy for social-ecological transformation<br />
to reverse planetary degradation. Journal <strong>of</strong> Environmental Studies and<br />
Sciences 1: 44–53.<br />
Cissel JH, Swanson FJ, Weisberg PJ. 1999. Landscape management using<br />
historical fire regimes: Blue River, Oregon. Ecological Applications 9:<br />
1217–1231.<br />
D’Amato AW, Orwig DA, Foster DR. 2006. New estimates <strong>of</strong> Massachusetts<br />
old-growth forests: Useful data for regional conservation and forest<br />
reserve planning. Northeastern Naturalist 13: 495–506.<br />
Driscoll CT, Lawrence GB, Bulger AJ, Butler TJ, Cronan CS, Eagar C,<br />
Lambert KF, Likens GE, Stoddard JL, Weathers KC. 2001. Acidic deposition<br />
in the northeastern United States: Sources and inputs, ecosystem<br />
effects, and management strategies. BioScience 51: 180–198.<br />
Driscoll CT, Cowling EB, Grennfelt P, Galloway JM, Dennis RL. 2010.<br />
Integrated assessment <strong>of</strong> ecosystem effects <strong>of</strong> atmospheric deposition:<br />
Lessons available to be learned. EM Magazine November 2010: 6–13.<br />
364 BioScience • April 2012 / Vol. 62 No. 4 www.biosciencemag.org
Driscoll CT, Lambert KF, Weathers KC. 2011. Integrating science and policy:<br />
A case study <strong>of</strong> the Hubbard Brook Research Foundation Science Links<br />
program. BioScience 61: 791–801.<br />
Duffy PA, Walsh JE, Graham JM, Mann DH, Rupp TS. 2005. Impacts <strong>of</strong><br />
large-scale atmospheric–ocean variability on Alaskan fire season severity.<br />
Ecological Applications 15: 1317–1330.<br />
[FEMAT] Forest Ecosystem Management Assessment Team. 1993.<br />
Forest Ecosystem Management: An Ecological, Economic, and Social<br />
Assessment. US Department <strong>of</strong> Agriculture Forest Service.<br />
Fisher RT. 1921. The management <strong>of</strong> the Harvard Forest, 1909–1919.<br />
Harvard Forest Bulletin 1: 1–27. (18 January 2012; http://harvardforest.<br />
fas.harvard.edu/publications/pdfs/HFpubs/b1.pdf )<br />
———. 1933. New England forests: Biological factors. Pages 213–223 in<br />
Wood W, ed. New England’s Prospect. American Geographical Society.<br />
Special Publication no. 16.<br />
Forsman ED, Meslow EC, Wight HM. 1984. Distribution and <strong>biology</strong> <strong>of</strong> the<br />
spotted owl in Oregon. Wildlife Monographs no. 87: 3–64.<br />
Foster DR. 2000. From bobolinks to bears: Interjecting geographical history<br />
into ecological studies, environmental interpretation, and conservation<br />
planning. Journal <strong>of</strong> Biogeography 27: 27–30.<br />
Foster DR, Orwig DA. 2006. Preemptive and salvage harvesting <strong>of</strong> New<br />
England forests: When doing nothing is a viable alternative. Conservation<br />
Biology 20: 959–970.<br />
Foster DR, Aber JD, Melillo JM, Bowden RD, Bazazz FA. 1997. Forest<br />
response to disturbance and anthropogenic stress: Rethinking the 1938<br />
hurricane and the impact <strong>of</strong> physical disturbance vs. chemical and<br />
climate stress on forest ecosystems. BioScience 47: 437–445.<br />
Foster D[R], Kittredge D[B], Donahue B, Motzkin G, Orwig D[A], Ellison<br />
AM, Hall B, Colburn EA, D’Amato A. 2005. Wildlands and Woodlands:<br />
A Vision for the Forests <strong>of</strong> Massachusetts. Harvard <strong>University</strong>, Harvard<br />
Forest.<br />
Foster DR, Aber JD, Cogbill CV. 2010. Wildlands and Woodlands: A Vision<br />
for the New England Landscape. Harvard <strong>University</strong>, Harvard Forest.<br />
Franklin JF, Cromack K Jr, Denison W, McKee A, Maser C, Sedell J, Swanson<br />
F, Juday G. 1981. Ecological characteristics <strong>of</strong> old-growth Douglas-fir<br />
forests. US Department <strong>of</strong> Agriculture, Forest Service, Pacific Northwest<br />
Forest and Range Experiment Station. General Technical Report<br />
no. PNW-GTR-118.<br />
Golodetz AD, Foster DR. 1997. History and importance <strong>of</strong> land use and<br />
protection in the North Quabbin Region <strong>of</strong> Massachusetts (USA).<br />
Conservation Biology 11: 227–235.<br />
Gregory SV, Swanson FJ, Mckee WA, Cummins KW. 1991. An ecosystem<br />
perspective <strong>of</strong> riparian zones. BioScience 41: 540–551.<br />
Hall B, Motzkin G, Foster DR, Syfert M, Burk J. 2002. Three hundred<br />
years <strong>of</strong> forest and land-use change in Massachusetts, USA. Journal <strong>of</strong><br />
Biogeography 29: 1319–1335.<br />
Halpern CB, Haugo RD, Antos JA, Kaas SS, Kilanowski AL. 2012.<br />
Grassland restoration with and without fire: Evidence from a<br />
tree-removal experiment. Ecological Applications. Forthcoming.<br />
doi:10.1890/11-1061.1<br />
Harmon ME, et al. 1986. Ecology <strong>of</strong> coarse woody debris in temperate<br />
ecosystems. Pages 133–302 in MacFadyen A, Ford ED, eds. Advances in<br />
Ecological Research, vol. 15. Academic Press.<br />
Hyde G. 2009. President’s message. City Trees: Journal <strong>of</strong> the Society <strong>of</strong><br />
Municipal Arborists 45 (6): 5.<br />
Ibrahim M. 2009. US benefit analysis snared over $220m for trees.<br />
Horticulture Week 01 October 2009. (18 January 2012; www.hortweek.<br />
com/news/942310).<br />
Jones JA. 2000. Hydrologic processes and peak discharge response to forest<br />
removal, regrowth, and roads in 10 small experimental basins, western<br />
Cascades, Oregon. Water Resources Research 36: 2621–2642.<br />
Jones JA, Swanson FJ, Wemple BC, Snyder KU. 2000. Effects <strong>of</strong> roads on<br />
hydrology, geomorphology, and disturbance patches in stream networks.<br />
Conservation Biology 14: 76–85.<br />
Kittredge DB, Finley AO, Foster DR. 2003. Timber harvesting as ongoing<br />
disturbance in a landscape <strong>of</strong> diverse ownership. Forest Ecology and<br />
Management 180: 425–442.<br />
Articles<br />
Kizlinski ML, Orwig DA, Cobb RC, Foster DR. 2002. Direct and indirect<br />
ecosystem consequences <strong>of</strong> an invasive pest on forests dominated by<br />
eastern hemlock. Journal <strong>of</strong> Biogeography 29: 1489–1503.<br />
Knapp AK, et al. 2012. Past, present, and future roles <strong>of</strong> long-term experiments<br />
in the <strong>LTER</strong> network. BioScience 62: 377–389.<br />
K<strong>of</strong>inas GP, Chapin FS [III], BurnSilver S, Schmidt JI, Fresco NL, Kielland<br />
K, Martin S, Springsteen A, Rupp TS. 2010. Resilience <strong>of</strong> Athabascan<br />
subsistence systems to interior Alaska’s changing climate. Canadian<br />
Journal <strong>of</strong> Forest Research 40: 1347–1359.<br />
Lach D, List P, Steel B, Shindler B. 2003. Advocacy and credibility <strong>of</strong> ecological<br />
scientists in resource decisionmaking: A regional study. BioScience<br />
53: 170–178.<br />
Lane J, Bertuzzi S. 2011. Measuring the results <strong>of</strong> science investments.<br />
Science 331: 678–680.<br />
Levitt JN, Lambert KF. 2006. Report on the Woodlands and Wildlands<br />
Conservation Finance Roundtable. Harvard <strong>University</strong>, Harvard<br />
Forest.<br />
Lovett GM, Burns DA, Driscoll CT, Jenkins JC, Mitchell MJ, Rustad L,<br />
Shanley JB, Likens GE, Haeuber R. 2007. Who needs environmental<br />
monitoring? Frontiers in Ecology and the Environment 5:<br />
253–260.<br />
[<strong>LTER</strong> Network] Long Term Ecological Research Network. 2010a. <strong>LTER</strong><br />
Strategic Communication Plan: Bridging to Broader Audiences. <strong>LTER</strong><br />
Network. (8 February 2012; http://intranet2.lternet.edu/sites/intranet2.<br />
lternet.edu/files/documents/<strong>LTER</strong>%20History/Planning%20Documents/<br />
Final%20<strong>LTER</strong>%20Strategic%20Communication%20Plan%20-%20<br />
Nov%2011%202010.pdf )<br />
———. 2010b. Strategic and Implementation Plan. <strong>LTER</strong> Network.<br />
(18 January 2012; http://intranet2.lternet.edu/documents/lter-strategicand-implementation-plan)<br />
Lubchenco J. 1998. Entering the century <strong>of</strong> the environment: A new social<br />
contract for science. Science 279: 491–497.<br />
Mayer AL, Kauppi PE, Angelstam PK, Zhang Y, Tikka PM. 2005. Importing<br />
timber, exporting ecological impact. Science 308: 359–360.<br />
McDonald RI, Motzkin G, Foster DR. 2008. The effect <strong>of</strong> logging on<br />
vegetation composition in western Massachusetts. Forest Ecology and<br />
Management 255: 4021–4031.<br />
McNeil J, Vava C. 2006. Oakville’s urban forest: Our solution to our<br />
pollution. Town <strong>of</strong> Oakville, Parks and Open Space Department,<br />
Forestry Section. (8 February 2012; www.itreetools.org/resources/reports/<br />
Oakville%27s%20Urban%20Forest.pdf )<br />
McNie EC, van Noordwijk M, Clark WC, Dickson NM, Sakuntaladewi<br />
N, Suyanto JL, Joshi L, Leimona B, Hairiah K, Khususiyah N. 2008.<br />
Boundary Organizations, Objects and Agents: Linking Knowledge<br />
with Action in Agr<strong>of</strong>orestry Watersheds. Center for International<br />
Development at Harvard <strong>University</strong> and World Agr<strong>of</strong>orestry Centre.<br />
Working Paper no. 80.<br />
Nowak DJ, Crane DE. 2000. The Urban Forest Effects (UFORE) Model:<br />
Quantifying urban forest structure and functions. Pages 714–720<br />
in Hansen M, Burk T, eds. Integrated Tools for Natural Resources<br />
Inventories in the 21st Century. US Department <strong>of</strong> Agriculture, Forest<br />
Service, North Central Research Station. General Technical Report<br />
no. NC-212.<br />
Nowak DJ, Kurodo M, Crane DE. 2004. Urban tree mortality rates and tree<br />
population projections in Baltimore, Maryland, USA. Urban Forestry<br />
and Urban Greening 2: 139–147.<br />
Nowak DJ, Crane DE, Stevens JC, Hoehn RE, Walton JT, Bond J. 2008.<br />
A ground-based method <strong>of</strong> assessing urban forest structure and ecosystem<br />
services. Arboriculture and Urban Forestry 34: 347–358.<br />
Nudel M. 2003. Better conservation through partnerships. Exchange:<br />
Journal <strong>of</strong> the Land Trust Alliance 22: 17–21.<br />
Orwig DA, Cogbill CV, Foster DR, O’Keefe JF. 2001. Variations in oldgrowth<br />
structure and definitions: Forest dynamics on Wachusett<br />
Mountain, Massachusetts. Ecological Applications 11: 437–452.<br />
Pickett STA, Cadenasso ML. 2006. Advancing urban ecological studies:<br />
Frameworks, concepts, and results from the Baltimore Ecosystem Study.<br />
Austral Ecology 31: 114–125.<br />
www.biosciencemag.org April 2012 / Vol. 62 No. 4 • BioScience 365
Articles<br />
Ray L. 2010. Can Community-Based Natural Resource Management<br />
Improve Wildfire Policy Planning in Interior Alaska? Addressing Value<br />
Differences, Ineffective Participatory Processes, and Conflicts over<br />
Traditional Ecological Knowledge. Doctoral Dissertation. Department<br />
<strong>of</strong> Geography. Clark <strong>University</strong>, Worcester, Massachusetts.<br />
Shindler B, Mallon AL. 2009. Public Acceptance <strong>of</strong> Disturbance-Based<br />
Forest Management: A Study <strong>of</strong> the Blue River Landscape Strategy<br />
in the Central Cascades Adaptive Management Area. US Department<br />
<strong>of</strong> Agriculture, Forest Service, Pacific Northwest Research Station.<br />
Research Paper no. PNW-RP-581.<br />
Siyver D. 2009. Milwaukee UFORE: Taking it to the streets. City Trees:<br />
Journal <strong>of</strong> the Society <strong>of</strong> Municipal Arborists 45 (5): 10–12.<br />
Society <strong>of</strong> Municipal Arborists. 2008. More than cows and cowboys: Urban<br />
forestry in Casper, Wyoming. City Trees: Journal <strong>of</strong> the Society <strong>of</strong><br />
Municipal Arborists Sept/Oct: 44(5): 6–10.<br />
Spies TA, Duncan SL, eds. 2009. Old Growth in a New World: A Pacific<br />
Northwest Icon Reexamined. Island Press.<br />
Spies TA, Giesen TW, Swanson FJ, Franklin JF, Lach D, Johnson KN. 2010.<br />
Climate change adaptation strategies for federal forests <strong>of</strong> the Pacific<br />
Northwest, USA: Ecological, policy, and socio-economic perspectives.<br />
Landscape Ecology 25: 1185–1199.<br />
BRINGING<br />
BIOLOGY<br />
JOIN<br />
AIBS<br />
www.aibs.org<br />
AIBS INDIVIDUAL MEMBERS<br />
RECEIVE PRINT AND/OR<br />
ELECTRONIC ACCESS<br />
TO BIOSCIENCE. AIBS<br />
ORGANIZATIONAL MEMBERS<br />
PARTICIPATE IN THE NATIONAL<br />
DIALOGUE ABOUT HOW TO<br />
ENSURE A BRIGHT FUTURE<br />
FOR BIOLOGY.<br />
Thompson JR, Wiek A, Swanson FJ, Carpenter SR, Fresco N, Hollingsworth<br />
T, Spies TA, Foster DR. 2012. Scenario studies as a synthetic and integrative<br />
research activity for long-term ecological research. BioScience<br />
62: 367–376.<br />
[USDA and USDI] US Department <strong>of</strong> Agriculture, US Department <strong>of</strong> the<br />
Interior. 1994. Record <strong>of</strong> Decision for Amendments to Forest Service<br />
and Bureau <strong>of</strong> Land Management Planning Documents within the<br />
Range <strong>of</strong> the Northern Spotted Owl. USDA Forest Service.<br />
Charles T. Driscoll (ctdrisco@syr.edu) is affiliated with the Department <strong>of</strong><br />
Civil and Environmental Engineering at Syracuse <strong>University</strong>, in New York.<br />
Kathleen F. Lambert and Clarisse M. Hart are affiliated with Harvard <strong>University</strong>’s<br />
Harvard Forest, in Petersham, Massachusetts. F. Stuart Chapin III is<br />
affiliated with the Institute <strong>of</strong> Arctic Biology at the <strong>University</strong> <strong>of</strong> Alaska, Fairbanks.<br />
David J. Nowak is affiliated with the US Department <strong>of</strong> Agriculture,<br />
Forest Service, Northern Research Station, in Syracuse, New York. Thomas A.<br />
Spies and Frederick J. Swanson are affiliated with the US Forest Service, Pacific<br />
Northwest Research Station, in Corvallis, Oregon. David B. Kittredge, Jr., is<br />
affiliated with the Department <strong>of</strong> Environmental Conservation at the <strong>University</strong><br />
<strong>of</strong> Massachusetts–Amherst.<br />
TO INFORMED<br />
DECISION<br />
MAKING<br />
JOIN THE<br />
COMMUNITY...<br />
As an umbrella organization<br />
AIBS works with biologists and<br />
their pr<strong>of</strong>essional organizations,<br />
to ensure that reliable<br />
information is used when<br />
decisions are made–in public<br />
policy, research funding, and<br />
the public forum.<br />
To learn more about our<br />
impact and to <strong>join</strong> AIBS, visit<br />
www.aibs.org.<br />
1900 CAMPUS COMMONS DR.<br />
STE 200<br />
RESTON, VA 20191<br />
WWW.AIBS.ORG<br />
366 BioScience • April 2012 / Vol. 62 No. 4 www.biosciencemag.org
Articles<br />
Scenario Studies as a Synthetic and<br />
Integrative Research Activity for<br />
Long-Term Ecological Research<br />
Jonathan R. thompson, aRnim Wiek, FRedeRick J. sWanson, stephen R. caRpenteR, nancy FResco,<br />
teResa hollingsWoRth, thomas a. spies, and david R. FosteR<br />
Scenario studies have emerged as a powerful approach for synthesizing diverse forms <strong>of</strong> research and for articulating and evaluating alternative<br />
socioecological futures. Unlike predictive modeling, scenarios do not attempt to forecast the precise or probable state <strong>of</strong> any variable at a given<br />
point in the future. Instead, comparisons among a set <strong>of</strong> contrasting scenarios are used to understand the systemic relationships and dynamics<br />
<strong>of</strong> complex socioecological systems and to define a range <strong>of</strong> possibilities and uncertainties in quantitative and qualitative terms. We describe five<br />
examples <strong>of</strong> scenario studies affiliated with the US Long Term Ecological Research (<strong>LTER</strong>) Network and evaluate them in terms <strong>of</strong> their ability<br />
to advance the <strong>LTER</strong> Network’s capacity for conducting science, promoting social and ecological science synthesis, and increasing the saliency <strong>of</strong><br />
research through sustained outreach activities. We conclude with an argument that scenario studies should be advanced programmatically within<br />
large socioecological research programs to encourage prescient thinking in an era <strong>of</strong> unprecedented global change.<br />
Keywords: socioecological systems, science synthesis, participatory engagement, futures<br />
Public investment in science increasingly comes with the<br />
expectation that research will address the complex<br />
challenges that society faces and will contribute to strategies<br />
that sustain the vitality and integrity <strong>of</strong> socioecological<br />
systems (Reid et al. 2010). During the past 30 years, as the<br />
US National Science Foundation (NSF)–sponsored Long<br />
Term Ecological Research (<strong>LTER</strong>) Network has grown from<br />
6 to 26 research sites, ranging from Alaska to Antarctica and<br />
from urban ecosystems to forests to coral reefs. The <strong>LTER</strong><br />
Network has increasingly used innovative approaches to<br />
connect science to society: from direct engagement with<br />
policymakers to educational programs in public schools<br />
and s<strong>of</strong>tware applications that inform the public about the<br />
structure, function, and state <strong>of</strong> socioecological systems<br />
(Bestelmeyer et al. 2005, Driscoll et al. 2012 [in this issue],<br />
Robertson et al. 2012 [in this issue]). Scenario studies are<br />
one such approach and are emerging as a powerful tool for<br />
synthesizing the results <strong>of</strong> <strong>LTER</strong> science and for engaging<br />
with stakeholders to consider socioecological futures. There<br />
is a rich history involving the use <strong>of</strong> scenarios to encourage<br />
prescient thinking, largely born out <strong>of</strong> military and corporate<br />
planning (Kahn 1962, Wack 1985). Scenarios <strong>of</strong>fer a<br />
framework for practitioners to integrate diverse modes <strong>of</strong><br />
knowledge and to explicitly recognize those components<br />
<strong>of</strong> complex systems that are understood and those that are<br />
uncertain. In this way, scenario studies can describe multiple<br />
ways in which our shared socioecological future may unfold,<br />
sometimes including a visioning process that is focused on<br />
the specific attributes <strong>of</strong> one preferred future condition.<br />
Although the first type <strong>of</strong> scenario studies yield impartial<br />
descriptions <strong>of</strong> a range <strong>of</strong> possible future states, visioning<br />
describes desirable future states (or visions)—for instance,<br />
according to sustainability principles or stakeholder agreement<br />
(Swart et al. 2004, Carpenter and Folke 2006, Weaver<br />
and Rotmans 2006). Both types <strong>of</strong> scenario are contrasted<br />
with probability-based approaches to forward-looking<br />
research below.<br />
We refer here to scenario studies in general as any strategy<br />
for describing plausible future conditions while explicitly<br />
incorporating relevant science, societal expectations, and<br />
internally consistent assumptions about major drivers, relationships,<br />
and constraints (Xiang and Clarke 2003, Iverson<br />
Nassauer and Corry 2004, Raskin et al. 2005, Bolte et al. 2007,<br />
Mahmoud et al. 2009). Unlike predictive modeling, scenario<br />
studies acknowledge the uncertainty inherent in socioecological<br />
systems and therefore do not attempt to forecast the<br />
precise or probable state <strong>of</strong> any variable at a given point in<br />
the future. Instead, comparisons among a set <strong>of</strong> contrasting<br />
scenarios are used to understand the systemic interrelation<br />
and dynamics <strong>of</strong> complex socioecological systems<br />
BioScience 62: 367–376. ISSN 0006-3568, electronic ISSN 1525-3244. © 2012 by American Institute <strong>of</strong> Biological Sciences. All rights reserved. Request<br />
permission to photocopy or reproduce article content at the <strong>University</strong> <strong>of</strong> California Press’s Rights and Permissions Web site at www.ucpressjournals.com/<br />
reprintinfo.asp. doi:10.1525/bio.2012.62.4.8<br />
www.biosciencemag.org April 2012 / Vol. 62 No. 4 • BioScience 367
Articles<br />
and to define a range <strong>of</strong> possibilities and uncertainties in<br />
quantitative and qualitative terms. The value <strong>of</strong> scenario<br />
studies lies in the process <strong>of</strong> embedding alternative states <strong>of</strong><br />
the future into a transparent problem-solving framework<br />
(Swart et al. 2004). In this way, scenario studies may help<br />
to anticipate change in systems characterized by high levels<br />
<strong>of</strong> irreducible uncertainty and low levels <strong>of</strong> controllability<br />
(Bennett et al. 2003, Peterson et al. 2003a) and evoke new<br />
integrative perspectives and novel concepts <strong>of</strong> ecological<br />
change (Carpenter and Folke 2006, Carpenter et al. 2006).<br />
Although environmental scenarios are developed for a wide<br />
range <strong>of</strong> specific purposes, scenario studies can serve three<br />
widely accepted functions: education and public information,<br />
scientific exploration, and decision support and strategic<br />
planning (Alcamo and Henricks 2008, Henrichs et al.<br />
2010).<br />
In many large science- and environmental-assessment<br />
programs, scenarios have been used to describe and underpin<br />
analyses <strong>of</strong> alternative futures. The Intergovernmental<br />
Panel on Climate Change’s (IPCC) emission scenarios<br />
(Naki enovi and Swart 2000) and the Millennium Ecosystem<br />
Assessment’s scenarios (MA 2005) are perhaps the most well<br />
known, but there are many others (e.g., Sala et al. 2000,<br />
Raskin et al. 2005). Several <strong>LTER</strong> sites, for example, are<br />
deeply involved in scenario studies and even more plan to<br />
be. A recent <strong>LTER</strong> Network–sponsored workshop brought<br />
together 32 social and ecological researchers representing<br />
16 <strong>LTER</strong> sites from around the United States that were<br />
actively engaged in some aspect <strong>of</strong> scenario studies for the<br />
region surrounding their sites (Thompson and Foster 2009).<br />
The participants reaffirmed what may seem self-evident:<br />
<strong>LTER</strong>-based science has several characteristics amenable<br />
to developing regional socioecological scenarios. Credible<br />
socioecological scenarios require a deep understanding <strong>of</strong><br />
long-term environmental dynamics—a signature strength<br />
<strong>of</strong> <strong>LTER</strong> science—and a tight coupling <strong>of</strong> ecological and<br />
social research—an emerging strength <strong>of</strong> and direction for<br />
the <strong>LTER</strong> Network (Collins et al. 2011, Robertson et al. 2012<br />
[this issue]).<br />
Looking forward to the next 30 years <strong>of</strong> <strong>LTER</strong>—and,<br />
more generally, to other research programs concerned<br />
with understanding socioecological systems—we argue<br />
that the application <strong>of</strong> scenario studies can advance prescient<br />
thinking in an era <strong>of</strong> unprecedented rates <strong>of</strong> global<br />
change. For example, an overarching goal set forth in the<br />
<strong>LTER</strong> Network’s Strategic and Implementation Plan is to<br />
use its deep understanding <strong>of</strong> complex socioecological systems<br />
to help anticipate ecological, evolutionary, and social<br />
responses to future environmental change and to inform<br />
societal strategies to adapt to this change (<strong>LTER</strong> Network<br />
2011). This aligns seamlessly with the primary functions <strong>of</strong><br />
scenario studies (i.e., underpinning decision processes, collaborative<br />
learning, and scientific exploration). More specifically,<br />
scenarios can enable site-based research programs to<br />
explore possible as well as desirable and sustainable future<br />
states <strong>of</strong> their respective regions. And through sustained<br />
partnerships with land managers, policymakers, and other<br />
stakeholders, participatory scenarios can increase the societal<br />
relevance <strong>of</strong> their research. Moreover, in scenario studies<br />
in which the socioecological future <strong>of</strong> their regions is<br />
formally considered, new research needs can be identified<br />
while research in temporal and spatial dimensions is scaled<br />
up. Finally, developing and analyzing future scenarios<br />
would provide a platform for working with many scientific<br />
networks, including the National Ecological Observatory<br />
Network (NEON) and Urban Long Term Research Areas<br />
(ULTRA).<br />
Driscoll and colleagues (2012) explore the novel ways in<br />
which scientists have delivered their research findings to<br />
policymakers and managers where they can inform decisions.<br />
They describe several important communications<br />
approaches that allow new science to span boundaries and<br />
to address new challenges. In the present article, we examine<br />
scenario studies as one such boundary-spanning approach,<br />
using several examples <strong>of</strong> scenario studies from <strong>LTER</strong> sites<br />
in order to identify approaches that may be more broadly<br />
applicable. More specifically, we evaluate one emerging and<br />
four mature scenario studies in terms <strong>of</strong> three questions that<br />
address the value <strong>of</strong> scenarios for advancing socioecological<br />
science, programs, and outreach:<br />
A science question: How do the scenario studies relate the past to<br />
the future? Related to this question are those <strong>of</strong> what attributes<br />
<strong>of</strong> the socioecological system will change a lot, what<br />
attributes will change a little, and why. To articulate a range<br />
<strong>of</strong> alternative futures in a plausible and credible manner, it is<br />
necessary to understand the relevant history and trajectory<br />
<strong>of</strong> environmental and social change <strong>of</strong> the system <strong>of</strong> interest<br />
and its component parts. Evaluating future scenarios in<br />
light <strong>of</strong> recent changes, then, leads to an understanding <strong>of</strong><br />
system attributes that are more or less resilient or vulnerable<br />
to future change. This feature <strong>of</strong> scenario studies is especially<br />
valuable as socioecological change approaches “tipping<br />
points” and the need to anticipate and mitigate future<br />
change becomes acute (Scheffer et al. 2001, Rockström et al.<br />
2009).<br />
A programmatic question: How do the scenario studies relate to the<br />
more traditional long-term science occurring within <strong>LTER</strong>? Related<br />
to this question is how they can advance science synthesis.<br />
Scenarios take many forms and, as is shown below, they may<br />
have narrow or expansive thematic scope. But in all the case<br />
studies, scenarios are either informed by or are used as a<br />
platform for applying the core long-term research coming<br />
from the individual <strong>LTER</strong> sites. Consequently, scenarios can<br />
be a compelling approach to science synthesis and for crosssite<br />
comparative analyses.<br />
An outreach question: How do the scenario studies affect the<br />
region and regional society through real-world changes or capacity<br />
building? Future scenarios draw together stakeholders<br />
affected by the hypothesized future changes. By engaging<br />
368 BioScience • April 2012 / Vol. 62 No. 4 www.biosciencemag.org
in scenario studies, scientists can place themselves in a new<br />
relationship with society. It can be a means for linking<br />
science and decisionmaking in order to support future<br />
and hopefully sustainable trajectories for socioecological<br />
systems, whether they are wild landscapes, natural resource<br />
lands, or urban areas.<br />
Case studies<br />
The case studies showcase diverse ways in which scenario<br />
studies are being employed as a vehicle to understand<br />
the drivers <strong>of</strong> socioecological change, to engage with<br />
regional stakeholders, and to consider shared socioecological<br />
futures. Each is distinct in its motivation, methodology,<br />
and outcomes. To provide a consistent organization for<br />
evaluation, we describe each using a seven-part conceptual<br />
framework (figure 1, table 1) that includes (1) a trigger<br />
or context (i.e., what precipitated the study and in what<br />
environment [e.g., academic, pr<strong>of</strong>essional] it occured), (2) a<br />
goal (i.e., what the leaders and participants in the scenario<br />
study hoped to achieve), (3) construction or methodology<br />
(i.e., what scenario construction method was used), (4) collaboration<br />
(i.e., who was involved in scenario development<br />
[e.g., regional or national stakeholders, experts]), (5) scenarios<br />
(i.e., what scenarios [i.e., topics] were generated and<br />
what the mode or representation [e.g., narratives, visuals,<br />
maps] was), (6) use (i.e., in what ways the scenarios<br />
were used after they were completed [e.g., research, planning<br />
and decisionmaking, education and training]), and<br />
(7) impacts (i.e., what social impacts the application <strong>of</strong> the<br />
scenarios yielded [e.g., it improved the network, influenced<br />
policy decisions, changed pr<strong>of</strong>essional practice, or increased<br />
capacity]).<br />
Figure 1. Analytical framework for evaluating diverse forms <strong>of</strong> scenario studies<br />
conducted throughout the US Long Term Ecological Research Network.<br />
Articles<br />
Northern Highlands Lake District scenarios: The North Temperate<br />
Lakes <strong>LTER</strong> site. The Northern Highlands Lake District<br />
(NHLD) is located in northern Wisconsin. During the past<br />
several decades, the population <strong>of</strong> the region has expanded<br />
significantly, which has resulted in the construction <strong>of</strong> new<br />
housing and infrastructure and a marked increase in tourism<br />
and recreation, which are important components <strong>of</strong><br />
the region’s economy (Peterson et al. 2003b). These developments<br />
have placed additional pressure on the lakes and<br />
surrounding forests, which has caused concern about the<br />
long-term sustainability <strong>of</strong> these resources and the economic<br />
activity they support. Partially on the basis <strong>of</strong> the social-<br />
and natural-science infrastructure developed by scientists<br />
at the North Temperate Lakes (NTL) <strong>LTER</strong> site, the NHLD<br />
was selected as one <strong>of</strong> a few pilot study regions for the<br />
Millennium Ecosystem Assessment Scenarios Working<br />
Group (Carpenter 2008). Participants in the working group<br />
were drawn from local businesses, nongovernmental organizations<br />
(NGOs), tribal organizations, and government, as<br />
well as technical experts from the NTL, to engage in wideranging<br />
conversations about the vulnerabilities and potential<br />
strengths <strong>of</strong> the region, as well as the fears and hopes for<br />
the landscape’s future. Through an iterative process, facilitators<br />
distilled diverse storylines into four composite scenarios<br />
that portrayed alternative drivers <strong>of</strong> change over the<br />
coming 25 years. They commissioned an artist to develop<br />
illustrations for the storylines and allowed the stakeholders<br />
to refine the scenarios. The four scenarios represented very<br />
different pathways that the NHLD might follow with regard<br />
to future population trends, zoning requirements, and recreation<br />
policies. They were designed to be internally coherent,<br />
logically consistent, and plausible. In this way, it was possible<br />
to explore each scenario individually,<br />
as well as the similarities<br />
and differences among them.<br />
The scenarios were presented as<br />
illustrated stories in a short book<br />
and on a Web site. After the scenarios<br />
were settled, simulation<br />
modeling was begun in order<br />
to couple the qualitative stories<br />
to the anticipated quantitative<br />
changes in ecological systems.<br />
Together, the scenarios and outputs<br />
from simulations were used<br />
to spark conversations about the<br />
future in meetings with individual<br />
decisionmakers, in large<br />
public meetings, and in online<br />
forums. The facilitators also ran<br />
an online survey to gather public<br />
reactions to the scenarios. In<br />
subsequent years, the scenarios<br />
have been used in several university<br />
classes through role-playing<br />
adaptive-management games.<br />
www.biosciencemag.org April 2012 / Vol. 62 No. 4 • BioScience 369
Articles<br />
Table 1. Features <strong>of</strong> the US Long Term Ecological Research (<strong>LTER</strong>) Network sites and their associated projects discussed in this article.<br />
Scenarios: topic (1)<br />
and format (2) Uses Impacts<br />
Method (1) and<br />
steps (2) Collaboration<br />
Triggers and<br />
context Goals<br />
Project Title, <strong>LTER</strong> site, space,<br />
and record length<br />
1. Increased network<br />
2. Influenced policy<br />
choices<br />
3. Increased<br />
outreach capacity<br />
<strong>of</strong> NTL<br />
1. Role-playing<br />
adaptive-management<br />
games<br />
2. Simulation models<br />
1. Landscape change<br />
2. Narratives (stories);<br />
artistic renditions;<br />
book; Web page<br />
Input from<br />
regional<br />
stakeholders<br />
1. Workshops<br />
2. Iteratively<br />
review scenarios<br />
and combine<br />
scenario elements<br />
1. Create contrasting<br />
scenarios<br />
2. Stakeholder<br />
outreach and<br />
collaborative learning<br />
3. Provide input for<br />
<strong>LTER</strong><br />
1. Academic<br />
2. Pilot scenario<br />
study for Millennium<br />
Ecosystem<br />
Assessment<br />
Northern Highlands Lake District<br />
<strong>LTER</strong> site: North Temperate<br />
Lakes (NTL)<br />
Space: 5300 square kilometers<br />
(km2 )<br />
Time: 25 years forward<br />
1. Influenced forest<br />
practices in North<br />
America<br />
1. Development <strong>of</strong><br />
forest management<br />
plan<br />
2. Begin plan<br />
implementation<br />
3. Public<br />
demonstration project<br />
1. Forest landscape<br />
structure and function<br />
under alternative<br />
disturbance regimes<br />
2. Narratives<br />
(technical); maps;<br />
report<br />
Research-<br />
Forest<br />
Service<br />
managers<br />
collaboration<br />
1. Assess fire<br />
history<br />
2. Write<br />
alternative<br />
scenarios<br />
3. Formally<br />
analyze<br />
4. Elicit feedback<br />
1. Create contrasting<br />
scenarios<br />
2. Test history as<br />
management guide<br />
3. Provide input for<br />
management and policy<br />
1. Pr<strong>of</strong>essional<br />
(forest planning)<br />
2. Alternative forest<br />
management<br />
Blue River Landscape Plan and<br />
Study<br />
<strong>LTER</strong> site: Andrews Forest (AND)<br />
Space: 23 km2 Time: 500 years back<br />
200 years forward<br />
1. Incorporated into<br />
general plan<br />
2. Influenced<br />
policies<br />
3. Built planners and<br />
citizens’ capacity<br />
1. Revision <strong>of</strong><br />
general plan<br />
2. Pr<strong>of</strong>essional<br />
training, fundraising<br />
3. Primary and<br />
university classes<br />
1. Urban development<br />
(economy,<br />
environment, society,<br />
infrastructure)<br />
2. Narratives<br />
(technical, stories);<br />
illustrations; graphs;<br />
report<br />
Input from<br />
regional<br />
stakeholders<br />
1. Review<br />
scenario literature<br />
2. Elicit vision<br />
statements<br />
3. Formally<br />
analyze<br />
4. Elicit feedback<br />
1. Create sustainability<br />
vision and contrasting<br />
scenarios<br />
2. Stakeholder<br />
outreach and<br />
collaborative learning<br />
3. Provide input for<br />
General Plan<br />
1. Pr<strong>of</strong>essional<br />
(urban planning)<br />
2. Revision <strong>of</strong> the<br />
city’s general plan<br />
2. Future Vision and Scenarios<br />
for Phoenix<br />
<strong>LTER</strong> site: Central Arizona<br />
Phoenix (CAP)<br />
Space: 1344 km2 Time: 40 years forward<br />
1. Incorporated into<br />
report to governor’s<br />
panel on climate<br />
change<br />
2. Informed<br />
decisions<br />
(communities)<br />
1. Modeling <strong>of</strong><br />
ecological impacts;<br />
planning<br />
2. Energy projects<br />
3. <strong>University</strong> classes<br />
Expert-driven 1. Climate and<br />
biophysical<br />
parameters<br />
2. Reports; interactive<br />
Web mapping<br />
1. Downscale<br />
climate scenarios<br />
2. Model<br />
biophysical<br />
parameters<br />
1. Create contrasting<br />
scenarios<br />
2. Stakeholder<br />
outreach and<br />
collaborative learning<br />
3. Create research and<br />
communication tool on<br />
climate change<br />
1. Academic<br />
2. Societal need for<br />
regional information<br />
regarding climate<br />
change<br />
Scenarios Network for Alaska/<br />
Arctic Planning (SNAP)<br />
<strong>LTER</strong> site: Bonanza Creek (BNZ)<br />
Space: AK / 1.7 million km2 Time: 20 years back<br />
100 years forward<br />
1. Forest conversion,<br />
energy production,<br />
climate mitigation,<br />
conservation, etc.<br />
2. Narratives<br />
(technical), maps,<br />
graphs, visualizations<br />
Input from<br />
national<br />
and regional<br />
stakeholders<br />
1. Elicit narratives<br />
2. Parameterize<br />
interactive<br />
simulation models<br />
1. Create contrasting<br />
scenarios<br />
2. Provide input<br />
for cross-site <strong>LTER</strong><br />
comparative research<br />
1. Academic<br />
2. Identify regional<br />
characteristics that<br />
alter continentalscale<br />
drivers <strong>of</strong><br />
global change<br />
North American Forest Scenarios<br />
<strong>LTER</strong> sites: Harvard Forest,<br />
<strong>Coweeta</strong>, NTL, AND, BNZ<br />
Space: 15 landscapes /<br />
5600–27,000 km2 Time: 50 years forward<br />
370 BioScience • April 2012 / Vol. 62 No. 4 www.biosciencemag.org<br />
This is an emerging project whose use and<br />
impacts have yet to be realized.
Overall, the process <strong>of</strong> scenario planning increased the<br />
connectivity <strong>of</strong> the NTL group to other groups actively<br />
engaged in the region. The process also had the immediate<br />
effect <strong>of</strong> increasing the extent <strong>of</strong> networking among diverse<br />
stakeholders who had long histories in the NHLD but little<br />
prior interaction. This connectivity improved the outreach<br />
capacity <strong>of</strong> the NTL and introduced the science to more<br />
potential users.<br />
Blue River Landscape Plan and Study scenarios: The Andrews<br />
Forest <strong>LTER</strong> site. In the early 1990s, forest policy in the<br />
Pacific Northwest abruptly shifted from several decades <strong>of</strong><br />
management in which commodity (timber) production was<br />
emphasized to one that was focused on species conservation<br />
(Duncan and Thompson 2006). The Northwest Forest Plan<br />
(NWFP) was the policy instrument that codified this change.<br />
The NWFP was itself the product <strong>of</strong> a scenario approach<br />
in which scientists, including several from the Andrews<br />
Forest (AND) <strong>LTER</strong> site, prepared 10 management scenarios<br />
(alternatives) for the Clinton administration (FEMAT 1993),<br />
with one selected as the basis <strong>of</strong> the NWFP. Within the<br />
plan, 10 large parcels (40,000–200,000 hectares) <strong>of</strong> federal<br />
forestlands were delineated as adaptive management areas<br />
(AMAs), in which scientists and land managers were charged<br />
with examining alternative strategies to meeting conservation<br />
and timber-production goals. At the Central Cascades<br />
AMA, which contains the AND site, <strong>LTER</strong> scientists teamed<br />
with land managers <strong>of</strong> the Willamette National Forest<br />
to construct a landscape-scale forest-management plan.<br />
They used science-based visioning to describe an ecologically<br />
desirable but unconventional approach to long-term<br />
management that was informed by historic fire regimes<br />
and landscape dynamics rather than by standard reservedesign<br />
criteria. The resulting scenario, called the Blue River<br />
Landscape Plan and Study (BRLP; Ecoshare 2011), patterned<br />
timber harvests on the historical wildfire regime (Cissel<br />
et al. 1999). The BRLP’s resulting “disturbance-based” or<br />
“historical range <strong>of</strong> variability” approach began with a<br />
dendrochronology-based fire-history study that spanned<br />
the previous 500 years (Weisberg 1998), which was used to<br />
semiquantitatively generate a map <strong>of</strong> three fire-regime types<br />
distinguished by fire frequency and severity and constrained<br />
in part by topography. A forest planner used this fire-regime<br />
map and a map <strong>of</strong> the then-present distribution <strong>of</strong> forest<br />
age classes to project harvests 200 years into the future. The<br />
plan included novel approaches to individual-tree and patch<br />
retention and to cutting-rotation length to emulate the<br />
historical wildfire severity and frequency. This disturbancebased<br />
approach to landscape management was contrasted<br />
with expected future management under the NWFP, which<br />
is based on the management <strong>of</strong> unharvested reserves and<br />
matrix land (i.e., actively harvested areas between reserves),<br />
for its conservation value for selected species (Cissel et al.<br />
1999). Public reaction to the disturbance-based plan was<br />
assessed through surveys and field-tour discussions. The<br />
public had a significant level <strong>of</strong> acceptance, although the<br />
Articles<br />
concept and vocabulary were unfamiliar to many (Shindler<br />
and Mallon 2009). The BRLP has since served as an actual<br />
management plan intended for implementation, as well as<br />
a demonstration project used for critical discourse within<br />
science, land-management, and public circles. The BRLP<br />
helped reveal to the various stakeholders that an understanding<br />
<strong>of</strong> natural-disturbance regimes can lead to a viable<br />
approach to harvesting and the conservation <strong>of</strong> biodiversity<br />
and ecosystem functions. Lessons being learned from the<br />
BRLP have been widely communicated and may be used for<br />
new applications as society charts the management <strong>of</strong> public<br />
lands through a dynamic future socioecological system<br />
(Spies and Duncan 2009).<br />
Future vision and scenarios for Phoenix: Central Arizona–Phoenix<br />
<strong>LTER</strong> site. In autumn 2009, the city <strong>of</strong> Phoenix, the Central<br />
Arizona–Phoenix (CAP) <strong>LTER</strong> site, and the School <strong>of</strong><br />
Sustainability at Arizona State <strong>University</strong> initiated a research<br />
project entitled “The Future <strong>of</strong> Phoenix: Crafting Sustainable<br />
Development Strategies.” (Wiek et al. 2012). The purpose <strong>of</strong><br />
the combined visioning and scenario study was to create—<br />
through a collaboration <strong>of</strong> expert facilitators, scientists,<br />
and stakeholders—a vision and contrasting scenarios that<br />
captured a spectrum <strong>of</strong> possible future developments <strong>of</strong><br />
Phoenix. The vision described Phoenix as a desirable and<br />
sustainable socioecological system, as was determined by<br />
stakeholder agreement and sustainability principles (Gibson<br />
2006). The contrasting scenarios described alternative—less<br />
desirable and less sustainable—future states and represented<br />
what might happen if the vision is not achieved (Withycombe<br />
and Wiek 2011). In the vision that resulted from this participatory<br />
research process, Phoenix was described as being<br />
comprised <strong>of</strong> vibrant communities, where healthy food,<br />
clean water, fresh air, excellent educational opportunities,<br />
satisfying jobs, and public transit options are available to<br />
all citizens; where strong local businesses take advantage <strong>of</strong><br />
local assets to build a diverse and community-oriented urban<br />
economy; where governance is open and transparent and<br />
reflects the values <strong>of</strong> all people, regardless <strong>of</strong> their power or<br />
influence; and where the urban ecological system is preserved<br />
and cared for, so that it can be sustained for generations to<br />
come. In the contrasting scenarios, two alternative future<br />
states <strong>of</strong> Phoenix are described: Phoenix behind the times, in<br />
which the city acknowledges critical challenges from climate<br />
change to environmental degradation and social tensions<br />
but cannot seem to keep pace with other regions in creating<br />
a healthy socioecological system, and Phoenix overwhelmed,<br />
in which the city ignores long-term challenges, upholds the<br />
growth paradigm, and continues to overextend its capacities<br />
and to jeopardize sustainable future development pathways.<br />
The vision was presented in three formats: stories with photographs,<br />
a narrative, and a map <strong>of</strong> priorities. The scenarios<br />
were presented as newspaper cover pages with illustrations<br />
and as narratives. Visioning and scenario construction combined<br />
several methods, such as consistency analysis, diversity<br />
analysis, sustainability appraisal, and trade-<strong>of</strong>f analysis<br />
www.biosciencemag.org April 2012 / Vol. 62 No. 4 • BioScience 371
Articles<br />
(Wiek et al. 2006, Withycombe and Wiek 2011). In the study,<br />
the knowledge, preferences, and values <strong>of</strong> a broad range <strong>of</strong><br />
experts and regional stakeholders were elicited, deliberated,<br />
and integrated. The core stakeholder-engagement activities<br />
were 15 meetings in all parts <strong>of</strong> the city, designed to elicit<br />
vision statements, and a visioning workshop, in which the<br />
elicited vision statements were revisited, systemically linked,<br />
and reprioritized on the basis <strong>of</strong> potential conflicts. More<br />
than 100 citizens, city planners, business representatives,<br />
nonpr<strong>of</strong>it organization members, and researchers participated<br />
in this workshop. The vision and the scenarios are now<br />
being used by the city administration in planning, training,<br />
and fund raising, as well as for teaching purposes in public<br />
schools and at Arizona State <strong>University</strong>. Overall, the project<br />
spurred a rich public discussion about the future directions<br />
in which Phoenix may be headed and about the degree to<br />
which these directions align with a desirable and sustainable<br />
future vision. The substance <strong>of</strong> the vision and scenarios has<br />
been incorporated into the current public-hearing draft <strong>of</strong><br />
the city’s general plan (City <strong>of</strong> Phoenix 2010), which is the<br />
city’s most important guide for long-term planning and<br />
development. It provides direction for planning and allows<br />
researchers, policy analysts, and stakeholders to evaluate the<br />
effectiveness <strong>of</strong> policies and actions.<br />
The Scenarios Network for Alaska Planning: The Bonanza Creek<br />
<strong>LTER</strong> site. Arctic and boreal forests are warming about twice<br />
as fast as the global average, creating widespread concern and<br />
interest in the patterns and consequences <strong>of</strong> climate change,<br />
especially among northern residents. At the Bonanza Creek<br />
(BNZ) <strong>LTER</strong> site, scenarios have been used as both a research<br />
and a communications tool to explore the consequences <strong>of</strong><br />
recent and projected climate change in Alaska. Rapid change<br />
experienced in Alaska has focused public attention on these<br />
scenarios, which in turn has led to the establishment <strong>of</strong><br />
a research partnership: the Scenarios Network for Alaska<br />
Planning (SNAP; www.snap.uaf.edu), which comprises the<br />
BNZ, the <strong>University</strong> <strong>of</strong> Alaska, and several state and federal<br />
agencies, local communities, and nonpr<strong>of</strong>its. SNAP has<br />
developed scenarios <strong>of</strong> future climate as high-resolution<br />
maps <strong>of</strong> mean monthly historical and projected temperature<br />
and precipitation (between 1900 and 2100) that account for<br />
the known effects <strong>of</strong> topography and the movement <strong>of</strong> air<br />
masses. By downscaling the five global circulation models<br />
that were shown to perform best in the far north and by providing<br />
outputs for three emission scenarios defined by the<br />
IPCC, SNAP <strong>of</strong>fers stakeholders a range <strong>of</strong> possible climate<br />
futures, rather than a single prediction. Moreover, discussion<br />
and interpretation <strong>of</strong> uncertainty play a large role in SNAP<br />
projects. The actual technical work <strong>of</strong> downscaling the<br />
climate scenarios is an expert-driven process. However, all<br />
SNAP projects are collaborations between SNAP researchers<br />
and land managers or other stakeholders. These stakeholders<br />
help determine how the data will be linked to landscape<br />
models, existing data sets, and local knowledge and<br />
how the resulting scenarios will be used and interpreted.<br />
For example, in collaboration with US Fish and Wildlife<br />
Service, The Nature Conservancy, and other partners, SNAP<br />
researchers have used climate-change scenarios to model<br />
potential biome shifts and changes in the ranges <strong>of</strong> endemic<br />
and invasive species. In the resulting report (Murphy et al.<br />
2010), barren-ground caribou, Alaska marmots, trumpeter<br />
swans, and reed canary grass were used as indicator species<br />
to assess multiple possible futures, given the possible range<br />
<strong>of</strong> climate-change impacts. In addition, the climate scenarios<br />
have been used directly by Alaska communities in order to<br />
inform decisionmaking about the future sustainability <strong>of</strong><br />
hydroelectric generation and other energy project plans<br />
(Cherry et al. 2010).<br />
The American Forest Futures Projects: The Harvard Forest,<br />
Andrews Forest, Bonanza Creek, <strong>Coweeta</strong>, and North Temperate<br />
Lakes <strong>LTER</strong> sites. Scenario planning is the focus <strong>of</strong> American<br />
Forest Futures Projects, an emerging group <strong>of</strong> cross-site<br />
<strong>LTER</strong> projects that are being advanced across the major<br />
forested regions <strong>of</strong> the United States in collaboration with<br />
major NSF-sponsored programs (including, e.g., five <strong>LTER</strong><br />
Network sites, NEON, ULTRA), the US Forest Service, the<br />
US Geological Survey, the Smithsonian Institution, and<br />
several NGOs (e.g., The Nature Conservancy, the Ecological<br />
Society <strong>of</strong> America, the Heinz Center). The projects were<br />
designed to address pressing scientific questions related to<br />
how and why forested regions vary in their socioecological<br />
responses to global change (www.wildlandsandwoodlands.<br />
org/node/133). In a parallel thrust, the researchers designed<br />
the projects as a means to advance several burgeoning<br />
network-level <strong>LTER</strong> Network priorities, such as national-<br />
and regional-scale stakeholder engagement, development<br />
<strong>of</strong> models and visualization tools, and communication with<br />
policymakers. The projects rely on tiered scenarios developed<br />
at national and regional scales to address at least four<br />
dominant themes: economic development, energy exploitation<br />
(e.g., bioenergy), climate mitigation and adaptation,<br />
and landscape-scale conservation.<br />
The researchers have convened a national advisory board<br />
<strong>of</strong> experts, consisting <strong>of</strong> federal agency and national NGO<br />
representatives, to develop national-scale scenarios describing<br />
the anticipated drivers and the changes associated with<br />
each <strong>of</strong> the themes. After they are finalized, the suite <strong>of</strong><br />
national-scale scenarios will be reinterpreted at regional<br />
scales around the country by engaging regional stakeholders<br />
(e.g., natural-resource managers, scientists, agency <strong>of</strong>ficials,<br />
conservation pr<strong>of</strong>essionals) in the development <strong>of</strong> narratives<br />
in which the local manifestation <strong>of</strong> each <strong>of</strong> the national<br />
scenarios is described. This process <strong>of</strong> downscaling global<br />
scenarios to local scales can be an effective approach for<br />
participatory capacity building and for motivating behavioral<br />
changes in local stakeholders and decisionmakers (Shaw<br />
et al. 2009). The regional scenarios will, in turn, be used to<br />
define land-use assumptions and to parameterize spatially<br />
interactive landscape-simulation models (e.g., Thompson<br />
et al. 2011) within study a series <strong>of</strong> study landscapes<br />
372 BioScience • April 2012 / Vol. 62 No. 4 www.biosciencemag.org
(5600–27,000 sqaure kilometers) dispersed throughout five<br />
forest regions: the Northeast, the Lake States, the Southeast,<br />
the Pacific Northwest, and Alaska. Using the scenarios and<br />
simulation outputs, the group plans to conduct a series <strong>of</strong><br />
within- and across-region comparisons to evaluate how ecosystem<br />
attributes and services change in response to similar<br />
national scenarios <strong>of</strong> global change along multiple social<br />
and ecological gradients, including productivity and topography,<br />
land tenure and demographics, land-use history and<br />
policies, disturbance regimes, and climate. This approach for<br />
coupling qualitative and quantitative scenarios has informed<br />
prescient planning and policy and has generated a rich set <strong>of</strong><br />
fundamental research questions (see, e.g., Spies et al. 2007,<br />
Schmitt Olabisi et al. 2010). Although it is still in its early<br />
stages, the American Forest Futures Projects have already<br />
spurred dialogue among dozens <strong>of</strong> agencies and stakeholder<br />
groups in an effort to describe an envelope <strong>of</strong> plausible<br />
futures for forested landscapes across the country.<br />
Discussion <strong>of</strong> the case studies<br />
From these case studies, we <strong>of</strong>fer responses to our initial<br />
three questions:<br />
How do the scenario studies relate the past to the future? Unlike<br />
predictive modeling, in scenario studies, no level <strong>of</strong> confidence<br />
is asserted that any particular changes will occur.<br />
Instead, several possible changes are integrated into a set<br />
<strong>of</strong> potential future pathways in which the major drivers are<br />
logical and consistent across scenarios. In doing so, scenario<br />
studies provide useful contexts for addressing questions<br />
about how past change may or may not help understand<br />
future change, given a range <strong>of</strong> possible societal dynamics<br />
(e.g., population growth, shifting demographics, land-use<br />
change) and possible environmental dynamics (e.g., climate,<br />
invasive species, major disturbance events). The BRLP, for<br />
example, was based on the concept that important elements<br />
<strong>of</strong> the future will represent an extension <strong>of</strong> historic trajectories<br />
<strong>of</strong> change and also incorporated a detailed understanding<br />
<strong>of</strong> historic landscape change over many centuries in<br />
response to disturbance by wildfire, flood, and landslides.<br />
The future landscape is expected to include continued<br />
responses <strong>of</strong> forest and stream systems to those past disturbance<br />
regimes, as well as future regimes resulting from direct<br />
and indirect human influences and natural processes. The<br />
vision <strong>of</strong> management based on historical ecosystem dynamics<br />
acted as a medium for discussing these complexities<br />
among scientists, land managers, and the public. By examining<br />
a range <strong>of</strong> plausible futures, scientists and stakeholders<br />
could consider the range <strong>of</strong> social and ecological uncertainty<br />
and learn about the attributes that drive change, even if<br />
they do not know exactly what level <strong>of</strong> change will occur.<br />
The value <strong>of</strong> considering how historical trends may diverge<br />
along multiple alternative pathways was also evident in the<br />
NHLD, where big shifts in the status quo were foreseen from<br />
both internal and external forces. Internally, concern was<br />
focused on political gridlock and a lack <strong>of</strong> capacity to make<br />
Articles<br />
collective decisions. Externally, concern was focused on the<br />
demographic and economic drivers <strong>of</strong> massive development<br />
in the Northern Highland. These internal and external social<br />
drivers were thought to affect the resilience <strong>of</strong> the region to<br />
climate change and other biophysical drivers. In the NHLD<br />
scenarios that were seen as optimistic by most respondents,<br />
the social and political system <strong>of</strong> the region changed in ways<br />
that facilitated resilient responses to large-scale biophysical<br />
changes.<br />
Evaluating multiple scenarios that are informed but not<br />
constrained by history can have great advantages over the<br />
predictive modeling <strong>of</strong> future conditions, which can pose<br />
serious challenges even in seemingly straightforward analyses<br />
and when long-term data exist. For example, we live in<br />
a period <strong>of</strong> high concern over climate change, yet in many<br />
cases, climate-change signals are difficult to interpret amid<br />
the temporal variability <strong>of</strong> climate at multiple temporal<br />
scales, even with 50-year historical records (Jones et al. 2012<br />
[in this issue]). In Alaska, where the impacts <strong>of</strong> climate<br />
change have been felt by communities for many years, gathering<br />
information about how land managers and residents<br />
are experiencing and reacting to change <strong>of</strong>fers crucial information<br />
about how to address future change. Those who are<br />
living with changes, such as increased fire risk, treeline shift,<br />
or severe coastal erosion, can <strong>of</strong>fer information about how<br />
these changes are already being experienced and managed<br />
and can make specific requests about what kind <strong>of</strong> climate<br />
information and what models would be most useful. The<br />
SNAP scenarios span a range <strong>of</strong> potential climate futures,<br />
informed by the best available science, but without the<br />
false precision <strong>of</strong> predictive models. The climate scenarios<br />
can, in turn, be integrated into socioecological models and<br />
narrative stories that define potential futures in a way that<br />
managers and residents can relate to and plan for. The use <strong>of</strong><br />
scenario studies is therefore a productive means for relating<br />
historical landscape change to forward-looking analyses <strong>of</strong><br />
unpredictable socioecological systems.<br />
How do the scenario studies relate to the more traditional<br />
long-term science occurring within the <strong>LTER</strong> Network? Scenario<br />
studies are <strong>of</strong>ten a form <strong>of</strong> synthesis <strong>of</strong> both biophysical and<br />
social science. Framing plausible alternative depictions <strong>of</strong><br />
the future and evaluating them promotes highly integrative<br />
thinking. The social, political, and land-management contexts<br />
in which <strong>LTER</strong> sites are embedded increasingly demand<br />
a level <strong>of</strong> integrated analysis that is uncommon in traditional<br />
scientific research but that is central to scenario studies. In<br />
each <strong>of</strong> the case studies, the strengths <strong>of</strong> traditional <strong>LTER</strong><br />
science—notably, monitoring and evaluating the impacts<br />
<strong>of</strong> long-term environmental change—were integrated into<br />
the scenario studies. For example, in the American Forest<br />
Futures Projects, the future response <strong>of</strong> forest ecosystems to<br />
climate and land-use change are evaluated over time using<br />
ecosystem-process models that are developed and constrained<br />
by <strong>LTER</strong>. National and regional stakeholders define<br />
the narratives that guide their assumptions about land use<br />
www.biosciencemag.org April 2012 / Vol. 62 No. 4 • BioScience 373
Articles<br />
and other societal responses, thus linking the scenarios to<br />
the legacy <strong>of</strong> “hard science” traditionally upheld by <strong>LTER</strong>.<br />
Likewise, in Alaska, where climate change is a topic that has<br />
reached a relatively high level <strong>of</strong> public awareness, SNAP<br />
and the BNZ are already engaged in the type <strong>of</strong> synthesis<br />
that forges connections between <strong>LTER</strong> and exogenous social<br />
and economic pressures. In working with groups such as the<br />
National Park Service, the Fairbanks North Star Borough<br />
Climate Change Task Force (www. investfairbanks.com/<br />
Taskforces/climate.php), and Alaska’s governor’s Subcabinet<br />
on Climate Change (www.snap.uaf.edu/projects/governorssubcabinet-climate-change-0),<br />
SNAP has received input from<br />
partners who are concerned about the interplay among<br />
multiple ecological factors in the context <strong>of</strong> budgets, short<br />
planning cycles, and public criticism. Scenario planning has<br />
proven to be a useful tool in this context, because it allows<br />
scientists to <strong>of</strong>fer the best available information in a way that<br />
incorporates uncertainty and that allows planners to assess<br />
risk on their own terms.<br />
Importantly, in all <strong>of</strong> the case studies discussed here,<br />
knowledge transfer and syntheses flowed in both directions,<br />
whereby the science informed the scenarios and, in turn,<br />
the scenarios informed the science. For example, within<br />
the NTL program, the scenarios contributed to a shift<br />
toward explicit long-term thinking about socioecological<br />
change that has influenced research and the planning <strong>of</strong> site<br />
activities. Recent projects have been focused on thresholds<br />
for abrupt change in fisheries, food webs, and invasivespecies<br />
dynamics, for example. Climate change has been a<br />
long-standing interest at the NTL that is also serving as an<br />
organizing focus for hypothesis-driven long-term research.<br />
Similarly, the Future Vision and Scenarios for Phoenix<br />
study serves as a pilot project and will be continued with<br />
even more emphasis on the integration <strong>of</strong> previous CAP<br />
work. To this end, a formal synthesis workshop will be conducted<br />
in order to make the links to the other CAP working<br />
groups explicit and to plan future contributions. The study<br />
has also been proven to stimulate collaboration between<br />
CAP researchers and other research groups at Arizona State<br />
<strong>University</strong> that are already engaged or interested in scenario<br />
studies in the CAP region (across different spatial levels and<br />
topic areas).<br />
How do the scenario studies impact the region and the<br />
regional communities through real-world changes or capacity<br />
building? Scenario studies are a distinctive form <strong>of</strong> science<br />
engagement with society and one that has only recently<br />
been employed in <strong>LTER</strong>. They are much more participatory<br />
than traditional outreach that consists <strong>of</strong> a delivery <strong>of</strong> scientific<br />
findings to policymakers, managers, and the public.<br />
For example, the Future Vision and Scenarios for Phoenix<br />
study has served as a powerful medium to enhance the<br />
engagement between CAP researchers and regional stakeholders.<br />
Although CAP research has included stakeholder<br />
engagement since its inception in 1997, the dominant mode<br />
<strong>of</strong> operation has been one-way elicitation. The scenario<br />
study, in contrast, has demonstrated how more interactive<br />
engagement can enhance the interest and ownership for<br />
the challenges as well as potential solutions across different<br />
stakeholder groups. The ongoing scenario work further<br />
expands the participatory-research methodology through<br />
advanced collaborative visualization, walking audits, and<br />
exploration courses. Similarly, the BRLP scenario has proven<br />
to be very useful process for generating discussion among<br />
varied stakeholders—pro- and antilogging groups alike—<strong>of</strong><br />
the dynamics <strong>of</strong> forest ecosystems and the relevance <strong>of</strong><br />
natural variability for future management. Having a management<br />
scenario based on historic disturbance regimes<br />
has fostered public understanding <strong>of</strong> landscape dynamism<br />
at a time when some elements <strong>of</strong> the public seek to freeze<br />
components <strong>of</strong> the landscape as though it were a museum<br />
diorama.<br />
<strong>LTER</strong> scenario studies have also led to novel uses <strong>of</strong><br />
technology to engage the public. Taking just a few examples<br />
from the case studies, the American Forest Futures Projects<br />
are developing a Web-based course modeled after the highly<br />
successful <strong>LTER</strong> Network–sponsored “From Yardstick to<br />
Gyroscope” class (http://news.lternet.edu/article170.html),<br />
in which the science <strong>of</strong> scenario studies will be taught to<br />
university students and landscape planners. As part <strong>of</strong> the<br />
BNZ SNAP project, a Web-based community charts tool<br />
has been developed (www.snap.uaf.edu/community-charts)<br />
that allows Alaska residents to compare a range <strong>of</strong> possible<br />
future climate scenarios for their own village (from among<br />
more than 350 in the state) and a Google Earth interface<br />
(www.snap.uaf.edu/google-earth-maps) that lets users zoom<br />
in on their own region and define which models they would<br />
like to explore. At CAP, as part <strong>of</strong> the Future Vision and<br />
Scenarios for Phoenix study, the Decision Theater at Arizona<br />
State <strong>University</strong> is to be used to evaluate the effectiveness<br />
<strong>of</strong> those participatory processes for capacity building and<br />
decisionmaking.<br />
Overall, the scenario studies presented here demonstrate<br />
how considering our shared socioecological future<br />
can motivate sustained engagement between science and<br />
society. We believe that the long-term dimension <strong>of</strong> the US<br />
<strong>LTER</strong> Network makes it a highly suitable venue for scenario<br />
studies. Indeed, the 30-year history <strong>of</strong> the <strong>LTER</strong> program<br />
provides time for development <strong>of</strong> social networks with key<br />
parts <strong>of</strong> society (e.g., decisionmakers, NGOs, government<br />
agencies with lands responsibilities, interested members <strong>of</strong><br />
the public). Finally, members <strong>of</strong> the <strong>LTER</strong> Network’s science<br />
community live and work in their studied landscapes and<br />
are themselves stakeholders with a deep personal stake in<br />
its future.<br />
Conclusions<br />
As the case studies show, scenarios can be an effective<br />
approach for synthesizing science in a major research<br />
program and can lead to an improved understanding<br />
<strong>of</strong> socioecological change. Scenario studies <strong>of</strong>fer a flexible<br />
framework for integrating the best available ecological<br />
374 BioScience • April 2012 / Vol. 62 No. 4 www.biosciencemag.org
science with the myriad <strong>of</strong> uncertainties that are inherent<br />
in global change. Using scenarios, large ecological research<br />
programs, such as the <strong>LTER</strong> Network, NEON, and ULTRA,<br />
can lead societal discussion regarding the future <strong>of</strong> their<br />
landscapes. The core strengths <strong>of</strong> the <strong>LTER</strong> Network in<br />
particular—its history <strong>of</strong> long-term, place-based studies; its<br />
community <strong>of</strong> scholars committed to integrative research<br />
across disciplines and service to society; and its diversity <strong>of</strong><br />
landscapes, stakeholders, and disturbance regimes—make<br />
it ideally suited to leading scenario studies in each <strong>of</strong> the<br />
landscapes in which <strong>LTER</strong> sites are present. As such, we suggest<br />
that scenario studies be advanced in collaboration with<br />
many other research groups and agencies as a network-wide<br />
activity to promote research in socioecological systems and<br />
cross-site comparative analyses across the network.<br />
Acknowledgments<br />
Support for this work was provided by US National Science<br />
Foundation Long Term Ecological Research Network awards<br />
to Harvard <strong>University</strong>, Arizona State <strong>University</strong>, Oregon<br />
State <strong>University</strong>, the <strong>University</strong> <strong>of</strong> Alaska, and the <strong>University</strong><br />
<strong>of</strong> Wisconsin and by the US Forest Service.<br />
References cited<br />
Alcamo J, Henrichs T. 2008. Towards guidelines for environmental scenario<br />
analysis. Pages 13–35 in Alcamo J, ed. Environmental Futures: The<br />
Practice <strong>of</strong> Environmental Scenario Analysis. Elsevier.<br />
Bennett EM, Carpenter SR, Peterson GD, Cumming GS, Zurek M, Pingali P.<br />
2003. Why global scenarios need ecology. Frontiers in Ecology and the<br />
Environment 1: 322–329.<br />
Bestelmeyer S, Dailey S, Elser M, Hembree P, Landis C, O’Connell K,<br />
Simmons B, Sommer S, Steiner S. 2005. Handbook for <strong>LTER</strong> Education.<br />
US Long Term Ecological Research Network.<br />
Bolte JP, Hulse DW, Gregory SV, Smith C. 2007. Modeling biocomplexity:<br />
Actors, landscapes and alternative futures. Environmental Modeling<br />
and S<strong>of</strong>tware 22: 570–579.<br />
Carpenter S[R]. 2008. Seeking adaptive change in Wisconsin’s ecosystems.<br />
Pages 407–421 in Waller DM, Rooney TP, eds. The Vanishing<br />
Present: Wisconsin’s Changing Lands, Waters, and Wildlife. <strong>University</strong><br />
<strong>of</strong> Chicago Press.<br />
Carpenter SR, Folke C. 2006. Ecology for transformation. Trends in Ecology<br />
and Evolution 21: 309–315.<br />
Carpenter SR, Bennett EM, Peterson GD. 2006. Scenarios for ecosystem<br />
services: An overview. Ecology and Society 11: 29.<br />
Cherry JE, Walker S, Fresco N, Trainor S, Tidwell A. 2010. Impacts<br />
<strong>of</strong> Climate Change and Variability on Hydropower in Southeast<br />
Alaska: Planning for a Robust Energy Future. <strong>University</strong> <strong>of</strong> Alaska,<br />
Fairbanks. (31 January 2012; http://ine.uaf.edu/accap/documents/seak_<br />
report_final.pdf )<br />
Cissel JH, Swanson FJ, Weisberg PJ. 1999. Landscape management using<br />
historical fire regimes: Blue River, Oregon. Ecological Applications 9:<br />
1217–1231.<br />
City <strong>of</strong> Phoenix. 2010. Phoenix General Plan Update: Transitioning to<br />
a Sustainable Future. Public Hearing Draft. December 2010. City<br />
<strong>of</strong> Phoenix, Phoenix, Arizona. (8 September 2011; http://phoenix.gov/<br />
citygovernment/planres/cityplan/planphx/index.html)<br />
Collins SL, et al. 2011. An integrated conceptual framework for long-term<br />
social-ecological research. Frontiers in Ecology and the Environment<br />
9: 351–357.<br />
Driscoll CT, Lambert KF, Chapin FS III, Nowak DJ, Spies TA, Swanson FJ,<br />
Kittredge DB Jr, Hart CM. 2012. Science and society: The role <strong>of</strong> longterm<br />
studies in environmental stewardship. BioScience 62: 354–366.<br />
Articles<br />
Duncan SL, Thompson JR. 2006. Forest plans and ad hoc scientist groups in<br />
the 1990s: Coping with the Forest Service viability clause. Forest Policy<br />
and Economics 9: 32–41.<br />
[FEMAT] Forest Ecosystem Management Assessment Team. 1993.<br />
Forest Ecosystem Management: An Ecological, Economic, and Social<br />
Assessment. US Forest Service.<br />
Gibson RB. 2006. Sustainability assessment: Basic components <strong>of</strong> a<br />
practical approach. Impact Assessment and Project Appraisal 24:<br />
170–182.<br />
Henrichs T, Zurek M, Eickout B, Kok K, Raudsepp-Hearne C, Ribeiro T,<br />
van Vuuren D, Volkery A. 2010. Scenario development and analysis for<br />
forward-looking ecosystem assessments. Pages 151–220 in Ash N, et al.,<br />
eds. Ecosystems and Human Well-Being: A Manual for Assessment<br />
Practitioners. Island Press.<br />
[Ecoshare] Ecoshare: Interagency Clearinghouse <strong>of</strong> Ecological Information.<br />
2011. Blue River Landscape Strategy. Ecoshare. (31 January 2012;<br />
http://ecoshare.info/projects/central-cascade-adaptive-managementpartnership/landscape-studies/blue-river-landscape-strategy)<br />
Iverson Nassauer J, Corry RC. 2004. Using normative scenarios in landscape<br />
ecology. Landscape Ecology 19: 343–356.<br />
Jones JA, et al. 2012. Ecosystem processes and human influences regulate<br />
streamflow response to climate change at long-term ecological research<br />
sites. BioScience 62: 390–404.<br />
Kahn H. 1962. Thinking about the unthinkable. Horizon Press.<br />
[<strong>LTER</strong> Network] US Long Term Ecological Research Network. 2011. Strategic<br />
and Implementation Plan: Long-term Ecological Research Network<br />
(<strong>LTER</strong>): Research and Education. <strong>LTER</strong> Network. (31 January 2012;<br />
http://intranet2.lternet.edu/sites/intranet2.lternet.edu/files/documents/<br />
<strong>LTER</strong>%20History/Planning%20Documents/<strong>LTER</strong>_SIP_Dec_05_2010.<br />
pdf )<br />
Mahmoud M, et al. 2009. A formal framework for scenario development in<br />
support <strong>of</strong> environmental decision-making. Environmental Modeling<br />
and S<strong>of</strong>tware 24: 798–808.<br />
[MA] Millennium Ecosystem Assessment. 2005. Ecosystems and Human<br />
Well-being: Scenarios. Island Press.<br />
Murphy K, Huettmann F, Fresco N, Morton J. 2010. Connecting Alaska<br />
Landscapes into the Future. US Fish and Wildlife Service. (8 September<br />
2011; www.snap.uaf.edu/files/SNAP-connectivity-2010-complete.pdf )<br />
Naki enovi N, Swart R. 2000. Emissions Scenarios. Intergovernmental<br />
Panel on Climate Change.<br />
Peterson GD, Cumming GS, Carpenter S. 2003a. Scenario planning: A<br />
tool for conservation in an uncertain world. Conservation Biology 17:<br />
358–366.<br />
Peterson GD, Beard TD Jr, Beisner BE, Bennett EM, Carpenter SR,<br />
Cumming GS, Dent CL, Havlicek TD. 2003b. Assessing future ecosystem<br />
services: A case study <strong>of</strong> the Northern Highlands Lake District,<br />
Wisconsin. Conservation Ecology 7 (3, Art. 1).<br />
Raskin P, Monks F, Riberio T, van Vuuren D, Zurek M. 2005. Global scenarios<br />
in historical perspective. Pages 35–45 in Carpenter S, Pingali P,<br />
Bennett E, Zurek M, eds. Ecosystems and Human Well-being, Vol. 2:<br />
Scenarios. Island Press.<br />
Reid WV, Chen D, Goldfarb L, Hackmann H, Lee YT, Mokhele K, Ostrom<br />
E, Raivio K, Rockström J, Schellnhuber HJ, Whyte A. 2010. Earth system<br />
science for global sustainability: Grand challenges. Science 330:<br />
916–917.<br />
Robertson GP, et al. 2012. Long-term ecological research in a humandominated<br />
world. Bioscience 62: 342–353.<br />
Rockström J, et al. 2009. A safe operating space for humanity. Nature 461:<br />
472–475.<br />
Sala OE, et al. 2000. Global biodiversity scenarios for the year 2100. Science<br />
287: 1770–1774.<br />
Scheffer M, Carpenter S, Foley JA, Folke C, Walker B. 2001. Catastrophic<br />
shifts in ecosystems. Nature 413: 591–596.<br />
Schmitt Olabisi LK, Kapuscinski AR, Johnson KA, Reich PB, Stenquist B,<br />
Draeger KJ. 2010. Scenario visioning and participatory system dynamics<br />
modeling to investigate the future: Lessons from Minnesota 2050.<br />
Sustainability 2: 2686–2706.<br />
www.biosciencemag.org April 2012 / Vol. 62 No. 4 • BioScience 375
Articles<br />
Shaw A, Sheppard S, Burch S, Flanders D, Wiek A, Carmichael J, Robinson J,<br />
Cohen S. 2009. Making local futures tangible—Synthesizing, downscaling,<br />
and visualizing climate change scenarios for participatory capacity<br />
building. Global Environmental Change 19: 447–463.<br />
Shindler B, Mallon A. 2009. Public acceptance <strong>of</strong> disturbance-based<br />
forest management: A study <strong>of</strong> the Blue River Landscape Strategy in<br />
the Central Cascades adaptive management area. US Department <strong>of</strong><br />
Agriculture, US Forest Service, Pacific Northwest Research Station.<br />
Research Report no. PNW-RP-581.<br />
Spies TA, Duncan SL. 2009. Old Growth in a New World: A Pacific<br />
Northwest Icon Reexamined. Island Press.<br />
Spies TA, Johnson KN, Burnett KM, Ohmann JL, McComb BC, Reeves GC,<br />
Bettinger P, Kline JD, Garber-Yonts B. 2007. Cumulative ecological and<br />
socioeconomic effects <strong>of</strong> forest policies in coastal Oregon. Ecological<br />
Applications 17: 5–17.<br />
Swart RJ, Raskin P, Robinson J. 2004. The problem <strong>of</strong> the future:<br />
Sustainability science and scenario analysis. Global Environmental<br />
Change 14: 137–146.<br />
Thompson J[R], Foster D[R]. 2009. Report to the <strong>LTER</strong> Network Office<br />
on the Scenarios <strong>of</strong> Future Landscape Change Working Group<br />
Meeting April 1–2, 2009. (8 September 2011; http://lno.lternet.edu/files/<br />
lno/Workship%20Report%20-%20Landscape%20Change_Thompson_<br />
Foster.pdf )<br />
Thompson JR, Foster DR, Scheller R, Kittredge D[B Jr]. 2011. The influence<br />
<strong>of</strong> land use and climate change on forest biomass and composition in<br />
Massachusetts, USA. Ecological Applications 21: 2425–2444.<br />
Wack P. 1985. Scenarios: Uncharted waters ahead. Harvard Business Review<br />
63: 73–89.<br />
Weaver PM, Rotmans J. 2006. Integrated sustainability assessment: What<br />
is it, why do it and how? International Journal <strong>of</strong> Innovation and<br />
Sustainable Development 1: 284–303.<br />
Weisberg PJ. 1998. Fire history, fire regimes, and development <strong>of</strong> forest<br />
structure in the central western Oregon Cascades. PhD dissertation.<br />
Oregon State <strong>University</strong>, Corvallis.<br />
Wiek A, Binder CR, Scholz RW. 2006. Functions <strong>of</strong> scenarios in transition<br />
processes. Futures 38: 740–766.<br />
Wiek A, Ness B, Brand FS, Schweizer-Ries P, Farioli F. 2012. From complex<br />
systems analysis to transformational change: A comparative appraisal<br />
<strong>of</strong> sustainability science projects. Sustainability Science. doi:10.1007/<br />
s11625-011-0148-y<br />
Withycombe L, Wiek A. 2011. What if the future does not play out as imagined<br />
in the vision? Advances in sustainability planning and research<br />
through contrasting, non-intervention scenarios. Project Report. School<br />
<strong>of</strong> Sustainability, Arizona State <strong>University</strong>. (http://start.lab.asu.edu/)<br />
Xiang W-N, Clarke KC. 2003. The use <strong>of</strong> scenarios in land-use planning.<br />
Environment and Planning 30: 885–909.<br />
Jonathan R. Thompson (thompsonjr@si.edu) is affiliated with the Smithsonian<br />
Institution’s Conservation Biology Institute, in Front Royal, Virginia. Arnim<br />
Wiek is affiliated with the School <strong>of</strong> Sustainability at Arizona State <strong>University</strong>,<br />
in Tempe. Frederick J. Swanson and Thomas A. Spies are affiliated with<br />
the US Forest Service’s Pacific Northwest Research Station, in Corvallis,<br />
Oregon. Stephen R. Carpenter is affiliated with the Center for Limnology<br />
at the <strong>University</strong> <strong>of</strong> Wisconsin, Madison. Nancy Fresco is affiliated with the<br />
School <strong>of</strong> Natural Resources and Agricultural Science at the <strong>University</strong> <strong>of</strong><br />
Alaska, Fairbanks. Teresa Hollingsworth is affiliated with the Boreal Ecology<br />
Cooperative Research Unit at the <strong>University</strong> <strong>of</strong> Alaska, Fairbanks, and with<br />
the US Forest Service’s Pacific Northwest Research Station, also in Fairbanks.<br />
David R. Foster is affiliated with Harvard <strong>University</strong>’s Harvard Forest, in<br />
Petersham, Massachusetts.<br />
376 BioScience • April 2012 / Vol. 62 No. 4 www.biosciencemag.org
Past, Present, and Future Roles<br />
<strong>of</strong> Long-Term Experiments in the<br />
<strong>LTER</strong> Network<br />
AlAn K. KnApp, MelindA d. SMith, SArAh e. hobbie, Scott l. collinS, tiMothy J. FAhey,<br />
Gretchen J. A. hAnSen, douGlAS A. lAndiS, KiMberly J. lA pierre, Jerry M. Melillo,<br />
tiMothy r. SeAStedt, GAiuS r. ShAver, And JAcKSon r. WebSter<br />
Articles<br />
The US National Science Foundation–funded Long Term Ecological Research (<strong>LTER</strong>) Network supports a large (around 240) and diverse portfolio<br />
<strong>of</strong> long-term ecological experiments. Collectively, these long-term experiments have (a) provided unique insights into ecological patterns and<br />
processes, although such insight <strong>of</strong>ten became apparent only after many years <strong>of</strong> study; (b) influenced management and policy decisions; and<br />
(c) evolved into research platforms supporting studies and involving investigators who were not part <strong>of</strong> the original design. Furthermore, this<br />
suite <strong>of</strong> long-term experiments addresses, at the site level, all <strong>of</strong> the US National Research Council’s Grand Challenges in Environmental Sciences.<br />
Despite these contributions, we argue that the scale and scope <strong>of</strong> global environmental change requires a more-coordinated multisite approach to<br />
long-term experiments. Ideally, such an approach would include a network <strong>of</strong> spatially extensive multifactor experiments, designed in collaboration<br />
with ecological modelers that would build on and extend the unique context provided by the <strong>LTER</strong> Network.<br />
Keywords: climate change, global change, long-term research, <strong>LTER</strong> Network, multifactor experiments<br />
More than 30 years ago, Odum (1977) described ecology<br />
as a uniquely integrative and synthetic scientific<br />
endeavor, and the diversity <strong>of</strong> research approaches employed<br />
today reflects this perspective (e.g., Rees et al. 2001).<br />
Collectively, ecologists conduct research that includes virtually<br />
every ecosystem type on Earth, with studies that span<br />
a broad range <strong>of</strong> spatial and temporal scales. Moreover,<br />
the most successful research programs generally employ a<br />
mixture <strong>of</strong> complementary approaches, including retrospective<br />
studies, observations, experiments (natural and<br />
manipulative), gradient studies, synthetic analyses, and<br />
modeling. The research portfolios <strong>of</strong> the 26 sites within the<br />
US National Science Foundation (NSF)–funded Long Term<br />
Ecological Research (<strong>LTER</strong>) Network (http://lternet.edu)<br />
exemplify this spatially and temporally extensive and multifaceted<br />
approach to ecology (Hobbie et al. 2003), although<br />
the degree to which the sites allocate time and resources to<br />
particular research approaches varies on the basis <strong>of</strong> the<br />
questions being addressed, site-specific constraints, and the<br />
culture <strong>of</strong> the discipline (e.g., oceanographers study systems<br />
differently than do forest ecologists).<br />
Site-based manipulative experiments have long been a<br />
cornerstone <strong>of</strong> ecological research. Although long-term<br />
experiments (box 1) have a foundational history in ecology<br />
(e.g., the Rothamstad fertilization study begun in 1856),<br />
short-term experiments are much more common for a<br />
variety <strong>of</strong> reasons (Tilman 1989). Short-term experiments<br />
provide information on how a system is regulated at the<br />
time and place <strong>of</strong> the manipulation (i.e., the initial limiting<br />
factors and their interactions). However, in complex systems<br />
with multiple components operating on different time scales<br />
<strong>of</strong> response, the initial trajectories <strong>of</strong> response <strong>of</strong> either the<br />
whole system or <strong>of</strong> individual components (e.g., single species)<br />
will not necessarily indicate either the direction or the<br />
magnitude <strong>of</strong> long-term change. Long-term experiments,<br />
when coupled with measurements <strong>of</strong> key processes, will be<br />
more likely to enable interpretation <strong>of</strong> the entire trajectory<br />
<strong>of</strong> system response, as well as the trajectories <strong>of</strong> change<br />
in system components (i.e., species or pools <strong>of</strong> organic<br />
matter and elements). A key difference between long-term<br />
and short-term experiments is that long-term experiments<br />
provide insight into the causes <strong>of</strong> the changes in the slope<br />
<strong>of</strong> responses, the causes <strong>of</strong> the inflection points, and the<br />
magnitude <strong>of</strong> the long-term change, whereas short-term<br />
experiments are focused only on the initial trajectories.<br />
Thus, long-term experiments can address mechanisms and<br />
temporal dynamics in a complementary fashion, particularly<br />
when the experiments are combined with other research<br />
approaches (e.g., observational and gradient studies). In<br />
doing so, they can help elucidate how historical influences<br />
BioScience 62: 377–389. ISSN 0006-3568, electronic ISSN 1525-3244. © 2012 by American Institute <strong>of</strong> Biological Sciences. All rights reserved. Request<br />
permission to photocopy or reproduce article content at the <strong>University</strong> <strong>of</strong> California Press’s Rights and Permissions Web site at www.ucpressjournals.com/<br />
reprintinfo.asp. doi:10.1525/bio.2012.62.4.9<br />
www.biosciencemag.org April 2012 / Vol. 62 No. 4 • BioScience 377
Articles<br />
Box 1. Definition <strong>of</strong> long-term ecological experiments.<br />
We define experiments simply as planned or active manipulations<br />
<strong>of</strong> a single factor or <strong>of</strong> several factors (drivers or components<br />
<strong>of</strong> ecological systems) in order to test hypotheses.<br />
Such manipulations may occur at spatial scales that vary from<br />
small plots to whole systems (watersheds or entire lakes). This<br />
definition excludes consideration <strong>of</strong> natural field experiments<br />
such as those involving floods, droughts, hurricanes, wildfires,<br />
and other uncontrolled natural events, unless they can serendipitously<br />
be incorporated into a planned experimental design<br />
(see the text).<br />
More challenging is the definition <strong>of</strong> long term. Ideally,<br />
ecological or life-history criteria (e.g., process and turnover<br />
rates, life span <strong>of</strong> organisms) or the time scales <strong>of</strong> ecological<br />
phenomena would be used to define an experiment as long<br />
term. Operationally, however, the duration <strong>of</strong> experiments,<br />
which typically require financial resources to be initiated and<br />
continued, is to a large extent constrained by funding cycles.<br />
Given the Long Term Ecological Research (<strong>LTER</strong>) Network<br />
focus <strong>of</strong> this review, we view a long-term experiment as one<br />
that is planned to exceed or already exceeds six years in length,<br />
which would span two traditional <strong>LTER</strong> Network funding<br />
cycles and is also a sufficient length to allow both mechanisms<br />
and temporal dynamics to be identified. This duration is also<br />
consistent with the requisite period <strong>of</strong> continuous measurements<br />
for support by the US National Science Foundation’s<br />
Long-Term Research in Environmental Biology program.<br />
that shape the present can be merged with a mechanistic<br />
understanding <strong>of</strong> contemporary processes to enable forecasting<br />
the future <strong>of</strong> ecological systems (Carpenter 2002). In<br />
contributing to this understanding, long-term experiments<br />
are critical for informing and validating mechanistic models<br />
and for linking short-term process studies with long-term<br />
observations to improve models for forecasting future<br />
scenarios.<br />
Long-term experiments have been an integral part <strong>of</strong><br />
the NSF-funded <strong>LTER</strong> program since its inception in 1980<br />
(Callahan 1984). Indeed, the <strong>LTER</strong> program’s early mission<br />
statement specifically called for the creation <strong>of</strong> a legacy <strong>of</strong><br />
“well-designed and well-documented long-term observations,<br />
experiments, and archives <strong>of</strong> samples and specimens”<br />
(Hobbie et al. 2003, p. 22). Although there are certainly<br />
many valuable long-term experiments worldwide (Rees et al.<br />
2001), a large and diverse collection has been developed<br />
within the US <strong>LTER</strong> Network. Now, after more than three<br />
decades <strong>of</strong> research, an assessment <strong>of</strong> the types <strong>of</strong> long-term<br />
experiments within the <strong>LTER</strong> Network and their contributions<br />
is warranted. Below, we review the motivation for and<br />
the role <strong>of</strong> long-term experiments in the <strong>LTER</strong> Network,<br />
we summarize the collective lessons learned from these<br />
long-term experiments, and we envision the future role<br />
for long-term experiments in advancing ecological science<br />
and addressing critical questions facing society as the <strong>LTER</strong><br />
Network continues into its fourth decade.<br />
Early long-term experiments <strong>of</strong> the <strong>LTER</strong> Network<br />
Long-term experiments served as the basis for the establishment<br />
<strong>of</strong> the research programs at several <strong>of</strong> the initial <strong>LTER</strong><br />
sites funded in the 1980s. For example, the AND, CWT, and<br />
HBR <strong>LTER</strong> sites (see table 1 for site abbreviations) began as<br />
US Department <strong>of</strong> Agriculture (USDA) Forest Service experimental<br />
forests. At these sites, the responses <strong>of</strong> hydrology,<br />
energy flow, and nutrient cycling to changes in forest structure<br />
caused by disturbance had been quantified experimentally<br />
using paired watersheds (e.g., Hewlett and Helvey 1970) and<br />
the small-watershed approach (Likens 1985) for a number<br />
<strong>of</strong> years prior to their being included in the <strong>LTER</strong> program<br />
(figure 1). Similarly, the USDA Agricultural Research Service<br />
established long-term livestock grazing experiments at several<br />
<strong>of</strong> their experimental ranges in the early 1900s, two <strong>of</strong> which<br />
became <strong>LTER</strong> program sites (JRN and SGS; see figure 1). The<br />
response <strong>of</strong> arctic tundra vegetation to long-term manipulations<br />
<strong>of</strong> nutrient availability and temperature (Chapin et al.<br />
1995) also provided the foundation for continuing studies <strong>of</strong><br />
global-change effects at the ARC site (figure 1).<br />
Research programs at several other founding <strong>LTER</strong> sites<br />
were built around newly established long-term experiments<br />
designed to test a diverse set <strong>of</strong> hypotheses, with the expectation<br />
<strong>of</strong> a long-term funding commitment. For example, the<br />
role and mechanisms whereby soil resources regulate community<br />
structure have been examined in plot-level manipulations<br />
at the CDR site since its inception (figure 1). The<br />
long-term consequences <strong>of</strong> nitrogen (N) deposition, climate<br />
warming, and hurricanes for nutrient cycling, carbon (C)<br />
dynamics, and forest productivity have been assessed at HFR<br />
(Foster et al. 1997). Moreover, experiments evaluating the<br />
interactions <strong>of</strong> fire, ungulate grazing, and climate variability<br />
in driving patterns and processes in tallgrass prairie formed<br />
the basis for long-term experiments at KNZ (figure 1).<br />
Finally, the core experiment in row-crop agriculture at KBS<br />
involved the long-term imposition <strong>of</strong> a gradient <strong>of</strong> varying<br />
management inputs into midwestern US cropping systems.<br />
In all cases, the expectation that key ecological responses to<br />
these manipulations might not become evident for many<br />
years justified the long-term nature <strong>of</strong> the experimental<br />
design for these <strong>LTER</strong> programs.<br />
Long-term experiments today in the <strong>LTER</strong> Network<br />
In order to provide a more comprehensive overview <strong>of</strong><br />
long-term experiments in the <strong>LTER</strong> Network, we surveyed<br />
each <strong>of</strong> the 26 <strong>LTER</strong> sites (table 1) to quantify the number,<br />
types, and durations <strong>of</strong> long-term experiments supported<br />
by the <strong>LTER</strong> Network. In addition, we convened a two-day<br />
working-group meeting with participants from <strong>of</strong> a subset<br />
<strong>of</strong> <strong>LTER</strong> sites in February 2011. On the basis <strong>of</strong> responses<br />
(from 100% <strong>of</strong> the sites) to the survey questions, a total <strong>of</strong><br />
239 long-term experiments (completed and ongoing) were<br />
identified within the <strong>LTER</strong> Network (table 1). Of these, less<br />
than 10% exceed 30 years in duration, which indicates that<br />
most long-term experiments were initiated during the time<br />
frame <strong>of</strong> the <strong>LTER</strong> Network (figure 2). Diversity among the<br />
378 BioScience • April 2012 / Vol. 62 No. 4 www.biosciencemag.org
Articles<br />
Table 1. Selected results from a questionnaire survey <strong>of</strong> the 26 sites in the Long-Term Ecological Research (<strong>LTER</strong>) Network,<br />
site acronyms, and site age.<br />
Site name Site acronym<br />
experiments was manifest in the wide array <strong>of</strong> resources<br />
and environmental factors manipulated (e.g., soil nutrients,<br />
water, and temperature were the most commonly manipulated,<br />
carbon dioxide [CO 2 ] more rarely), as well as alterations<br />
in biotic attributes (e.g., species removal and additions,<br />
herbivory) and disturbance regimes (e.g., fire, logging, windstorms,<br />
pathogen outbreaks; figure 2). However, in only 28%<br />
(66 <strong>of</strong> 239) <strong>of</strong> the long-term experiments was more than<br />
one <strong>of</strong> these factors manipulated concurrently (table 1).<br />
As befits the chronic nature <strong>of</strong> many global-change drivers<br />
(Smith et al. 2009), the number <strong>of</strong> sites that employed press<br />
(i.e., continuous alteration) treatments in long-term experiments<br />
was 80%, with 75% also supporting long-term pulse<br />
experiments. Collectively, all <strong>of</strong> the Grand Challenges for the<br />
environment identified by the National Research Council<br />
(NRC 2001) are being addressed across the <strong>LTER</strong> Network,<br />
Year established<br />
in <strong>LTER</strong> Network<br />
Number <strong>of</strong><br />
long-term<br />
experiments<br />
Number <strong>of</strong><br />
multifactor<br />
experiments<br />
Multisite<br />
experiments<br />
(yes [y] or no [n])<br />
Andrews Experimental Forest AND 1980 23 1 y<br />
Arctic ARC 1987 10 7 y<br />
Baltimore Ecosystem Study BES 1997 1 0 n<br />
Bonanza Creek Experimental Forest BNZ 1987 18 3 y<br />
California Current Ecosystem CCE 2004 2 0 n<br />
Cedar Creek Ecosystem Science Reserve CDR 1981 36 9 y<br />
Central Arizona-Phoenix CAP 1997 2 0 n<br />
<strong>Coweeta</strong> Hydrological Laboratory CWT 1980 5 1 y<br />
Florida Coastal Everglades FCE 2000 5 1 n<br />
<strong>Georgia</strong> Coastal GCE 2000 1 0 n<br />
Harvard Forest HFR 1988 18 2 y<br />
Hubbard Brook Experimental Forest HBR 1987 5 1 n<br />
Jornada Basin JRN 1981 15 2 y<br />
Kellogg Biological Station KBS 1987 12 8 y<br />
Konza Prairie Biological Station KNZ 1980 18 8 y<br />
Luquillo Experimental Forest LUQ 1988 4 1 y<br />
McMurdo Dry Valleys MCM 1993 12 3 n<br />
Moorea Coral Reef MCR 2004 1 1 n<br />
Niwot Ridge NWT 1980 8 6 y<br />
North Temperate Lakes NTL 1980 6 2 n<br />
Palmer Station PAL 1991 0 0 n<br />
Plum Island Ecosystems PIE 1998 3 2 y<br />
Santa Barbara Coastal SBC 2000 1 0 y<br />
Sevilleta SEV 1988 12 3 y<br />
Shortgrass Steppe SGS 1981 17 4 y<br />
Virginia Coast Reserve VCR 1987 4 1 y<br />
Note: The principal investigators (PIs) were asked to provide information about long-term ecological experiments (as defined in box 1) at their site.<br />
Among other questions, the PIs were asked to report the number <strong>of</strong> long-term experiments, the number <strong>of</strong> experiments that included more than one<br />
manipulated factor, and if any <strong>of</strong> these long-term experiments were conducted at multiple sites. Additional results from this survey are provided in<br />
figure 2 and in the text.<br />
although long-term experiments related to infectious disease<br />
are notably underrepresented (figure 2). Finally, a majority<br />
<strong>of</strong> the sites (16 <strong>of</strong> 26) participated in multisite or networklevel<br />
experiments (i.e., experiments that spanned multiple<br />
sites), which may or may not have included other <strong>LTER</strong><br />
sites. Notable examples include the Nutrient Network, the<br />
Long-Term Intersite Decomposition Team (LIDET), and the<br />
International Tundra Experiment.<br />
Our assessment <strong>of</strong> long-term experiments during the<br />
working-group meeting revealed that many <strong>of</strong> the earliest<br />
long-term experiments were designed as single-factor<br />
manipulations with the goal <strong>of</strong> gaining an improved understanding<br />
<strong>of</strong> the long-term nature <strong>of</strong> change (primarily at<br />
the process level) in response to either short-term (pulse) or<br />
long-term (press) manipulations. In the early years <strong>of</strong> <strong>LTER</strong>,<br />
assessing recovery from disturbance using pulse experiments<br />
www.biosciencemag.org April 2012 / Vol. 62 No. 4 • BioScience 379
Articles<br />
Figure 1. Examples <strong>of</strong> the diversity <strong>of</strong> long-term experiments established or already ongoing in the earliest cohorts <strong>of</strong> sites<br />
(more than 20 years old; see table 1) in the Long Term Ecological Research (<strong>LTER</strong>) Network. (a) Small watersheds with<br />
different forest harvest treatments at the HBR site (photograph: Hubbard Brook Research Foundation); (b) snowfence<br />
experiment designed to alter soil moisture and growing-season length at the NWT site (photograph: Mark Williams, Niwot<br />
Ridge <strong>LTER</strong> Program, <strong>University</strong> <strong>of</strong> Colorado); (c) a long-term ungrazed exclosure (left) adjacent to a grazed grassland at the<br />
SGS site (photograph: Alan K. Knapp); (d) warming, nutrient addition, and shade experiments at the ARC site (photograph:<br />
Sarah E. Hobbie); (e) biodiversity manipulations at the CDR site (photograph: David Tilman); (f) watershed-scale fire<br />
experiments at the KNZ site (photograph: Alan K. Knapp). Site abbreviations are defined in table 1.<br />
(i.e., a single perturbation or manipulation event) was the<br />
most common type <strong>of</strong> experiment (Callahan 1984), such as<br />
deforestation studies at HBR and CWT or wind-disturbance<br />
studies at HRF. These studies were motivated by the need<br />
to develop or test theory in order to enable a deeper understanding<br />
<strong>of</strong> the ways in which key drivers altered ecosystem<br />
structure and function. The goal was to complement historical<br />
observations with knowledge and insight that were<br />
unattainable from traditional short-term experiments and<br />
space-for-time studies. Other experiments were initiated<br />
to understand the impacts <strong>of</strong> anthropogenic disturbances<br />
such as logging, grazing, and acid deposition. Although the<br />
initial focus was on disturbances, the more-recent trend is<br />
for long-term experiments to have stronger relevance to<br />
global-change drivers or to be linked explicitly to policy and<br />
major issues in natural-resource management (figure 3).<br />
The working group concluded that, given the number and<br />
diversity <strong>of</strong> long-term experiments in the <strong>LTER</strong> Network,<br />
Callahan’s (1984) vision <strong>of</strong> the <strong>LTER</strong> Network as one that<br />
could address the “ serious contradiction between the time<br />
scales <strong>of</strong> many ecological phenomena and the support to<br />
finance their study” (p. 363) has been fulfilled.<br />
Synergies between the <strong>LTER</strong> Network and long-term<br />
experiments<br />
Although long-term experiments have been supported by<br />
many other programs and have been conducted successfully<br />
at a wide range <strong>of</strong> sites around the globe, long-term<br />
experiments conducted at <strong>LTER</strong> sites have many important<br />
advantages. First, long-term measurements at <strong>LTER</strong> sites<br />
provide essential context for interpreting experimental<br />
responses. Long-term observations can also provide pretreatment<br />
and reference-system data, as well as the basis<br />
for identifying ecological surprises, such as extreme climatic<br />
events (Lindenmayer et al. 2010, Smith 2011). Such<br />
data are critical for interpreting experimental results over<br />
380 BioScience • April 2012 / Vol. 62 No. 4 www.biosciencemag.org
Figure 2. (a) The number <strong>of</strong> long-term experiments across<br />
the 26 Long-Term Ecological Research (<strong>LTER</strong>) Network<br />
sites according to their duration. Experiments more than<br />
30 years in duration were initiated prior to the existence<br />
<strong>of</strong> the <strong>LTER</strong> Network, whereas those less than 6 years<br />
in duration have been recently initiated with plans for<br />
continuation for more than 6 years. (b) Proportion <strong>of</strong> sites<br />
in the <strong>LTER</strong> Network with long-term experiments in which<br />
different types <strong>of</strong> factors were manipulated. Resource<br />
manipulations are in the left side <strong>of</strong> the panel, and other<br />
types <strong>of</strong> manipulations are shown in the right side (Biotic =<br />
species removals/additions, herbivory, etc.; Disturbance =<br />
fire, hurricane simulation, etc.; Land use = agriculture,<br />
forest clear-cutting, etc.; Other = salinity, soil pH, etc.).<br />
(c) Proportion <strong>of</strong> <strong>LTER</strong> Network sites with long-term<br />
experiments in which the National Research Council’s<br />
Grand Challenges in Environmental Sciences (NRC 2001)<br />
were addressed. These data are from a survey <strong>of</strong> all 26<br />
<strong>LTER</strong> Network–site principal investigators (see table 1).<br />
Articles<br />
a background <strong>of</strong> natural variability—for separating signal<br />
from noise; however, these data sets are usually impossible<br />
to maintain through typical funding programs. At the<br />
HBR site, for example, researchers were able to quantify<br />
the magnitude <strong>of</strong> soil calcium (Ca) depletion caused by<br />
twentieth-century acid deposition only through 40 years<br />
<strong>of</strong> continuous biogeochemical measurements (Likens et al.<br />
1996). These observations, in turn, inspired a long-term<br />
experiment in which soil Ca availability was returned to<br />
preindustrial levels (figure 3), with the long-term trajectory<br />
<strong>of</strong> forest biomass and demography providing the context<br />
for interpreting responses to the experimental treatment.<br />
The dramatic recovery <strong>of</strong> growth, health, and regeneration<br />
<strong>of</strong> sugar maple (Acer saccharum) in response to a moderate<br />
increase in soil Ca provided further evidence that humaninduced<br />
soil Ca depletion has caused widespread decline<br />
in this highly valued forest tree and in forest productivity<br />
overall (Juice et al. 2006). In this case, the deployment <strong>of</strong> a<br />
highly sensitive tracer in the Ca treatment provided additional<br />
insights into the pathways <strong>of</strong> Ca flux through forested<br />
watersheds (Dasch et al. 2006).<br />
In addition to long-term observations revealing patterns<br />
and inspiring experimentation to elucidate mechanisms,<br />
post-experiment monitoring at <strong>LTER</strong> sites can improve<br />
understanding and prompt the design <strong>of</strong> new studies<br />
(Janzen 2009). For example, a decade following the cessation<br />
<strong>of</strong> 10 years <strong>of</strong> experimental N additions at the<br />
CDR site, species richness had recovered, whereas other<br />
aspects <strong>of</strong> community structure had not. This led to a<br />
short-term experiment in which the manipulation <strong>of</strong> soil<br />
N availability, plant litter, and seed dispersal revealed the<br />
mechanisms related to recovery from chronic N fertilization<br />
(Clark and Tilman 2010). Similarly, ecosystem recovery was<br />
monitored for 10 years following 6 years <strong>of</strong> experimental<br />
acidification <strong>of</strong> Little Rock Lake (part <strong>of</strong> the NTL site) in<br />
northern Wisconsin (figure 3). This monitoring revealed<br />
that total zooplankton biomass recovered in one year, but<br />
community composition exhibited sustained differences.<br />
Approximately 40% <strong>of</strong> zooplankton taxa exhibited a lag in<br />
recovery after pH returned to the levels at which a biological<br />
response was first observed (Frost et al. 2006). Continued<br />
monitoring <strong>of</strong> the recovery <strong>of</strong> this system revealed complex<br />
trophic interactions and hysteresis effects—responses that<br />
would not have appeared with only a year or two <strong>of</strong> posttreatment<br />
measurements. Such opportunities arise because<br />
<strong>LTER</strong> Network sites provide consistent access to instrumentation<br />
and infrastructure, stable funding levels, and<br />
well-trained personnel who are available to continue the<br />
measurements. Furthermore, the information-management<br />
capabilities <strong>of</strong> <strong>LTER</strong> Network sites ensure that data will be<br />
collected using consistent protocols and will be archived<br />
and readily available for use by other researchers (Ingersoll<br />
1997). Easily accessible data with well-documented metadata<br />
facilitate cross-site comparisons that are integral for<br />
expanding the results <strong>of</strong> experiments to broader spatial<br />
scales.<br />
www.biosciencemag.org April 2012 / Vol. 62 No. 4 • BioScience 381
Articles<br />
Figure 3. Examples <strong>of</strong> long-term experiments related to global change in the Long-Term Ecological Research (<strong>LTER</strong>)<br />
Network. (a) Application <strong>of</strong> calcium silicate to an experimental watershed at the HRB site to mechanistically examine<br />
acid-rain impacts (photograph: US Forest Service); (b) the multifactor BioCON experiment at the CDR site with<br />
manipulations <strong>of</strong> carbon dioxide, nitrogen, and biodiversity (photograph: David Tilman); (c) Lake acidification curtain<br />
in a lake at the NTL site to assess whole-system impacts <strong>of</strong> changes in pH (photograph: Carl J. Watras); (d) soil-warming<br />
experiment at the HFR site (plot delineated by the lack <strong>of</strong> snow in winter; photograph: Jerry M. Melillo); (e) automated<br />
trace-gas chambers for assessing the impacts <strong>of</strong> different management practices in field crops at the KBS site (photograph:<br />
Julie E. Doll, Kellogg Biological Station <strong>LTER</strong> Program); (f) litter-exclusion experiment at the CWT site designed to allow<br />
the examination <strong>of</strong> the importance <strong>of</strong> terrestrial energy inputs into streams, which also has relevance for evaluating the<br />
impacts <strong>of</strong> mountaintop mining practices (photograph: Sue L. Eggert). Site abbreviations are defined in table 1.<br />
The value <strong>of</strong> long-term ecological experiments<br />
On the basis <strong>of</strong> the working-group meeting and the broader<br />
site survey, we highlight below the diverse array <strong>of</strong> insights<br />
and contributions provided by long-term ecological experiments<br />
within the <strong>LTER</strong> Network. Our goal is to extend our<br />
review beyond the core scientific benefits <strong>of</strong> this suite <strong>of</strong><br />
studies to include unique opportunities and broader impacts<br />
afforded by these long-term experiments.<br />
Insights into long-term responses. Obviously, but not trivially,<br />
one <strong>of</strong> the greatest scientific benefits <strong>of</strong> long-term site-based<br />
experiments is that they elucidate how ecological systems<br />
respond to experimental treatments over the long term.<br />
Indeed, such experiments have repeatedly demonstrated<br />
that long-term responses to treatments can differ markedly<br />
from short-term responses (Tilman 1989, Debinski and Holt<br />
2000). For example, in the BioCON experiment at the CDR<br />
site (biodiversity, CO 2 , and N are manipulated; see figure 3),<br />
Reich and colleagues (2006) tested the hypothesis that the<br />
availability <strong>of</strong> N would constrain the response <strong>of</strong> productivity<br />
in an N-poor grassland community to elevated CO 2 .<br />
Although this hypothesized interaction between N and CO 2<br />
eventually became apparent, it was not until the fourth year<br />
<strong>of</strong> treatment. If the experiment had been discontinued before<br />
the fourth year (i.e., within the time frame <strong>of</strong> typical funding<br />
cycles), researchers might have concluded that N availability<br />
had no effect on the response <strong>of</strong> these communities to elevated<br />
CO 2 . Similarly, in a manipulation <strong>of</strong> soil temperature<br />
at the HFR site (figure 3), the conclusion regarding the influence<br />
<strong>of</strong> warming on soil respiration would have been very<br />
different had the experiment ended after its first few years<br />
(figure 4). In that experiment, warming strongly increased<br />
382 BioScience • April 2012 / Vol. 62 No. 4 www.biosciencemag.org
Figure 4. Long-term dynamics <strong>of</strong> soil carbon-dioxide<br />
release from the soil-warming experiment at the Harvard<br />
Forest Long-Term Ecological Research site. The data shown<br />
are the proportional change in carbon lost between soils<br />
in the heated plots (H, heated by soil-warming cables)<br />
and those not warmed (but disturbed similarly to the<br />
heated plots, DC). Note that from 1991 to 1997, there was<br />
a strong effect <strong>of</strong> soil warming, but this effect diminished<br />
substantially as the experiment continued. See Melillo and<br />
colleagues (2002) for further details.<br />
soil respiration (by about 25%) in the first five years <strong>of</strong> the<br />
study (Melillo et al. 2002). However, by the tenth year <strong>of</strong><br />
treatment, the warming stimulation had declined to less than<br />
5% above ambient controls. Conclusions based on the initial<br />
results <strong>of</strong> this experiment would have led to an overestimate<br />
<strong>of</strong> the positive feedback to climate warming resulting from<br />
enhanced soil organic matter decomposition. Elucidation<br />
<strong>of</strong> the mechanisms underlying these responses was made<br />
possible by coupling these single-factor studies with those in<br />
which soil and N were simultaneously manipulated, whereas<br />
additional microbial studies enhanced ecosystem-scale<br />
understanding (Contosta et al. 2011).<br />
Occasionally, experimentally induced shifts in ecosystems<br />
can take years to appear, which can lead to ecological<br />
surprises (Lindenmayer et al. 2010), as exemplified by the<br />
long-term phosphorus (P)–addition experiment conducted<br />
at the Upper Kuparuk River, Alaska (part <strong>of</strong> the ARC site).<br />
In this case, although P fertilization stimulated epilithic<br />
algal production immediately, a major increase in bryophyte<br />
production (with subsequent effects on nutrient cycling and<br />
higher trophic levels) became apparent only after a decade<br />
<strong>of</strong> treatment—a response that was completely unexpected<br />
(figure 5; Slavik et al. 2004). In other instances, the lack <strong>of</strong><br />
response even after a decade or more <strong>of</strong> treatments may<br />
lead to an important new understanding <strong>of</strong> patterns and<br />
processes. For example, inspired by the dramatic response<br />
<strong>of</strong> desert grasslands to an exclusion <strong>of</strong> small mammals in<br />
Portal, Arizona (e.g., Brown and Heske 1990), replicate<br />
Articles<br />
Figure 5. Long-term changes in epilitihic chlorophyll<br />
(top panel, in micrograms [µg] per square centimeter<br />
[cm 2 ]) and bryophyte cover (bottom panel, percentage)<br />
in reference and phosphorus-fertilized reaches <strong>of</strong> the<br />
Kuparuk River at the Arctic Long Term Ecological Research<br />
site. In this long-term experiment, bryophyte cover<br />
was negligible in both reference and fertilized reaches<br />
prior to 1992 but increased dramatically in response to<br />
chronic phosphorus additions afterward, with concurrent<br />
reductions in epilithic chlorophyll. The chlorophyll<br />
data are not shown in 1988 because the samples were<br />
contaminated by green algal filaments. Means are shown,<br />
and the error bars represent the positive standard error.<br />
The data are updated from Slavik and colleagues (2004).<br />
small mammal exclosures were established in a number<br />
<strong>of</strong> grassland and shrubland sites, including the SEV site.<br />
Although no significant differences in vegetation composition<br />
and dynamics have been observed to date at the SEV<br />
site (cf. Báez et al. 2006), major changes have occurred in<br />
other arid-land ecosystems (Meserve et al. 2003). The differences<br />
in responses among sites reflect the degree to which<br />
top-down control <strong>of</strong> community structure can vary among<br />
arid-land ecosystems and can prompt new experiments to<br />
better understand context dependence in the function <strong>of</strong><br />
communities and ecosystems.<br />
Besides elucidating how ecological responses to experimental<br />
treatments can change over time, long-term experiments<br />
can provide unique opportunities to uncover the<br />
mechanisms underlying such dynamics. In some instances,<br />
initial system responses may be dominated by the disturbance<br />
associated with initiating an experiment or because <strong>of</strong><br />
www.biosciencemag.org April 2012 / Vol. 62 No. 4 • BioScience 383
Articles<br />
legacies <strong>of</strong> pretreatment conditions. Therefore, it may take<br />
a while before system responses are indicative <strong>of</strong> ecological<br />
processes. For example, patterns <strong>of</strong> nitrate loss from agricultural<br />
systems that vary in management intensity are notably<br />
variable, in part because many studies are initiated before<br />
treatments have fully equilibrated or are conducted over relatively<br />
short periods <strong>of</strong> time. This has led to widely conflicting<br />
reports and little agreement about the best management<br />
practices to decrease nitrate loss. In contrast, the long-term<br />
cropping systems experiment at the KBS site (figure 3) has<br />
enabled comparisons <strong>of</strong> nitrate losses from conventional, notill,<br />
low-input, and organic cropping systems. Each <strong>of</strong> these<br />
treatments had six years to equilibrate before measurement,<br />
and they have been assessed for 11 years, which accounts for<br />
interannual variability (Syswerda et al. 2008). This study has<br />
revealed consistent and marked differences in nitrate losses,<br />
with the low-input and organic systems having about half the<br />
nitrate losses <strong>of</strong> the conventionally managed systems.<br />
Long-term experiments can reveal the importance <strong>of</strong> indirect<br />
effects in ecosystem processes not apparent in the short<br />
term, as well as responses that may change over the long term<br />
(Tilman 1989). At the NTL site, the experimental acidification<br />
<strong>of</strong> a small seepage lake (figure 3) produced numerous<br />
changes driven by indirect interactions related to changes in<br />
the food web rather than by direct consequences <strong>of</strong> lower<br />
pH. For example, the rotifer Keratella taurocephela has displayed<br />
low acid tolerance in laboratory studies but increased<br />
in density throughout the acidification experiment as a result<br />
<strong>of</strong> decreased invertebrate-predator abundance (Gonzalez and<br />
Frost 1994). Keratella taurocephela also underwent morphological<br />
changes in the acidified basin as a result <strong>of</strong> reduced<br />
predation pressure. Responses driven by food-web interactions<br />
were <strong>of</strong>ten the opposite <strong>of</strong> expectations based on laboratory<br />
studies <strong>of</strong> pH tolerance and generally exhibited a time lag;<br />
these unexpected results would not have been observed on time<br />
scales shorter than the response time <strong>of</strong> all trophic levels.<br />
Other opportunities from long-term experiments. Unavoidably,<br />
long-term experiments occur against a backdrop <strong>of</strong> longterm<br />
trends; stochastic ambient conditions, including<br />
climate variability and extremes and infrequent disturbances;<br />
and changes in the abundances <strong>of</strong> predators and<br />
pathogens at scales greater than the experimental units.<br />
Although the inability to control ambient conditions can be<br />
challenging, variability in background conditions can sometimes<br />
also prove fortuitous (Tilman 1989). For example,<br />
long-term experiments can be particularly valuable if they<br />
coincide with climate or weather extremes that provide new<br />
ecological understanding. Of course, the longer an experiment<br />
is conducted, the greater the chances that ambient<br />
conditions will vary in ways that produce insights and even<br />
inspire new experiments. During the Ca-addition studies<br />
at the HBR site (figure 3), an intense ice storm damaged<br />
sugar maple trees, which allowed researchers to document<br />
improved wound repair as one <strong>of</strong> the major responses to<br />
the alleviation <strong>of</strong> Ca deficiency and, presumably, a principal<br />
mechanism underlying increased growth rates (Huggett<br />
et al. 2007). At the CWT site, Yeakley and colleagues<br />
(2003) designed an experiment to investigate the importance<br />
<strong>of</strong> riparian Rhododendron species to nutrient export<br />
to streams. They instrumented treatment and reference<br />
hillslopes, made two years <strong>of</strong> pretreatment measurements,<br />
and then removed all Rhododendron stems from a 10-meter<br />
(m) strip along 30 m <strong>of</strong> stream. Less than two months<br />
later, Hurricane Opal downed most <strong>of</strong> the large trees on<br />
the reference hillslope. Over the course <strong>of</strong> the study, they<br />
found that the hurricane impact on canopy trees had far<br />
greater effects on nutrient export than did the experimental<br />
Rhododendron removal. Finally, a wildfire at the KNZ site<br />
in 1996 reset most <strong>of</strong> the long-term fire treatments in the<br />
60 watersheds at the site (figure 1) by burning them all on<br />
the same date. This afforded the opportunity to sample<br />
a large number <strong>of</strong> sites affected by the same fire but with<br />
a wide array <strong>of</strong> longer-term fire histories. This sampling<br />
revealed the importance <strong>of</strong> the amount <strong>of</strong> time since a prior<br />
fire in determining aboveground net primary productivity<br />
responses to fire (figure 6) and helped researchers interpret<br />
results from other experiments regarding the role <strong>of</strong> soil N<br />
in postfire responses (Blair 1997, Knapp et al. 1998).<br />
Scientists conducting long-term experiments can also<br />
take advantage <strong>of</strong> dramatic changes in community structure,<br />
such as those resulting from extirpation or biological invasion.<br />
For example, at the KBS site, long-term monitoring<br />
<strong>of</strong> predaceous lady beetles (Coccinellidae) in experimental<br />
agricultural treatments has revealed three exotic species<br />
additions since 1988, including the multicolored Asian lady<br />
beetle (Harmonia axyridis). The arrival <strong>of</strong> the soybean aphid<br />
(Aphis glycines) in 2000 reunited these two Asian species in<br />
a new context and resulted in surprising dynamics. Prior to<br />
2000, H. axyridis was a common species; however, after 2000,<br />
it became dominant (figure 7). Moreover, it demonstrated<br />
classic predator–prey cycling with high abundances following<br />
years <strong>of</strong> aphid outbreak (Heimpel et al. 2010); process-level<br />
studies demonstrated strong top-down control <strong>of</strong> A. glycines<br />
by coccinellids (Costamagna and Landis 2006). A further<br />
surprise was that biological control <strong>of</strong> the soybean aphid<br />
was regulated by the structure <strong>of</strong> the surrounding landscape:<br />
Suppression was positively correlated with landscape<br />
diversity at the 1.5-kilometer scale (Gardiner et al. 2009).<br />
Finally, long-term experiments can provide opportunities<br />
to address novel questions that were not part <strong>of</strong><br />
the original motivation for the experiment. Long-term<br />
N-enrichment studies at the ARC site were initially established<br />
as part <strong>of</strong> a broader suite <strong>of</strong> treatments designed<br />
to assess resource limitation and the response <strong>of</strong> tundra<br />
ecosystems to global-change factors (figure 1; Chapin et al.<br />
1995). After 20 years <strong>of</strong> adding N, the researchers shifted<br />
their focus toward asking how much <strong>of</strong> the cumulative N<br />
added still remained in the plots and how this affected C<br />
pools (Mack et al. 2004). Somewhat surprisingly, these plots<br />
had lost significant C, despite greater C inputs (net primary<br />
production) and aboveground C stocks with N addition. Net<br />
384 BioScience • April 2012 / Vol. 62 No. 4 www.biosciencemag.org
Figure 6. Response in aboveground net primary production<br />
(ANPP, in grams [g] per square meter [m 2 ]) to a wildfire at<br />
the Konza Prairie (KNZ) Long-Term Ecological Research<br />
site. The KNZ site includes a number <strong>of</strong> watersheds that are<br />
experimentally burned at different frequencies (from annual<br />
fire to no fire). A wildfire burned most <strong>of</strong> the site in 1991<br />
(the no-fire data are from areas that escaped the wildfire),<br />
which allowed the researchers to gain insight into how<br />
long-term fire history (including the time since the last fire)<br />
influenced ANPP responses. The mean for each time interval<br />
is displayed, and the error bars represent the standard error.<br />
Source: Adapted from Knapp and colleagues (1988).<br />
ecosystem C losses resulted from soil C losses in deeper<br />
horizons, presumably from enhanced decomposition caused<br />
by N addition.<br />
Broader contributions <strong>of</strong> long-term experiments. Beyond the<br />
basic ecological understanding that results from individual<br />
experiments, long-term experiments can be valuable by contributing<br />
to synthetic activities, testing and inspiring ecological<br />
theory and models across systems, and informing policy<br />
and management. With respect to synthesis, combining the<br />
results <strong>of</strong> multiple studies in meta-analyses or data syntheses<br />
can elucidate how factors such as climate, species composition,<br />
and edaphic conditions interact with treatments to<br />
influence ecological responses, which adds value to the original,<br />
individual experiments. For example, although numerous<br />
studies have demonstrated declines in plant species richness<br />
in response to N addition, synthesis <strong>of</strong> such results across a<br />
number <strong>of</strong> <strong>LTER</strong> sites revealed that the relative magnitude<br />
<strong>of</strong> species loss varied greatly across sites; warmer sites and<br />
those with high cation-exchange-capacity (CEC) soils exhibited<br />
lower declines in richness than sites that were colder<br />
or had low CEC (Clark et al. 2007). Sites with high abundance<br />
<strong>of</strong> C 4 grasses had a greater productivity response to N<br />
addition than did other sites, which was in turn associated<br />
with greater proportional declines in species richness.<br />
Long-term experiments conducted at multiple sites,<br />
although less common, are particularly powerful ways to<br />
Articles<br />
achieve general, synthetic understanding <strong>of</strong> ecological processes.<br />
Such studies can identify important influences on<br />
ecological processes at large spatial scales. They are more<br />
powerful than ad hoc meta-analytical syntheses, because they<br />
can eliminate variation in experimental methodologies across<br />
sites. For example, the LIDET studied long-term decomposition<br />
(10 years) by deploying common substrates across 27<br />
sites, including 16 <strong>LTER</strong> Network sites (Harmon et al. 2009).<br />
The LIDET experiment yielded new insights into decomposition<br />
processes including a new understanding <strong>of</strong> the rates<br />
and controls <strong>of</strong> decomposition <strong>of</strong> more slowly decomposing<br />
litter fractions. Such insights would have been difficult to<br />
derive from the meta-analysis <strong>of</strong> published decomposition<br />
studies because most <strong>of</strong> those studies last one year at most<br />
and because substrate variability confounds site-to-site variability<br />
in factors such as climate (Adair et al. 2010).<br />
Long-term experiments also take on added value when<br />
they inform and are informed by ecological theory and<br />
models. Tilman’s (1982) study <strong>of</strong> resource competition<br />
that developed the resource-ratio hypothesis <strong>of</strong> competitive<br />
interactions was enriched by the close interplay between<br />
long-term experiments and the development <strong>of</strong> theory at the<br />
CDR site. Similarly, empirical research on resource limitation<br />
at the ARC site has occurred in close connection with<br />
the development <strong>of</strong> theory on multiple-resource limitation<br />
www.biosciencemag.org April 2012 / Vol. 62 No. 4 • BioScience 385<br />
Mean abundance <strong>of</strong> Harmonia axyridis<br />
(number per trap per week)<br />
Figure 7. Abundance <strong>of</strong> adult multicolored Asian lady<br />
beetles (Harmonia axyridis) at the Kellogg Biological<br />
Station Long Term Ecological Research site from 1989 to<br />
2010. This invasive species was first detected in 1994 and,<br />
until 1999, its mean abundance was approximately 0.2<br />
adults per trap per week (a). Following the arrival <strong>of</strong> the<br />
soybean aphid (Aphis glycines), major aphid outbreaks<br />
(arrows) occurred every other year from 2001 to 2005,<br />
prompting strong numerical responses by Harmonia in the<br />
subsequent years and overall greater mean abundance (b).<br />
Since 2007, no aphid outbreaks have occurred, and a<br />
new pattern <strong>of</strong> intermediate Harmonia abundance may<br />
be forming (c). The data are updated from Heimpel and<br />
colleagues (2010).
Articles<br />
(Herbert et al. 1999). Multiple-resource-limitation theory, in<br />
turn, has influenced the development <strong>of</strong> Earth-system models<br />
that explore the implications <strong>of</strong> N constraints on C cycling at<br />
a global scale (e.g., Gerber et al. 2010). Given the number and<br />
diversity <strong>of</strong> long-term experiments in the <strong>LTER</strong> Network, the<br />
opportunity certainly exists for additional theory and model<br />
development capable <strong>of</strong> linking a broad array <strong>of</strong> patterns and<br />
processes across temporal and spatial scales.<br />
There are broader practical outcomes <strong>of</strong> many long-term<br />
experiments when they influence the design <strong>of</strong> policy and<br />
management strategies. For example, the litter-exclusion<br />
experiment at the CWT site (figure 3) clearly demonstrated<br />
the importance <strong>of</strong> tree-leaf litter to the organisms living in<br />
headwater streams (Wallace et al. 1997). The importance<br />
<strong>of</strong> maintaining the integrity <strong>of</strong> headwater streams has been<br />
used as an argument against mountaintop mining practices<br />
in the central Appalachian region (Meyer and Wallace 2001)<br />
and cited in court cases (e.g., P. C. Chambers, US District<br />
Judge, Memorandum Opinion and Order on Civil Action<br />
No. 3:05-0784 in the Huntington Division <strong>of</strong> the US District<br />
Court <strong>of</strong> the Southern District <strong>of</strong> West Virginia, 23 March<br />
2007). Experimental demonstration <strong>of</strong> the dramatic impacts<br />
<strong>of</strong> deforestation on soil and surface-water chemistry at the<br />
HBR site (Bormann et al. 1974) raised awareness <strong>of</strong> the<br />
consequences <strong>of</strong> intensive forest harvest for environmental<br />
quality and influenced the development <strong>of</strong> best management<br />
practices for these forests. Simulations <strong>of</strong> hurricanes and<br />
mortality resulting from pests and pathogens demonstrated<br />
that the ecosystem consequences <strong>of</strong> salvage and restoration<br />
management <strong>of</strong> forests—both post-windstorm and in<br />
advance <strong>of</strong> insect infestation or disease—are <strong>of</strong>ten much<br />
greater than the impacts <strong>of</strong> the disturbances themselves and<br />
led to the argument that leaving forests alone is <strong>of</strong>ten a viable<br />
management alternative from an ecological perspective<br />
(Foster and Orwig 2006). Finally, the results from long-term<br />
experiments, coupled with gradient studies, field observations,<br />
and data from monitoring networks, have been used<br />
to estimate the critical loads <strong>of</strong> N for freshwater and terrestrial<br />
ecosystems <strong>of</strong> the United States (Pardo et al. 2011).<br />
Long-term experiments can provide a unique opportunity<br />
to directly evaluate the consequences <strong>of</strong> policy changes<br />
using an adaptive-management approach. In adaptivemanagement<br />
experiments, the researcher attempts to learn<br />
about managed systems by experimentally changing policy<br />
and assessing the outcomes on the appropriate time scale.<br />
At the NTL site, several policies were enacted as part <strong>of</strong> a<br />
long-term experiment designed to reduce P inputs and to<br />
control algal blooms in Lake Mendota, Wisconsin. Initial<br />
changes to land-use practices revealed little effect <strong>of</strong> management<br />
on the P inputs to the lake, possibly because <strong>of</strong> resuspension<br />
<strong>of</strong> P stored in sediments. Subsequent manipulation<br />
<strong>of</strong> the Lake Mendota food web to create a trophic cascade<br />
was more effective in reducing algal blooms, especially when<br />
they were accompanied by fishing-regulation changes and<br />
additional land-use practices implemented in the 1990s and<br />
2000s (Carpenter et al. 2006).<br />
Future policy can also be informed by results from<br />
long-term experiments. Work at the KBS site suggests<br />
that agricultural nitrous oxide (N 2 O) emissions (figure 3)<br />
increase exponentially with increasing rates <strong>of</strong> N fertilizer<br />
use, after the rates exceed the N-uptake capacity <strong>of</strong> the crop.<br />
In intensive agricultural systems, application <strong>of</strong> N in excess<br />
<strong>of</strong> plant needs is rather common, because fertilizer is inexpensive<br />
relative to commodity prices, and producers tend to<br />
hedge against the risk <strong>of</strong> insufficient N in order to achieve<br />
maximum yields. Using the concept <strong>of</strong> maximum return<br />
to N, Millar and colleagues (2010) developed a transparent<br />
N 2 O-reduction protocol suitable for incentivizing N 2 O<br />
reductions without affecting crop yields. They estimated<br />
that if the protocol were widely adopted as a part <strong>of</strong> future C<br />
cap-and-trade markets, the protocol could reduce N 2 O from<br />
fertilized row-crop agriculture by more than 50%.<br />
Long-term experiments as platforms for new and unplanned<br />
research. Because <strong>of</strong> their multiyear nature, long-term<br />
experiments can serve as platforms for research that goes<br />
well beyond the goals originally envisioned. As a result, they<br />
provide opportunities for novel studies that take advantage<br />
<strong>of</strong> imposed treatments, as well as for more detailed<br />
process-level studies to uncover mechanisms behind longterm<br />
patterns. For example, the soil-warming studies at the<br />
HFR site have become a platform for new studies <strong>of</strong> soil<br />
N; the consequences <strong>of</strong> garlic mustard invasion, an exotic<br />
species that inhibits mycorrhizae and the growth <strong>of</strong> some<br />
tree seedlings; and for microbial studies <strong>of</strong> the mechanisms<br />
responsible for the pattern <strong>of</strong> increased heterotrophic soil<br />
respiration followed by a diminishing response to warming<br />
(Bradford et al. 2008). This latter research showed that the<br />
apparent acclimation <strong>of</strong> soil respiration at the ecosystem<br />
scale results from the combined effects <strong>of</strong> reductions in soil<br />
C pools and microbial biomass and changes in the thermal<br />
response <strong>of</strong> microbial respiration. Mass-specific respiration<br />
rates were lower when seasonal temperatures were higher,<br />
which suggests that rate reductions under experimental<br />
warming probably occurred through temperature-induced<br />
changes in the microbial community.<br />
The long-term nutrient-addition studies that were conducted<br />
at multiple <strong>LTER</strong> sites to understand the role <strong>of</strong> N<br />
limitation, as well as to test ecosystem response to enhanced N<br />
deposition, have similarly provided a rich template for more<br />
short-term mechanistic studies. At the NWT site, for example,<br />
these studies have identified the importance <strong>of</strong> plant species<br />
traits in affecting community change (Suding et al. 2006)<br />
and demonstrated how plant–microbial feedbacks influence<br />
species coexistence (Ashton et al. 2008). Experiments initially<br />
designed to study vegetation change have been used to provide<br />
important insights as to how increased N availability can<br />
affect soil C storage (Neff et al. 2002).<br />
Long-term experiments are increasingly serving as platforms<br />
for ecological metagenomics studies. At the SEV site,<br />
for example, microbial ecologists are examining the metagenomic<br />
responses <strong>of</strong> rhizosphere microbes in a fully crossed<br />
386 BioScience • April 2012 / Vol. 62 No. 4 www.biosciencemag.org
multifactor experiment that includes increased winter rainfall,<br />
N amendment, and nighttime warming (Collins et al.<br />
2010). At the CDR site, metagenomic studies have shown<br />
a marked divergence <strong>of</strong> microbial communities in grassland<br />
communities developed under ambient as opposed to<br />
elevated CO 2 in terms <strong>of</strong> both composition and function,<br />
with communities under elevated CO 2 exhibiting increased<br />
abundance <strong>of</strong> the genes involved in labile C decomposition<br />
and C and N fixation (He et al. 2010).<br />
A call for a new generation <strong>of</strong> long-term experiments<br />
We have argued that well-designed long-term experiments<br />
focused on key questions and important processes can have<br />
tremendous value for individual sites. These long-term<br />
experiments can provide the understanding necessary for<br />
forecasting, coping with, and mitigating the consequences <strong>of</strong><br />
human-driven global changes to the environment (Collins<br />
et al. 2011). However, the scope and pace <strong>of</strong> change occurring<br />
in ecological systems today—and forecast for the future—<br />
are, by all accounts, unprecedented in human history (Palmer<br />
et al. 2004, Solomon et al. 2007, Smith et al. 2009). Because<br />
<strong>of</strong> the global scale <strong>of</strong> altered biogeochemical cycles from<br />
increased atmospheric CO 2 concentrations, nutrient enrichment<br />
and depletion, climatic change (means and extremes;<br />
Smith 2011), exotic species introductions, and land-use<br />
change, all ecosystems are, and will continue to be, affected<br />
by these alterations (Solomon et al. 2007). Independently<br />
conducted site-based studies in which global-change factors<br />
(i.e., N or temperature) were manipulated and modeling<br />
studies both show that responses to these global-change factors<br />
may vary dramatically among ecosystems—from little or<br />
no response to a substantial change in function (e.g., Weltzin<br />
et al. 2003). But experimental ecologists need to think beyond<br />
the site level and provide a more complete understanding <strong>of</strong><br />
how and why ecosystems differ in their susceptibility and<br />
sensitivity to these changes. Such understanding is critical for<br />
forecasting the ecological consequences <strong>of</strong> global change at<br />
regional to continental spatial scales and yet it is a challenge<br />
that ecologists have not fully met (Smith et al. 2009).<br />
This lack <strong>of</strong> comprehensive understanding occurs, in part,<br />
because ecologists have historically conducted disparate,<br />
largely independent experiments that tend to differ markedly<br />
with regard to (a) what is manipulated, (b) how much<br />
and for how long manipulations occur, and (c) what (and<br />
how) response variables are measured. This is certainly true<br />
<strong>of</strong> long-term experiments conducted in the <strong>LTER</strong> Network.<br />
As a result, syntheses across these studies can be difficult,<br />
since there is no way <strong>of</strong> knowing how much these different<br />
approaches contribute to the range <strong>of</strong> responses observed<br />
among ecosystems (Knapp et al. 2004). As Callahan (1984)<br />
pointed out more than 25 years ago, “even similar projects<br />
are not <strong>of</strong>ten comparable unless effort and resources have<br />
been devoted to making them so. This inherent tendency<br />
away from comparability becomes more prominent among<br />
projects conducted at locations that are geographically and<br />
biologically disjunct” (p. 363). Recently, renewed calls have<br />
Articles<br />
been made for establishing unified sampling protocols<br />
and conducting simultaneous multisite, multifactor experiments<br />
to address the most pressing global-change issues<br />
(Janzen 2009, Luo et al. 2011; e.g., The Nutrient Network,<br />
http://nutnet.science.oregonstate.edu). We echo and extend<br />
these calls by proposing that these multisite experiments<br />
should be planned as long-term experiments capable <strong>of</strong><br />
elucidating both ecological dynamics and ecological mechanisms.<br />
As is appropriate, these should take advantage <strong>of</strong> the<br />
long-term observations and contextual understanding extant<br />
within the <strong>LTER</strong> Network as well as from nonnetwork sites<br />
and other existing and emerging observatories (Carpenter<br />
2008, Robertson et al. 2012 [in this issue]).<br />
Designing multisite experiments will not be without challenges.<br />
For example, how one scales treatment levels across<br />
disparate ecosystems can influence how these different ecosystems<br />
respond to “common treatments.” For experiments<br />
that alter CO 2 , treatments can be designed to increase CO 2<br />
by either a constant amount or a constant proportion with<br />
an expectation <strong>of</strong> comparable results because essentially all<br />
terrestrial ecosystems have very similar atmospheric CO 2<br />
concentrations. But for resources such as water and N, initial<br />
stocks and turnover rates can vary by orders <strong>of</strong> magnitude<br />
among mesic or xeric and fertile or infertile ecosystems.<br />
Therefore, experiments designed to increase or decrease<br />
resources by a constant proportion <strong>of</strong> availability and those<br />
designed to change them by a constant amount will likely<br />
lead to very different responses among sites. As was noted<br />
above, long-term data from observations and monitoring<br />
at <strong>LTER</strong> sites and the rich array <strong>of</strong> shorter-term processlevel<br />
studies that each site has conducted can be invaluable<br />
for providing the appropriate context for planning such<br />
experiments, as well as for interpreting their results. Longterm<br />
data can also provide the breadth <strong>of</strong> understanding<br />
necessary for devising more-detailed studies that are <strong>of</strong>ten<br />
necessary for elucidating key mechanisms. Other issues that<br />
must be addressed, and that <strong>LTER</strong> scientists grapple with<br />
today, include determining the end point for long-term<br />
experiments (e.g., when do the costs outweigh the new<br />
knowledge gained by continuing an experiment?) and how<br />
to optimally balance the trade-<strong>of</strong>f between the spatial scale<br />
<strong>of</strong> manipulations and the number <strong>of</strong> replicates. Small-plotbased<br />
long-term experiments, such as those at the CDR site,<br />
can be designed to be statistically robust with many replicates.<br />
This is not feasible with large-scale whole-watershed<br />
manipulations, such as those at the HBR site (figure 1). The<br />
scale <strong>of</strong> manipulations also determines the degree to which<br />
long-term experiments can serve as platforms for additional<br />
research. These are important trade<strong>of</strong>fs in design that need<br />
to be considered for future long-term experiments.<br />
We further advocate that such multisite long-term experiments<br />
should be designed in close collaboration with ecological<br />
modelers in order to alleviate the more vexing<br />
uncertainties in today’s models (Luo et al. 2011). Scenario<br />
planning (Peterson et al. 2003) can also be a valuable tool<br />
for designing experiments capable <strong>of</strong> providing information<br />
www.biosciencemag.org April 2012 / Vol. 62 No. 4 • BioScience 387
Articles<br />
relevant to stakeholders in addition to ecologists. These longterm<br />
experiments should be as large in scale as is feasible in<br />
order to permit the evaluation <strong>of</strong> ecological processes not possible<br />
in small-plot experiments (Smith et al. 2009). Designing<br />
large-scale experiments will present many unique challenges,<br />
since they are not simply big versions <strong>of</strong> the small-scale<br />
manipulations that ecologists have conducted in the past.<br />
Innovation in experimental design, statistical analysis, and<br />
engineering will be necessary. But as was noted above, with<br />
space set aside to accommodate unanticipated use, these networks<br />
<strong>of</strong> large-scale experiments would also serve as valuable<br />
research platforms for the broader ecological community. A<br />
highly coordinated and spatially extensive network <strong>of</strong> multifactor<br />
long-term experiments that adopts such a comparative<br />
approach would provide understanding and quantitative<br />
response data on ecological change at a temporal and spatial<br />
scale heret<strong>of</strong>ore unavailable to ecologists. Such a network<br />
<strong>of</strong> experiments would complement the monitoring-based<br />
approach that the emerging National Ecological Observatory<br />
Network (NEON) has adopted by providing experimentally<br />
defined units <strong>of</strong> accelerated or amplified ecological change.<br />
Data from multisite, long-term experiments can be fused<br />
with models (Luo et al. 2011) to make more-robust forecasts<br />
for a broad range <strong>of</strong> ecosystems. Such forecasts can then be<br />
tested against the real-time tracking <strong>of</strong> ecological change<br />
provided by NEON and other observatory networks—and,<br />
<strong>of</strong> course, by the <strong>LTER</strong> Network.<br />
For long-term experimental networks as they are envisioned<br />
above to be realized, it is clear that clever designs,<br />
collaborations between ecologists and sensor and infrastructure<br />
engineers (Collins et al. 2006), and efficient<br />
deployment will be necessary from both scientific and economic<br />
perspectives. But as society demands the knowledge<br />
needed to cope with and mitigate global changes, ecologists<br />
would be remiss in forgoing the opportunity to build on the<br />
legacy <strong>of</strong> long-term experiments reviewed above to meet<br />
these challenges.<br />
Acknowledgments<br />
We thank the principal investigators <strong>of</strong> the 26 Long Term<br />
Ecological Research Network sites for providing information<br />
regarding long-term experiments at their sites, Steve<br />
Carpenter and Tim Kratz for insight regarding North<br />
Temperate Lake–site experiments, and David Foster for providing<br />
editorial input and oversight. Robert Holt, Charles<br />
Driscoll, and an anonymous reviewer provided helpful comments<br />
on an earlier version <strong>of</strong> the manuscript.<br />
References cited<br />
Adair EC, Hobbie SE, Hobbie RK. 2010. Single-pool exponential decomposition<br />
models: Potential pitfalls in their use in ecological studies.<br />
Ecology 91: 1225–1236.<br />
Ashton IW, Miller AE, Bowman WD, Suding KN. 2006. Nitrogen preferences<br />
and plant-soil feedbacks as influenced by neighbors in the alpine<br />
tundra. Oecologia 156: 625–636.<br />
Báez S, Collins SL, Lightfoot D, Koontz TL. 2006. Bottom-up regulation<br />
<strong>of</strong> plant community structure in an aridland ecosystem. Ecology 87:<br />
2746–2754.<br />
Blair JM. 1997. Fire, N availability and plant response in grasslands: A test <strong>of</strong><br />
the transient maxima hypothesis. Ecology 78: 2359–2368.<br />
Bormann FH, Likens GE, Siccama TG, Pierce RS, Eaton JS. 1974. The export<br />
<strong>of</strong> nutrients and recovery <strong>of</strong> stable conditions following deforestation<br />
at Hubbard Brook. Ecological Monographs 44: 255–277.<br />
Bradford MA, Davies CA, Frey SD, Maddox TR, Melillo JM, Mohan JE,<br />
Reynolds JF, Treseder KK, Wallenstein MD. 2008. Thermal adaptation<br />
<strong>of</strong> soil microbial respiration to elevated temperature. Ecology Letters<br />
11: 1316–1327.<br />
Brown JH, Heske EJ. 1990. Control <strong>of</strong> a desert–grassland transition by a<br />
keystone rodent guild. Science 250: 1705–1707.<br />
Callahan JT. 1984. Long-term ecological research. BioScience 34:<br />
363–367.<br />
Carpenter SR. 2002. Ecological futures: Building an ecology <strong>of</strong> the long now.<br />
Ecology 83: 2069–2083.<br />
———. 2008. Emergence <strong>of</strong> ecological networks. Frontiers in Ecology 6: 228.<br />
Carpenter SR, Lathrop RC, Nowak P, Bennett EM, Reed T, Soranno PA. 2006.<br />
The ongoing experiment: Restoration <strong>of</strong> Lake Mendota and its watershed.<br />
Pages 236–256 in Magnuson JJ, Kratz TK, Benson BJ, eds. Long-<br />
Term Dynamics <strong>of</strong> Lakes in the Landscape. Oxford <strong>University</strong> Press.<br />
Chapin FS III, Shaver GR, Giblin AE, Nadelh<strong>of</strong>fer KJ, Laundre JA. 1995.<br />
Responses <strong>of</strong> arctic tundra to experimental and observed changes in<br />
climate. Ecology 76: 694–711.<br />
Clark CM, Cleland EE, Collins SL, Fargione JE, Gough L, Gross KL,<br />
Pennings SC, Suding KN, Grace JB. 2007. Environmental and plant<br />
community determinants <strong>of</strong> species loss following nitrogen enrichment.<br />
Ecology Letters 10: 596–607.<br />
Collins SL, et al. 2006. New opportunities in ecological sensing using wireless<br />
sensor networks. Frontiers in Ecology and the Environment 4:<br />
402–407.<br />
Collins SL, Fargione JE, Crenshaw CL, Nonaka E, Elliott JR, Xia Y, Pockman<br />
WT. 2010. Rapid plant community responses during the summer<br />
monsoon to nighttime warming in a northern Chihauhuan Desert<br />
grassland. Journal <strong>of</strong> Arid Environments 74: 611–617.<br />
Collins SL, et al. 2011. An integrated conceptual framework for long-term<br />
social–ecological research. Frontiers in Ecology and the Environment<br />
9: 351–357.<br />
Contosta AR, Frey SD, Cooper AB. 2011. Seasonal dynamics <strong>of</strong> soil respiration<br />
and N mineralization in chronically warmed and fertilized soils.<br />
Ecosphere 2 (3, Art. 36).<br />
Costamagna AC, Landis DA. 2006. Predators exert top-down control <strong>of</strong><br />
soybean aphid across a gradient <strong>of</strong> agricultural management systems.<br />
Ecological Applications 16: 1619–1628.<br />
Dasch AA, Blum JD, Eagar C, Fahey TJ, Driscoll CT, Siccama TG. 2006. The<br />
relative uptake <strong>of</strong> Ca and Sr into tree foliage using a whole-watershed<br />
calcium addition. Biogeochemistry 80: 21–41.<br />
Debinski DM, Holt RD. 2000. A survey and overview <strong>of</strong> habitat fragmentation<br />
experiments. Conservation Biology 14: 342–355.<br />
Franklin JF, Bledsoe CS, Callahan JT. 1990. Contributions <strong>of</strong> the long-term<br />
ecological research program. BioScience 40: 509–523.<br />
Frost TM, Fischer JM, Klug JL, Arnott SE, Montz PK. 2006. Trajectories <strong>of</strong><br />
zooplankton recovery in the Little Rock Lake whole-lake acidification<br />
experiment. Ecological Applications 16: 353–367.<br />
Foster DR, Orwig DA. 2006. Preemptive and salvage harvesting <strong>of</strong> New<br />
England forests: When doing nothing is a viable alternative. Conservation<br />
Biology 20: 959–970.<br />
Foster DR, Aber JD, Melillo JM, Bowden RD, Bazzaz FA. 1997. Forest<br />
response to disturbance and anthropogenic stress: Rethinking the 1938<br />
Hurricane and the impact <strong>of</strong> physical disturbance vs. chemical and<br />
climate stress on forest ecosystems. BioScience 47: 437–445.<br />
Gardiner MM, Landis DA, Gratton C, DiFonzo CD, O’Neal M, Chacon<br />
JM, Wayo MT, Schmidt NP, Mueller EE, Heimpel GE. 2009. Landscape<br />
diversity enhances the biological control <strong>of</strong> an introduced crop pest in<br />
the north-central U.S. Ecological Applications 19: 143–154.<br />
Gerber S, Hedin LO, Oppenheimer M, Pacala SW, Shevliakova E. 2010.<br />
Nitrogen cycling and feedbacks in a global dynamic land model. Global<br />
Biogeochemical Cycles 24 (Art. GB1001). doi:10.1029/2008GB003336<br />
388 BioScience • April 2012 / Vol. 62 No. 4 www.biosciencemag.org
Gonzalez MJ, Frost TM. 1994. Comparisons <strong>of</strong> laboratory bioassays and a<br />
whole-lake experiment: Rotifer responses to experimental acidification.<br />
Ecological Applications 4: 69–80.<br />
Harmon ME, Silver WL, Fasth B, Chen H, Burke IC, Parton WJ, Hart SC,<br />
Currie WS, LIDET. 2009. Long-term patterns <strong>of</strong> mass loss during the<br />
decomposition <strong>of</strong> leaf and fine root litter: An intersite comparison.<br />
Global Change Biology 15: 1320–1338.<br />
He Z, Xu M, Deng Y, Kang S, Kellogg L, Wu L, Van Nostrand JD, Hobbie<br />
SE, Reich PB, Zhou J. 2010. Metagenomic analysis reveals a marked<br />
divergence in the structure <strong>of</strong> belowground microbial communities at<br />
elevated CO 2 . Ecology Letters 13: 564–575.<br />
Heimpel GE, Frelich LE, Landis DA, Hopper KR, Hoelmer K, Sezen Z,<br />
Asplen MK, Wu K. 2010. European buckthorn and Asian soybean<br />
aphid as part <strong>of</strong> an extensive invasional meltdown in North America.<br />
Biological Invasions 12: 2913–2931.<br />
Herbert DA, Rastetter EB, Shaver GR, Ågren GI. 1999. Effects <strong>of</strong> plant<br />
growth characteristics on biogeochemistry and community composition<br />
in a changing climate. Ecosystems 2: 367–382.<br />
Hobbie JE, Carpenter SR, Grimm NB, Gosz JR, Seastedt TR. 2003. The US<br />
long-term ecological research program. BioScience 53: 21–32.<br />
Huggett BA, Schaberg PG, Hawley GJ, Eagar C. 2007. Long-term calcium<br />
addition increases growth release, wound closure, and health <strong>of</strong> sugar<br />
maple (Acer saccharum) trees at the Hubbard Brook Experimental<br />
Forest. Canadian Journal <strong>of</strong> Forest Research 37: 1692–1700.<br />
Janzen HH. 2009. Long-term ecological sites: Musings on the future, as seen<br />
(dimly) from the past. Global Change Biology 15: 2770–2778.<br />
Juice SM, Fahey TJ, Siccama TG, Driscoll CT, Denny EG, Eagar C, Cleavitt<br />
NL, Minocha R, Richardson AD. 2006. Response <strong>of</strong> sugar maple to calcium<br />
addition to northern hardwood forest. Ecology 87: 1267–1280.<br />
Knapp AK, Briggs JM, Hartnett DC, Collins SL. 1998. Grassland Dynamics:<br />
Long-Term Ecological Research in Tallgrass Prairie. Oxford <strong>University</strong><br />
Press.<br />
Knapp AK, et al. 2004. Searching for generality in ecology: Post-hoc<br />
synthesis <strong>of</strong> long-term data from North American grasslands and<br />
South African savannas. Frontiers in Ecology and the Environment 2:<br />
483–491.<br />
Likens GE, Driscoll CT, Buso DC. 1996. Long-term effects <strong>of</strong> acid rain:<br />
Response and recovery <strong>of</strong> a forest ecosystem. Science 272: 244–246.<br />
Lindenmayer DB, Likens GE, Krebs CJ, Hobbs RJ. 2010. Improved probability<br />
<strong>of</strong> detection <strong>of</strong> ecological “surprises.” Proceedings <strong>of</strong> the National<br />
Academy <strong>of</strong> Sciences 107: 21957–21962.<br />
Luo Y, et al. 2011. Coordinated approaches to quantify long-term ecosystem<br />
dynamics in response to global change. Global Change Biology 17:<br />
843–854.<br />
Mack MC, Schuur EAG, Bret-Harte MS, Shaver GR, Chapin FS III. 2004.<br />
Ecosystem carbon storage in arctic tundra reduced by long-term<br />
nu trient fertilization. Nature 431: 440–443.<br />
Melillo JM, Steudler PA, Aber JD, Newkirk K, Lux H, Bowles FP, Cartricala<br />
C, Magill AH, Ahrens T, Morrisseau S. 2002. Soil warming and carboncycle<br />
feedbacks to the climate system. Science 298: 2173–2176.<br />
Meserve PL, Kelt DA, Milstead WB, Gutiérrez JR. 2003. Thirteen years <strong>of</strong><br />
shifting top-down and bottom-up control. BioScience 53: 633–646.<br />
Meyer JL, Wallace JB. 2001. Lost linkages and lotic ecology: Rediscovering<br />
small streams. Pages 295–317 in Press MC, Huntly NJ, Levin S, eds.<br />
Ecology: Achievement and Challenge. Blackwell Science.<br />
Millar N, Robertson GP, Grace PR, Gehl RJ, Hoben JP. 2010. Nitrogen fertilizer<br />
management for nitrous oxide (N 2 O) mitigation in intensive corn<br />
(Maize) production: An emissions reduction protocol for US Midwest<br />
agriculture. Mitigation and Adaptation Strategies for Global Change<br />
15: 185–204.<br />
Neff JC, Townsend AR, Gleixner G, Lehman SJ, Turnbull J, Bowman WD.<br />
2002. Variable effects <strong>of</strong> nitrogen additions on the stability and turnover<br />
<strong>of</strong> soil carbon. Nature 419: 915–917.<br />
[NRC] National Research Council. 2001. Grand Challenges in Environmental<br />
Sciences. National Academies Press.<br />
Odum EP. 1977. The emergence <strong>of</strong> ecology as a new integrative discipline.<br />
Science 195: 1289–1293.<br />
Articles<br />
Pardo LH, et al. 2011. Effects <strong>of</strong> nitrogen deposition and empirical nitrogen<br />
critical loads for ecoregions <strong>of</strong> the United States. Ecological Applications<br />
21: 3049–3082.<br />
Peterson GD, Cumming GS, Carpenter SR. 2003. Scenario planning: A<br />
tool for conservation in an uncertain future. Conservation Biology 17:<br />
358–366.<br />
Rees M, Condit R, Crawley M, Pacala S, Tilman D. 2001. Long-term studies<br />
<strong>of</strong> vegetation dynamics. Science 293: 650–655.<br />
Reich PB, Hobbie SE, Lee T, Ellsworth DS, West JB, Tilman D, Knops JMH,<br />
Naeem S, Trost J. 2006. Nitrogen limitation constrains sustainability <strong>of</strong><br />
ecosystem response to CO 2 . Nature 440: 922–925.<br />
Robertson GP, et al. 2012. Long-term ecological research in a humandominated<br />
world. BioScience 62: 342–353.<br />
Slavik K, Peterson BJ, Deegan LA, Bowden WB, Hershey AE, Hobbie JE.<br />
2004. Long-term responses <strong>of</strong> the Kuparuk River ecosystem to phosphorus<br />
fertilization. Ecology 85: 939–954.<br />
Smith MD. 2011. An ecological perspective on extreme climatic events: A<br />
synthetic definition and framework to guide future research. Journal <strong>of</strong><br />
Ecology 99: 656–663.<br />
Smith MD, Knapp AK, Collins SL. 2009. A framework for assessing ecosystem<br />
dynamics in response to chronic resource alterations induced by<br />
global change. Ecology 30: 3279–3289.<br />
Solomon SD, Qin M, Manning Z, Chen M, Marquis KB, Avery T, Tignor M,<br />
Miller HL, eds. 2007. Climate Change 2007: The Physical Science Basis.<br />
Cambridge <strong>University</strong> Press.<br />
Suding KN, Miller A, Bechtold H, Bowman W. 2006. The consequences<br />
<strong>of</strong> species loss on ecosystem nitrogen cycling depends on community<br />
composition dynamics. Oecologia 149: 141–149.<br />
Syswerda SP, Basso B, Hamilton SK, Tausig JB, Robertson GP. 2012.<br />
Long-term nitrate loss along an agricultural intensity gradient in the<br />
upper Midwest USA. Agriculture, Ecosystems and Environment 149:<br />
10–19.<br />
Tilman D. 1982. Resource Competition and Community Structure.<br />
Princeton <strong>University</strong> Press.<br />
———. 1989. Ecological experimentation: Strengths and conceptual problems.<br />
Pages 136–157 in Likens GE, ed. Long-Term Studies in Ecology. Springer.<br />
———. 1996. Biodiversity: Population versus ecosystem stability. Ecology<br />
77: 350–363.<br />
Wallace JB, Eggert SL, Meyer JL, Webster JR. 1997. Multiple trophic<br />
levels <strong>of</strong> a forest stream linked to terrestrial litter inputs. Science 277:<br />
102–104.<br />
Weltzin JF, et al. 2003. Assessing the response <strong>of</strong> terrestrial ecosystems to<br />
potential changes in precipitation. BioScience 53: 941–952.<br />
Yeakley JA, Coleman DC, Haines BL, Kloeppel BD, Meyer JL, Swank WT,<br />
Argo BW, Deal JM, Taylor SF. 2003. Hillslope nutrient dynamics following<br />
upland riparian vegetation disturbance. Ecosystems 6: 154–167.<br />
Alan K. Knapp (aknapp@colostate.edu, alan.knapp@colostate.edu) is affiliated<br />
with the Graduate Degree Program in Ecology and with the Department<br />
<strong>of</strong> Biology at Colorado State <strong>University</strong>, Fort Collins. Melinda D. Smith<br />
and Kimberly J. La Pierre are affiliated with the Department <strong>of</strong> Ecology<br />
and Evolutionary Biology at Yale <strong>University</strong>, in New Haven, Connecticut.<br />
Sarah E. Hobbie is affiliated with the Department <strong>of</strong> Ecology, Evolution<br />
and Behavior at the <strong>University</strong> <strong>of</strong> Minnesota, St. Paul. Scott L. Collins is<br />
affiliated with the Department <strong>of</strong> Biology at the <strong>University</strong> <strong>of</strong> New Mexico,<br />
in Albuquerque. Timothy J. Fahey is affiliated with the Department <strong>of</strong><br />
Natural Resources at Cornell <strong>University</strong>, in Ithaca, New York. Gretchen<br />
J. A. Hansen is affiliated with the Center for Limnology at the <strong>University</strong> <strong>of</strong><br />
Wisconsin–Madison. Douglas A. Landis is affiliated with the Department <strong>of</strong><br />
Entomology and with the Great Lakes Bioenergy Research Center at Michigan<br />
State <strong>University</strong>, in East Lansing. Jerry M. Melillo and Gaius R. Shaver are<br />
affiliated with The Ecosystems Center, Marine Biological Laboratory, in Woods<br />
Hole, Massachusetts. Timothy R. Seastedt is affiliated with the Department <strong>of</strong><br />
Ecology and Evolutionary Biology and with the Institute <strong>of</strong> Arctic and Alpine<br />
Research, at the <strong>University</strong> <strong>of</strong> Colorado, Boulder. Jackson R. Webster is affiliated<br />
with the Department <strong>of</strong> Biological Sciences at Virginia Tech, Blacksburg.<br />
www.biosciencemag.org April 2012 / Vol. 62 No. 4 • BioScience 389
Articles<br />
Ecosystem Processes and Human<br />
Influences Regulate Streamflow<br />
Response to Climate Change at<br />
Long-Term Ecological Research Sites<br />
Julia a. Jones, irena F. Creed, Kendra l. HatCHer, robert J. Warren, Mary betH adaMs, Melinda H.<br />
benson, eMery boose, Warren a. broWn, JoHn l. CaMpbell, alan CoviCH, david W. CloW, CliFFord n.<br />
daHM, Kelly elder, CHelCy r. Ford, nanCy b. GriMM, donald l. HensHaW, Kelli l. larson, evan s.<br />
Miles, KatHleen M. Miles, stepHen d. sebestyen, adaM t. sparGo, asa b. stone, JaMes M. vose,<br />
and MarK W. WilliaMs<br />
Analyses <strong>of</strong> long-term records at 35 headwater basins in the United States and Canada indicate that climate change effects on streamflow are not<br />
as clear as might be expected, perhaps because <strong>of</strong> ecosystem processes and human influences. Evapotranspiration was higher than was predicted by<br />
temperature in water-surplus ecosystems and lower than was predicted in water-deficit ecosystems. Streamflow was correlated with climate variability<br />
indices (e.g., the El Niño–Southern Oscillation, the Pacific Decadal Oscillation, the North Atlantic Oscillation), especially in seasons when<br />
vegetation influences are limited. Air temperature increased significantly at 17 <strong>of</strong> the 19 sites with 20- to 60-year records, but streamflow trends were<br />
directly related to climate trends (through changes in ice and snow) at only 7 sites. Past and present human and natural disturbance, vegetation<br />
succession, and human water use can mimic, exacerbate, counteract, or mask the effects <strong>of</strong> climate change on streamflow, even in reference basins.<br />
Long-term ecological research sites are ideal places to disentangle these processes.<br />
Keywords: precipitation/run<strong>of</strong>f ratio, trend, succession, socioecological systems, Budyko curve<br />
Although many factors affect streamflow, recent concerns<br />
have been focused on the effects <strong>of</strong> climate change on<br />
streamflow. Increasing temperature, more-severe storms,<br />
advanced snowmelt, and declining snow cover are associated<br />
with increased drought and flooding (Groisman<br />
et al. 2004, Stewart et al. 2005, Huntington 2006, Barnett<br />
et al. 2008, Karl et al. 2009, McDonald et al. 2011, USDOI<br />
2011). Nevertheless, many human actions, natural disturbance<br />
effects, and ecosystem processes complicate, mitigate,<br />
and potentially counteract the climate effects on streamflow<br />
(Meybeck 2003, Jones 2011). Relevant human actions<br />
include ongoing disturbance and legacies <strong>of</strong> past disturbance,<br />
as well as global climate change. Understanding how<br />
climate change, social systems, and ecosystem processes<br />
affect streamflow is critical for mitigating conflicts between<br />
economic development and environmental conservation.<br />
Long-term studies <strong>of</strong> headwater basins, the source areas<br />
for water supplies, provide an informative starting point<br />
for understanding the effects <strong>of</strong> climate, social factors, and<br />
ecosystem processes on streamflow (figure 1). The US Forest<br />
Service (USFS) Experimental Forests and Ranges (EFRs) and<br />
the US Department <strong>of</strong> Agriculture Agricultural Research<br />
Service (ARS) established long-term studies in small basins<br />
throughout the United States beginning in the early 1900s<br />
(see supplemental table S1, available online at http://dx.doi.<br />
org/10.1525/bio.2012.62.4.10). Four EFRs (AND, CWT, HBR,<br />
LUQ; for the site-name abbreviations, see table S1) and one<br />
ARS site (JRN) became member sites <strong>of</strong> the US Long Term<br />
Ecological Research (<strong>LTER</strong>) Network as early as 1980. Some<br />
<strong>LTER</strong> Network sites also utilize streamflow records from the<br />
US Geological Survey (USGS) National Water Information<br />
Service database. Some headwater basin studies participate<br />
in the USGS Hydrologic Benchmark Network; the USGS<br />
Water, Energy, and Biogeochemical Budgets (WEBB) program;<br />
or the Canadian HydroEcological Landscapes and<br />
Processes (HELP) program. Climate and hydrologic data<br />
from many sites have been publicly available since the 1990s<br />
(www.fsl.orst.edu/climhy).<br />
BioScience 62: 390–404. ISSN 0006-3568, electronic ISSN 1525-3244. © 2012 by American Institute <strong>of</strong> Biological Sciences. All rights reserved. Request<br />
permission to photocopy or reproduce article content at the <strong>University</strong> <strong>of</strong> California Press’s Rights and Permissions Web site at www.ucpressjournals.com/<br />
reprintinfo.asp. doi:10.1525/bio.2012.62.4.10<br />
390 BioScience • April 2012 / Vol. 62 No. 4 www.biosciencemag.org
Figure 1. Selected study basins from US Long Term Ecological Research (<strong>LTER</strong>) sites, US Forest Service Experimental<br />
Forests and Ranges, and US Geological Survey (USGS) Water, Energy, and Biogeochemical Budgets (WEBB) sites.<br />
Although they are less numerous than, for example, the<br />
USGS reference sites used in studies <strong>of</strong> climate change (e.g.,<br />
P<strong>of</strong>f et al. 2007), <strong>LTER</strong> study sites provide unique insights<br />
Articles<br />
into the interacting effects <strong>of</strong> social systems, ecosystems,<br />
and climate change on hydrology. In common with all ecosystems<br />
on Earth, the study basins have a long history <strong>of</strong><br />
www.biosciencemag.org April 2012 / Vol. 62 No. 4 • BioScience 391
Articles<br />
natural disturbances and human impacts. Most <strong>of</strong> the study<br />
basins experienced no management during the period <strong>of</strong><br />
record, but all <strong>of</strong> them are experiencing succession from past<br />
human disturbances; many continue to experience natural<br />
disturbances; and a few have agriculture, forestry, or residential<br />
development. Moreover, these study sites have matching<br />
records <strong>of</strong> climate drivers and hydrologic responses<br />
from (in most cases) relatively small areas. Therefore, these<br />
sites and analyses provide a unique opportunity to compare<br />
hydrologic responses to climate drivers over multiple<br />
decades and to interpret the responses on the basis <strong>of</strong> concurrent<br />
studies <strong>of</strong> social and ecosystem processes.<br />
A conceptual model <strong>of</strong> social systems, climate,<br />
ecosystems, and water<br />
The fundamental premise <strong>of</strong> the present article is that<br />
streamflow responds to ecosystem processes, which, in<br />
turn, respond both to climate drivers and to social drivers<br />
(figure 2). Social systems are a primary driver <strong>of</strong> streamflow<br />
through human water use and regulation and may indirectly<br />
affect streamflow through human-induced climate change.<br />
However, even in headwater ecosystems lacking human<br />
residents, social factors, including population dynamics,<br />
economic development, political conflicts, and resource<br />
policies, produce ecosystem disturbances, including forest<br />
harvest or clearance, grazing, agriculture, mining, and fire.<br />
In turn, these disturbances influence ecological succession,<br />
evapotranspiration, and streamflow.<br />
Climate drivers—especially precipitation, temperature,<br />
snow and ice, and extreme events—also create ecosystem<br />
disturbances (e.g., wildfires, floods, wind and ice storms).<br />
Ecosystems continuously respond to disturbances (both<br />
human and natural) through ecological succession, and disturbances<br />
and responses differ among biomes. Ecosystems,<br />
social systems, and climate also respond to streamflow.<br />
Headwaters provide water for downstream ecosystems and<br />
communities, and ecosystem processes drive climate through<br />
evapotranspiration and energy exchange (figure 2).<br />
Social systems<br />
Economic development<br />
Political stability<br />
Demographic trends<br />
Resource policies<br />
Institutions<br />
Ecosystems<br />
Disturbance<br />
Succession<br />
Biomes<br />
Water use<br />
Streamflow<br />
Climate systems<br />
Precipitation<br />
Temperature<br />
Snow/ice dynamics<br />
Extreme events<br />
Figure 2. Conceptual model <strong>of</strong> social, ecological, and climate<br />
influences on streamflow.<br />
Many <strong>of</strong> the study sites experienced social effects on<br />
ecosystem processes prior to becoming <strong>LTER</strong> sites. Most <strong>of</strong><br />
the temperate forest in the eastern half <strong>of</strong> the United States<br />
and Canada and tropical forests in Puerto Rico experienced<br />
forest harvest, land clearance for agriculture, and grazing,<br />
followed by land abandonment (Swank and Crossley 1988,<br />
Foster and Aber 2004). Sites in the southwestern United<br />
States experienced intensive grazing <strong>of</strong> domestic animals<br />
during the past four centuries (Peters et al. 2006). Boreal<br />
forest, temperate wet forest, and tundra sites experienced<br />
varying fire regimes, mostly driven by climate but, in some<br />
cases, affected by prehistoric peoples (e.g., Weisberg and<br />
Swanson 2003). Some sites contain agriculture, forestry, and<br />
urban development.<br />
In this study, we primarily examine the relationship between<br />
climate and streamflow on the basis <strong>of</strong> energy exchange. In<br />
cases in which streamflow behavior cannot be explained<br />
purely by climate, other hydrologic processes, as well as past<br />
and present human and natural disturbance effects on ecosystems,<br />
are considered as possible explanations.<br />
Study sites and questions<br />
In this study, we examined long-term records <strong>of</strong> air temperature<br />
(T), precipitation (P), and streamflow (Q) from<br />
35 basins at US <strong>LTER</strong> Network sites, USFS EFRs, USGS<br />
WEBB sites, and Canadian sites (table S1, figure 3a, 3b).<br />
The study sites were headwater basins that have mostly<br />
experienced no management since their records began.<br />
Nevertheless, the study basins have undergone succession in<br />
response to earlier natural or human disturbance, and some<br />
basins experienced natural disturbance during the periods<br />
<strong>of</strong> record. The records <strong>of</strong> T, P, and Q were obtained from<br />
the US <strong>LTER</strong> Network’s Climate and Hydrology Database<br />
Projects (ClimDB/HydroDB; http://climhy.lternet.edu), supplemented<br />
by USGS streamflow data (http://co.water.usgs.<br />
gov/lochvale, http://ny.cf.er.usgs.gov/hbn) and data from the<br />
Canadian HELP program (table S1).<br />
The study basins ranged from 0.1 to 10,000 square kilometers;<br />
2 were less than 10 hectares (ha), 5 were 10–100 ha;<br />
10 were 100–1000 ha; 5 were 1000–10,000 ha; 8 were<br />
10,000–100,000 ha; 2 were 100,000–1 million ha; and 2 were<br />
undefined (FCE, MCM; see table S1). The two largest basins<br />
were near ARC and GCE; eight additional large basins are<br />
located in the vicinity <strong>of</strong> CAP, HFR, JRN, KBS, NTL, OLY,<br />
PIE, and SEV. The smallest basins (smaller than 100 ha) are<br />
mostly associated with USFS or Canadian sites, at AND, BES,<br />
CWT, DOR, FER, HBR, MAR, and TLW.<br />
The study sites represent many biomes (potential vegetation)<br />
(figure 4). More than half <strong>of</strong> the sites were temperate<br />
forest (CAS, CWT, DOR, HBR, HFR, FER, KEJ, MAR,<br />
MRM, NTL, PIE, TLW), temperate wet forest (AND, CAR,<br />
MAY, OLY), and boreal forest (ELA, FRA, LVW, TEN,<br />
UPC). The remainder includes tundra or cold desert (ARC,<br />
MCM, NWT), warm desert (CAP, JRN, SEV), cool desert or<br />
woodland (BNZ), woodland or grassland (BES, FCE, GCE,<br />
KBS, KNZ, SBC), and tropical rainforest (LUQ). Actual<br />
392 BioScience • April 2012 / Vol. 62 No. 4 www.biosciencemag.org
a<br />
b<br />
ARC<br />
BNZ<br />
Legend<br />
Data analysis<br />
Budyko<br />
Trend<br />
Oscillations<br />
MAY<br />
CAR<br />
CAR<br />
CAR<br />
CAS<br />
ARC<br />
BNZ<br />
MAY<br />
CAR<br />
CAR<br />
CAR<br />
CAS<br />
UPC<br />
OLY<br />
AND<br />
SBC CAP<br />
OLY<br />
UPC<br />
AND<br />
SBC CAP<br />
Average annual P−PET (mm)<br />
< 49<br />
600–799<br />
50–99 800–999<br />
100–199 1000–1999<br />
200–399 2000–2999<br />
400–599 > 3.000<br />
MRM<br />
TEN<br />
LVW NWT<br />
FRA<br />
MRM<br />
SEV<br />
JRN<br />
TEN<br />
LVW NWT<br />
FRA<br />
SEV<br />
JRN<br />
ELA<br />
MAR<br />
KNZ<br />
KNZ<br />
NTL<br />
ELA<br />
MAR<br />
NTL<br />
KEJ<br />
TLW DOR<br />
HBR<br />
HFR<br />
KBS<br />
PIE<br />
BES<br />
FER<br />
BES<br />
FER<br />
Articles<br />
www.biosciencemag.org April 2012 / Vol. 62 No. 4 • BioScience 393<br />
GCE<br />
TLW<br />
GCE<br />
CWT<br />
FCE<br />
DOR<br />
HFR<br />
KBS<br />
PIE<br />
FER<br />
BES<br />
CWT<br />
FCE<br />
KEJ<br />
HBR<br />
Figure 3. (a) Map <strong>of</strong> sites used in this analysis. The study-site characteristics and abbreviations are in supplemental table S1,<br />
available online at http://dx.doi.org/10.1525/bio.2012.62.4.10. The symbols indicate which <strong>of</strong> the three analyses (Budyko<br />
curve, trends, and correlation with climate indices [oscillations]) were conducted with data from that site. (b) Map <strong>of</strong> average<br />
annual precipitation (P) minus potential evapotranspiration (PET) in millimeters (mm) with study-site locations.<br />
LUQ<br />
LUQ
Articles<br />
Figure 4. Mean annual temperature, mean annual<br />
precipitation, and biomes <strong>of</strong> the study sites. The studysite<br />
abbreviations are in supplemental table S1, available<br />
online at http://dx.doi.org/10.1525/bio.2012.62.4.10. Data<br />
for the MCM site are not shown. Abbreviations: °C, degrees<br />
Celsius; mm, millimeters.<br />
and potential vegetation may differ because <strong>of</strong> disturbance<br />
(table S1).<br />
In our analyses, we examined three questions, using<br />
successively more-stringent requirements <strong>of</strong> data sets and<br />
interpreted these results in the light <strong>of</strong> ecological and social<br />
factors: (1) How is potential evapotranspiration (PET)<br />
related to actual evapotranspiration (AET) at each site, and<br />
how do these relationships compare with the theoretical<br />
Budyko curve (n = 30 sites)? (2) How is streamflow correlated<br />
with climate indices (e.g., the El Niño–Southern<br />
Oscillation [ENSO], the Pacific Decadal Oscillation [PDO],<br />
the North Atlantic Oscillation [NAO]; n = 21 sites)? (3) How<br />
have temperature, precipitation, and streamflow changed<br />
over time (n = 19 sites)?<br />
Energy- and water-balance relationships to observed<br />
water use<br />
The values <strong>of</strong> T, P, and Q from 30 sites with matched T, P, and<br />
Q (table S1, figure 3) were used to calculate PET and AET<br />
(i.e., P – Q). These values were plotted on the Budyko curve<br />
(Budyko 1974), which displays the relationship between<br />
PET and AET, each indexed by P (figure 5a). Thirty <strong>of</strong> the<br />
35 sites had data on T, P, Q, and basin area for a common<br />
10-year period (1993–2002), although a slightly adjusted<br />
period was used for 10 <strong>of</strong> the sites (figure 5b). PET was<br />
calculated from T (after Hamon 1963) on the basis <strong>of</strong> the<br />
number <strong>of</strong> daylight hours, mean monthly temperature, and<br />
the saturated vapor pressure. Annual PET was calculated as a<br />
sum <strong>of</strong> monthly values. The Budyko curve assumes that the<br />
water balance is Q = P – ET (evapotranspiration), with no<br />
significant losses to or gains from groundwater, and that the<br />
basins are at steady state, unaffected by vegetation dynamics<br />
(Donohue et al. 2007).<br />
The distribution <strong>of</strong> study basins on the Budyko curve<br />
reveals that observed water use in ecosystems in small basins<br />
deviated systematically from its expected dependence on<br />
energy and water balances. As was expected, observed ecosystem<br />
water use (AET ÷ P) was positively correlated to energy<br />
and water inputs to evapotranspiration (PET ÷ P) in sites<br />
with a water surplus (P ÷ PET) and insensitive to increases<br />
in energy at sites with a water deficit (P ÷ PET), following<br />
the theoretical Budyko curve (figure 5b). However, only 7 <strong>of</strong><br />
30 sites (ARC, DOR, FRA, HBR, KEJ, KNZ, and OLY) fell<br />
on the Budyko curve, where observed water use (AET ÷ P)<br />
was equal to predicted water use (PET ÷ P) (fi gure 5b). Of<br />
the 19 sites with a moisture surplus (P ÷ PET) that did not<br />
fall on the Budkyo curve, 14 were above it, with higher than<br />
expected evapotranspiration (AET ÷ P > PET ÷ P). Of the<br />
five sites with moisture deficits (P < PET), four fell below the<br />
Budyko curve, with lower than expected evapotranspiration<br />
(AET ÷ P < PET ÷ P) (figure 5b).<br />
This result may indicate that ecosystems evaporate, transpire,<br />
and store more water than would be expected on the<br />
basis <strong>of</strong> temperature and day length at wet sites and less than<br />
would be expected at dry sites. Ecosystem structure (e.g.,<br />
rooting depth, leaf area) and processes (e.g., adaptations to<br />
water deficits) may produce lower streamflow in wet sites and<br />
higher streamflow in dry sites than would be predicted from<br />
energy and water balances alone. However, other factors may<br />
also explain the departures <strong>of</strong> the sites from the theoretical<br />
Budyko curve. For instance, the PET value estimated from<br />
climate-station T records may not represent PET over entire<br />
basins, especially in mountain sites (e.g., AND, NWT, LVW).<br />
AET ÷ P is also considerably overestimated from P – Q<br />
in basins in which the groundwater recharge bypasses the<br />
stream gauge (Graham et al. 2010, Verry et al. 2011).<br />
When the annual values <strong>of</strong> T, P, and Q are plotted on the<br />
Budkyo curve, the interannual variation <strong>of</strong> AET relative<br />
to PET varies among biomes (figure 5c, 5d). Variation in<br />
AET ÷ P was less than in PET ÷ P at the desert sites (CAP,<br />
SEV) and at forested sites (AND, CAS, CWT, FER, HBR,<br />
MAR, NTL) (figure 5d). In contrast, at alpine sites (LVW,<br />
NWT), the interannual variation in AET ÷ P was large relative<br />
to the variation in PET ÷ P. This behavior <strong>of</strong> sites relative<br />
to the Budyko curve implies that ecosystems are capable <strong>of</strong><br />
adjusting AET to compensate for climate variability at desert,<br />
grassland, and forest sites, but less so at alpine sites.<br />
Ecosystems have more-similar rates <strong>of</strong> net primary productivity<br />
per unit precipitation in dry than in wet years<br />
(Huxman et al. 2004). Comparisons <strong>of</strong> long-term AET and<br />
PET from study basins to the theoretical Budyko curve<br />
(figure 5) suggest that AET varies in a narrower range than<br />
would be expected from energy and water balances alone,<br />
which underscores the importance <strong>of</strong> ecosystem process<br />
effects on streamflow.<br />
394 BioScience • April 2012 / Vol. 62 No. 4 www.biosciencemag.org
a<br />
Evaporative index (actual<br />
evapotranspiration ÷ precipitation (AET÷P))<br />
c<br />
Actual evapotranspiration ÷ precipitation<br />
1.6<br />
1.4<br />
1.2<br />
1.0<br />
0.8<br />
0.6<br />
0.4<br />
Water limit<br />
Energy limit<br />
Budyko curve<br />
0.2<br />
PET÷P1<br />
0.0<br />
energy limited water limited<br />
0.0 0.2 0.4 0.6 0.8 1.0 1.2 1.4 1.6 1.8 2.0<br />
Dryness index (potential evapotranspiration ÷ precipitation (PET÷P))<br />
1.2<br />
1.0<br />
0.8<br />
0.6<br />
0.4<br />
0.2<br />
−0.2<br />
BA<br />
SBC<br />
BNZ<br />
A<br />
SEV<br />
CAP<br />
0.0<br />
0.0 1.0 2.0 3.0 4.0 5.0 6.0 7.0 8.0 9.0 10.0 11.0 12.0<br />
Potential evapotranspiration ÷ precipitation<br />
Streamflow and regional climate oscillations<br />
We examined the relationship <strong>of</strong> three climate indices<br />
(ENSO, PDO, and NAO) to Q at 21 sites (tables S1 and S2).<br />
These indices measure multiyear or multidecadal oscillations<br />
<strong>of</strong> sea-surface temperatures and atmospheric-pressure<br />
differentials in the east–central tropical Pacific (ENSO), the<br />
northern Pacific (PDO), and the northern Atlantic (NAO).<br />
They are correlated with local and regional temperature,<br />
precipitation, and streamflow in the United States (Cayan<br />
et al. 1999, Barlow et al. 2001, Enfield et al. 2001). The sites<br />
included in this analysis had fewer than10 years <strong>of</strong> continuous<br />
(monthly) Q at one or more gauging stations, separated<br />
A<br />
Actual evapotranspiration ÷ precipitation<br />
Actual evapotranspiration ÷ precipitation<br />
ELA MARNTLBES<br />
GCE<br />
CAS<br />
TEN<br />
FER<br />
TLW<br />
CWT<br />
ARC<br />
AND<br />
UPC<br />
CAR<br />
KBS<br />
PIE<br />
MRM<br />
NWT<br />
DOR<br />
FRA<br />
OLY<br />
LVW<br />
KEJ<br />
HBR<br />
LUQ<br />
KNZ SBC BNZ<br />
Articles<br />
into a cool season (November–April) and a warm season<br />
(May–October). Correlated streamflow records (Pearson’s<br />
r > .80) were pooled at study sites with multiple stream<br />
gauges. Climate indices were obtained from online databases<br />
(NAO, www.cgd.ucar.edu/cas/jhurrell/indices.html; ENSO,<br />
www.cdc.noaa.gov/ClimateIndices/List; PDO, www.esrl.noaa.<br />
gov/psd/data/correlation/pdo.data). The streamflow–climate<br />
oscillation relationships were tested using generalized least<br />
squares models with autoregressive moving average functions;<br />
the models were evaluated with the Durbin–Watson test<br />
statistic and Akaike’s information criterion. The results are<br />
shown as the sign (+ or –) <strong>of</strong> the relationship <strong>of</strong> streamflow<br />
www.biosciencemag.org April 2012 / Vol. 62 No. 4 • BioScience 395<br />
b<br />
d<br />
1.0<br />
SEV<br />
P−PET<br />
CAP<br />
Articles<br />
to climate oscillation variables that were significant at<br />
a < .10 in the models (table S2).<br />
The cool-season (November–April) and warm-season<br />
(May–October) streamflow values were significantly correlated<br />
with at least one climate index or interaction term<br />
at all sites except FRA, KNZ, NWT, and PIE (table S2).<br />
Significant correlations <strong>of</strong> streamflow were more frequent<br />
with ENSO (11, plus six interactions) and PDO (10, plus<br />
one interaction) than with NAO (4, plus six interactions)<br />
(table S2). Significant correlations were also slightly more<br />
frequent in winter (18) than in summer (14). These findings<br />
extend Greenland and colleagues’ (2003) analysis <strong>of</strong> climate<br />
indices, temperature, and precipitation at US <strong>LTER</strong> Network<br />
sites and corroborate the results <strong>of</strong> other studies. Molles<br />
and Dahm (1990) noted that streamflow in two rivers in<br />
New Mexico was significantly higher during El Niño (warm<br />
sea-surface temperatures in the eastern Pacific) than during<br />
La Niña conditions. Cayan and colleagues (1999) showed<br />
that days with high daily precipitation and streamflow<br />
were more frequent than average in the US Southwest and<br />
less frequent in the Northwest during El Niño by examining<br />
effects on snowpack accumulation and the subsequent<br />
melt. Enfield and colleagues (2001) found that sea-surface<br />
temperatures in the northern Atlantic are correlated with<br />
those in the northern Pacific and are associated with variations<br />
in streamflow in the Mississippi River and in Florida.<br />
Sea-surface temperature and pressure anomalies originating<br />
in the North Pacific affect cyclonic circulation over the East<br />
Coast and summer precipitation, streamflow, and drought<br />
(Barlow et al. 2001).<br />
These findings underscore the importance <strong>of</strong> separating<br />
the effects on streamflow <strong>of</strong> climate variability from longterm<br />
trends. Because the ENSO oscillation has a wavelength<br />
<strong>of</strong> 2–7 years, trends in climate and streamflow data sets over<br />
fewer than 20 years may simply reflect ENSO. Similarly, the<br />
PDO has a wavelength <strong>of</strong> 4–16 years (MacDonald et al. 2005),<br />
with mostly negative PDO in the 1950s to the mid-1970s<br />
and mostly positive PDO from 1976 to 1998. The NAO was<br />
predominantly negative between the 1950s and the early<br />
1970s and was mostly positive between the 1980s and the<br />
early 1990s. As a result, climate and streamflow trends from<br />
the 1950s to 2000 may be strongly affected by these climate<br />
oscillations. For example, at ARC, streamflow increased<br />
between 1988 and 2003, but declined between 1988 and 2008,<br />
so lengthening the record shifted the direction <strong>of</strong> apparent<br />
change. The lack <strong>of</strong> statistically significant increases in<br />
minimum temperature at the tundra ARC and boreal forest<br />
LVW sites (see the next section) may also be attributed to<br />
confounding effects <strong>of</strong> climate oscillations on these relatively<br />
short-term records.<br />
Climate oscillations influence ecosystem processes<br />
through streamflow and moisture. Streamflow was slightly<br />
more weakly correlated to climate indices in summer than<br />
in winter, perhaps because precipitation and streamflow are<br />
more closely related when ecosystems are dormant. ENSO<br />
is linked to aquatic-community structure in the Southwest<br />
(Sponseller et al. 2010), PDO is related to salmon returns<br />
in the Northwest (Mantua et al. 1997), and NAO is linked<br />
to stream salamander abundance in the Southeast (Warren<br />
and Bradford 2010). Headwater streamflow records are<br />
just beginning to be long enough to relate climate variability<br />
and trends to ecosystem processes and population<br />
dynamics.<br />
Climate and streamflow trends at long-term<br />
headwater basin study sites<br />
Nineteen sites had long-term records suitable for testing<br />
trends in T, P, and Q (table S1). Sites were included in the<br />
analysis if they had overlapping records <strong>of</strong> T, P, and Q<br />
that exceeded 20 years. The climate and streamflow record<br />
lengths used for trend estimation ranged from 20 to just<br />
over 60 years; five were 20–30 years; one was 30–40 years;<br />
four were 40–50 years; seven were 50–60 years; and two<br />
were more than 60 years (table S1). The records exceeding<br />
40 years are from USGS gauges and nearby climate stations<br />
(CAP, GCE, JRN, OLY, SBC, SEV), USFS EFRs that became<br />
US <strong>LTER</strong> Network sites (AND, CWT, HBR), other <strong>LTER</strong><br />
Network sites (HFR), and USFS EFRs (FER, MAR) that<br />
did not become <strong>LTER</strong> Network sites. The records less than<br />
40 years in length were USGS gauges and nearby climate<br />
stations at <strong>LTER</strong> Network sites, WEBB sites, and EFRs (ARC,<br />
FRA, LUQ, LVW, NTL, and NWT).<br />
Interannual trends in minimum and maximum daily T,<br />
P, Q, and run<strong>of</strong>f ratios (Q:P) were estimated using linear<br />
regression and the Mann–Kendall nonparametric trend test<br />
(Helsel and Hirsch 2002). In these analyses, we used the<br />
period <strong>of</strong> record or from 1950 onward. Linear regressions<br />
and Mann–Kendall tests produced almost identical results<br />
(Hatcher 2011). The water year was defined as 1 October to<br />
30 September. Tests were conducted using daily data. The<br />
daily P and Q values were log transformed before analysis.<br />
Data were tested for autocorrelation before analysis, and<br />
residuals from linear regression analyses were also tested<br />
for autocorrelation. Significant trends in annual T, P, and Q<br />
were defined as 10 or more days (out <strong>of</strong> 365) with significant<br />
trends (at a � .025) and no autocorrelation before regression<br />
or in the residuals, and an average slope <strong>of</strong> the trend in<br />
daily values exceeding its standard error.<br />
Annual minimum or maximum daily temperature<br />
increased significantly at 17 <strong>of</strong> the 19 sites (minimum temperatures<br />
increased at 13 sites and maximum temperatures<br />
increased at 7 sites), but only two sites experienced significant<br />
changes in precipitation over the period <strong>of</strong> available<br />
record (figure 6). Minimum daily temperatures increased by<br />
several degrees Celsius since 1980 at NWT and FRA, highelevation,<br />
snow-dominated sites in the Rocky Mountains,<br />
but not at the other high-elevation Rocky Mountain site<br />
(LVW). Minimum daily temperature also increased by several<br />
degrees Celsius since the 1950s at climate stations near<br />
JRN and SEV in New Mexico, since the 1950s at a southeastern<br />
temperate forest site (CWT), and since the 1960s<br />
at a northern hardwood site (MAR) but not at its neighbor<br />
396 BioScience • April 2012 / Vol. 62 No. 4 www.biosciencemag.org
Annual precipitation (mm)<br />
4000<br />
3500<br />
3000<br />
2500<br />
2000<br />
1500<br />
1000<br />
500<br />
a<br />
0<br />
−15.0 −10.0 −5.0 0.0 5.0 10.0 15.0 20.0 25.0<br />
Minimum daily temperature (°C)<br />
1950 est<br />
1960 est<br />
1970 est<br />
1980 est<br />
1990 est<br />
2010 est<br />
(NTL, for which the record began in 1990). Mean annual<br />
precipitation increased significantly at LUQ and NWT. The<br />
first day <strong>of</strong> spring (defined as the last day <strong>of</strong> freezing temperature)<br />
moved earlier by between 0.31 and 1.98 days per<br />
year—that is, by more than 15 days in 50 years—at eight<br />
sites (AND, ARC, CWT, FER, FRA, HBR, LUQ, MAR, NWT)<br />
(Hatcher 2011).<br />
Run<strong>of</strong>f ratios (Q:P) changed at 8 <strong>of</strong> 19 sites (figure 6b).<br />
Tundra and boreal forest sites with ice and permafrost (LVW,<br />
NWT) experienced increases in run<strong>of</strong>f ratios, and so did<br />
temperate deciduous forest sites in the northeastern United<br />
States (HBR, HFR, PIE), which have a seasonal snowpack. An<br />
increase in run<strong>of</strong>f ratio means either that AET has decreased,<br />
or that there is a net addition <strong>of</strong> water to the system, such as<br />
from melting ice or interbasin water transfers. The observed<br />
increases in run<strong>of</strong>f ratios at LVW and NWT may be associated<br />
with the melt <strong>of</strong> ice, snow, and permafrost in response<br />
to warming temperatures during seasons in which these<br />
ecosystems are dormant (not taking up water). However,<br />
warming did not result in increased run<strong>of</strong>f ratios at other<br />
sites with permafrost (ARC, which has a short record) or<br />
seasonal snowpacks (e.g., AND, FRA, MAR, NTL). Run<strong>of</strong>f<br />
Articles<br />
1950 est<br />
1960 est<br />
1970 est<br />
1980 est<br />
1990 est<br />
2010 est<br />
.1<br />
0<br />
A CAP<br />
−10.0 −5.0 0.0 5.0 10.0 15.0 20.0 25.0 30.0 35.0<br />
ratios did not change at most other sites, which mostly lack<br />
significant snow and ice (Hatcher 2011).<br />
Streamflow changes vary according to the season and differ<br />
among various biomes (figure 7). At undisturbed desert<br />
sites in Arizona (CAP) and New Mexico (SEV), streamflow<br />
did not change at any time <strong>of</strong> year (figure 7a, 7b). However,<br />
in a desert mountain basin northeast <strong>of</strong> JRN (New Mexico)<br />
and in a semiarid mountain basin near SBC (southern<br />
California) containing residential and urban development,<br />
streamflow increased during low-flow periods (figure 7c,<br />
7d). In a large basin in coastal <strong>Georgia</strong> containing agriculture<br />
and forest plantations (GCE), streamflow declined in<br />
early and late summer (figure 7e).<br />
At tundra sites on the North Slope <strong>of</strong> Alaska and in the<br />
Rocky Mountains (ARC, NWT; figure 7f, 7g), streamflow<br />
increased in early spring and late fall, during time periods<br />
adjacent to freezing periods. Streamflow increased in spring<br />
at boreal forest sites in the Rocky Mountains (FRA, LVW;<br />
figure 7h, 7i). At a temperate forest site in western North<br />
Carolina (CWT), where seasonal snowpacks do not form,<br />
streamflow did not change at any time <strong>of</strong> year (figure 7j), but<br />
at a temperate forest site in West Virginia (FER), streamflow<br />
www.biosciencemag.org April 2012 / Vol. 62 No. 4 • BioScience 397<br />
Run<strong>of</strong>f ratio (discharge:precipitation)<br />
1<br />
.9<br />
.8<br />
.7<br />
.6<br />
.5<br />
.4<br />
.3<br />
.2<br />
b<br />
Maximum daily temperature (°C)<br />
Figure 6. (a) Multidecade trends in minimum daily temperature (in degrees Celsius [°C]) and precipitation (in millimeters<br />
[mm]) at long-term watershed study sites. Each site is designated by the minimum daily temperature and precipitation<br />
at the beginning and end <strong>of</strong> the decades spanning the period <strong>of</strong> record, based on the statistically significant trend<br />
in that variable over the period <strong>of</strong> record. The initial observation is connected to or contained within the 2010<br />
estimated (est) observation for each site. The radius <strong>of</strong> the 2010 estimated symbol is 0.5°C and 125 mm. Statistically<br />
significant increases in minimum daily temperature occurred at all sites except ARC, CAP, JRN, PIE, and SEV<br />
(the study-site characteristics and abbreviations are in supplemental table S1, available online at http://dx.doi.<br />
org/10.1525/bio.2012.62.4.10). Statistically significant changes in annual precipitation occurred only at LUQ and<br />
NWT. (b) Multidecade trends in maximum daily temperature and run<strong>of</strong>f ratios at long-term watershed study sites.<br />
Each site is designated by the maximum daily temperature and run<strong>of</strong>f ratio at the beginning and end <strong>of</strong> the decades<br />
spanning the period <strong>of</strong> record, based on the trend in that variable over the period <strong>of</strong> record. The initial observation is<br />
connected to or contained within the 2010 estimated observation for each site. The radius <strong>of</strong> the 2010 estimated symbol<br />
is 0.5°C and .0125. Statistically significant increases in maximum daily temperature occurred at CAP, FRA, JRN, LUQ,<br />
NWT, and SEV. Statistically significant changes in annual streamflow occurred at FER, GCE, HFR, HBR, JRN, LVW,<br />
MAR, NWT, NTL, PIE, and SEV.
Articles<br />
Proportion change per year<br />
relative to the mean daily flow<br />
Proportion change per year<br />
relative to the mean daily flow<br />
Proportion change per year<br />
relative to the mean daily flow<br />
Proportion change per year<br />
relative to the mean daily flow<br />
Proportion change per year<br />
relative to the mean daily flow<br />
a b<br />
CAP – Sycamore Creek – 1961–2010<br />
SEV – Jemez River – 1954–2010<br />
.10<br />
.015<br />
.05<br />
.00<br />
.01<br />
.005<br />
.00<br />
−.05<br />
−.005<br />
−.01<br />
O N D J F M A M J J A S O<br />
−.01<br />
O N D J F M A M J J A S O<br />
Month<br />
Month<br />
c JRN – Rio Ruidoso – 1950–2010<br />
d SBC – San Jose Creek – 1950–2010<br />
.015<br />
.08<br />
.01<br />
.06<br />
.005<br />
.04<br />
.00<br />
.02<br />
−.005<br />
.00<br />
−.01<br />
−.02<br />
−.015<br />
O N D J F M A M J J A S O<br />
−.04<br />
O N D J F M A M J J A S O<br />
Month<br />
Month<br />
e GCE – Ohoopee River – 1950–2009<br />
f ARC – Kuparuk River – 1971–2010<br />
.02<br />
.20<br />
.01<br />
.15<br />
.10<br />
.00<br />
.05<br />
−.01<br />
.00<br />
−.05<br />
−.02<br />
−.10<br />
−.03<br />
O N D J F M A M J J A S O<br />
−.15<br />
O N D J F M A M J J A S O<br />
Month<br />
Month<br />
g<br />
NWT – Green Lake 4 – 1981–2008<br />
FRA – East Saint Louis – 1976–2005<br />
.10<br />
.04<br />
.05<br />
.03<br />
.02<br />
.00<br />
.01<br />
−.05<br />
.00<br />
−.01<br />
−.10<br />
−.02<br />
−.15<br />
O N D J F M A M J J A S O<br />
−.03<br />
O N D J F M A M J J A S O<br />
Month<br />
Month<br />
i LVW – Loch Vale out let – 1984–2010<br />
j<br />
CWT – WS18 – 1950–2009<br />
.10<br />
.015<br />
.001<br />
.05<br />
.005<br />
.00<br />
.000<br />
−.005<br />
−.05<br />
−.010<br />
−.10<br />
O N D J F M A M J J A S O<br />
−.015<br />
O N D J F M A M J J A S O<br />
Month<br />
Month<br />
Figure 7. Daily changes in streamflow at 19 US Long Term Ecological Research sites, US Forest Service Experimental<br />
Forests and Ranges, and US Geological Survey Water, Energy, and Biogeochemical Budgets sites arranged by biome (from<br />
figure 4) as a function <strong>of</strong> the day <strong>of</strong> the water year (1 October to 30 September). (a–c) Desert sites (CAP, SEV, JRN);<br />
(d), (e) savanna sites (SBC, GCE); (f), (g) tundra sites (ARC, NWT); (h), (i) boreal forest sites (FRA, LVW); (j–p) temperate<br />
forest sites (CWT, FER, HFR, HBR, MAR, NTL, PIE); (q), (r) wet temperate forest sites (AND, OLY); (s) wet tropical<br />
forest site (LUQ). The vertical axis and the green line are the slope <strong>of</strong> regression <strong>of</strong> log-transformed streamflow for each<br />
day <strong>of</strong> the water year over the period <strong>of</strong> record (see supplemental table S1, available online at http://dx.doi.org/10.1525/<br />
bio.2012.62.4.10). The vertical axis units are the proportion change per year relative to the mean daily flow. The<br />
percentage change can be calculated as (1 + p) n , where p is the proportion change and n is the number <strong>of</strong> years. Note the<br />
different vertical axis scales. The horizontal black line represents no change (a proportion change <strong>of</strong> 0); the wiggly black<br />
lines are the upper and lower bounds on the 97.5% confidence interval. The red dots represent significant increases, and<br />
the blue dots represent significant decreases in daily streamflow, where a � .025.<br />
398 BioScience • April 2012 / Vol. 62 No. 4 www.biosciencemag.org<br />
Proportion change per year<br />
relative to the mean daily flow<br />
Proportion change per year<br />
relative to the mean daily flow<br />
Proportion change per year<br />
relative to the mean daily flow<br />
Proportion change per year<br />
relative to the mean daily flow<br />
Proportion change per year<br />
relative to the mean daily flow<br />
h
Proportion change per year<br />
relative to the mean daily flow<br />
Proportion change per year<br />
relative to the mean daily flow<br />
Proportion change per year<br />
relative to the mean daily flow<br />
Proportion change per year<br />
relative to the mean daily flow<br />
k<br />
increased in the summer (figure 7k). Winter streamflow<br />
increased at three temperate forest sites in New England (HFR,<br />
HBR, PIE) and declined at one (NTL) (figure 7l, 7m, 7o, 7p).<br />
In addition, streamflow increased in March and decreased<br />
in April at HBR (figure 7m), and it increased in March and<br />
declined in summer at MAR (figure 7n). At wet temperate forest<br />
sites in Oregon (AND, OLY), streamflow declined in spring<br />
(figure 7q, 7r). Streamflow did not change at any time <strong>of</strong> year<br />
at a wet tropical forest site in Puerto Rico (LUQ) (figure 7s).<br />
PIE – Ipswich River – 1938–2010<br />
Articles<br />
.08<br />
FER – WS4 – 1952–2007<br />
.06<br />
HFR – Swift River – 1964–2010<br />
.06<br />
.04<br />
.04<br />
.02<br />
.02<br />
.00<br />
.00<br />
−.02<br />
−.02<br />
−.04<br />
−.04<br />
O N D J F M A M J J A S O<br />
−.06<br />
O N D J F M A M J J A S O<br />
Month<br />
Month<br />
m<br />
−.02<br />
O N D J F M A<br />
Month<br />
M J J A S O<br />
Social, ecological, and climate factors influencing<br />
streamflow trends<br />
Multiple social and ecological factors may explain the<br />
streamflow trends at long-term headwater basin sites, even<br />
though humans do not directly affect most <strong>of</strong> these sites<br />
( figure 2). Economic development, population growth, and<br />
the use <strong>of</strong> fossil-fuel resources have increased atmospheric<br />
carbon dioxide, warmed the Earth, contributed to more-<br />
intense precipitation events, and increased evapotranspiration<br />
www.biosciencemag.org April 2012 / Vol. 62 No. 4 • BioScience 399<br />
Proportion change per year<br />
relative to the mean daily flow<br />
Proportion change per year<br />
relative to the mean daily flow<br />
.02<br />
AND – WS2 – 1958–2009<br />
.03<br />
OLY – Hoko River near Sekiu – 1962–2009<br />
.01<br />
.02<br />
.00<br />
.01<br />
.00<br />
−.01<br />
−.01<br />
−.02<br />
−.02<br />
−.03<br />
O N D J F M A M J J A S O<br />
−.03<br />
O N D J F M A M J J A S O<br />
Month<br />
Month<br />
Proportion change per year<br />
relative to the mean daily flow<br />
.04<br />
.02<br />
.00<br />
−.02<br />
−.04<br />
Proportion change per year<br />
relative to the mean daily flow<br />
Proportion change per year<br />
relative to the mean daily flow<br />
.04<br />
HBR – WS3 – 1958–2007<br />
.10<br />
MAR – S2 – 1961–2009<br />
.03<br />
.05<br />
.02<br />
.01<br />
.00<br />
.00<br />
−.05<br />
−.01<br />
−.10<br />
−.02<br />
O N D J F M A M J J A S O<br />
−.15<br />
O N D J F M A M J J A S O<br />
Month<br />
Month<br />
.01<br />
.00<br />
−.01<br />
−.02<br />
−.03<br />
−.04<br />
−.05<br />
−.06<br />
o<br />
O N D J F M A M J J A S O<br />
Month<br />
Figure 7. (Continued)<br />
NTL – Trout River near Trout Lake – 1990–2010<br />
.03<br />
.02<br />
.01<br />
.00<br />
−.01<br />
q r<br />
s<br />
LUQ – Espiritu Santo – 1975–2009<br />
−.06<br />
O N D J F M A<br />
Month<br />
M J J A S O<br />
l<br />
n<br />
p
Articles<br />
(Min et al. 2011, Pall et al. 2011), which in turn have been<br />
linked to increased flooding and drought (Barnett et al.<br />
2008, Karl et al. 2009). Yet direct climate-trend effects on<br />
streamflow in headwater basins may be mitigated by ecological<br />
processes, including disturbance, succession, and<br />
vegetation adaptations to water scarcity. In many cases, the<br />
vegetation—and, therefore, evapotranspiration in headwater<br />
basins—is affected by human activities, such as past<br />
logging, grazing, agriculture, and fire suppression. Moreover,<br />
in some headwater basins, land-use changes, including agriculture<br />
and exurban expansion, may mitigate or overwhelm<br />
climate-trend effects on streamflow.<br />
Some observed trends in streamflow appear to be direct<br />
effects <strong>of</strong> climate trends. For example, increased streamflow<br />
in fall and spring at ARC, FRA, and NWT is probably the<br />
result <strong>of</strong> the expanding period <strong>of</strong> thaw at these tundra and<br />
boreal forest sites (figure 7f, 7g, 7i). Increases in streamflow<br />
at these sites may be driven by permafrost melt; changes<br />
in the chemical composition <strong>of</strong> streamflow support this<br />
hypothesis (Bowden et al. 2008, Caine 2010). In addition,<br />
increased spring streamflow at temperate forest sites with<br />
seasonal snowpacks in New England (HBR) and in the<br />
upper Midwest (MAR) is probably the result <strong>of</strong> earlier<br />
snowmelt, whereas increased winter streamflow at temperate<br />
forest sites in New England (HFR) may be the result <strong>of</strong><br />
a shift from snow to rain. These responses are consistent<br />
with the results <strong>of</strong> published studies (Hodgkins et al. 2003,<br />
Stewart et al. 2005, Clow 2010, Campbell et al. 2011).<br />
Some observed trends in streamflow may be the result<br />
<strong>of</strong> biological responses to climate change. For example,<br />
declining streamflow at a woodland site (summer at GCE), a<br />
boreal forest site (LVW), temperate forest sites (MAR, NTL),<br />
and wet temperate forest sites (spring at AND, OLY) may<br />
be the result <strong>of</strong> increased evapotranspiration in response to<br />
warmer temperatures. Conifer forests, which occur at MAR,<br />
NTL, LVW, AND, and OLY, are adapted to photosynthesize<br />
and respire when conditions are favorable; warmer temperatures<br />
may lead to an earlier onset <strong>of</strong> transpiration and<br />
to declining streamflow (e.g., Moore KM 2010). Streamflow<br />
trends at wet temperate and boreal forest sites (LVW, AND,<br />
OLY; figure 7) are restricted to the immediate period <strong>of</strong><br />
snowmelt, and declines may reflect increased evapotranspiration<br />
(Moore KM 2010, Oishi et al. 2010, Campbell et al.<br />
2011). In contrast, streamflow trends are largest during the<br />
nonsnowmelt periods at temperate forest sites in the upper<br />
Midwest (NTL, MAR), where wetlands (bogs and lakes)<br />
occupy a large proportion <strong>of</strong> basin area (Verry et al. 2011).<br />
Increased evapotranspiration associated with declining ice<br />
cover (Magnuson et al. 2000) or increased radiation associated<br />
with decreased precipitation may account for declining<br />
flows at these sites.<br />
Some sites experienced no trends in streamflow, despite<br />
increases in temperature. For example, desert sites (CAP and<br />
SEV) and the wet tropical site (LUQ) experienced significant<br />
increases in minimum and maximum daily temperatures,<br />
no change in precipitation (figure 6), and almost no changes<br />
in streamflow (figure 7a, 7b, 7s). Vegetation adaptations to<br />
drought might explain the lack <strong>of</strong> a streamflow response to<br />
warming at the desert sites. At the wet tropical forest site,<br />
the effects <strong>of</strong> the 1996 Hurricane Hugo on leaf area, evapotranspiration,<br />
and streamflow (Scatena et al. 1996) may have<br />
overwhelmed climate-trend effects.<br />
Some sites experienced trends in streamflow that appear<br />
to be biological responses to past disturbances. For example,<br />
forest succession and declining evapotranspiration may<br />
explain increased summer streamflow at two temperate<br />
forest sites (FER, HBR), which were logged in the early<br />
nineteenth century (figure 7k, 7m). At a third temperate<br />
forest site (CWT), streamflow and run<strong>of</strong>f ratios have not<br />
changed, despite increases in air temperature (figure 6,<br />
figure 7j). Forest succession following disturbances in the<br />
early 1900s at all three sites (table S1; Swank et al. 2001,<br />
Adams et al. 2006) and associated changes in species composition<br />
or leaf area may have influenced streamflow trends.<br />
Analyses <strong>of</strong> long-term paired-basin experiment data (e.g.,<br />
Jones and Post 2004) indicate that streamflow continues to<br />
change over decades or centuries <strong>of</strong> forest succession after<br />
disturbance.<br />
Responses to land use and disturbance, such as advanced<br />
snowmelt or declining summer streamflow, may be misconstrued<br />
as responses to climate change. In paired-basin<br />
experiments (see the discussion <strong>of</strong> long-term experiments<br />
in Knapp and colleagues 2012 [in this issue]), forest harvest<br />
advanced the timing <strong>of</strong> peak snowmelt and associated<br />
streamflow by up to three weeks in temperate forest sites<br />
with a seasonal snowpack (AND, HBR); the effect lasted for<br />
more than 10 years (Jones and Post 2004). By 25 to 35 years<br />
after forest harvest in temperate forest basins (AND, CWT,<br />
HBR), summer streamflow declined by up to 30%–50%<br />
relative to the reference basins (Hornbeck et al. 1997, Swank<br />
et al. 2001, Jones and Post 2004). Regenerating species in<br />
early forest succession may transpire more water per unit <strong>of</strong><br />
leaf area and, in some cases, have greater total leaf area than<br />
the species that were removed, which would reduce summer<br />
streamflow (Swank et al. 2001, Moore GM et al. 2004).<br />
Historic legacies from past disturbance in these long-term<br />
studies demonstrate that streamflow and timing responses<br />
to forest disturbance are at least as large as responses associated<br />
with climate trends over the past 20–60 years at the<br />
study sites. Daily streamflow during the late summer and<br />
early fall increased by up to 300% in the 1–5-year period<br />
after experimental forest harvest (AND, CWT, HBR), but<br />
most daily changes were on the order <strong>of</strong> 50% or less (Jones<br />
and Post 2004). By comparison, trends in daily streamflow<br />
associated with climate trends at the 19 study sites were on<br />
the order <strong>of</strong> 0.005–0.05 <strong>of</strong> log(Q) per year. The lower value<br />
is equivalent to changes <strong>of</strong> 10%–25%, and the higher value<br />
is equivalent to more than a 100% change over 20–60 years,<br />
but changes <strong>of</strong> this magnitude are restricted to a few days<br />
per year (figure 7).<br />
Finally, some observed trends in streamflow may be<br />
direct human effects on the hydrologic cycle. For example,<br />
400 BioScience • April 2012 / Vol. 62 No. 4 www.biosciencemag.org
increased irrigation using groundwater or water imported<br />
from other basins may explain increasing streamflow during<br />
dry seasons at a desert site in New Mexico (JRN) and a<br />
savanna site in southern California (SBC), which have some<br />
agriculture and residential development (figure 7c, 7d).<br />
Increasing winter streamflow trends at a temperate forest<br />
site (PIE) may reflect urban expansion (Claessens et al.<br />
2006). Therefore, human effects on streamflow may mimic,<br />
exacerbate, counteract, or mask climate effects on streamflow,<br />
making it challenging to determine the vulnerability<br />
<strong>of</strong> human communities (sensu Polsky et al. 2007) to variations<br />
in water supply.<br />
Headwater basins in this study drain into major river<br />
systems that supply water to major agricultural areas and<br />
medium and large cities. Climate change is expected to<br />
increase the variability <strong>of</strong> future streamflow and to stress<br />
municipal water supplies (Milly et al. 2008, Covich 2010,<br />
McDonald et al. 2011, USDOI 2011). Long-term studies<br />
<strong>of</strong> headwater basins can help distinguish biophysical from<br />
social causes <strong>of</strong> variability in water supply and, hence,<br />
the relationships between ecological and social resilience<br />
(Adger 2000). Water scarcity may be perceived even in<br />
areas with abundant rainfall, where politics rather than<br />
true scarcity may govern water restrictions (Hill and Polsky<br />
2006). Meanwhile, residents, pr<strong>of</strong>essional policymakers,<br />
and academics in Phoenix (CAP) implicated population<br />
growth, climate change, and drought as the most important<br />
causes <strong>of</strong> water scarcity, rather than their own wateruse<br />
habits (Larson et al. 2009). Adding to this research,<br />
in this study, we suggest that rather complex interactions<br />
among historical social factors, ecosystem processes, and climate<br />
influence the long-term water supply from headwater<br />
basins.<br />
The role <strong>of</strong> information management<br />
Long-term ecological data are critical to answering societal<br />
questions <strong>of</strong> national concern and significance. Long-term<br />
data are the only way to distinguish trends from short-term<br />
variability in key environmental indicators, such as climate<br />
and streamflow. However, many long-term data remain<br />
inaccessible or difficult to access. Many valuable data sets are<br />
stored in inconvenient file formats with limited metadata.<br />
Variations in methods, variables, units, measurement scales,<br />
and quality-control annotation complicate data integration<br />
and prevent automated approaches to data synthesis.<br />
Until the 1990s, the difficulty <strong>of</strong> identifying, accessing,<br />
and integrating climate and hydrologic data from<br />
the <strong>LTER</strong> Network, EFRs, and related networks precluded<br />
cross-site studies. ClimDB/HydroDB (http://climhy.lternet.<br />
edu), a collaborative effort between <strong>LTER</strong> Network and<br />
USFS information managers, was initiated in 1997 to<br />
overcome these limitations. ClimDB/HydroDB is a Web<br />
harvester and data warehouse that provides uniform access<br />
and visualization <strong>of</strong> daily streamflow and meteorological<br />
data through a single portal. Participating sites manage<br />
original data within their local information systems but<br />
Articles<br />
periodically contribute data to the warehouse. Although<br />
the ClimDB/HydroDB approach is not a complete solution<br />
to data-access and -integration issues, it has served as an<br />
effective bridge technology between older, more rigid data-<br />
distribution models and modern service-oriented architectures<br />
(Henshaw et al. 2006).<br />
The <strong>LTER</strong> Network has made great strides in collecting,<br />
archiving, and integrating long-term data sets online,<br />
enabling synthesis activities such as this one, and providing<br />
an example for other environmental observatories.<br />
Information managers at <strong>LTER</strong> Network sites have led the<br />
development <strong>of</strong> metadata standards, data dictionaries, and<br />
s<strong>of</strong>tware for data integration. The <strong>LTER</strong> Network datamanagement<br />
system serves as a model for emerging national<br />
observatories and existing programs.<br />
Conclusions<br />
This study provides an example <strong>of</strong> the special kinds <strong>of</strong> science<br />
that are possible from networks <strong>of</strong> long-term study<br />
sites. Climate and streamflow records are sufficiently long<br />
that averages, variability, and trends can be meaningfully<br />
analyzed. The climate and streamflow properties are<br />
simple and comparable because they are consistently measured<br />
across sites. Climate and streamflow data are broadly<br />
relevant to ecosystem processes and ecosystem services.<br />
Above all, multisite synthesis is fostered by and contributes<br />
to an open, inclusive culture <strong>of</strong> science collaboration.<br />
This study showed that actual evapotranspiration was<br />
predicted by PET at only 7 <strong>of</strong> 30 sites with 10-year-long<br />
records (the Budyko curve). Taken individually, these departures<br />
might simply reflect the inability <strong>of</strong> a climate station<br />
to represent the conditions <strong>of</strong> a whole basin or the fact<br />
that streamflow depends on groundwater and other forms<br />
<strong>of</strong> storage, as well as precipitation and temperature. But<br />
taken collectively, the departures <strong>of</strong> these sites from the<br />
Budyko prediction suggest the intriguing hypothesis that<br />
water-scarce ecosystems evapotranspire less and waterabundant<br />
ecosystems evapotranspire more than would<br />
be predicted from their climates. Moreover, streamflow<br />
at many <strong>of</strong> these sites was significantly related to one or<br />
more climate index (ENSO, NAO, or PDO), which is not<br />
surprising, but the slightly more frequent significant correlations<br />
<strong>of</strong> streamflow with climate indices in winter than<br />
in summer imply that ecosystem processes mediate climate–<br />
streamflow coupling. Finally, 17 <strong>of</strong> 19 sites had significant<br />
increases in their minimum or maximum daily temperatures<br />
or both, but streamflow trends were directly related<br />
to climate trends at only 7 <strong>of</strong> the sites, all <strong>of</strong> which have<br />
permanent or seasonal ice and snow. In contrast, at other<br />
sites, and during certain seasons at these seven sites, streamflow<br />
trends were contrary to those expected from climate<br />
drivers.<br />
A key finding from this study is that the past and present<br />
human uses <strong>of</strong> ecosystems and human water-use practices<br />
can mimic, exacerbate, counteract, or mask the effects <strong>of</strong><br />
climate change on streamflow. Social factors, including<br />
www.biosciencemag.org April 2012 / Vol. 62 No. 4 • BioScience 401
Articles<br />
past land management and disturbance and the resulting<br />
ecological succession, all influence trends in streamflow,<br />
even at sites that are considered to be “reference” basins. In<br />
other words, exogenous (climate) factors are not the only<br />
drivers <strong>of</strong> nonstationarity (e.g., Milly et al. 2008) in streamflow<br />
from headwaters: Ecosystem processes and their social<br />
drivers are also important controls. In order to understand<br />
reference conditions for natural flow regimes (e.g., P<strong>of</strong>f<br />
et al. 2007), we need to better understand how ecological<br />
processes and social drivers mediate the expression <strong>of</strong><br />
climate on streamflow. Long-term study sites, where all<br />
these processes are being studied, are ideal places for this<br />
ongoing work.<br />
Acknowledgments<br />
Funding for this work was provided by the US Long Term<br />
Ecological Research (<strong>LTER</strong>) Network and National Science<br />
Foundation grants to participating sites and by a Natural<br />
Sciences and Engineering Research Council <strong>of</strong> Canada<br />
Discovery Grant to IFC. We thank <strong>LTER</strong> Network information<br />
managers for the creation and maintenance <strong>of</strong><br />
ClimDB/HydroDB; the US Forest Service for the initial<br />
establishment and continued support <strong>of</strong> climate and basin<br />
measurements at many <strong>of</strong> the study sites; the US Geological<br />
Survey (USGS) Water, Energy, and Biogeochemical Budgets<br />
program, the USGS Hydrologic Benchmark Network, and<br />
the USGS National Water Information Service for provision<br />
<strong>of</strong> data; and the Networks <strong>of</strong> Centres <strong>of</strong> Excellence–<br />
Sustainable Forest Management Network–funded project on<br />
HydroEcological Landscapes and Processes (HELP) and the<br />
participating Canadian experimental basins from which data<br />
were contributed to the HELP project (Peter Tschaplinski for<br />
CAR, Tom Clair for KEJ, Fred Beall for TLW and MRM,<br />
Ray Hesslein for ELA, Peter Dillon for DOR, and Rita<br />
Winkler for UPC). We thank Merryl Albers, David R. Foster,<br />
Eveleyn Gaiser, Ann Giblin, Stephen P. Loheide II, Randy K.<br />
Kolka, Richard V. Pouyat, Sylvia Schaefer, Emily H. Stanley,<br />
Frederick J. Swanson, Will Wollheim, and three anonymous<br />
reviewers for comments on the manuscript.<br />
References cited<br />
Adams MB, DeWalle DR, Hom JL, eds. 2006. The Fernow Watershed<br />
Acidification Study. Springer.<br />
Adger WN. 2000. Social and ecological resilience: Are they related? Progress<br />
in Human Geography 24: 347–364.<br />
Barnett TP, et al. 2008. Human-induced changes in the hydrology <strong>of</strong> the<br />
western United States. Science 319: 1080–1083.<br />
Barlow M, Nigam S, Berbury EH. 2001. ENSO, Pacific decadal variability,<br />
and U.S. summertime precipitation, drought, and stream flow. Journal<br />
<strong>of</strong> Climate 14: 2105–2128.<br />
Bowden WB, Gooseff MN, Balser A, Green A, Peterson BJ, Bradford J.<br />
2008. Sediment and nutrient delivery from thermokarst features in the<br />
foothills <strong>of</strong> the North Slope, Alaska: Potential impacts on headwater<br />
stream ecosystems. Journal <strong>of</strong> Geophysical Research 113 (Art. G02026).<br />
doi:10.1029/2007JG000470<br />
Budyko MI. 1974. Climate and Life. Academic Press.<br />
Caine N. 2010. Recent hydrologic change in a Colorado alpine basin: An<br />
indicator <strong>of</strong> permafrost thaw? Annals <strong>of</strong> Glaciology 51: 130–134.<br />
Campbell JL, Driscoll CT, Pourmokhtarian A, Hayhoe K. 2011.<br />
Streamflow responses to past and projected future changes in climate<br />
at the Hubbard Brook Experimental Forest, New Hampshire,<br />
United States. Water Resources Research 47 (Art. W02514).<br />
doi:10.1029/2010WR009438<br />
Cayan DR, Redmond KT, Riddle LG. 1999. ENSO and hydrologic extremes<br />
in the western United States. Journal <strong>of</strong> Climate 12: 2881–2893.<br />
Claessens L, Hopkinson C, Rastetter E, Vallino J. 2006. Effect <strong>of</strong> historical<br />
changes in land use and climate on the water budget <strong>of</strong> an urbanizing<br />
watershed. Water Resources Research 42 (Art. W03426).<br />
doi:10.1029/2005WR004131<br />
Clow DW. 2010. Changes in the timing <strong>of</strong> snowmelt and streamflow<br />
in Colorado: A response to recent warming. Journal <strong>of</strong> Climate 23:<br />
2293–2306. doi: 10.1175/2009JCLI2951.1<br />
Covich AP. 2010. Adaptation to sustain high-quality freshwater supplies<br />
in response to climatic change. Resources For the Future. Issue Brief<br />
no. 10-05:1-22.<br />
Donohue RJ, Roderick ML, McVicar TR. 2007. On the importance<br />
<strong>of</strong> including vegetation dynamics in Budyko’s hydrological model.<br />
Hydrology and Earth System Sciences 11: 983–995.<br />
Enfield DB, Mestas-Nuñez AM, Trimble PJ. 2001. The Atlantic multidecadal<br />
oscillation and its relation to rainfall and river flows in the continental<br />
U.S. Geophysical Research Letters 28: 2077–2080.<br />
Foster DR, Aber JD, eds. 2004. Forests in Time: The Environmental<br />
Consequences <strong>of</strong> 1,000 Years <strong>of</strong> Change in New England. Yale <strong>University</strong><br />
Press.<br />
Graham CB, van Verseveld W, Barnard HR, McDonnell JJ. 2010. Estimating<br />
the deep seepage component <strong>of</strong> the hillslope and catchment water<br />
balance within a measurement uncertainty framework. Hydrological<br />
Processes 24: 3631–3647.<br />
Greenland D, Goodin DG, Smith RC. 2003. Climate Variability and<br />
Ecosystem Response at Long-Term Ecological Research Sites. Oxford<br />
<strong>University</strong> Press.<br />
Groisman PY, Knight RW, Karl TR, Easterling DR, Sun B, Lawrimore JH.<br />
2004. Contemporary changes <strong>of</strong> the hydrological cycle over the contiguous<br />
United States: Trends derived from in situ observations. Journal <strong>of</strong><br />
Hydrometeorology 5: 64–85.<br />
Hamon WR. 1963. Computation <strong>of</strong> direct run<strong>of</strong>f amounts from storm rainfall.<br />
International Association <strong>of</strong> Scientific Hydrological Publications<br />
63: 52–62.<br />
Hatcher KL. 2011. Interacting effects <strong>of</strong> climate, forest dynamics, landforms,<br />
and river regulation on streamflow trends since 1950: Examples from<br />
the Willamette basin and forested headwater sites in the US. Master’s<br />
thesis. Oregon State <strong>University</strong>, Corvallis.<br />
Helsel DR, Hirsch RM. 2002. Statistical methods in water resources.<br />
Techniques <strong>of</strong> Water Resources Investigations, Book 4, Chapter A3.<br />
US Geological Survey. (30 January 2012; http://pubs.usgs.gov/twri/<br />
twri4a3)<br />
Henshaw DL, Sheldon WM, Remillard SM, Kotwica K. 2006. ClimDB/<br />
HydroDB: A Web harvester and data warehouse approach to building<br />
a cross-site climate and hydrology database. In: Proceedings <strong>of</strong><br />
the 7th International Conference on Hydroscience and Engineering,<br />
Philadelphia, PA, September 2006. (30 January 2012; http://hdl.handle.<br />
net/1860/1434).<br />
Hill TD, Polsky C. 2006. Adaptation to drought in the context <strong>of</strong> suburban<br />
sprawl and abundant rainfall. Geographical Bulletin 47: 85–100.<br />
Hodgkins GA, Dudley RW, Huntington TG. 2003. Changes in the timing <strong>of</strong><br />
high flows in New England over the 20th century. Journal <strong>of</strong> Hydrology<br />
278: 244–252.<br />
Hornbeck JW, Martin CW, Eagar C. 1997. Summary <strong>of</strong> water yield<br />
experiments at Hubbard Brook Experimental Forest, New Hampshire.<br />
Canadian Journal <strong>of</strong> Forest Research 27: 2043–2052.<br />
Huntington TG. 2006. Evidence for intensification <strong>of</strong> the global water cycle:<br />
Review and synthesis. Journal <strong>of</strong> Hydrology 319: 83–95. doi:10.1016/<br />
j.jhydrol.2005.07.003<br />
Huxman TE, et al. 2004. Convergence across biomes to a common rain-use<br />
efficiency. Nature 429: 651–654.<br />
402 BioScience • April 2012 / Vol. 62 No. 4 www.biosciencemag.org
Jones JA. 2011. Hydrologic responses to climate change: Considering geographic<br />
context and alternative hypotheses. Hydrological Processes 25:<br />
1996–2000. doi:10.1002/hyp.8004<br />
Jones JA, Post DA. 2004. Seasonal and successional streamflow response<br />
to forest cutting and regrowth in the northwest and eastern United<br />
States. Water Resources Research 40 (Art. W05203). doi:10.1029/<br />
2003WR002952<br />
Karl TR, Melillo JM, Peterson TC, eds. 2009. Global Climate Change<br />
Impacts in the United States: A State <strong>of</strong> Knowledge Report from the U.S.<br />
Global Change Research Program. Cambridge <strong>University</strong> Press.<br />
Knapp AK, et al. 2012. Past, present, and future roles <strong>of</strong> long-term experiments<br />
in the <strong>LTER</strong> network. BioScience 62: 377–389.<br />
Larson KL, White D, Gober P, Harlan S, Wutich A. 2009. Divergent perspectives<br />
on water resource sustainability in a public-policy–science context.<br />
Environmental Science and Policy 12: 1012–1023.<br />
MacDonald GM, Case RA. 2005. Variations in the Pacific Decadal<br />
Oscillation over the past millennium. Geophysical Research Letters 32<br />
(Art. L08703). doi:10.1029/2005GL022478<br />
Magnuson JJ, et al. 2000. Historical trends in lake and river ice cover in the<br />
northern hemisphere. Science 289: 1743–1746.<br />
Mantua NJ, Hare SR, Zhang Y, Wallace JM, Francis RC. 1997. A Pacific interdecadal<br />
climate oscillation with impacts on salmon production. Bulletin<br />
<strong>of</strong> the American Meteorological Society 78: 1069–1079.<br />
McDonald RI, Green P, Balk D, Fekete BM, Revenga C, Todd M,<br />
Montgomery M. 2011. Urban growth, climate change, and freshwater<br />
availability. Proceedings <strong>of</strong> the National Academy <strong>of</strong> Sciences 108:<br />
6312–6317.<br />
Meybeck M. 2003. Global analysis <strong>of</strong> river systems: From Earth system<br />
controls to Anthropocene syndromes. Philosophical Transactions <strong>of</strong> the<br />
Royal Society B 358: 1935–1955. doi:10.1098/rstb.2003.1379<br />
Milly PCD, Betancourt J, Falkenmark M, Hirsch RM, Kundzewicz ZW,<br />
Lettenmaier DP, Stouffer RJ. 2008. Stationarity is dead: Whither water<br />
management? Science 319: 573–574.<br />
Min SK, Zhang X, Zwiers FW, Hegerl GC. 2011. Human contribution to<br />
more-intense precipitation extremes. Nature 470: 378–381.<br />
Molles MC, Dahm CN. 1990. A perspective on El Niño and La Niña:<br />
Global implications for stream ecology. Journal <strong>of</strong> the North American<br />
Benthological Society 9: 68–76.<br />
Moore GM, Bond BJ, Jones JA, Phillips N, Meinzer FC. 2004. Structural<br />
and compositional controls on transpiration in 40- and 450-year-<br />
old riparian forests in western Oregon, USA. Tree Physiology 24:<br />
481–491.<br />
Moore KM. 2010. Trends in streamflow from old growth forested watersheds<br />
in the western Cascades. Student research paper. Oregon State<br />
<strong>University</strong>, Corvallis. (30 January 2012; http://ir.library.oregonstate.edu/<br />
xmlui/handle/1957/15741)<br />
Oishi AC, Oren R, Novick KA, Palmroth S, Ka GG. 2010. Interannual invariability<br />
<strong>of</strong> forest evapotranspiration and its consequence to water flow<br />
downstream. Ecosystems 13: 421–436.<br />
Pall P, Aina T, Stone DA, Stott PA, Nozawa T, Hilberts AGJ, Lohmann D,<br />
Allen MR. 2011. Anthropogenic greenhouse gas contribution to flood<br />
risk in England and Wales in autumn 2000. Nature 470: 382–385.<br />
Peters DPC, Bestelmeyer BT, Herrick JE, Fredrickson EL, Monger HC,<br />
Havstad KM. 2006. Disentangling complex landscapes: New insights<br />
into arid and semiarid system dynamics. BioScience 56: 491–501.<br />
P<strong>of</strong>f NL, Olden LD, Merritt DM, Pepin DM. 2007. Homogenization <strong>of</strong><br />
regional river dynamics by dams and global biodiversity implications.<br />
Proceedings <strong>of</strong> the National Academy <strong>of</strong> Sciences 104: 5732–5737.<br />
Polsky C, Neff R, Yarnal B. 2007. Building comparable global change<br />
vulnerability assessments: The vulnerability scoping diagram. Global<br />
Environmental Change 17: 472–485.<br />
Scatena FN, Moya S, Estrada C, Chinea JD. 1996. The first five years in<br />
the reorganiation <strong>of</strong> aboveground biomass and nutrient use following<br />
Hurricane Hugo in the Bisley experimental watersheds, Luquillo experimental<br />
forest, Puerto Rico. Biotropica 28: 424-440.<br />
Sponseller RA, Grimm NB, Boulton AJ, Sabo JL. 2010. Responses <strong>of</strong> macroinvertebrate<br />
communites to long-term flow variability Sonoran Desert<br />
Articles<br />
stream. Global Change Biology 16: 2891–2900. doi:10.1111/j.1365-<br />
2486.2010.02200.x<br />
Stewart IT, Cayan DR, Dettinger MD. 2005. Changes toward earlier streamflow<br />
timing across western North America. Journal <strong>of</strong> Climate 18:<br />
1136–1155.<br />
Swank WT, Crossley DA Jr, eds. 1988. Forest Hydrology and Ecology at<br />
<strong>Coweeta</strong>. Vol. 66, Ecological Studies. Springer.<br />
Swank WT, Vose JM, Elliott KJ. 2001. Long-term hydrologic and water<br />
quality responses following commercial clearcutting <strong>of</strong> mixed hardwoods<br />
on a southern Appalachian catchment. Forest Ecology and<br />
Management 143: 163–178.<br />
[USDOI] US Department <strong>of</strong> the Interior. 2011. Reclamation: Managing<br />
Water in the West. USDOI.<br />
Verry ES, Brooks KN, Nichols DS, Ferris DR, Sebestyen SD. 2011. Watershed<br />
hydrology. Pages 193–212 in Kolka RK, Sebestyen SD, Verry ES, Brooks<br />
KN, eds. Peatland Biogeochemistry and Watershed Hydrology at the<br />
Marcell Experimental Forest. CRC Press.<br />
Warren RJ, Bradford MA. 2010. Seasonal climate trends, the North Atlantic<br />
Oscillation, and salamander abundance in the Southern Appalachian<br />
Mountain Region. Journal <strong>of</strong> Applied Meteorology and Climatology<br />
49: 1597–1603.<br />
Weisberg PJ, Swanson FJ. 2003. Regional synchroneity in fire regimes <strong>of</strong><br />
western Oregon and Washington, USA. Forest Ecology and Management<br />
172: 17–28.<br />
Julia A. Jones (jonesj@geo.oregonstate.edu) is a pr<strong>of</strong>essor <strong>of</strong> geosciences at<br />
Oregon State <strong>University</strong>, Corvallis, and co-principal investigator (PI) <strong>of</strong> the<br />
Andrews <strong>LTER</strong>L Network site; she studies hydrology and landscape ecology.<br />
Irena F. Creed is a pr<strong>of</strong>essor <strong>of</strong> <strong>biology</strong> and geography at the <strong>University</strong> <strong>of</strong><br />
Western Ontario, London, Ontario, Canada; she conducts biogeochemical<br />
modeling and analysis. Kendra L. Hatcher completed an MS in geography at<br />
Oregon State <strong>University</strong>, Corvallis; she studies physical geography and geographic<br />
information science. Robert J. Warren is a postdoctoral associate at the<br />
Yale School <strong>of</strong> Forestry and Environmental Studies, in New Haven, Connecticut,<br />
and studies organisms and climate variability at the <strong>Coweeta</strong> <strong>LTER</strong> Network<br />
site. Mary Beth Adams is a soil scientist at the US Forest Service (USFS)<br />
Northern Research Station, in Parsons, West Virginia, studying biogeochemistry<br />
at the Fernow Experimental Forest. Melinda H. Benson is an assistant<br />
pr<strong>of</strong>essor <strong>of</strong> geography at the <strong>University</strong> <strong>of</strong> New Mexico, in Albuquerque, studying<br />
ecosystem services and resilience. Emery Boose is an information manager<br />
for Harvard <strong>University</strong>’s Harvard Forest, in Petersham, Massachusetts; he<br />
studies climate and hydrology at the Harvard Forest <strong>LTER</strong> Network site.<br />
Warren A. Brown is a senior research associate at the Cornell Institute for<br />
Social and Economic Research at Cornell <strong>University</strong>, in Ithaca, New York; he<br />
works on demographic change. John L. Campbell is a research ecologist at the<br />
USFS Northeastern Research Station, in Durham, New Hampshire; he studies<br />
climate, hydrology, and biogeochemistry at the Hubbard Brook Experimental<br />
Forest, an <strong>LTER</strong> Network site. Alan Covich is a pr<strong>of</strong>essor at the Odum School<br />
<strong>of</strong> Ecology, at the <strong>University</strong> <strong>of</strong> <strong>Georgia</strong>, in Athens, and co-PI <strong>of</strong> the Luquillo<br />
Experimental Forest, an <strong>LTER</strong> Network site; he studies stream ecology. David<br />
W. Clow is a research hydrologist at the US Geological Survey’s Colorado Water<br />
Science Center, in Lakewood; he studies alpine hydrology and climate at the<br />
Loch Vale <strong>LTER</strong> Network site. Clifford N. Dahm is a pr<strong>of</strong>essor <strong>of</strong> <strong>biology</strong> at the<br />
<strong>University</strong> <strong>of</strong> New Mexico, in Albuquerque; lead scientist <strong>of</strong> the CALFED Bay-<br />
Delta Program; and co-PI <strong>of</strong> the Sevilleta <strong>LTER</strong> Network site; he studies stream<br />
ecology, hydrology, and biogeochemistry. Kelly Elder is a research hydrologist<br />
at the USFS Rocky Mountain Research Station, in Fort Collins, Colorado; he<br />
studies snow hydrology and climate at the Fraser Experimental Forest, part<br />
<strong>of</strong> the USFS Experimental Forests and Ranges program, in Fraser, Colorado.<br />
Chelcy R. Ford is a research scientist with the USFS Southern Research Station,<br />
<strong>Coweeta</strong> Hydrological Laboratory, in Otto, North Carolina; she studies forest<br />
hydrology at the <strong>Coweeta</strong> <strong>LTER</strong> Network site. Nancy B. Grimm is a pr<strong>of</strong>essor<br />
in the School <strong>of</strong> Life Sciences at Arizona State <strong>University</strong>, in Tempe, and co-PI<br />
<strong>of</strong> the Central Arizona–Phoenix <strong>LTER</strong> Network site; she studies stream ecology<br />
and urban systems. Donald L. Henshaw is an information technology specialist<br />
with the USFS Pacific Northwest Research Station in Portland, Oregon; he<br />
www.biosciencemag.org April 2012 / Vol. 62 No. 4 • BioScience 403
Articles<br />
designed and manages the <strong>LTER</strong> Network’s Climate and Hydrology Database<br />
Projects. Kelli L. Larson is an assistant pr<strong>of</strong>essor in the School <strong>of</strong> Geographic<br />
Science and Urban Planning at Arizona State <strong>University</strong>, in Tempe; she studies<br />
water resource geography and governance. Evan S. Miles completed an MS<br />
in water resources at Oregon State <strong>University</strong>, in Corvallis; he studies hydrogeology<br />
and glaciers. Kathleen M. Miles is a PhD student in geography at<br />
Oregon State <strong>University</strong>, in Corvallis; she studies hydrology and climate change<br />
at the Andrews Experimental Forest, part <strong>of</strong> the <strong>LTER</strong> Network. Stephen D.<br />
Sebestyen is a research hydrologist with the USFS Northern Research Station,<br />
in Grand Rapids, Minnesota; he studies hydrology and biogeochemistry at<br />
Marcell Experimental Forest, in Grand Rapids. Adam T. Spargo is a research<br />
technician in the Department <strong>of</strong> Biology at the <strong>University</strong> <strong>of</strong> Western Ontario,<br />
in London, Ontario, Canada; his role includes working on developing a longterm<br />
experimental catchment database for Canada. Asa B. Stone is an assistant<br />
pr<strong>of</strong>essor at Central New Mexico Community College, in Albuquerque;<br />
she studies ecological psychology. James M. Vose is the project leader at the<br />
USFS Southern Research Station, <strong>Coweeta</strong> Hydrological Laboratory, in Otto,<br />
North Carolina; he studies watershed hydrology, biogeochemistry, and ecology<br />
at the <strong>Coweeta</strong> <strong>LTER</strong> Network site. Mark W. Williams is a pr<strong>of</strong>essor <strong>of</strong> geography<br />
at the <strong>University</strong> <strong>of</strong> Colorado, in Denver; a fellow <strong>of</strong> the Institute <strong>of</strong> Arctic<br />
and Alpine Research; and PI <strong>of</strong> the Niwot Ridge <strong>LTER</strong> Network site; he studies<br />
mountain ecology and alpine hydrology.<br />
404 BioScience • April 2012 / Vol. 62 No. 4 www.biosciencemag.org
Articles<br />
The Disappearing Cryosphere:<br />
Impacts and Ecosystem Responses<br />
to Rapid Cryosphere Loss<br />
Andrew G. FountAin, John L. CAmpbeLL, edwArd A. G. SChuur, ShAron e. StAmmerJohn,<br />
mArk w. wiLLiAmS, And huGh w. duCkLow<br />
The cryosphere—the portion <strong>of</strong> the Earth’s surface where water is in solid form for at least one month <strong>of</strong> the year—has been shrinking in response<br />
to climate warming. The extents <strong>of</strong> sea ice, snow, and glaciers, for example, have been decreasing. In response, the ecosystems within the cryosphere<br />
and those that depend on the cryosphere have been changing. We identify two principal aspects <strong>of</strong> ecosystem-level responses to cryosphere loss:<br />
(1) trophodynamic alterations resulting from the loss <strong>of</strong> habitat and species loss or replacement and (2) changes in the rates and mechanisms <strong>of</strong><br />
biogeochemical storage and cycling <strong>of</strong> carbon and nutrients, caused by changes in physical forcings or ecological community functioning. These<br />
changes affect biota in positive or negative ways, depending on how they interact with the cryosphere. The important outcome, however, is the<br />
change and the response the human social system (infrastructure, food, water, recreation) will have to that change.<br />
Keywords: cryosphere, ecosystem response, environmental observatories<br />
Global average air temperature has warmed by 1 degree<br />
Celsius (°C) over the past century, and in response, the<br />
cryosphere—the part <strong>of</strong> the Earth’s surface most influenced<br />
by ice and snow—is changing. Specifically, alpine glaciers<br />
are retreating, the expanse <strong>of</strong> Arctic sea ice has been shrinking,<br />
the thickness and duration <strong>of</strong> winter snowpacks are<br />
diminishing, permafrost has been melting, and the ice cover<br />
on lakes and rivers has been appearing later in the year and<br />
melting out earlier. Although these changes are relatively<br />
well documented, the ecological responses and long-term<br />
consequences that they initiate are not. Detailed studies<br />
have identified specific responses to individual components<br />
cryospheric changes (e.g., polar bear habitat and sea ice<br />
loss), but a more integrated view across many landscapes<br />
and types <strong>of</strong> changes has been lacking. In the present article,<br />
we draw largely—but not exclusively—from sites <strong>of</strong> the US<br />
Long Term Ecological Research (<strong>LTER</strong>) Network (the special<br />
section in this issue; see especially Robertson et al. 2012) to<br />
synthesize our current knowledge <strong>of</strong> ecosystem responses<br />
to the changing cryosphere in an attempt to infer broad<br />
responses and to anticipate the further range <strong>of</strong> changes that<br />
we might expect. We contend that place-based, long-term,<br />
interdisciplinary efforts, such as <strong>LTER</strong>-type projects, are<br />
the best suited for tracking such changes and for detecting<br />
and understanding their cascading effects throughout the<br />
ecosystem.<br />
The cryosphere<br />
For the purposes <strong>of</strong> this synthesis, the spatial extent <strong>of</strong> the<br />
cryosphere for the Northern Hemisphere includes the mean<br />
February extent <strong>of</strong> snow cover (measured between 1987<br />
and 2003) and the mean March extent <strong>of</strong> sea ice (measured<br />
between 1979 and 2003). For the Southern Hemisphere, we<br />
include the mean August and September extents <strong>of</strong> snow<br />
and sea ice, respectively. Broad statistics for the cryosphere<br />
and its changes are provided in table 1 and are depicted in<br />
figure 1.<br />
Permafrost (figure 2a) is widespread in the Arctic and<br />
boreal regions <strong>of</strong> the Northern Hemisphere, with the permafrost<br />
zone occupying about 24% <strong>of</strong> the exposed land area.<br />
Most <strong>of</strong> this (78%) occurs in lowlands below 1000 meters<br />
(m) <strong>of</strong> elevation, whereas deposits <strong>of</strong> alpine permafrost<br />
are widely distributed. Changes in permafrost are typically<br />
documented by two metrics: temperature and the depth to<br />
the permafrost, which is defined as the active layer, which<br />
in turn is the surface layer that thaws seasonally. Since the<br />
1980s, permafrost temperatures have generally increased<br />
between 0.5° and 2°C when measured at about 10 m, a<br />
depth at which seasonal variations cancel each other out and<br />
thus yield a seasonally constant value (Romanovsky et al.<br />
2007). At some Russian sites, where many data are available,<br />
the active layer increased by 1.7–5.5 centimeters (cm)<br />
per year over the 10-year period between 1997 and 2007<br />
BioScience 62: 405–415. ISSN 0006-3568, electronic ISSN 1525-3244. © 2012 by American Institute <strong>of</strong> Biological Sciences. All rights reserved. Request<br />
permission to photocopy or reproduce article content at the <strong>University</strong> <strong>of</strong> California Press’s Rights and Permissions Web site at www.ucpressjournals.com/<br />
reprintinfo.asp. doi:10.1525/bio.2012.62.4.11<br />
www.biosciencemag.org April 2012 / Vol. 62 No. 4 • BioScience 405
Articles<br />
(Mazhitova et al. 2008), whereas other sites have shown little<br />
change (Zamolodchikov et al. 2008). However, recent data<br />
have shown that active-layer depth measurements alone may<br />
obscure the degradation <strong>of</strong> permafrost, because the ground<br />
Table 1. Components <strong>of</strong> the global cryosphere and their areal extent.<br />
Component Definition and remarks<br />
Snow Perennial or seasonal cover <strong>of</strong><br />
the land surface: 98% in Northern<br />
hemisphere<br />
Glaciers Perennial snow or ice that moves<br />
Alpine glaciers and ice caps<br />
surface subsides as permafrost thaws and internal ice melts.<br />
This subsidence process (called thermokarst) can radically<br />
restructure surface hydrology by altering the dynamics<br />
<strong>of</strong> water bodies, initiating or expanding surface channel<br />
incision, and drying surface soil<br />
Extent<br />
(in 10 6 km 2 ) <strong>LTER</strong> site(s) a<br />
1.9 (summer)<br />
45 (winter)<br />
ARC, AND, BNZ, CDR,<br />
KBS, KNZ, HBR, HFR,<br />
MCM, NTL, NWT,<br />
SGS, PIE,<br />
0.53 MCM, NWT, PAL<br />
Ice sheets 14 MCM, PAL<br />
Permafrost Subsurface Earth material remaining<br />
below 0 degrees Celsius for at least<br />
2 years<br />
23 ARC, BNZ, MCM,<br />
NWT<br />
Lake and river ice Seasonal cover <strong>of</strong> lakes and rivers ? ARC, AND, BNZ, CDR,<br />
KBS, KNZ, HBR, HFR,<br />
MCM, NTL, NWT,<br />
SGS, PIE<br />
Sea ice Perennial or seasonal cover <strong>of</strong> the<br />
ocean<br />
19–27 PAL<br />
Note: All extents are from table 4.1 <strong>of</strong> Solomon and colleagues (2007). The value for permafrost is the<br />
region in which permafrost occurs and includes both frozen and unfrozen soils.<br />
km 2 , square kilometers; <strong>LTER</strong>, long-term ecological research.<br />
a See table 2 for the site abbreviations.<br />
a b<br />
layers. Observations near Toolik<br />
Lake, Alaska, have shown rapid<br />
mass wasting <strong>of</strong> surface soils<br />
undergoing thaw, which resulted<br />
in an increased loading <strong>of</strong> suspended<br />
sediment in streams,<br />
with direct and indirect effects<br />
on stream biota (Bowden et al.<br />
2008). In the McMurdo Dry<br />
Valleys <strong>of</strong> Antarctica, enhanced<br />
incision <strong>of</strong> stream water into<br />
massive subsurface ice has caused<br />
one river to flow underground<br />
for some distance. At Niwot Ridge<br />
in Colorado, increasing water<br />
flow and solute concentrations in<br />
early autumn have been attributed<br />
to the melting <strong>of</strong> alpine<br />
permafrost (Caine 2010).<br />
One iconic and highly conspicuous<br />
feature <strong>of</strong> global warming<br />
is glacier recession (figure 2b).<br />
Figure 1. Approximate geographic limits <strong>of</strong> the cryosphere. (a) January climatology <strong>of</strong> Northern Hemisphere sea ice<br />
(measured between 1979 and 2005) and snow extent (measured between 1967 and 2005) with the North Pole referenced<br />
(the red dot). (b) September climatology <strong>of</strong> Southern Hemisphere sea ice (measured between 1979 and 2003) and snow<br />
extent (measured between 1987 and 2002) with the South Pole referenced (the red dot). Source: Reprinted from John<br />
Maurer, Atlas <strong>of</strong> the Cryosphere. National Snow and Ice Data Center (2007; http://nsidc.org/data/atlas).<br />
406 BioScience • April 2012 / Vol. 62 No. 4 www.biosciencemag.org
Articles<br />
Figure 2. Examples <strong>of</strong> the cryosphere. (a) Winter eastern forest, Mount Washington, New Hampshire (Photograph: Jerry<br />
and Marcy Monkman, www.ecophotography.com); (b) Melting sea ice and an iceberg, Charcot Island, Antarctic Peninsula<br />
(Photograph: Grace K. Saba, Rutgers <strong>University</strong>); (c) Massive ice exposed by degrading permafrost, Noatak National Preserve,<br />
Arkansas (Photograph: Edward A. G. Schuur); (d) Dana Glacier, Sierra Nevada, California. The top panel is the glacier in<br />
1883 (Photograph: I. C. Russell, US Geological Survey); the bottom panel is from 2004 (Photograph: Hassan Basagic).<br />
Glaciers have been receding worldwide since the end <strong>of</strong><br />
the Little Ice Age in the late 1800s, although regional and<br />
temporal variations in recession have occurred (Dyurgerov<br />
and Meier 2000). In recent decades, glacier-mass loss has<br />
accelerated, with the increased rate ascribed to increased<br />
temperatures. Glacier change in the United States reflects<br />
these global trends through area losses over the past century<br />
<strong>of</strong> 34%–56% in the Sierra Nevada and the Cascades <strong>of</strong><br />
Oregon and Washington and about 40% at Niwot Ridge, in<br />
the Colorado Front Range. In contrast to these observations<br />
and to those elsewhere in the alpine Southern Hemisphere,<br />
glaciers in the McMurdo Dry Valleys <strong>of</strong> Antarctica appear<br />
to be in equilibrium, since their positions have not changed<br />
since their observation began in 1993 (Fountain et al. 2006).<br />
The removal <strong>of</strong> water from long-term storage in glacial ice<br />
increases summer streamflow and global sea level. However,<br />
as the mass <strong>of</strong> glaciers decline, their ability to support summer<br />
streamflow declines, and they decrease in their ability to<br />
buffer the watersheds against drought.<br />
Sea ice (figure 2c) occurs in the Arctic; in the Southern<br />
Ocean surrounding Antarctica and the Baltic Sea; and in<br />
part <strong>of</strong> the northwest Pacific, from the Siberian coast down<br />
to the Japanese island <strong>of</strong> Hokkaido. Most sea ice forms<br />
and melts annually, with perennial multiyear ice restricted<br />
to the high latitudes <strong>of</strong> the Arctic and Antarctica. Since<br />
the advent <strong>of</strong> continuous satellite monitoring in the late<br />
www.biosciencemag.org April 2012 / Vol. 62 No. 4 • BioScience 407
Articles<br />
1970s, widespread decreases in sea ice have been recorded<br />
throughout most <strong>of</strong> the Arctic at an average rate <strong>of</strong> 3% loss<br />
per decade (Comiso and Nishio 2008). In contrast, decreases<br />
in Antarctic sea ice have been regionally confined and juxtaposed<br />
against regions <strong>of</strong> increasing sea ice, such that the<br />
average rate <strong>of</strong> change overall is a slight increase <strong>of</strong> 1% per<br />
decade. Changes in sea ice alter the extent and distribution<br />
<strong>of</strong> foraging platforms for larger mammals and refuge habitat<br />
for smaller species. At the Palmer Peninsula, seasonal seaice<br />
cover has been shrinking at astonishing rates because <strong>of</strong><br />
increases in onshore winds driven by hemispheric changes<br />
in atmospheric circulation. The duration <strong>of</strong> sea-ice cover has<br />
declined by 85 days since 1978 (Stammerjohn et al. 2008).<br />
Seasonal lake and river ice occur in all temperate regions,<br />
with durations <strong>of</strong> days to months, whereas perennial<br />
ice cover is only found at extremely high latitudes and<br />
elevations. The date <strong>of</strong> lake-ice formation and breakup is<br />
commonly recorded for commercial purposes related to<br />
shipping, trapping, fishing, ice harvesting, and transportation<br />
and yields an extensive long-term record (Magnuson<br />
et al. 2000). Since 1846, lake-ice duration in the Northern<br />
Hemisphere has decreased by 12 days per century, which<br />
is equivalent to a warming <strong>of</strong> 1.2°C per century. A 20-year<br />
record <strong>of</strong> ice thickness in late March on an alpine lake in<br />
the Niwot Ridge <strong>LTER</strong> site shows a consistent thinning<br />
<strong>of</strong> the ice cover at 2.0 cm per year (Caine 2002). Ice cover<br />
exhibits strong control over exchanges in gases and material,<br />
solar radiation, and heat between aquatic habitats and<br />
the atmosphere. The duration <strong>of</strong> ice exerts a pr<strong>of</strong>ound<br />
influence on the patterns <strong>of</strong> water circulation and thermal<br />
stratification, which are closely linked to the life cycles <strong>of</strong><br />
aquatic organisms and to the biogeochemical cycling <strong>of</strong> the<br />
ecosystem.<br />
Snow (figure 2d) is the largest component <strong>of</strong> the cryosphere<br />
in areal extent. About 98% <strong>of</strong> the snow-covered land<br />
on Earth is in the Northern Hemisphere, which contains<br />
nearly half <strong>of</strong> the planet’s land surface. In the Southern<br />
Hemisphere, over 99% <strong>of</strong> the snow cover is confined to<br />
Antarctica and largely consists <strong>of</strong> perennial snow. In the<br />
Northern Hemisphere, strong negative trends in the extent<br />
<strong>of</strong> snow cover have been observed over recent decades (Déry<br />
and Brown 2007). Increased snowfall and snow depth have<br />
been reported at the highest-elevation sites <strong>of</strong> the western<br />
United States (Williams et al. 1996); however, most locations<br />
in the Mountain West have experienced snowpack<br />
declines, and concern has risen about streamflow, water<br />
yields, and water supply. In the Pacific Northwest, extensive<br />
snow- covered regions are now deemed at risk in terms <strong>of</strong><br />
their capacity to provide reliable water yields because <strong>of</strong><br />
atmospheric warming, altitudinal shifts in the distribution<br />
<strong>of</strong> snow and rain, and declining winter snowpacks (Nolin<br />
and Daly 2006). Winter snow depths have also been decreasing<br />
throughout the northeastern United States. For example,<br />
at the Hubbard Brook <strong>LTER</strong> site in New Hampshire,<br />
the maximum snow depth has declined by 25 cm (7 cm<br />
water equivalent), and snow cover duration has decreased<br />
by 21 days over the past 53 years (Campbell et al. 2010),<br />
which has led to major changes in terrestrial and aquatic<br />
ecosystems.<br />
One simple metric in the attempt to capture potential<br />
ecosystem vulnerability to changes in the cryosphere across<br />
ecosystems is the duration <strong>of</strong> frost and freezing temperatures<br />
(table 2, figure 3). Frost days are those with long-term mean<br />
daily minimum temperatures below 0°C; freeze days are<br />
those with long-term mean daily maximum temperatures<br />
below 0°C. Vulnerability can be thought <strong>of</strong> as susceptible<br />
to increased or decreased frost or freezing periods. For<br />
example, ecosystems that do not experience frost, such<br />
as those in the tropics, are highly vulnerable to cold temperatures.<br />
Significant ecosystem changes could be expected<br />
if the climate were to cool, making frost commonplace.<br />
Alternatively, ecosystems accustomed to long frozen periods,<br />
such as polar and high alpine ecosystems, are highly vulnerable<br />
to warm temperatures. Those ecosystems exposed to<br />
moderate periods <strong>of</strong> frost or freezing would be expected to<br />
be less vulnerable to changes in temperature. We focus on<br />
the warming climate, and as such, the tropical ecosystems<br />
will not be directly exposed to cryospheric losses, whereas<br />
polar and high alpine ecosystems may be the most vulnerable<br />
to such change. In table 2 and figure 3, we can see the<br />
vulnerability <strong>of</strong> the major ecosystem research sites under<br />
study by US scientists.<br />
Ecosystem responses to the loss <strong>of</strong> snow and ice<br />
The various components <strong>of</strong> the cryosphere provide physical<br />
habitat for diverse organisms. Iconic examples include<br />
polar bears and penguins in sea ice and pikas in rock glaciers<br />
(rock debris with ice filling the void spaces between<br />
the rocks; the mass flows downhill), but many other species<br />
ranging in size from microbes to whales inhabit permafrost,<br />
glaciers, sea-ice, and snow-covered landscapes. As these<br />
habitats shrink and disappear, resident species are forced to<br />
migrate, <strong>of</strong>ten tracking the distribution <strong>of</strong> receding frozen<br />
habitats across the landscape. Since different organisms<br />
respond and move at different rates (e.g., trees versus penguins),<br />
cryosphere recession can have many consequences:<br />
the fragmentation <strong>of</strong> animal and plant communities and<br />
the development <strong>of</strong> new assemblages, disruption <strong>of</strong> seasonally<br />
synchronized phenological connections among species,<br />
and losses in biodiversity and the associated changes<br />
in ecosystem function (Parmesan 2006). Although these<br />
processes are occurring at unprecedented rates in response<br />
to rapid climate warming, it has required decades <strong>of</strong> coordinated<br />
observations to document significant change and<br />
to uncover the mechanisms linking climate forcing to ecosystem<br />
responses.<br />
Prolonged, systematic studies <strong>of</strong> this type are a key contribution<br />
<strong>of</strong> <strong>LTER</strong>. The <strong>LTER</strong> Network <strong>of</strong> sites facilitates longterm<br />
observations, experiments, and comparative studies<br />
that enable us to identify common processes and mechanisms<br />
across diverse ecosystems. The highly interdisciplinary<br />
nature <strong>of</strong> <strong>LTER</strong> helps to quickly reveal interpretations <strong>of</strong><br />
408 BioScience • April 2012 / Vol. 62 No. 4 www.biosciencemag.org
Table 2. Cryosphere processes at US Long Term Ecological Research (<strong>LTER</strong>) Network sites and related <strong>LTER</strong> sites.<br />
Site Abbreviation Record<br />
Continental<br />
glacier<br />
causes and consequences and needed adjustments <strong>of</strong> monitoring<br />
approaches to catch signals <strong>of</strong> previously unmonitored<br />
or unanticipated system behaviors. Here, we present<br />
some notable examples <strong>of</strong> ecological and biogeochemical<br />
changes in response to cryosphere loss.<br />
Changes in populations and trophodynamic implications. Decadalscale<br />
declines or distributional shifts in snow- and icedependent<br />
species are now extensive and well documented<br />
(Chapin et al. 2005). When ice-dependent species suffer<br />
habitat loss, the changes in frozen habitats (glaciers, sea<br />
ice, snowpacks, and permafrost) impose both bottom-up<br />
and top-down forcings on terrestrial and aquatic ecosystems.<br />
Ice loss affects ecosystems directly through the loss<br />
<strong>of</strong> physical habitat and through alterations in thermal<br />
conditions and indirectly by altering light and nutrient<br />
supply to primary producers. Both Arctic and Antarctic<br />
sea ice harbor a resident microbial community <strong>of</strong> diatoms,<br />
other phytoplankton, bacteria, and protozoan grazers that<br />
contributes to the total primary production <strong>of</strong> polar seas.<br />
Like sea ice, ice and rock glaciers are habitats for specially<br />
adapted species that may disappear as glaciers retreat and<br />
their cold, glacier-fed streams disappear. The American pika<br />
Alpine<br />
glacier Sea ice Lake ice<br />
Continuous<br />
permafrost<br />
Discontinuous<br />
permafrost<br />
Seasonal<br />
snow<br />
McMurdo MCM 1 1988–2009 X X X X<br />
Arctic Tundra ARC 1 1988–2008 X X X<br />
Niwot Ridge NWT 1 1952–2006 X X X X<br />
Bonanza Creek BNZ 1 1988–2009 X X<br />
Palmer PAL 1 1989–2010 X X X X<br />
Loch Vale LVW 2 1993–2008 X X X X<br />
Marcell MAR 1961–2010 X<br />
North Temperate<br />
Lakes<br />
NTL 1 1978–2010 X X<br />
Hubbard Brook HBR 1,3 1964–2007 X<br />
Harvard Forest HFR 1 1964–2002 X<br />
Kellogg KBS 1 1988–2010 X<br />
Shortgrass Steppe SGS 1 1969–2010 X<br />
Sevilleta SEV 1,4 1991–2010 X<br />
Articles<br />
Fernow FER 3 1951–2007 X<br />
Konza KNZ 1 1982–2011 X<br />
Plum Island PIE 1 1950–2004 X X<br />
<strong>Coweeta</strong> CWT 1,3 1950–2009 X<br />
Baltimore BES 1 2000–2009 X<br />
Andrews Forest AND 1,3 1957–2007 X X<br />
Jornada JRN 1,3 1983–2009 X<br />
Olympic OLY 5 1962–2009 X<br />
Transient<br />
snow<br />
Note: The superscript number next to the abbreviation refers to the sponsoring agency for that site: 1, US <strong>LTER</strong> Network site; 2, US Geological Survey<br />
Water, Energy, and Biochemical Budgets site; 3, US Department <strong>of</strong> Agriculture Experimental Forest and Range site; 4, National Wildlife Refuge; 5, State<br />
Experimental Forest. Record refers to the length <strong>of</strong> the air-temperature record used to estimate frost and freezing duration at each location.<br />
(Ochotona princeps)—although it is not as well known or<br />
charismatic as penguins or polar bears—is attaining new<br />
status as a poster child for glacier loss and climate change.<br />
Pikas do not hibernate and use subsurface microclimates<br />
in rocky debris to persist where surface conditions would<br />
preclude their survival. Despite this adaptation, some local<br />
pika extinctions in the Northwest have been linked to cold<br />
exposure caused by a loss <strong>of</strong> insulating snow cover (Ray et al.<br />
2012). Permafrost thaw also results in habitat disappearance<br />
for its resident species. Because permafrost occurs in so<br />
many different habitats in different stages <strong>of</strong> development,<br />
its loss may trigger primary or secondary successions.<br />
Widespread past and projected future reductions in<br />
snow-cover extent, duration, depth, and water equivalent<br />
can also have extensive ecological repercussions. Many plant<br />
and animal species are adapted to snow-cover conditions<br />
and will perish if they are unable to migrate or tolerate<br />
less snow cover. Even so, not all animals that live in cold<br />
environments respond negatively to reductions in snow<br />
cover. For example, ungulates such as white-tailed deer,<br />
mule deer, elk, and caribou expend less energy and are less<br />
susceptible to predation when snowpacks are shallower.<br />
Some <strong>of</strong> the species most susceptible to snow-cover loss<br />
www.biosciencemag.org April 2012 / Vol. 62 No. 4 • BioScience 409
Articles<br />
Figure 3. Duration <strong>of</strong> frost and freezing periods at <strong>LTER</strong> and related long-term research<br />
sites, from climate records. See table 2 for the site abbreviations. Frost days are those<br />
with long-term mean daily minimum temperatures below 0 degrees Celsius (°C); freeze<br />
days are those with long-term mean daily maximum temperatures below 0°C.<br />
are those that overwinter below ground, since snow insulates<br />
the subsurface and moderates its temperature. The<br />
shortgrass steppe in the western United States receives little<br />
snowfall and therefore presents an endpoint in the spectrum<br />
<strong>of</strong> snow cover. At this semiarid, high-elevation site,<br />
snowfall from November to late February has little effect<br />
on ecological processes; however, large snowfalls in March<br />
and April (after the ground has thawed) strongly influence<br />
the subsequent productivity by controlling the availability<br />
<strong>of</strong> water and nutrients (Cayan et al. 2001). Some plants<br />
are photosynthetically active in shallow spring snowpacks,<br />
giving them a competitive advantage in regions with short<br />
growing seasons (Starr and Oberbauer 2003). As the climate<br />
warms, the disappearance <strong>of</strong> snow cover and the increased<br />
length <strong>of</strong> the growing season may benefit some plants,<br />
provided that other requirements for growth are not limiting.<br />
Many plants in alpine and tundra regions are reliant<br />
on snow for water and nutrients and therefore are found<br />
in the greatest abundance where the range <strong>of</strong> snow depths<br />
is optimal (Walker et al. 1993). Although the snow-free<br />
period will lengthen in a warmer climate, the lack <strong>of</strong> snow<br />
cover during colder months will increase soil temperature<br />
variation, making roots susceptible to winter injury. Soil<br />
freezing can directly and adversely affect roots by causing<br />
cellular damage and can also sever fine roots through frost<br />
heaving. Reduced nutrient uptake as a result <strong>of</strong> root injury<br />
has been shown to lower nutrient retention and to increase<br />
hydrologic fluxes from soils during the growing season<br />
(Fitzhugh et al. 2001).<br />
Changes in habitat and productivity<br />
regimes can ripple up<br />
the trophic ladder, as is demonstrated<br />
extensively in marine<br />
food webs. Changing snow<br />
and ice conditions alter habitat<br />
suitability for many bird species<br />
(e.g., petrels, Adelie penguins<br />
[Pygoscelis adeliae]) and<br />
limit the physical space available<br />
for habitation (Micol and<br />
Jouventin 2001, Weimerskirch<br />
et al. 2003). The huge populations<br />
<strong>of</strong> krill in Antarctic marginal<br />
sea-ice zones serve in turn<br />
as a major food resource for a<br />
suite <strong>of</strong> large predators, including<br />
seabirds, seals, and whales.<br />
Sea-ice microbial communities<br />
serve as a principal food source<br />
for juvenile krill, which also<br />
hide from predators in underice<br />
cryptic spaces. Therefore, the<br />
regional decline in the duration<br />
and extent <strong>of</strong> sea-ice cover in the<br />
Bellingshausen and Amundsen<br />
Seas has resulted in declining<br />
abundance and ranges <strong>of</strong> Antarctic krill (Euphausia superba),<br />
possibly the most numerous metazoan species on Earth.<br />
Atkinson and colleagues (2004) documented large-scale,<br />
order-<strong>of</strong>- magnitude declines in krill populations over 50 years<br />
in the South Atlantic sector <strong>of</strong> the Antarctic seas. Meanwhile,<br />
the number <strong>of</strong> salps—pelagic, gelatinous, ice-avoiding tunicates<br />
with few predators—has increased; they have, in effect,<br />
replaced krill as an intermediate species in Antarctic marine<br />
food chains. One <strong>of</strong> the best-studied examples <strong>of</strong> the response<br />
<strong>of</strong> predator populations to sea-ice loss is the Adelie penguin,<br />
a true Antarctic penguin with strong fidelity to sea ice as a<br />
platform for foraging activity (Ducklow et al. 2007). Since<br />
1975, Adelie penguins nesting near Palmer Station have<br />
declined by about 80% in response to a host <strong>of</strong> environmental<br />
changes, including habitat loss and altered food availability<br />
(figure 4). Fraser and H<strong>of</strong>mann (2003) demonstrated that<br />
penguin chicks weighing less than 300 grams at fledging<br />
had a reduced probability <strong>of</strong> surviving past the first year.<br />
They suggested that changes in the sea-ice season shifted the<br />
period <strong>of</strong> maximum krill stocks away from the penguins’<br />
peak foraging season. Over the same period, two subpolar<br />
species—chinstrap (Pygoscelis antarcticus) and gentoo penguins<br />
(Pygoscelis papua)—have successfully immigrated to the<br />
region and now constitute half <strong>of</strong> the total penguin population<br />
in the region. The mechanisms behind these shifts and<br />
their long-term outcome are unclear (Trivelpiece et al. 2011).<br />
The recent loss <strong>of</strong> sea ice could boost primary productivity in<br />
the Arctic Ocean by a factor <strong>of</strong> two or three. In the northern<br />
Bering Sea, primary-productivity changes caused by warming<br />
410 BioScience • April 2012 / Vol. 62 No. 4 www.biosciencemag.org
Year<br />
Figure 4. Populations <strong>of</strong> ice-dependent (Adelie) and icetolerant<br />
(chinstrap and gentoo) penguins near Palmer<br />
Station, Antarctica, measured between 1976 and 2009.<br />
Source: Adapted from Ducklow and colleagues (2007).<br />
and sea-ice loss have resulted in a dramatic reorganization <strong>of</strong><br />
the ecosystem (Grebmeier et al. 2006). This shallow marine<br />
ecosystem was formerly characterized by high primary productivity<br />
and efficient export to the bottom, which supports a<br />
high stock <strong>of</strong> benthic prey for diving ducks and walruses. With<br />
the loss <strong>of</strong> sea ice and the warming <strong>of</strong> the water column, the<br />
export <strong>of</strong> surface productivity into the benthos has declined,<br />
which has caused a switch from a system with top predators<br />
sustained by benthic prey to one dominated by pelagic fish.<br />
Changes in biogeochemical cycles. Changes in the extent, seasonality,<br />
and duration <strong>of</strong> cryosphere components affect the<br />
cycling <strong>of</strong> nutrients in land and ocean ecosystems. Glacier<br />
retreat and rock glacier shrinkage expose new landscapes<br />
that are typically carbon poor yet nutrient rich because<br />
<strong>of</strong> rock weathering. Microbial life—particularly nitrogen<br />
fixers—occupy these new landscapes (Nemergut et al. 2007),<br />
which increases the nitrate levels <strong>of</strong> streams and lakes down<br />
valley. These conditions are transient and slowly change<br />
as higher plants occupy the landscape over time scale <strong>of</strong><br />
decades to centuries. High alpine waters are typically oligotrophic<br />
and are therefore susceptible to ecological changes<br />
that result from increases in nitrogen export from the land<br />
(Baron et al. 2009). Williams and colleagues (2007) characterized<br />
the nutrient content in the outflow <strong>of</strong> the Green<br />
Lake 5 rock glacier, located in the Green Lakes Valley <strong>of</strong> the<br />
Colorado Front Range. The nitrate concentrations from<br />
the rock glacier are among the highest reported for highelevation<br />
surface waters. These extreme nitrate concentrations<br />
appear to be characteristic <strong>of</strong> rock glacier outflows in<br />
the Rocky Mountains (Williams et al. 2007). Fluorescence<br />
index values and dissolved organic matter (DOM) measurements<br />
are consistent with a switch from terrestrial DOM in<br />
the summer to an increasingly aquatic-like microbial source<br />
during the autumn months. Glacier melting has also been<br />
implicated in the regulation <strong>of</strong> phytoplankton species composition<br />
in Antarctic coastal regions where diatoms—the<br />
Articles<br />
preferred food for Antarctic krill (see above)—are being<br />
replaced by less-palatable cryptophytes. Glacial inputs<br />
change light availability by stabilizing the surface-water<br />
column and possibly stimulate growth selectively by adding<br />
limiting micronutrients (Dierssen et al. 2002). Melting<br />
glaciers and sea ice also transfer airborne pollutants stored<br />
in the snow and ice to the marine environment.<br />
Perhaps the most important result from the reduction in<br />
duration <strong>of</strong> lake ice in a warming climate is less-frequent<br />
oxygen-depletion events and the associated adverse biological<br />
consequences (Prowse et al. 2006). For river ice, large<br />
fluxes <strong>of</strong> allocthonous detrital material and nutrients are<br />
flushed into the river water column because <strong>of</strong> channel scour<br />
during ice breakup and flooding. Geomorphically, at the<br />
Pine Island <strong>LTER</strong> site in coastal Massachusetts, the formation<br />
and transport <strong>of</strong> river ice are important factors in determining<br />
salt marsh platform elevation and have implications<br />
for responses to rising sea level. The delivery <strong>of</strong> sediment to<br />
the marsh through ice rafting (Wood et al. 1989), the compression<br />
<strong>of</strong> the marsh surface as a function <strong>of</strong> ice thickness,<br />
and the scour <strong>of</strong> vegetation are winter processes that will<br />
change as less river ice forms and its transport into fringing<br />
salt marshes declines in the coming decades.<br />
In cold regions, nutrient cycling is closely coupled with<br />
snowpack dynamics, with much <strong>of</strong> the annual export <strong>of</strong><br />
stream nutrients occurring in winter, when biological uptake<br />
is low. Changes in the snowpack alter hydrology, which<br />
affects the amount, timing, and magnitude <strong>of</strong> spring snowmelt.<br />
The resulting changes in streamflow not only affect<br />
nutrient transport but, when they are combined with<br />
changes in temperature, also affect aquatic habitats, causing<br />
potential shifts in species assemblages. Nutrients accumulate<br />
in the snowpack over winter and are released in an ionic<br />
pulse during the first portion <strong>of</strong> snowmelt (Johannessen and<br />
Henriksen 1978). Although snowmelt can be an important<br />
source <strong>of</strong> nutrients and water early in the growing season,<br />
it can also cause episodic acidification in areas with high<br />
atmospheric deposition and poorly buffered soils (e.g.,<br />
Schaefer et al. 1990). The soils beneath the snowpack are also<br />
an important source <strong>of</strong> nutrients during winter and early<br />
spring. The snowpack regulates soil temperatures, keeping<br />
them warm enough for many biologically mediated reactions.<br />
Snow fence experiments, which enhance winter snow<br />
accumulation, have shown that higher rates <strong>of</strong> soil microbial<br />
respiration and nitrogen mineralization occur under deeper<br />
snowpacks in subalpine forest and Arctic tundra environments<br />
because <strong>of</strong> warmer soil temperatures that result from<br />
the thermally insulating effects <strong>of</strong> the snow (Schimel et al.<br />
2004). In contrast, in boreal spruce and temperate hardwood<br />
forests, thin winter snowpacks increase the frequency and<br />
depth <strong>of</strong> soil freezing, which results in elevated summer<br />
nitrogen emissions that are probably a result <strong>of</strong> reduced<br />
nitrate uptake by damaged roots and by root decomposition<br />
(Fitzhugh et al. 2001, Maljanen et al. 2010). Fluxes <strong>of</strong> carbon<br />
dioxide (CO 2 ) mirror those <strong>of</strong> nitrogen, and the timing<br />
and magnitude <strong>of</strong> the nitrogen and CO 2 fluxes in all cases<br />
www.biosciencemag.org April 2012 / Vol. 62 No. 4 • BioScience 411
Articles<br />
depends on plant species. Elevated nitrogen mineralization<br />
contributes significantly to fluxes <strong>of</strong> greenhouse gases and<br />
to the cycling <strong>of</strong> nitrogen and carbon. In the mixed-grass<br />
prairie <strong>of</strong> North America, greater snowpack increased soil<br />
moisture by midsummer, which resulted in increased soil<br />
respiration (Chimner and Welker 2005) and increased plant<br />
invasions (Blumenthal et al. 2008).<br />
But most <strong>of</strong> the attention to the biogeochemical consequences<br />
<strong>of</strong> cryosphere loss has been focused on the potential<br />
for changes in carbon storage and release. Arctic permafrost<br />
contains twice the CO 2 found in the atmosphere, which<br />
dramatically demonstrates the potential for altering the<br />
climate as further warming occurs. Site-specific information<br />
can provide some indication as to the future release<br />
rate <strong>of</strong> carbon from thawing permafrost. A recent group<br />
<strong>of</strong> studies was focused on an upland thermokarst site near<br />
Denali National Park in Alaska, where changes in plant and<br />
soil processes were studied as a function <strong>of</strong> time since the<br />
thermokarst disturbance was initiated. The studies showed<br />
that increased permafrost thaw and ground-surface subsidence<br />
increased net and gross primary productivity as<br />
plant growth was stimulated by a thaw (Vogel et al. 2010).<br />
Plant species composition changed along with changes in<br />
plant growth rates as graminoid-dominated moist acidic<br />
tundra shifted to shrub-dominated tundra with increased<br />
rates <strong>of</strong> thawing. The increased carbon uptake by plants<br />
initially <strong>of</strong>fset the greater ecosystem respiration, such that<br />
this thermokarst was a net sink <strong>of</strong> carbon 15 years after the<br />
initiation <strong>of</strong> the thaw, even though decomposition <strong>of</strong> older<br />
carbon deep in the soil was already taking place (Schuur<br />
et al. 2009). Over more decades <strong>of</strong> thaw, plant growth rates<br />
remained high, but increased old soil carbon losses eventually<br />
<strong>of</strong>fset the greater carbon uptake, and this thermokarst<br />
became a net source <strong>of</strong> carbon to the atmosphere.<br />
In a contrasting study <strong>of</strong> lowland thermokarst in three<br />
Canadian peatlands, the carbon accumulation in surface<br />
soil organic matter was higher in unfrozen bogs and in<br />
areas where permafrost had degraded than in areas where<br />
permafrost was intact (Turetsky et al. 2007). This growth<br />
in surface soil carbon accumulation was consistent with<br />
the Alaskan upland study, but the equivalent net ecosystem<br />
carbon exchange measurements were not available to<br />
determine whether the thawed permafrost peat ecosystems<br />
were overall net sources or sinks <strong>of</strong> carbon. Permafrost<br />
thaw in this lowland system promoted the release <strong>of</strong> methane<br />
(CH 4 ) because waterlogged conditions predominated<br />
in Sphagnum moss lawns that replaced the feather moss<br />
(Hylocomium splendens) and black spruce (Picea mariana)<br />
forest in locations where permafrost degraded. This CH 4<br />
release was hypothesized to potentially <strong>of</strong>fset the observed<br />
surface soil carbon accumulation for at least for 70 years,<br />
until plant and ecosystem succession in the moss lawn created<br />
conditions more like those in the unfrozen bogs, which<br />
stored surface soil carbon but released only small amounts<br />
<strong>of</strong> CH 4 . The release <strong>of</strong> CH 4 is a common pathway <strong>of</strong> carbon<br />
loss in lowland thermokarst, where drainage is restricted<br />
( Myers-Smith et al. 2007), and CH 4 has 25 times greater heattrapping<br />
capacity than CO 2 on a century timescale. However,<br />
decreased total carbon emissions in anaerobic systems can<br />
partially <strong>of</strong>fset the increased radiative forcing <strong>of</strong> CH 4 release,<br />
which possibly makes the net radiative forcing <strong>of</strong> increased<br />
carbon losses in lowland and upland thermokarst more<br />
similar than what the difference in heat-trapping capacity<br />
between CO 2 and CH 4 would initially suggest.<br />
The oceanic sink for anthropogenic CO 2 is large and<br />
lessens the potential greenhouse effect by limiting CO 2<br />
accumulation in the atmosphere. The current (2009) net<br />
annual carbon uptake by the ocean is 2.3 ± 0.4 petagrams<br />
(Pg) <strong>of</strong> carbon per year, compared to 2.4 Pg <strong>of</strong> carbon<br />
per year for land, but the land uptake is partially <strong>of</strong>fset by<br />
the 1.1 ± 0.7 Pg <strong>of</strong> carbon per year in releases caused by<br />
deforestation (Le Quéré et al. 2009). As the ocean warms and<br />
its inventory <strong>of</strong> CO 2 increases, the oceanic sink is expected<br />
to weaken. Oceanic CO 2 uptake is governed by gas exchange<br />
across the air–sea interface, so the regional allocation <strong>of</strong><br />
CO 2 uptake is primarily a function <strong>of</strong> the area <strong>of</strong> sea surface<br />
involved. This fraction has been predicted to increase as ice<br />
melts and productivity increases, which will expose new<br />
ocean areas to solar irradiance (Peck et al. 2010). The Arctic<br />
Ocean constitutes just 3% <strong>of</strong> the total ocean area and is<br />
mostly covered by sea ice, which blocks gas exchange, but it<br />
accounts for 5%–14% <strong>of</strong> the total ocean CO 2 uptake. New<br />
observations suggest, however, that the recent dramatic loss<br />
<strong>of</strong> sea ice has been accompanied by decreased rather than<br />
increased CO 2 uptake (Cai et al. 2010), which is counter to<br />
current understanding and predictions. The rapid, diverse,<br />
and complex changes wrought by cryosphere loss constitute<br />
a major scientific challenge that demands new large-scale<br />
observing systems on land and in the ocean to provide new<br />
observational infrastructure as a resource for coordinated<br />
experimental studies performed by the <strong>LTER</strong> Network and<br />
other scientists.<br />
Effects on humans from the loss <strong>of</strong> snow and ice<br />
Cryosphere loss will result in far-reaching social, economic,<br />
and geopolitical impacts, but a detailed treatment<br />
is beyond the scope <strong>of</strong> this synthesis. Most attention has<br />
been devoted to the impacts associated with a loss <strong>of</strong> snow<br />
cover, glacier melting, and sea-level rise, which are treated<br />
elsewhere (Kundzewicz et al. 2007). Thawing permafrost<br />
will also have important social consequences, because it can<br />
destabilize engineered structures and can cause destructive<br />
slides, flows, and slumps. Changes in snow cover can<br />
have important consequences for humans and may affect<br />
many diverse activities, including agriculture, recreation,<br />
tourism, engineering, commerce, and energy production.<br />
For example, the New Hampshire ski industry has abandoned<br />
low-elevation ski areas in the southern part <strong>of</strong> the<br />
state since the 1970s, in part because <strong>of</strong> climate warming,<br />
in favor <strong>of</strong> ski areas at higher elevations in the north<br />
(Hamilton et al. 2003). Skiing contributes about $1 billion<br />
annually to the economy <strong>of</strong> Utah, but recent climate change<br />
412 BioScience • April 2012 / Vol. 62 No. 4 www.biosciencemag.org
evaluations <strong>of</strong> the ski industry there suggest that it is at risk<br />
in the next several decades (Lazar and Williams 2008). A<br />
similar impact is anticipated for the Pacific Northwest. The<br />
most important effect is the influence on streamflow. In<br />
many semiarid regions <strong>of</strong> the world, such as the southwestern<br />
United States, snowmelt from mountain snowpacks is<br />
the dominant source <strong>of</strong> water for human consumption and<br />
irrigation. Therefore, changes in the amount and timing <strong>of</strong><br />
snowmelt in mountainous areas could affect stream ecosystem<br />
services, such as drinking- water supply, wastewater<br />
assimilation, and hydropower. Lesser amounts <strong>of</strong> snow could<br />
also have an impact on agriculture and the ability to produce<br />
food, both through an increased occurrence <strong>of</strong> drought<br />
and through an inadequate supply <strong>of</strong> water for irrigation.<br />
Some evidence suggests that changes in snowmelt may also<br />
increase the risk <strong>of</strong> forest fires. In the western United States,<br />
earlier snowmelt dates correspond to increased wildfire frequency,<br />
because soils and vegetation are becoming drier and<br />
the period <strong>of</strong> potential ignition is lengthening (Westerling<br />
et al. 2006). Estimates <strong>of</strong> sea-level rise to 2100 have been<br />
continually revised upward since the 2007 report <strong>of</strong> the<br />
Intergovernmental Panel on Climate Change (Solomon<br />
et al. 2007) as new data and modeling have been developed.<br />
At the time <strong>of</strong> this writing, the rise in sea level by the end <strong>of</strong><br />
the century is projected to be about 1 m (Pfeffer et al. 2008).<br />
The economic cost <strong>of</strong> a 1-m rise in sea level is estimated to<br />
exceed $1 trillion (Anth<strong>of</strong>f et al. 2010), with enormous social<br />
and political dislocations as residents <strong>of</strong> low-lying regions<br />
are forced to move to higher ground.<br />
The Arctic has emerged as a key laboratory for the<br />
study <strong>of</strong> climate change impacts on human communities,<br />
partly because it is host to the world’s largest indigenous<br />
population that maintains a subsistence lifestyle (K<strong>of</strong>inas<br />
et al. 2010) and partly because <strong>of</strong> the rapidly manifesting<br />
impacts on infrastructure, transportation, and international<br />
relations. The complex interplay among climate, biogeochemical,<br />
ecological, and sociopolitical factors responding to<br />
cryosphere loss in the Arctic and around the world demands<br />
new levels <strong>of</strong> interdisciplinary collaboration and new models<br />
for scientific study (Driscoll et al. 2012 [in this issue]).<br />
A system-level understanding <strong>of</strong> the global cryosphere is<br />
fundamental to predicting the future course <strong>of</strong> the Earth’s<br />
socioecological system and to laying out a course for human<br />
social, political, and economic adaptation to climate change.<br />
As was demonstrated in this article and others in this issue,<br />
socioecological ecosystem science as pioneered by the US<br />
<strong>LTER</strong> Network is a key component <strong>of</strong> our current and future<br />
understanding <strong>of</strong> cryospheric change.<br />
Conclusions<br />
Earth is distinguished in the solar system by the coexistence<br />
<strong>of</strong> water in its three phases: solid (frozen), liquid (melted),<br />
and gas (evaporated). The solid phase—the global cryosphere<br />
in all its components: glaciers; snow; permafrost; sea,<br />
lake, and river ice—is arguably the most rapidly changing<br />
element <strong>of</strong> the Earth system. Cryosphere loss can be viewed<br />
Articles<br />
as a planetary-scale redistribution <strong>of</strong> solid water into its<br />
liquid and gas phases. This large-scale reorganization will<br />
trigger changes in the balance <strong>of</strong> positive and negative<br />
feedbacks in the climate system (e.g., changes in planetary<br />
albedo), with far-reaching consequences for ecosystems<br />
and society, including changes in sea level, precipitation,<br />
and water availability. The current geophysical rates <strong>of</strong><br />
cryosphere loss are now well documented but our lack in<br />
understanding <strong>of</strong> the relevant mechanisms limits our ability<br />
to predict the future course <strong>of</strong> change, with potentially grave<br />
consequences for society. In particular, we lack long-term<br />
observations and system-level experiments in which the<br />
linkages between changes in physical habitat and climate<br />
on one hand and ecosystem structure and biogeochemical<br />
functions on the other are addressed. <strong>LTER</strong> Network sites<br />
have pioneered coordinated observations and experimental<br />
manipulations <strong>of</strong> ecosystems and elemental cycles (Knapp<br />
et al. 2012 [in this issue]). An expansion <strong>of</strong> our fundamental<br />
knowledge <strong>of</strong> the phenologies and processes governing ecosystem<br />
responses to climate change is a necessary first step<br />
in creating future scenarios <strong>of</strong> change and human responses<br />
to it (Thompson et al. 2012 [in this issue]). This new understanding<br />
will continue to come from <strong>LTER</strong> sites situated in<br />
all the major cryosphere systems (table 1).<br />
Acknowledgments<br />
The authors wish to thank the funding provided by the<br />
National Science Foundation’s (NSF) Long Term Ecological<br />
Research (<strong>LTER</strong>) Network for supporting our long-term<br />
studies, in which we track the ecosystem response to the disappearing<br />
cryosphere. The <strong>LTER</strong> Network <strong>of</strong>fice supported<br />
the workshop from which this article is derived. Table 2 and<br />
figure 3 were kindly contributed by Julia A. Jones, Kendra<br />
L. Hatcher, and Evan S. Miles. Valuable contributions were<br />
made by Mike Antolin, Anne Giblin, John Hobbie, John<br />
Magnusson, Anne Nolin, Bruce Peterson, Bill Sobczak, and<br />
Will Wolheim. We greatly appreciate all who participated.<br />
Fred Swanson <strong>of</strong>fered many helpful suggestions, and David<br />
Foster carefully edited the manuscript (and it is much<br />
improved). NSF <strong>LTER</strong> Site Grants OPP 0823101, OPP<br />
1115245, DEB 1114804, DEB-1026415, DEB-0620579, and<br />
DEB-1027341 supported the authors during the preparation<br />
<strong>of</strong> this article.<br />
References cited<br />
Anth<strong>of</strong>f D, Nicholls R, Tol RSJ. 2010. The economic impact <strong>of</strong> substantial<br />
sea-level rise. Mitigation and Adaptation Strategies for Global Change<br />
15: 321–335.<br />
Atkinson A, Siegel V, Pakhomov E, Rothery P. 2004. Long-term decline in<br />
krill stock and increase in salps within the Southern Ocean. Nature 432:<br />
100–103.<br />
Baron JS, Schmidt TM, Hartman MD. 2009. Climate-induced changes in<br />
high elevation stream nitrate dynamics. Global Change Biology 15:<br />
1777–1789.<br />
Blumenthal D, Chimner RA, Welker KM, Morgan JA. 2008. Increased snow<br />
facilitates plant invasion in mixedgrass prairie. New Phytologist 179:<br />
440–448.<br />
www.biosciencemag.org April 2012 / Vol. 62 No. 4 • BioScience 413
Articles<br />
Bowden WB, Gooseff MN, Balser A, Green A, Peterson BJ, Bradford J.<br />
2008. Sediment and nutrient delivery from thermokarst features in the<br />
foothills <strong>of</strong> the North Slope, Alaska: Potential impacts on headwater<br />
stream ecosystems. Journal <strong>of</strong> Geophysical Research 113 (Art. G02026).<br />
doi:10.1029/2007JG000470.<br />
Cai W-J, et al. 2010. Decrease in the CO 2 uptake capacity in an ice-free<br />
Arctic Ocean basin. Science 329: 556–559.<br />
Caine N. 2002. Declining ice thickness on an alpine lake is generated by<br />
increased winter precipitation. Climatic Change 54: 463–470.<br />
———. 2010. Recent hydrologic change in a Colorado alpine basin: An<br />
indicator <strong>of</strong> permafrost thaw? Annals <strong>of</strong> Glaciology 51: 130–134.<br />
Campbell JL, Ollinger SV, Flerchinger GN, Wicklein H, Hayhoe K, Bailey<br />
AS. 2010. Past and projected future changes in snowpack and soil frost<br />
at the Hubbard Brook Experimental Forest, New Hampshire, USA.<br />
Hydrological Processes 24: 2465–2480.<br />
Cayan DR, Kammerdiener SA, Dettinger MD, Caprio JM, Peterson DH.<br />
2001. Changes in the onset <strong>of</strong> spring in the western United States.<br />
Bulletin <strong>of</strong> the American Meteorological Society 82: 399–415.<br />
Chapin FS III, et al. 2005. Polar systems. Pages 717–743 in Hassan R, Scholes<br />
R, Ash N, eds. Ecosystems and Human Well-being: Current State and<br />
Trends. Island Press.<br />
Chimner RA, Welker JM. 2005. Ecosystem respiration responses to experimental<br />
manipulations <strong>of</strong> winter and summer precipitation in a<br />
Mixedgrass Prairie, WY, USA. Biogeochemistry 73: 257–270.<br />
Comiso JC, Nishio F. 2008. Trends in the sea ice cover using enhanced and<br />
compatible AMSR-E, SSM/I, and SMMR data. Journal <strong>of</strong> Geophysical<br />
Research 113 (Art. C02S07). doi:10.1029/2007JC004257.<br />
Déry SJ, Brown RD. 2007. Recent Northern Hemisphere snow cover extent<br />
trends and implications for the snow-albedo feedback. Geophysical<br />
Research Letters 34 (Art. L22504). doi:22510.21029/22007GL031474.<br />
Dierssen HM, Smith RC, Vernet M. 2002. Glacial meltwater dynamics<br />
in coastal waters west <strong>of</strong> the Antarctic peninsula. Proceedings <strong>of</strong> the<br />
National Academy <strong>of</strong> Sciences 99: 1790–1795.<br />
Driscoll CT, Lambert KF, Chapin FS III, Nowak DJ, Spies TA, Swanson<br />
FJ, Kitteridge DB Jr, Hart CM. 2012. Science and society: The role<br />
<strong>of</strong> long-term studies in environmental stewardship. BioScience 62:<br />
354–366.<br />
Ducklow HW, Baker K, Martinson DG, Quetin LB, Ross RM, Smith RC,<br />
Stammerjohn SE, Vernet M, Fraser W. 2007. Marine pelagic ecosystems:<br />
The west Antarctic peninsula. Philosophical Transactions <strong>of</strong> the Royal<br />
Society <strong>of</strong> London B 362: 67–94.<br />
Dyurgerov MB, Meier MF. 2000. Twentieth century climate change:<br />
Evidence from small glaciers. Proceedings <strong>of</strong> the National Academy <strong>of</strong><br />
Sciences 97: 1406–1411.<br />
Fitzhugh RD, Driscoll CT [Jr], Gr<strong>of</strong>fman PM, Tierney GL, Fahey TJ, Hardy<br />
JP. 2001. Effects <strong>of</strong> soil freezing disturbance on soil solution nitrogen,<br />
phosphorus, and carbon chemistry in a northern hardwood ecosystem.<br />
Biogeochemistry 56: 215–238.<br />
Fountain AG, Nylen TH, MacClune KL, Dana GL. 2006. Glacier mass balances<br />
(1993–2001), Taylor Valley, McMurdo Dry Valleys, Antarctica.<br />
Journal <strong>of</strong> Glaciology 52: 451–462.<br />
Fraser WR, H<strong>of</strong>mann EE. 2003. A predator’s perspective on causal links<br />
between climate change, physical forcing and ecosystem response.<br />
Marine Ecology Progress Series 265: 1–15.<br />
Grebmeier JM, Overland JE, Moore SE, Farley EV, Carmack EC, Cooper LW,<br />
Frey KE, Helle JH, McLaughlin FA, McNutt SL. 2006. A major ecosystem<br />
shift in the northern Bering Sea. Science 311: 1461–1464.<br />
Hamilton LC, Rohall DE, Brown BC, Hayward GF, Keim BD. 2003. Warming<br />
winters and New Hampshire’s lost ski areas: An integrated case study.<br />
International Journal <strong>of</strong> Sociology and Social Policy 23: 52–73.<br />
Johannessen M, Henriksen A. 1978. Chemistry <strong>of</strong> snow meltwater: Changes<br />
in concentration during melting. Water Resources Research 14:<br />
615–619.<br />
Knapp AK, et al. 2012. Past, present, and future roles <strong>of</strong> long-term experiments<br />
in the <strong>LTER</strong> network. BioScience 62: 377–389.<br />
K<strong>of</strong>inas GP, Chapin FS III, BurnSilver S, Schmidt JI, Fresco NL, Kielland<br />
K, Martin S, Springsteen A, Rupp TS. 2010. Resilience <strong>of</strong> Athabascan<br />
subsistence systems to interior Alaska’s changing climate. Canadian<br />
Journal <strong>of</strong> Forest Research 40: 1347–1359.<br />
Kundzewicz ZW, Mata LJ, Arnell NW, Döll P, Kabat P, Jiménez B, Miller K,<br />
Oki T, Sen Z, Shiklomanov IA. 2007. Freshwater resources and their<br />
management. Pages 173–210 in Parry ML, Canziani OF, Palutik<strong>of</strong> JP,<br />
van der Linden PJ, Hanson CE, eds. Climate Change 2007: Impacts,<br />
Adaptation and Vulnerability. Contribution <strong>of</strong> Working Group II to the<br />
Fourth Assessment Report <strong>of</strong> the Intergovernmental Panel on Climate<br />
Change. Cambridge <strong>University</strong> Press.<br />
Lazar B, Williams M. 2008. Climate change in western ski areas: Potential<br />
changes in the timing <strong>of</strong> wet avalanches and snow quality for the<br />
Aspen ski area in the years 2030 and 2100. Cold Regions Science and<br />
Technology 51: 219–228.<br />
Le Quéré C, et al. 2009. Trends in the sources and sinks <strong>of</strong> carbon dioxide.<br />
Nature Geoscience 2: 831–836.<br />
Magnuson JJ, et al. 2000. Historical trends in lake and river cover in the<br />
Northern Hemisphere. Science 289: 1743–1746.<br />
Maljanen M, Alm J, Martikainen PJ, Repo T. 2010. Prolongation <strong>of</strong> soil frost<br />
resulting from reduced snow cover increases nitrous oxide emissions<br />
from boreal forest soil. Boreal Environment Research 15: 34–42.<br />
Maurer J. 2007. Atlas <strong>of</strong> the Cryosphere. National Snow and Ice Data Center.<br />
(26 January 2012; http://nsidc.org/data/atlas).<br />
Mazhitova G, Malkova G, Chestnykh O, Zamolodchikov D. 2008. Recent<br />
decade thaw depth dynamics in the European Russian Arctic based on<br />
the Circumpolar Active Layer Monitoring (CALM) data. Pages 433–438<br />
in Kane DL, Hinkel KM, eds. Proceedings <strong>of</strong> the Ninth International<br />
Conference on Permafrost. Institute <strong>of</strong> Northern Engineering, <strong>University</strong><br />
<strong>of</strong> Alaska, Fairbanks.<br />
Micol T, Jouventin P. 2001. Long-term population trends in seven Antarctic<br />
seabirds at Pointe Géologie (Terre Adélie): Human impact compared<br />
with environmental change. Polar Biology 24: 175–185.<br />
Myers-Smith IH, McGuire AD, Harden JW, Chapin FS III. 2007. Influence<br />
<strong>of</strong> disturbance on carbon exchange in a permafrost collapse and adjacent<br />
burned forest. Journal <strong>of</strong> Geophysical Research 112: 11.<br />
Nemergut DR, Anderson SP, Cleveland CC, Martin AP, Miller AE, Seimon<br />
A, Schmidt SK. 2007. Microbial community succession in unvegetated,<br />
recently-deglaciated soils. Microbial Ecology 53: 110–122.<br />
Nolin AW, Daly C. 2006. Mapping “at risk” snow in the Pacific Northwest.<br />
Journal <strong>of</strong> Hydrometeorology 7: 1164–1171.<br />
Parmesan C. 2006. Ecological and evolutionary responses to recent climate<br />
change. Annual Review <strong>of</strong> Ecology, Evolution, and Systematics 37:<br />
637–669.<br />
Peck LS, Barnes DKA, Cook AJ, Fleming AH, Clarke A. 2010. Negative feedback<br />
in the cold: Ice retreat produces new carbon sinks in Antarctica.<br />
Global Change Biology 16: 2614–2623.<br />
Pfeffer WT, Harper JT, O’Neel S. 2008. Kinematic constraints on glacier<br />
contributions to 21st-century sea-level rise. Science 321: 1340–1343.<br />
Prowse TD, Wrona FJ, Reist JD, Gibson JJ, Hobbie JE, Lévesque LMJ,<br />
Vincent WF. 2006. Climate change effects on hydroecology <strong>of</strong> Arctic<br />
freshwater ecosystems. Ambio: A Journal <strong>of</strong> the Human Environment<br />
35: 347–358.<br />
Ray C, Beever E, Loarie S. 2012. Retreat <strong>of</strong> the American pika: Up the mountain<br />
or into the void? In Brodie JF, Post E, Doak D, eds. Conserving<br />
Wildlife Populations in a Changing Climate. <strong>University</strong> <strong>of</strong> Chicago<br />
Press. Forthcoming.<br />
Robertson GP, et al. 2012. Long-term ecological research in a humandominated<br />
world. BioScience 62: 342–353.<br />
Romanovsky VE, Gruber S, Instanes A, Jin H, Marchenko SS, Smith SL,<br />
Trombotto D, Walter KM. 2007. Frozen ground. Pages 181–200 in<br />
United Nations Environment Programme (UNEP). Global Outlook for<br />
Ice and Snow. UNEP.<br />
Schaefer DA, Driscoll CT Jr, van Dreason R, Yatsko CP. 1990. The episodic<br />
acidification <strong>of</strong> Adirondack lakes during snowmelt. Water Resources<br />
Research 26: 1639–1647.<br />
Schimel JP, Bilbrough C, Welker JM. 2004. Increased snow depth affects<br />
microbial activity and nitrogen mineralization in two Arctic tundra<br />
communities. Soil Biology and Biogeochemistry 36: 217–227.<br />
414 BioScience • April 2012 / Vol. 62 No. 4 www.biosciencemag.org
Schuur EAG, Vogel JG, Crummer KG, Lee H, Sickman JO, Osterkamp TE.<br />
2009. The effect <strong>of</strong> permafrost thaw on old carbon release and net<br />
carbon exchange from tundra. Nature 459: 556–559.<br />
Solomon SD, Qin M, Manning Z, Chen M, Marquis KB, Avery T, Tignor M,<br />
Miller HL, eds. 2007. Climate Change 2007: The Physical Science Basis.<br />
Cambridge <strong>University</strong> Press.<br />
Stammerjohn SE, Martinson DG, Smith RC, Iannuzzi RA. 2008. Sea ice<br />
in the western Antarctic Peninsula region: Spatio-temporal variability<br />
from ecological and climate change perspectives. Deep Sea Research<br />
55: 2041–2058.<br />
Starr G, Oberbauer SF. 2003. Photosynthesis <strong>of</strong> Arctic evergreens under<br />
snow: Implications for tundra ecosystem carbon balance. Ecology 84:<br />
1415–1420.<br />
Thompson JR, Wiek A, Swanson FJ, Carpenter SR, Fresco N, Hollingsworth<br />
T, Spies TA, Foster DR. 2012. Scenario studies as a synthetic and integrative<br />
research activity for long-term ecological research. BioScience<br />
62: 367–376.<br />
Trivelpiece WZ, Hinke JT, Miller AK, Reiss CS, Trivelpiece SG, Watters GM.<br />
2011. Variability in krill biomass links harvesting and climate warming<br />
to penguin population changes in Antarctica. Proceedings <strong>of</strong> the<br />
National Academy <strong>of</strong> Sciences 108: 7625–7628.<br />
Turetsky MR, Wieder RK, Vitt DH, Evans RJ, Scott KD. 2007. The disappearance<br />
<strong>of</strong> relict permafrost in boreal north America: Effects on peatland<br />
carbon storage and fluxes. Global Change Biology 13: 1922–1934.<br />
Vogel JG, Schuur EAG, Trucco C, Lee H. 2010. The carbon cycling response <strong>of</strong><br />
arctic tundra to permafrost thaw and thermokarst development. Journal<br />
<strong>of</strong> Geophysical Research 114 (Art. G4). doi:10.1029/2008JG000901<br />
Walker DA, Halfpenny JC, Walker MD, Wessman CA. 1993. Long-term<br />
studies <strong>of</strong> snow–vegetation interactions. BioScience 43: 287–301.<br />
Weimerskirch H, Inchausti P, Guinet C, Barbraud C. 2003. Trends in bird<br />
and seal populations as indicators <strong>of</strong> a system shift in the Southern<br />
Ocean. Antarctic Science 15: 249–256.<br />
Articles<br />
Westerling AL, Hidalgo HG, Cayan DR, Swetnam TW. 2006. Warming and<br />
earlier spring increase western U.S. forest wildfire activity. Science 313:<br />
940–943.<br />
Williams MW, Losleben M, Caine N, Greenland D. 1996. Changes in<br />
climate and hydrochemical responses in a high-elevation catchment<br />
in the Rocky Mountains, USA. Limnology and Oceanography 41:<br />
939–946.<br />
Williams MW, Knauf M, Cory R, Caine N, Liu F. 2007. Nitrate content and<br />
potential microbial signature <strong>of</strong> rock glacier outflow. Earth Surface<br />
Processes and Landforms 32: 1032–1047.<br />
Wood ME, Kelley JT, Belknap DF. 1989. Patterns <strong>of</strong> sediment accumulation<br />
in the tidal marshes <strong>of</strong> Maine. Estuaries 12: 237–246.<br />
Zamolodchikov D, Kotov A, Karelin D, Razzhivin V. 2008. Recent climate<br />
and active layer changes in northeast Russia: Regional output<br />
<strong>of</strong> Circumpolar Active Layer Monitoring (CALM). Pages 2021–2026<br />
in Kane DL, Hinkel KM, eds. Proceedings <strong>of</strong> the Ninth International<br />
Conference on Permafrost. Institute <strong>of</strong> Northern Engineering, <strong>University</strong><br />
<strong>of</strong> Alaska, Fairbanks.<br />
Andrew G. Fountain (andrew@pdx.edu) is a pr<strong>of</strong>essor in the Department <strong>of</strong><br />
Geology at Portland State <strong>University</strong> in Portland, Oregon. John L. Campbell is<br />
an ecologist at the US Department <strong>of</strong> Agriculture Forest Service in Durham, New<br />
Hampshire. Edward A. G. Schuur is an associate pr<strong>of</strong>essor in the Department<br />
<strong>of</strong> Biology at the <strong>University</strong> <strong>of</strong> Florida, Gainesville. Sharon E. Stammerjohn is<br />
an assistant pr<strong>of</strong>essor in the Department <strong>of</strong> Ocean Sciences at the <strong>University</strong><br />
<strong>of</strong> California, Santa Cruz. Mark W. Williams is a pr<strong>of</strong>essor in the Department<br />
<strong>of</strong> Geography at the <strong>University</strong> <strong>of</strong> Colorado, Boulder. Hugh W. Ducklow is a<br />
senior scientist and director <strong>of</strong> The Ecosystems Center at the Marine Biological<br />
Laboratory in Woods Hole, Massachusetts.<br />
www.biosciencemag.org April 2012 / Vol. 62 No. 4 • BioScience 415