TISCO Financial Group (TISC.BK/TISCO TB)*
TISCO Financial Group (TISC.BK/TISCO TB)*
TISCO Financial Group (TISC.BK/TISCO TB)*

Create successful ePaper yourself
Turn your PDF publications into a flip-book with our unique Google optimized e-Paper software.
DAILY Navigator Thailand Top Stock Ideas b<br />
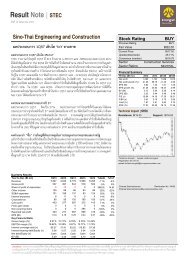
<strong><strong>TISC</strong>O</strong> <strong>Financial</strong> <strong>Group</strong> (<strong>TISC</strong>.<strong>BK</strong>/<strong><strong>TISC</strong>O</strong> <strong>TB</strong>)*<br />
The best among small banks<br />
Bt41.25 Outperform<br />
Maintained<br />
1 Thaninee Satirareungchai, CFA<br />
2 66.2658.8888 Ext. 8851<br />
3 thaninees@kgi.co.th<br />
�<br />
�<br />
�<br />
Riding the strong car sales<br />
Favorable interest rate trend<br />
Company update<br />
Maintain Outperform with a 2013 target price of Bt56.00<br />
Now one of our top buys<br />
We like <strong><strong>TISC</strong>O</strong> for having the largest exposure to new car lending<br />
(53%), its balance sheet mismatch that works to its benefit during the<br />
interest rate downtrend, and its strong financial position. With that,<br />
we believe the counter deserves to trade at a premium to its small<br />
bank peers. We rate <strong><strong>TISC</strong>O</strong> Outperform with a 2013 target price of<br />
Bt56.00, based on 2.0x 13PBV.<br />
Riding the strong car sales<br />
With its portfolio structure of 66% hire purchase (HP), 80% of which<br />
are new cars, <strong><strong>TISC</strong>O</strong> stands to be the key beneficiary of the strong<br />
pent-up new-car demand, and the government’s first car program (to<br />
end in December 2012) should add further support to the new-car<br />
loan demand. <strong><strong>TISC</strong>O</strong>’s loan growth has been outstanding at 17.2% in<br />
7M12, the highest in the industry, and the momentum should<br />
continue over the remainder of the year, potentially at an even<br />
stronger pace, thanks to the strong recovery in both auto production<br />
and sales.<br />
Favorable interest rate trend<br />
Structurally, small banks with large exposure to HP lending, including<br />
<strong><strong>TISC</strong>O</strong>, should benefit from the downward trend of interest rates<br />
thanks to their typical balance sheet structures and duration<br />
mismatches. The short duration of liabilities but long duration of<br />
assets makes those banks’ liabilities re-price faster than assets. This<br />
should help improve their NIM.<br />
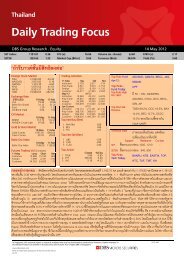
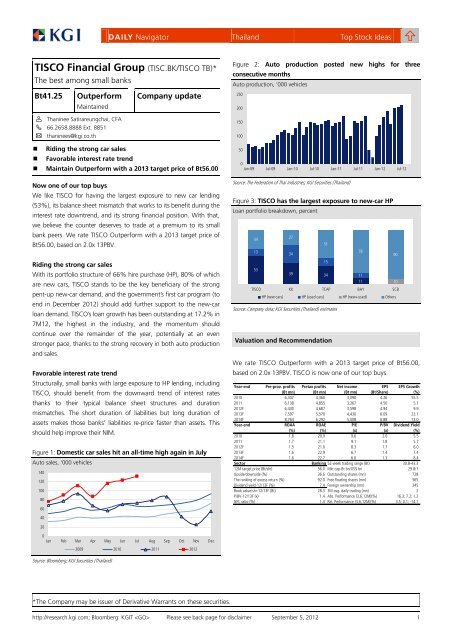
Figure 1: Domestic car sales hit an all-time high again in July<br />
Auto sales, ‘000 vehicles<br />
140<br />
120<br />
100<br />
80<br />
60<br />
40<br />
20<br />
0<br />
Jan Feb Mar Apr May Jun Jul Aug Sep Oct Nov Dec<br />
Source: Bloomberg; KGI Securities (Thailand)<br />
2009 2010 2011 2012<br />
*The Company may be issuer of Derivative Warrants on these securities.<br />
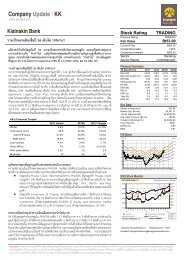
Figure 2: Auto production posted new highs for three<br />
consecutive months<br />
Auto production, ‘000 vehicles<br />
0<br />
Jan-09 Jul-09 Jan-10 Jul-10 Jan-11 Jul-11 Jan-12 Jul-12<br />
Source: The Federation of Thai Industries; KGI Securities (Thailand)<br />
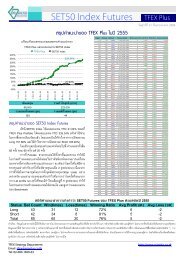
Figure 3: <strong><strong>TISC</strong>O</strong> has the largest exposure to new-car HP<br />
Loan portfolio breakdown, percent<br />
Source: Company data; KGI Securities (Thailand) estimates<br />
Valuation and Recommendation<br />
We rate <strong><strong>TISC</strong>O</strong> Outperform with a 2013 target price of Bt56.00,<br />
based on 2.0x 13PBV. <strong><strong>TISC</strong>O</strong> is now one of our top buys.<br />
http://research.kgi.com; Bloomberg: KGIT Please see back page for disclaimer September 5, 2012 1<br />
250<br />
200<br />
150<br />
100<br />
50<br />
34<br />
13<br />
53<br />
27<br />
34<br />
51<br />
15<br />
39 34<br />
<strong><strong>TISC</strong>O</strong> KK TCAP BAY SCB<br />
78<br />
11<br />
11<br />
HP (new cars) HP (used cars) HP (new+used) Others<br />
Year-end Pre-prov. profits Pretax profits Net income EPS EPS Growth<br />
(Bt mn) (Bt mn) (Bt mn) (Bt/Share) (%)<br />
2010 6,307 4,360 3,090 4.26 55.5<br />
2011 6,138 4,855 3,267 4.50 5.7<br />
2012F 6,430 4,687 3,598 4.94 9.9<br />
2013F 7,597 5,570 4,430 6.09 23.1<br />
2014F 8,764 6,292 5,008 6.88 13.0<br />
Year-end ROAA ROAE P/E P/BV Dividend Yield<br />
(%) (%) (x) (x) (%)<br />
2010 1.8 20.9 9.6 2.0 5.5<br />
2011 1.7 21.1 9.1 1.8 5.7<br />
2012F 1.5 21.0 8.3 1.7 6.0<br />
2013F 1.6 22.9 6.7 1.4 7.4<br />
2014F 1.6 22.7 6.0 1.3 8.4<br />
Sector Banking 52-week trading range (Bt) 30.8-43.3<br />
12M target price (Bt/shr) 56.0 Mkt cap-Bt bn/US$ bn 29.8/1<br />
Upside/downside (%) 36.6 Outstanding shares (mn) 728<br />
The ranking of excess return (%) 92.0 Free floating shares (mn) 565<br />
Dividend yield-12/13F (%) 7.4 Foreign ownership (mn) 345<br />
Book value/shr-12/13F (Bt) 28.3 3M avg. daily trading (mn) 2<br />
P/BV-12/13F (x) 1.4 Abs. Performance (3,6,12M)(%) 16.3; 7.2; 1.2<br />
NPL ratio (%) 1.4 Rel. Performance (3,6,12M)(%) 3.5; 0.1; -14.1<br />
90<br />
10
Balance Sheet<br />
As of 31 Dec (Bt mn) 2010 2011 2012F 2013F 2014F<br />
Total Assets 171,408 220,718 253,882 295,110 350,608<br />
Cash 903 903 814 559 1,920<br />
Interbank and Money Mkt Securities 12,545 30,722 16,698 10,645 8,175<br />
Securities (resale) 0 0 0 0 0<br />
Investments 6,481 3,706 4,354 4,354 4,354<br />
Loans & Accrued Int. - Net 145,704 180,852 226,279 273,744 330,351<br />
Properties Foreclosed 21 258 299 299 299<br />
Properties, Premises and Equipment 1,395 1,451 1,411 1,481 1,481<br />
Others 4,357 2,825 4,028 4,028 4,028<br />
Total Liabilities 156,550 204,406 235,787 274,358 327,037<br />
Deposits 48,533 37,979 89,774 105,013 125,827<br />
Interbank and Money Mkt Securities 10,843 14,479 14,083 16,473 19,738<br />
Account Payable 532 448 756 756 756<br />
REPO Securities 0 0 0 0 0<br />
Short-term Borrowings 54,044 54,044 54,044 54,044 54,044<br />
Debt issued and borrowings 90,776 145,397 123,364 144,305 172,906<br />
Others 5,866 6,104 7,809 7,809 7,809<br />
Shareholders' Equity 14,857 16,312 18,095 20,752 23,571<br />
CommonStock 7,279 7,279 7,279 7,279 7,279<br />
Capital Surplus 0 0 0 0 0<br />
Retained Earnings 7,578 9,032 10,816 13,473 16,292<br />
Preferred Stock 0 0 0 0 0<br />
Supplementary<br />
Non Performing Loans 2,654 2,612 3,532 4,212 5,023<br />
Source: Company data; KGI Securities (Thailand) estimates<br />
Profit & Loss<br />
DAILY Navigator Thailand Top Stock Ideas b<br />
Year to 31 Dec (Bt mn) 2010 2011 2012F 2013F 2014F<br />
Interest Income 9,433 12,369 14,944 17,941 21,464<br />
Interest Expense 2,572 5,461 7,977 9,303 11,018<br />
Net Interest Income (NII) 6,861 6,907 6,966 8,639 10,446<br />
Provision and Restructuring Loss 1,947 1,283 1,743 2,028 2,472<br />
NII after Provision 4,914 5,624 5,224 6,611 7,975<br />
Non-interest Income, net (non-NII) 3,964 4,163 5,252 5,696 6,090<br />
Fee income, net 2,708 2,852 3,515 3,937 4,330<br />
Investment Gains 201 34 52 56 56<br />
Investment Income 0 0 0 0 0<br />
Others 1,055 1,277 1,685 1,704 1,704<br />
Non-interest Expenses 4,518 4,932 5,789 6,737 7,772<br />
Profit before Tax 4,360 4,855 4,687 5,570 6,292<br />
Income Tax 1,256 1,562 1,063 1,114 1,258<br />
Minority Interest 14 26 26 26 26<br />
Net Profit 3,090 3,267 3,598 4,430 5,008<br />
EPS (Bt) 4.3 4.5 4.9 6.1 6.9<br />
Pre-provision Profit before Tax 6,307 6,138 6,430 7,597 8,764<br />
Pre-provision Profit after Tax 5,051 4,576 5,366 6,483 7,506<br />
Source: Company data; KGI Securities (Thailand) estimates<br />
*The Company may be issuer of Derivative Warrants on these securities.<br />
Du Pont Analysis<br />
Year to 31 Dec (%) 2010 2011 2012F 2013F 2014F<br />
Tax burden: net profit/pre-tax profit 0.7 0.7 0.8 0.8 0.8<br />
Extraordinaries: pre-tax profit/oper. profit (OP) 1.0 1.0 1.0 1.0 1.0<br />
Credit costs: OP/pre-provision OP (PPOP) 0.7 0.8 0.7 0.7 0.7<br />
Costs: PPOP/pre-prov. oper. rev. (PPOR) 0.6 0.5 0.5 0.5 0.5<br />
Non-int. income: PPOR/pre-provision NII 1.6 1.6 1.8 1.7 1.6<br />
Int. margin: pre-provision NII/asset 0.0 0.0 0.0 0.0 0.0<br />
Leverage: asset/equity 11.5 13.5 14.0 14.2 14.9<br />
Multiply the above to derive:<br />
ROE 20.8 20.0 19.9 21.3 21.2<br />
Source: Company data; KGI Securities (Thailand) estimates<br />
Key Assumptions & Ratios<br />
Year to 31 Dec<br />
Growth (YoY %)<br />
2010 2011 2012F 2013F 2014F<br />
Loans & Accrued Interests 27.6 24.1 25.1 21.0 20.7<br />
Deposits (14.6) (21.7) 136.4 17.0 19.8<br />
Total Assets 21.5 28.8 15.0 16.2 18.8<br />
Total Equity<br />
Growth (YoY %)<br />
18.7 9.8 10.9 14.7 13.6<br />
Net Interest Income 14.7 0.7 0.9 24.0 20.9<br />
Provision 25.8 (34.1) 35.8 16.4 21.9<br />
Non-interest Income 38.0 5.0 26.2 8.5 6.9<br />
Total Revenue (NII + Non-NII) 22.3 2.3 10.4 17.3 15.4<br />
NP 55.4 5.7 10.1 23.1 13.0<br />
EPS 55.5 5.7 9.9 23.1 13.0<br />
PPP before Tax 43.6 (2.7) 4.8 18.2 15.4<br />
PPP after Tax<br />
Profitability (%)<br />
7.1 (9.4) 17.3 20.8 15.8<br />
Yield on Int.-earning Assets 5.6 6.4 6.3 6.6 6.7<br />
Cost of Funds 1.7 3.1 3.7 3.8 3.8<br />
Net Interest Margin 4.06 3.56 2.95 3.16 3.24<br />
Fee Income/Total Revenue 25.5 25.8 28.9 27.6 26.3<br />
Fee Income/Total Assets 1.6 1.3 1.4 1.3 1.2<br />
Cost/Op Income Ratio 41.7 44.6 47.4 47.0 47.0<br />
ROAA 1.8 1.7 1.5 1.6 1.6<br />
ROAE<br />
Capital Adequacy (%)<br />
20.9 21.1 21.0 22.9 22.7<br />
Tier 1 Ratio 11.3 9.9 10.1 11.8 13.8<br />
Tier 2 Ratio 6.3 5.4 5.2 5.1 5.1<br />
Capital Adequacy Ratio 17.5 15.3 15.3 17.0 18.9<br />
Equity/Assets Ratio<br />
Asset Quality (%)<br />
8.7 7.4 7.1 7.0 6.7<br />
NPLs Ratio 1.8 1.4 1.4 1.4 1.4<br />
NPLs Coverage Ratio 156.8 169.3 146.9 149.1 150.9<br />
Provision/Loans Ratio<br />
Liquidity (%)<br />
2.8 2.4 2.2 2.2 2.2<br />
Loans/Deposits Ratio 308.8 487.8 257.8 266.7 268.6<br />
Loans/Deposits and Borrowings Ratio<br />
Per Share Data (Bt)<br />
107.6 101.0 108.6 112.3 113.1<br />
Pre-provision EPS (weighted avg.) 13.9 6.3 7.4 8.9 10.3<br />
Pre-provision EPS (fully diluted) 7.0 6.3 7.4 8.9 10.3<br />
EPS (weighted avg.) 8.5 4.5 4.9 6.1 6.9<br />
EPS (fully diluted) 4.3 4.5 4.9 6.1 6.9<br />
DPS 2.3 2.4 2.5 3.0 3.4<br />
BVPS 20.3 22.3 24.7 28.3 32.2<br />
Source: Company data; KGI Securities (Thailand) estimates<br />
http://research.kgi.com; Bloomberg: KGIT Please see back page for disclaimer September 5, 2012 2
DAILY Navigator Contact Information<br />
Thailand Research Name Abbr. Sector Coverage Ext. Email<br />
Itphong Saengtubtim IS Head of Research 8840 itphongs@kgi.co.th<br />
General line: Rakpong Chaisuparakul RC Strategist 8845 rakpongc@kgi.co.th<br />
66.2658.8888 Adisak Kammool AK Retail strategist 8843 adisakk@kgi.co.th<br />
Kingpai Koosakulnirund KK Food, hotel 8857 kingpaik@kgi.co.th<br />
Phatipak Navawatana PN Telecom, media, healthcare 8847 phatipakn@kgi.co.th<br />
Nat Panassutrakorn NP Construction material, contractor, consumer 8849 natp@kgi.co.th<br />
Pragrom Pathomboorn PP Economist 8846 pragromp@kgi.co.th<br />
Thaninee Satirareungchai, CFA TS Banking 8851 thaninees@kgi.co.th<br />
Pongpat Siripipat PS Derivatives 8844 pongpats@kgi.co.th<br />
Suchot Tirawannarat STi Automobile, soft commodity 8850 suchott@kgi.co.th<br />
Suchada Thiemthong ST Derivatives program trading 8852 suchadat@kgi.co.th<br />
Tareetip Wongsaengpaiboon TW Residential property, industrial estates 8855 tareetipw@kgi.co.th<br />
ASEAN Sales Name Abbr. Sector Coverage Ext. Email<br />
General line: Danny Komolrit DK Thailand sales 8090 dannyk@kgi.co.th<br />
66.2658.8888 Kannikar Pradiskesorn KP Thailand sales 8081 kannikarp@kgi.co.th<br />
Datenusorn Rungruang DR Thailand sales 8082 datenusornr@kgi.co.th<br />
The toll-free line for clients in HK and Singapore: 800.0800.5008<br />
*The Company may be issuer of Derivative Warrants on these securities.<br />
http://research.kgi.com; Bloomberg: KGIT Please see back page for disclaimer September 5, 2012 3
DAILY Navigator KGI Securities Information<br />
Locations China Taiwan<br />
Shanghai<br />
Room 1907-1909, Tower A, No. 100 Zynyi Road,<br />
Shanghai,PRC200051<br />
Shenzhen<br />
Room 24D1, 24/F, A Unit, Zhen Ye Building, 2014<br />
Bao’annan Road, Shenzhen<br />
PRC 518008<br />
Hong Kong Thailand<br />
41/F Central Plaza, 18 Harbour Road,<br />
Wanchai, Hong Kong<br />
Telephone 852.2878.6888<br />
Facsimile 852.2878.6800<br />
KGI's Ratings Rating Definition<br />
Disclaimer<br />
*The Company may be issuer of Derivative Warrants on these securities.<br />
KGI Securities<br />
700 Mingshui Road,<br />
Taipei, Taiwan<br />
Telephone 886.2.2181.8888<br />
Facsimile 886.2.8501.1691<br />
KGI Securities (Thailand) Plc.<br />
8th - 11th floors, Asia Centre Building<br />
173 South Sathorn Road, Bangkok 10120, Thailand<br />
Telephone 66.2658.8888<br />
Facsimile 66.2658.8014<br />
Outperform (OP) The stock's excess return* over the next twelve months is ranked in the top 40% of<br />
KGI's coverage universe in the related market (e.g. Thailand).<br />
Neutral (N) The stock's excess return* over the next twelve months is ranked in the range<br />
between the top 40% and the bottom 40% of KGI's coverage universe in the related<br />
market (e.g. Thailand).<br />
Underperform (U) The stock's excess return* over the next twelve months is ranked in the bottom 40%<br />
of KGI's coverage universe in the related market (e.g. Thailand).<br />
Not Rated (NR) The stock is not rated by KGI Securities.<br />
Restricted (R) KGI policy and/or applicable law regulations preclude certain types of<br />
communications, including an investment recommendation, during the course of<br />
KGI's engagement in an investment banking transaction and in certain other<br />
circumstances.<br />
* Excess return = 12M target price/current price-1<br />
Note When an analyst publishes a new report on a covered stock, we rank the stock's<br />
excess return with those of other stocks in KGI's coverage universe in the related<br />
market. We will assign a rating based on its ranking. If an analyst does not publish a<br />
new report on a covered stock, its rating will not be changed automatically.<br />
Source KGI Securities and its subsidiaries and affiliates.<br />
KGI Securities (Thailand) Plc. ( “The Company” ) disclaims all warranties with regards to all information contained<br />
herein. In no event shall the Company be liable for any direct, indirect or any damages whatsoever resulting from<br />
loss of income or profits, arising by utilization and reliance on the information herein. All information hereunder<br />
does not constitute a solicitation to buy or sell any securities but constitutes our sole judgment as of this date and<br />
are subject to change without notice.<br />
http://research.kgi.com; Bloomberg: KGIT Please see back page for disclaimer September 5, 2012 4