

Annexure - Directorate of Economics and Statistics
Annexure - Directorate of Economics and Statistics
Annexure - Directorate of Economics and Statistics

Create successful ePaper yourself
Turn your PDF publications into a flip-book with our unique Google optimized e-Paper software.
April 05/2011<br />
Crop/Crop-group/Item<br />
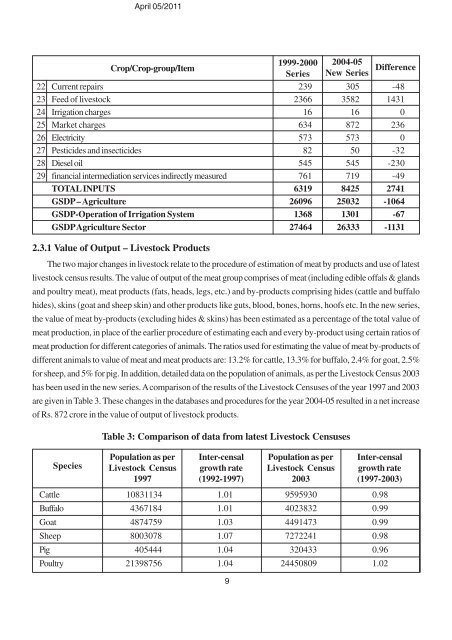
22 Current repairs 239 305 -48<br />
23 Feed <strong>of</strong> livestock 2366 3582 1431<br />
24 Irrigation charges 16 16 0<br />
25 Market charges 634 872 236<br />
26 Electricity 573 573 0<br />
27 Pesticides <strong>and</strong> insecticides 82 50 -32<br />
28 Diesel oil 545 545 -230<br />
29 financial intermediation services indirectly measured 761 719 -49<br />
TOTAL INPUTS 6319 8425 2741<br />
GSDP – Agriculture 26096 25032 -1064<br />
GSDP-Operation <strong>of</strong> Irrigation System 1368 1301 -67<br />
GSDP Agriculture Sector 27464 26333 -1131<br />
2.3.1 Value <strong>of</strong> Output – Livestock Products<br />
1999-2000<br />
Series<br />
2004-05<br />
New Series<br />
The two major changes in livestock relate to the procedure <strong>of</strong> estimation <strong>of</strong> meat by products <strong>and</strong> use <strong>of</strong> latest<br />
livestock census results. The value <strong>of</strong> output <strong>of</strong> the meat group comprises <strong>of</strong> meat (including edible <strong>of</strong>fals & gl<strong>and</strong>s<br />
<strong>and</strong> poultry meat), meat products (fats, heads, legs, etc.) <strong>and</strong> by-products comprising hides (cattle <strong>and</strong> buffalo<br />
hides), skins (goat <strong>and</strong> sheep skin) <strong>and</strong> other products like guts, blood, bones, horns, ho<strong>of</strong>s etc. In the new series,<br />
the value <strong>of</strong> meat by-products (excluding hides & skins) has been estimated as a percentage <strong>of</strong> the total value <strong>of</strong><br />
meat production, in place <strong>of</strong> the earlier procedure <strong>of</strong> estimating each <strong>and</strong> every by-product using certain ratios <strong>of</strong><br />
meat production for different categories <strong>of</strong> animals. The ratios used for estimating the value <strong>of</strong> meat by-products <strong>of</strong><br />
different animals to value <strong>of</strong> meat <strong>and</strong> meat products are: 13.2% for cattle, 13.3% for buffalo, 2.4% for goat, 2.5%<br />
for sheep, <strong>and</strong> 5% for pig. In addition, detailed data on the population <strong>of</strong> animals, as per the Livestock Census 2003<br />
has been used in the new series. A comparison <strong>of</strong> the results <strong>of</strong> the Livestock Censuses <strong>of</strong> the year 1997 <strong>and</strong> 2003<br />
are given in Table 3. These changes in the databases <strong>and</strong> procedures for the year 2004-05 resulted in a net increase<br />
<strong>of</strong> Rs. 872 crore in the value <strong>of</strong> output <strong>of</strong> livestock products.<br />
Species<br />
Table 3: Comparison <strong>of</strong> data from latest Livestock Censuses<br />
Population as per<br />
Livestock Census<br />
1997<br />
Inter-censal<br />
growth rate<br />
(1992-1997)<br />
Cattle 10831134 1.01 9595930 0.98<br />
Buffalo 4367184 1.01 4023832 0.99<br />
Goat 4874759 1.03 4491473 0.99<br />
Sheep 8003078 1.07 7272241 0.98<br />
Pig 405444 1.04 320433 0.96<br />
Poultry 21398756 1.04 24450809 1.02<br />
9<br />
Population as per<br />
Livestock Census<br />
2003<br />
Difference<br />
Inter-censal<br />
growth rate<br />
(1997-2003)