

Annexure - Directorate of Economics and Statistics
Annexure - Directorate of Economics and Statistics
Annexure - Directorate of Economics and Statistics

Create successful ePaper yourself
Turn your PDF publications into a flip-book with our unique Google optimized e-Paper software.
April 05/2011<br />
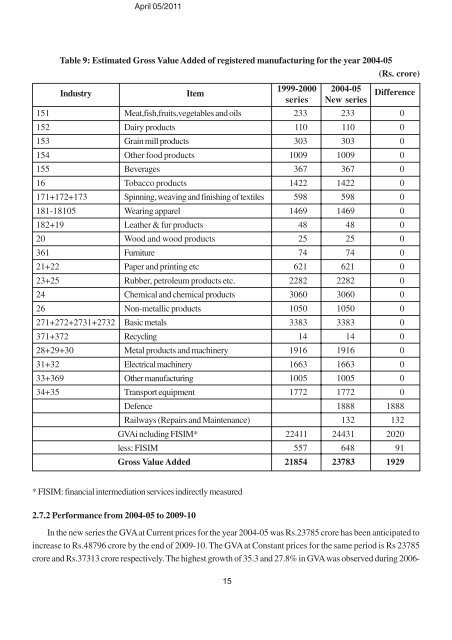
Table 9: Estimated Gross Value Added <strong>of</strong> registered manufacturing for the year 2004-05<br />
(Rs. crore)<br />
Industry Item<br />
151 Meat,fish,fruits,vegetables <strong>and</strong> oils 233 233 0<br />
152 Dairy products 110 110 0<br />
153 Grain mill products 303 303 0<br />
154 Other food products 1009 1009 0<br />
155 Beverages 367 367 0<br />
16 Tobacco products 1422 1422 0<br />
171+172+173 Spinning, weaving <strong>and</strong> finishing <strong>of</strong> textiles 598 598 0<br />
181-18105 Wearing apparel 1469 1469 0<br />
182+19 Leather & fur products 48 48 0<br />
20 Wood <strong>and</strong> wood products 25 25 0<br />
361 Furniture 74 74 0<br />
21+22 Paper <strong>and</strong> printing etc 621 621 0<br />
23+25 Rubber, petroleum products etc. 2282 2282 0<br />
24 Chemical <strong>and</strong> chemical products 3060 3060 0<br />
26 Non-metallic products 1050 1050 0<br />
271+272+2731+2732 Basic metals 3383 3383 0<br />
371+372 Recycling 14 14 0<br />
28+29+30 Metal products <strong>and</strong> machinery 1916 1916 0<br />
31+32 Electrical machinery 1663 1663 0<br />
33+369 Other manufacturing 1005 1005 0<br />
34+35 Transport equipment 1772 1772 0<br />
Defence 1888 1888<br />
Railways (Repairs <strong>and</strong> Maintenance) 132 132<br />
GVAi ncluding FISIM* 22411 24431 2020<br />
less: FISIM 557 648 91<br />
Gross Value Added 21854 23783 1929<br />
* FISIM: financial intermediation services indirectly measured<br />
2.7.2 Performance from 2004-05 to 2009-10<br />
1999-2000<br />
series<br />
2004-05<br />
New series Difference<br />
In the new series the GVA at Current prices for the year 2004-05 was Rs.23785 crore has been anticipated to<br />
increase to Rs.48796 crore by the end <strong>of</strong> 2009-10. The GVA at Constant prices for the same period is Rs 23785<br />
crore <strong>and</strong> Rs.37313 crore respectively. The highest growth <strong>of</strong> 35.3 <strong>and</strong> 27.8% in GVA was observed during 2006-<br />
15